
Abstract
The aim of this work is to study some physical and chemical properties of an organic semiconductor (OSc)/x%titanium dioxide (TiO2) heterosystem (with 0 ≤ x ≤ 20%) (OScs/x%TiO2). The OSc is obtained from pure curcumin and paracetamol as starting molecules. The synthesis methodology of the mixtures of OScs/x%TiO2 heterosystem involves a microwave-assisted multicomponent reaction using curcumin, paracetamol, and TiO2 as a heterogeneous solution. All mixtures were analyzed by Fourier-transform infrared spectroscopy, Raman spectroscopy, thermogravimetric analysis/differential thermal analysis, X-ray diffraction, ultraviolet–visible spectroscopy, and scanning electron microscopy. The results obtained show a new nanocomposite with interesting pharmaceutical, optical, electronic, and structural properties, which can be used in the fields of energy production, water purification, and air purification, as a biomaterial and for electronic applications.
Introduction
Organic semiconductors (OScs) derived from conjugated systems are the basis for the development of plastic electronics according to the discovery of A. J. Heeger et al. in 1977. 1
The electronic properties of OScs originate from an electron delocalization π on a large number of recurring units named monomers. The double bonds between the carbon atoms in the structure of the materials allow the formation of 3σ bonds in the 2s, 2px , 2py orbital. The unique 2pz orbital forming the filled bands π and unfilled bands π* is responsible for the conduction of electrons. This class of materials combines the electronic advantages of semiconductors with the chemical and mechanical benefits of organic compounds.
Curcumin-paracetamol (Cur-Para) is a blend of the two organic materials that are used and studied in the pharmaceutical and therapeutic fields. Curcumin has a wide range of pharmacological activities including effects such as antibacterial, 2 anti-inflammatory activities, 3 antiparasitic, 4 anti-oxidizing, 5 healing, 6 and anticancer. 7
The previous work, 8 considered the electrical and optical properties of a material, composed of a mixture of two organic products, curcumin and paracetamol, in a ratio of 50–50 wt% using 1H- and 13C-NMR (nuclear magnetic resonance), fourier-transform infrared spectroscopy (FTIR) techniques, ultraviolet–visible spectroscopy (UV-Vis), and impedance metric. 9-10 The results show that the material reveals good semiconductor behavior. These properties are analogous to the previously available organic and inorganic semiconductors. This may be considered as an ideal material to replace inorganic semiconductors in some applications, which have some inadequacies in recent years.
The titanium dioxide (TiO2) is a photocatalyst widely used in water purification technology 11- 15 due to their electronic structure, which is characterized by a filled valence band and an empty conduction band. However, the main deficiency for the practical applications of TiO2 is limited by its large bandgap (3.2 eV), meaning that it can only be active under the UV light irradiation. 16- 21
In the present research, the organic materials chosen are used already in the pharmaceutical and therapeutic fields. In addition, the combination of an inorganic semiconductor (TiO2) with the new OSc Cur-Para can be used to manufacture nanocomposites in a wide range of applications, specifically in the photocatalysis usage.
Experimental details
Materials
Titanium tetra isopropoxide (Ti(OC3H7)4) (Sigma Aldrich, purity ≥ 97.0%) was chosen as the Ti precursor, ethanol (C2H5OH) (SIALCHIM, purity ≥ 96%), methanol (CH3OH) (Sigma-Aldrich, purity ≥ 99.8%), curcumin (C21H20O8) (BIOCHEM, purity ≥ 99%), and paracetamol (C8H9NO2) (Alfa Aesar, purity ≥ 98%) were all chemical reagents of analytical grade and used without further purification. Figure 1 shows the structures of Ti(OC3H7)4, curcumin, and paracetamol.

The structures of Ti(OC3H7)4, Cur, and Para.
Powder preparation
TiO2 was prepared by dissolving Ti(OC3H7)4 in a CH3OH/C2H5OH solution with a molar ratio 1:1:10, respectively. 22 The resulting solution was kept at 75°C for 3 h and an appropriate amount of water was added dropwise to the still hot solution (75°C). After gelling, the sample was dried at 110°C for 24 h and then heated for 3 h, reaching a maximum temperature of 450°C with a heating rate of 3°C min−1.
The preparation of Cur/Para/TiO2 heterosystem was simply made by dissolving equal amounts (in weight) of curcumin and paracetamol in distilled water and then, TiO2 was added at different percentages (1%, 3%, 5%, 10%, and 20%). In order to have an even blend, the resulting mixture was put in an ultrasonic bath for 30 min. Finally, the resulting mixture was treated for 10 min in microwaves at a power of 300 W. 23 A schematic representation of the synthesis procedure was illustrated in Figure 2.
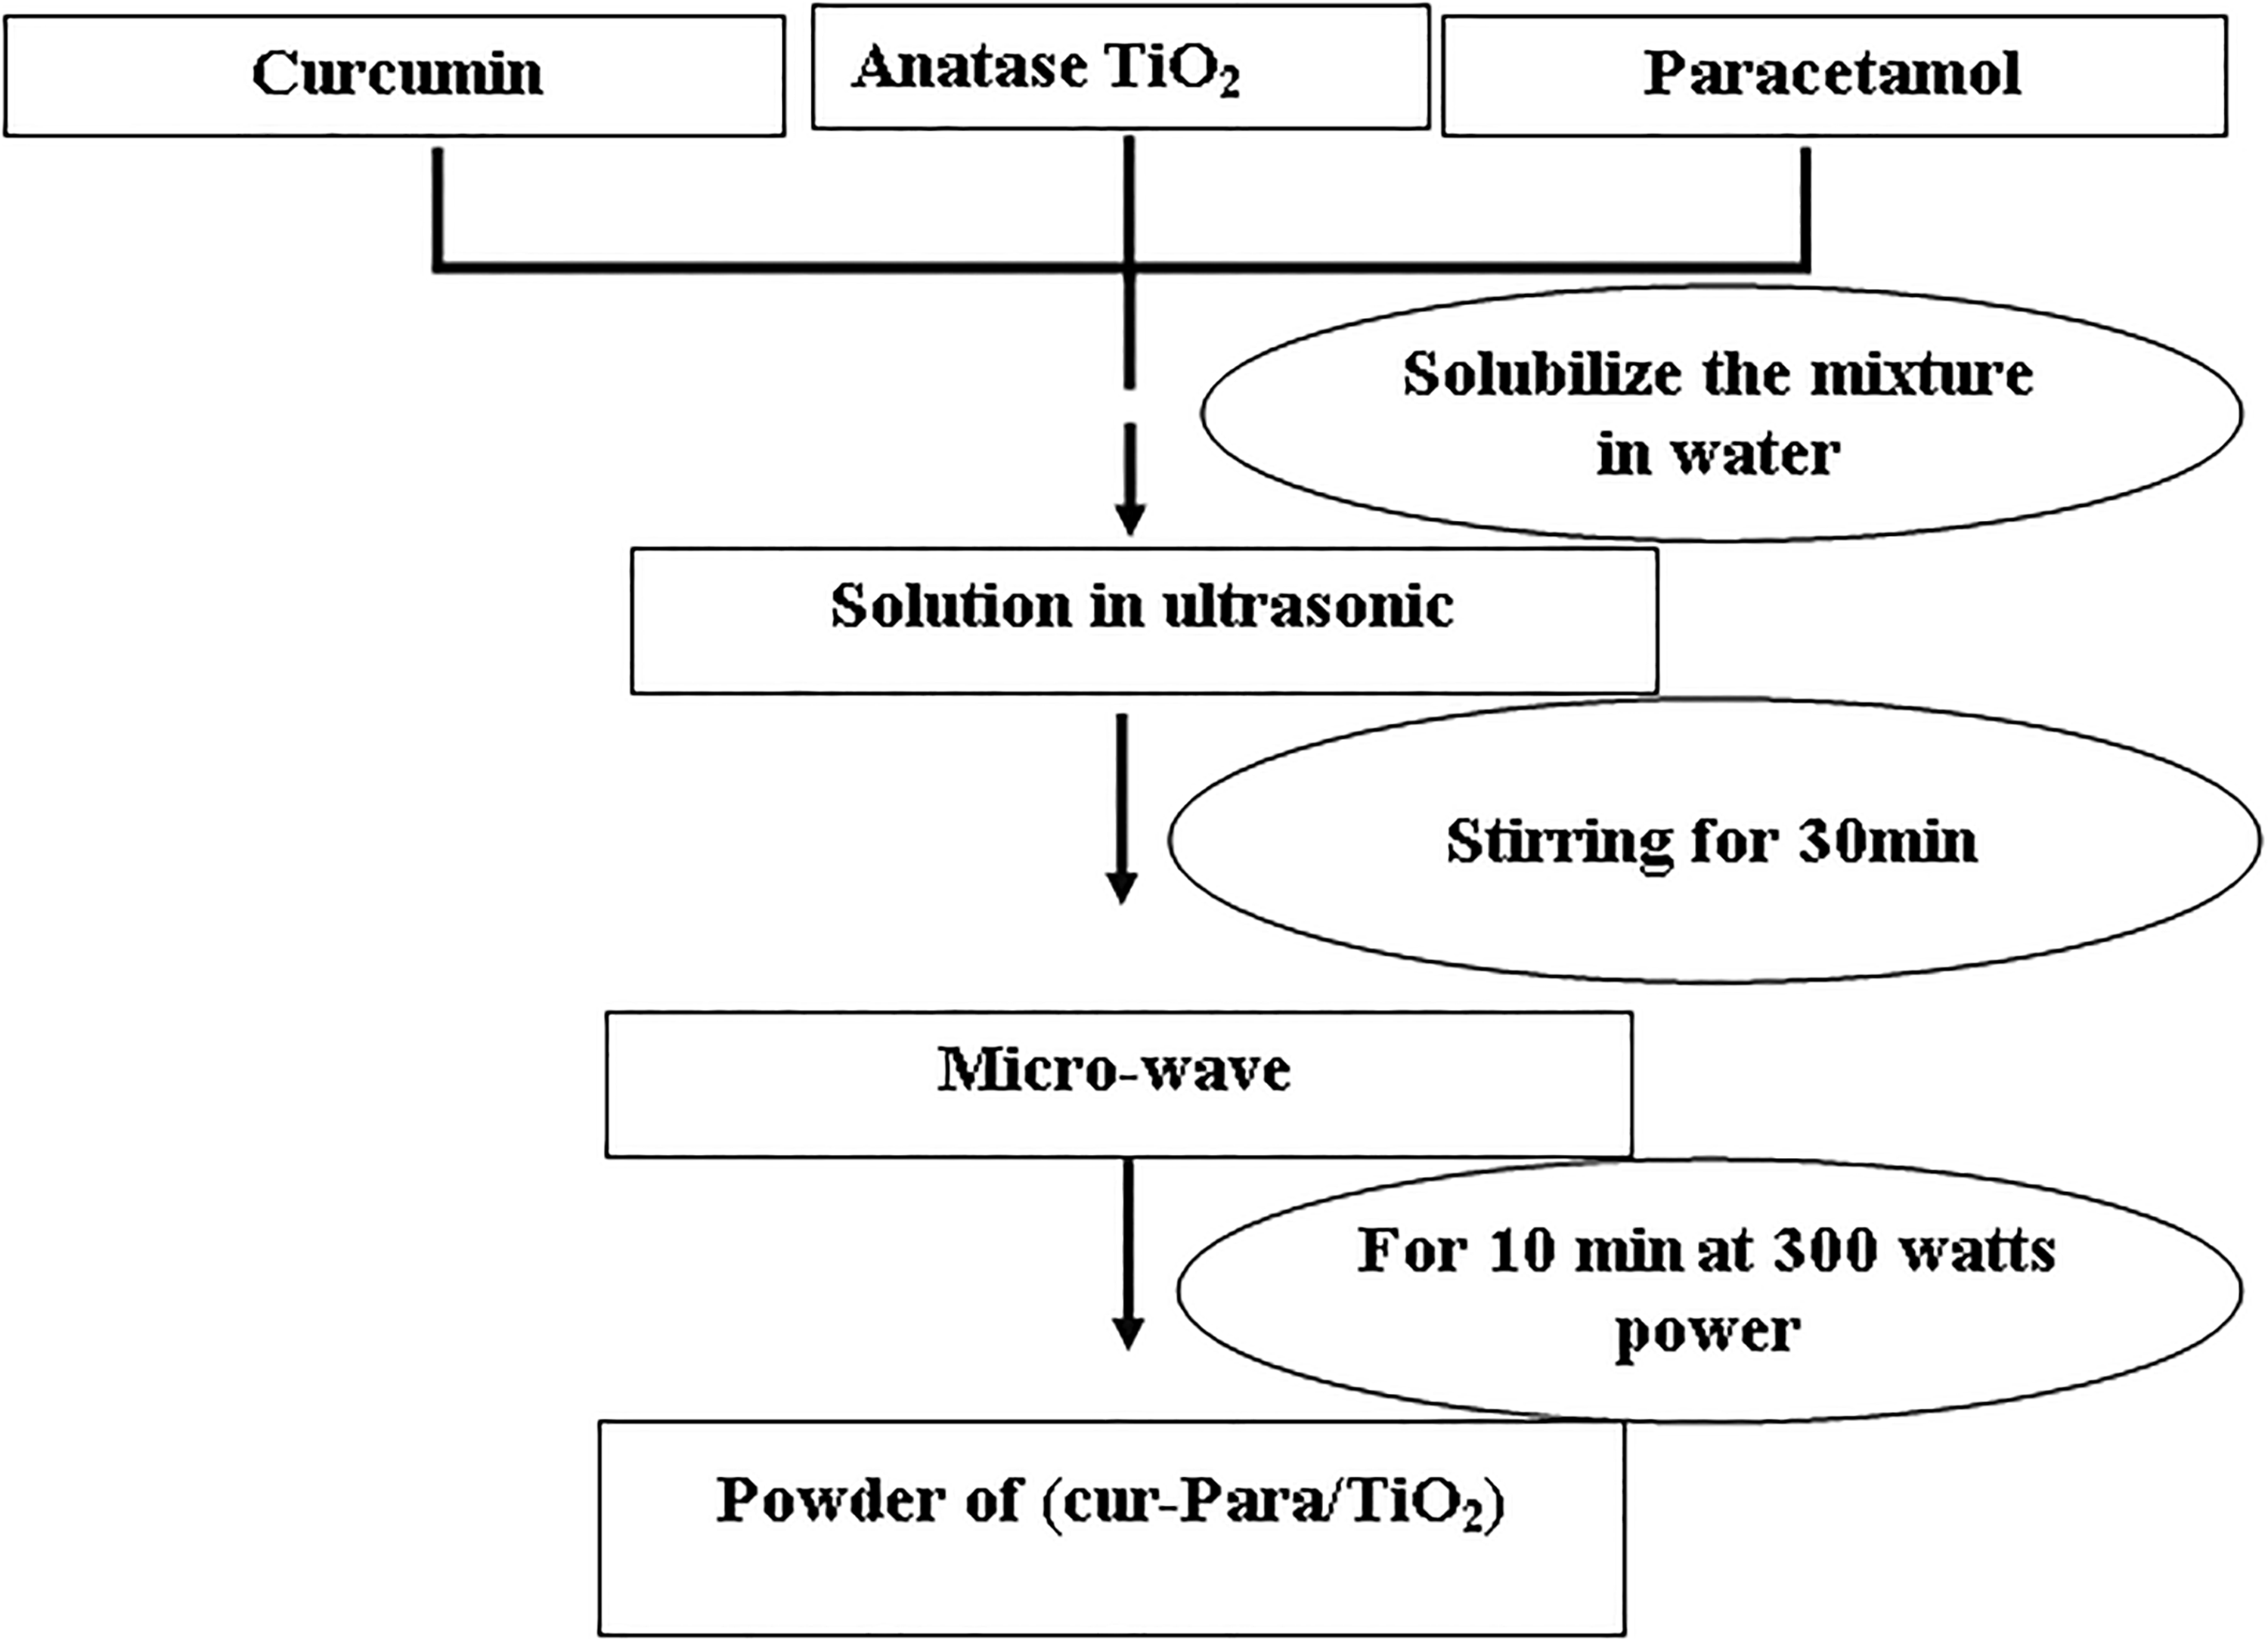
Schematic of synthesis procedure of Cur-Para/x%TiO2 (x = 1, 3, 5, 10, and 20) mixture.
Micro-Raman spectroscopy
Micro-Raman spectroscopy was used to identify the nature of the surface layer. Spectra were acquired using a He:Ne laser source with a wavelength of 632.81 nm. A 1009-magnification objective with long focal distance was used in order to focus on the surface of the as-received instruments, with no further preparation.
Differential scanning calorimetry
The phase transformation temperatures were determined by using differential scanning calorimetry (Q2000; TA Instruments, New Castle, Delaware, USA). A temperature program was carried out, consisting of two heating and cooling ramps with a heating rate of 10°C min−1 under nitrogen atmosphere. For the heating process, the samples were heated from room temperature to 900°C.
FTIR spectroscopy
The FTIR spectra were recorded with an FTIR Nicolet (Markham, Ontario, Canada) Magna 760 spectrum equipment in the 400–4000 cm−1 wavelength range. The powders have been collected as a thin uniform film on top of a sticky tape and the substrate background has been obtained as a blank spectrum and automatically subtracted by the FTIR software from the spectra for each sample under analysis. Every measurement has been acquired in transmission mode. This sample setup has been used in order to avoid any mixing with other compounds (such as potassium bromide).
UV-Vis spectroscopy
The UV-Vis absorption spectra of the powder were recorded with a Jasco (Mary's Court Easton, MD, USA) V-570 UV-Vis/NIR spectrophotometer in the 300–700 nm wavelength range.
Similar to the FTIR measurements, the powders have been collected as a thin uniform substrate film on top of a sticky tape and the background spectrum was also subtracted from each measured spectra. Every measurement has been obtained in the absorption mode. This sample setup has been used to avoid the dissolution of the samples into solvents in order to preserve as much as possible the environment around compounds.
X-ray diffraction (XRD) spectroscopy
The structural characterization of Cur-Para/anatase TiO2 samples was performed by the X-ray diffraction (XRD) technique. The structural changes were analyzed using copper K-alpha (Cu Kα) radiation of wavelength λ = 1.5406 Å, produced by Bruker AXS D8 focus advance X-ray diffractometer (Rigaku, Japan, Tokyo) with “Ni-filtered.” The scans were taken in the 2θ range from 10° to 80° with a scanning speed and step size of 1° mm−1 and 0.01°, respectively.
Scanning electron microscopy
High-resolution micrographs were obtained using a field emission scanning electron microscope (SEM; NovaNano SEM 450; FEI, Eindhoven, the Netherlands), equipped with a Si-drift detector for energy-dispersive X-ray spectrometry (Quantax-200; Bruker, Berlin, Germany) to obtain qualitative and semiquantitative information on chemical composition. New and used samples were cleaned ultrasonically in acetone and observed without any metallization, under low voltage conditions (3–8 keV) to achieve maximum surface sensitivity.
Results and discussion
In Figure 3, the Raman spectra of the organic–inorganic heterosystem mixtures: Cur-Para/1%TiO2, Cur-Para/3%TiO2, Cur-Para/5%TiO2, Cur-Para/10%TiO2, and Cur-Para/20%TiO2 have been reported in comparison with the Raman spectra of pure Cur-Para and anatase TiO2 samples. Different intensities and broadening of peaks have been observed and discussed in the following section.
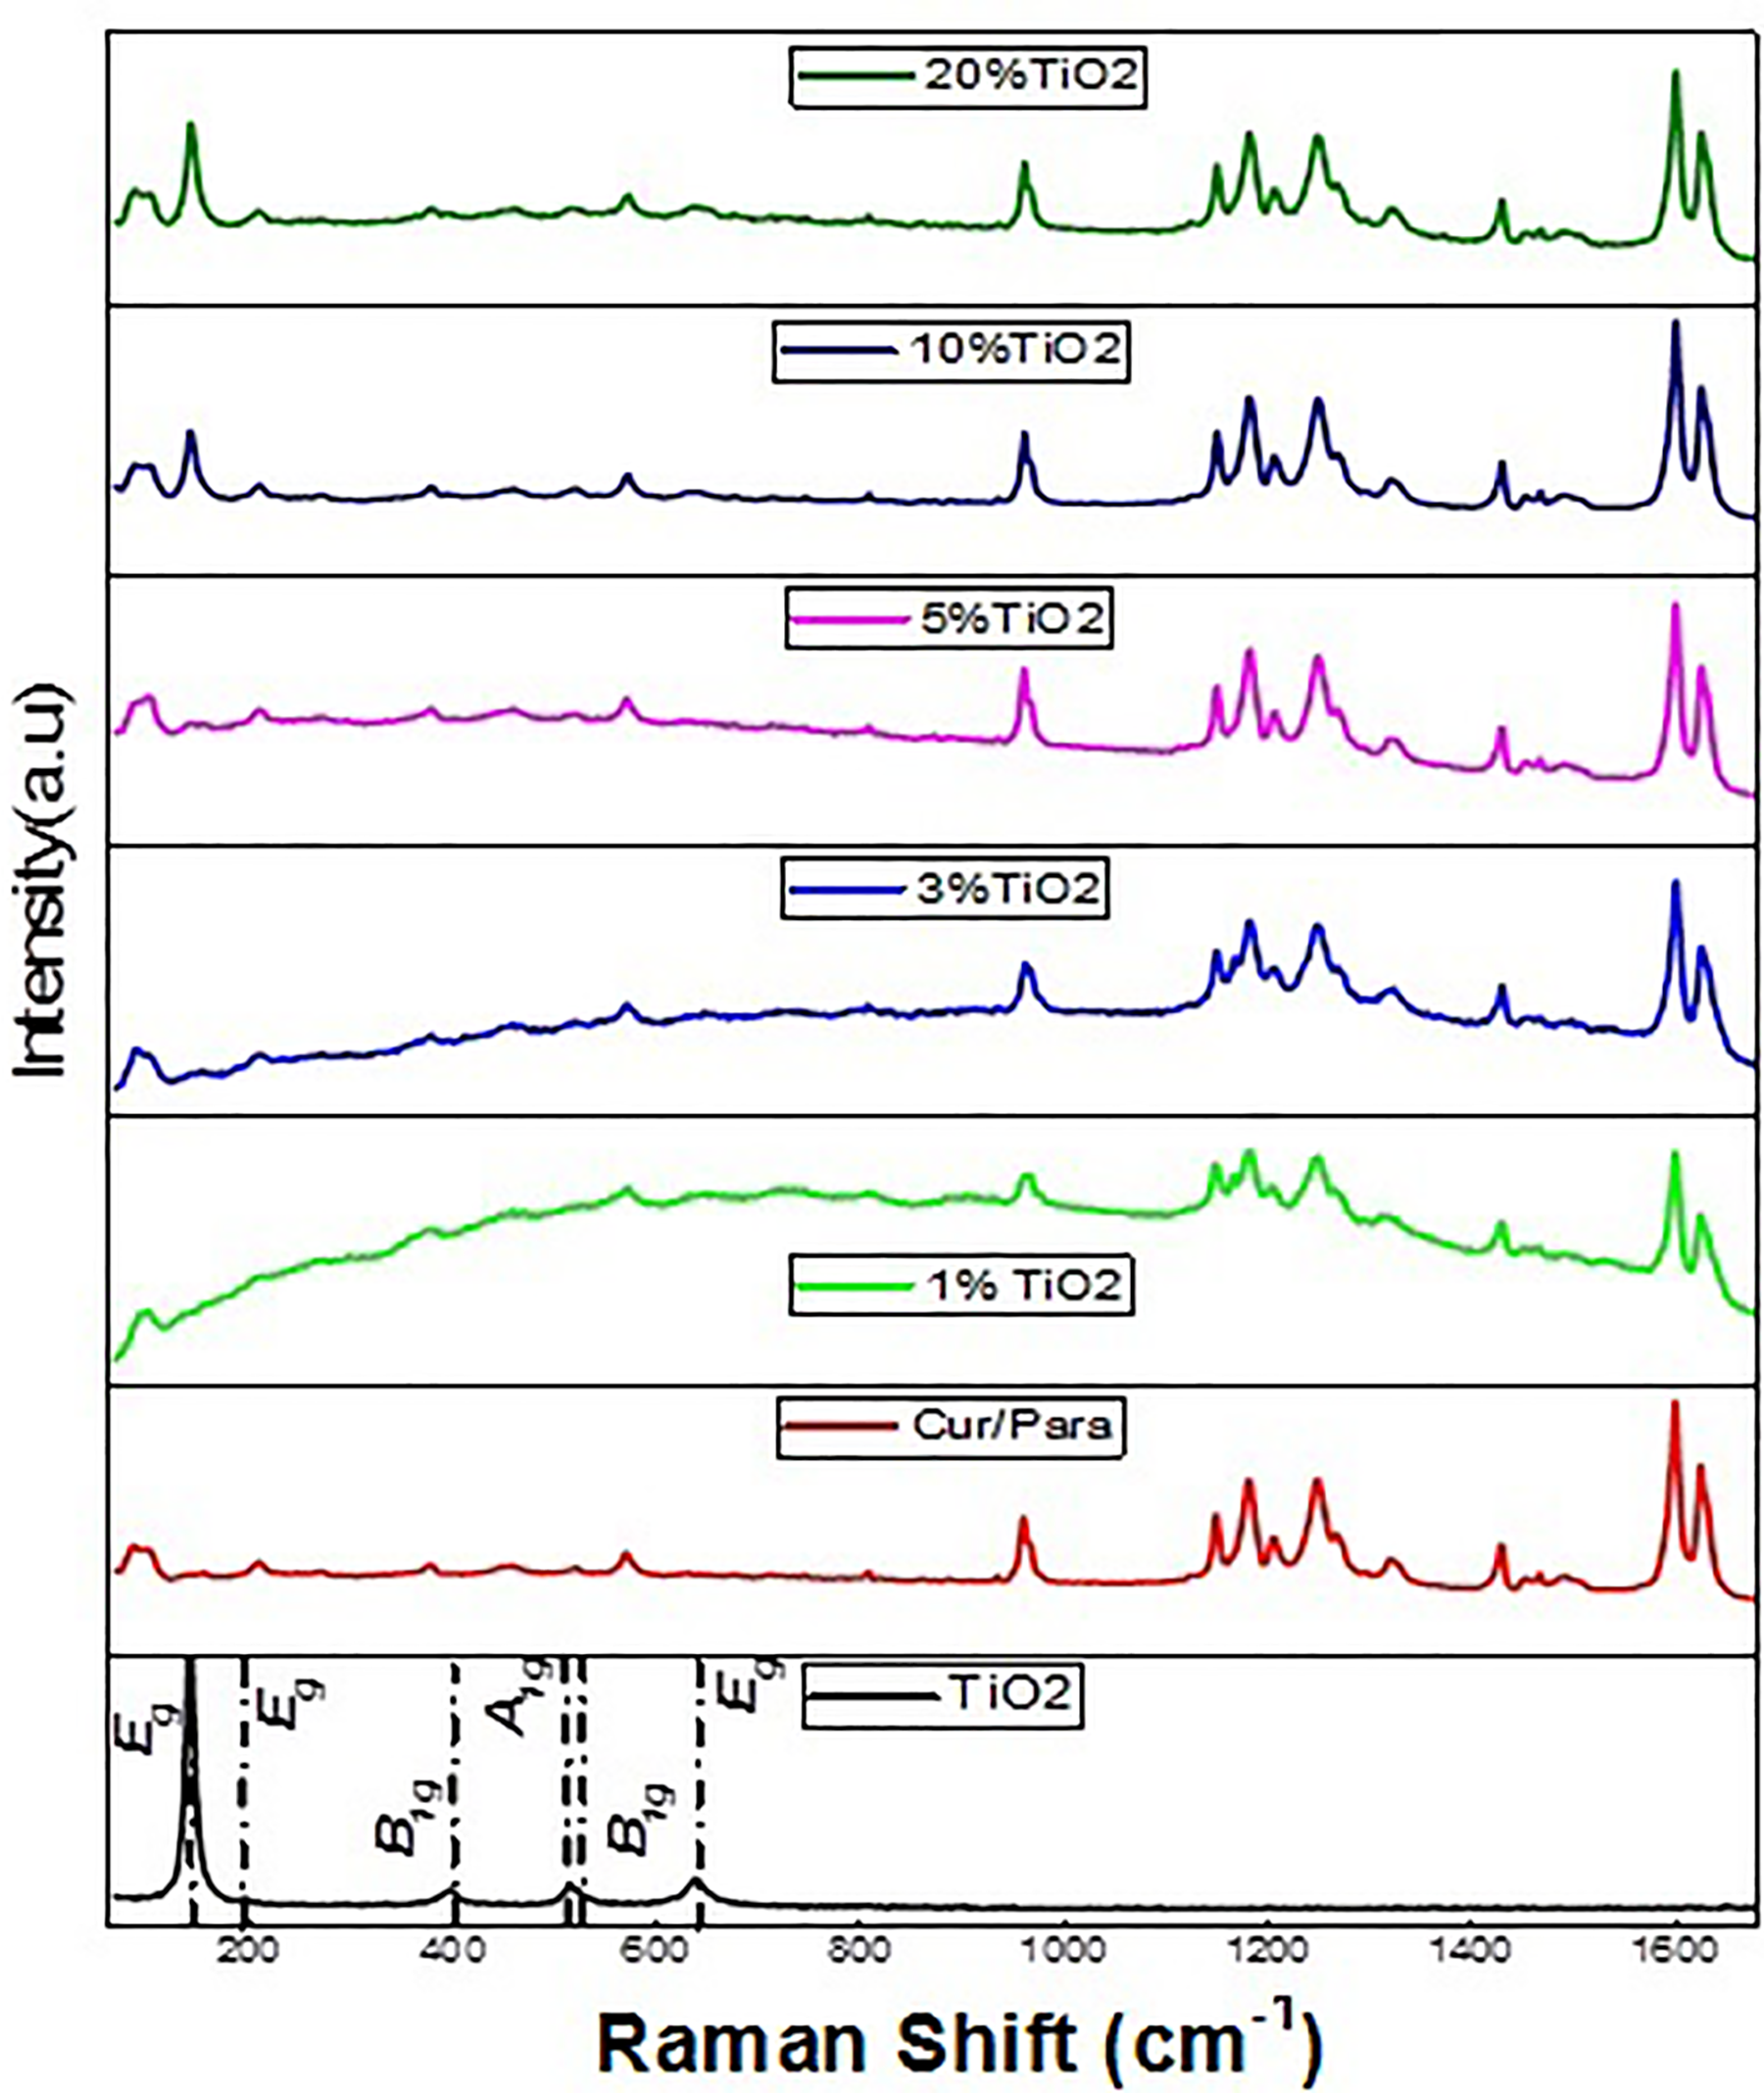
The Raman spectrum of Cur-Para/x%TiO2 (x = 1, 3, 5, 10, and 20) mixture.
The crystalline phases of Cur-Para/TiO2 samples can be clearly identified by Raman spectroscopy (Figure 3). The structure of the anatase is characterized by six active Raman modes in the vibrational spectrum, which are centered as: 144, 197.26, 640 (Eg ), 400, 520 (B 1g ), and 513 cm−1 (A 1g ). 24 These modes appear clearly in the mixtures with 10% and 20% in TiO2 and less weakly in the mixture with 5% in TiO2.
According to the Raman behavior of the Cur-Para mixtures, it has been found that the peaks at 1626 and 1601 cm−1 of curcumin are due to carbonyl C=O and aromatic C=C double bonds. 25,26 While the 1432 cm−1 band is due to phenol C–O bond 25,26 , the band at 1326 cm−1 is attributed to the band III amide (C–N stretch/C–N–phenyl stretch/C–N–H band). 27 Moreover, the keto-enol form of curcumin gives a quite large band from 1250 cm−1 to about 1211 cm−1. 28 Finally, the following lines found at 1182 and 1150 cm−1 of curcumin correspond to the δ-CH3 and ν-O–CH3 modes, respectively, 29 and the methoxy groups (R–OCH3) stretching mode is found at 573 cm−1. 30
From the analysis of Raman spectra of pure Cur-Para and TiO2 anatase samples, together with the Cur-Para/x%TiO2 samples that have been synthesized, it can be concluded that the structure mixture (Cur-Para/20%TiO2) is the one that well combines the spectral characteristics of both the organic and inorganic moieties of the studied new heterosystem.
Figure 4 shows the thermogravimetric analysis (TGA) curves of samples (TiO2, Cur-Para, Cur-Para/1%TiO2, Cur-Para/3%TiO2, Cur-Para/5%TiO2, Cur-Para/10%TiO2, and Cur-Para/20%TiO2).
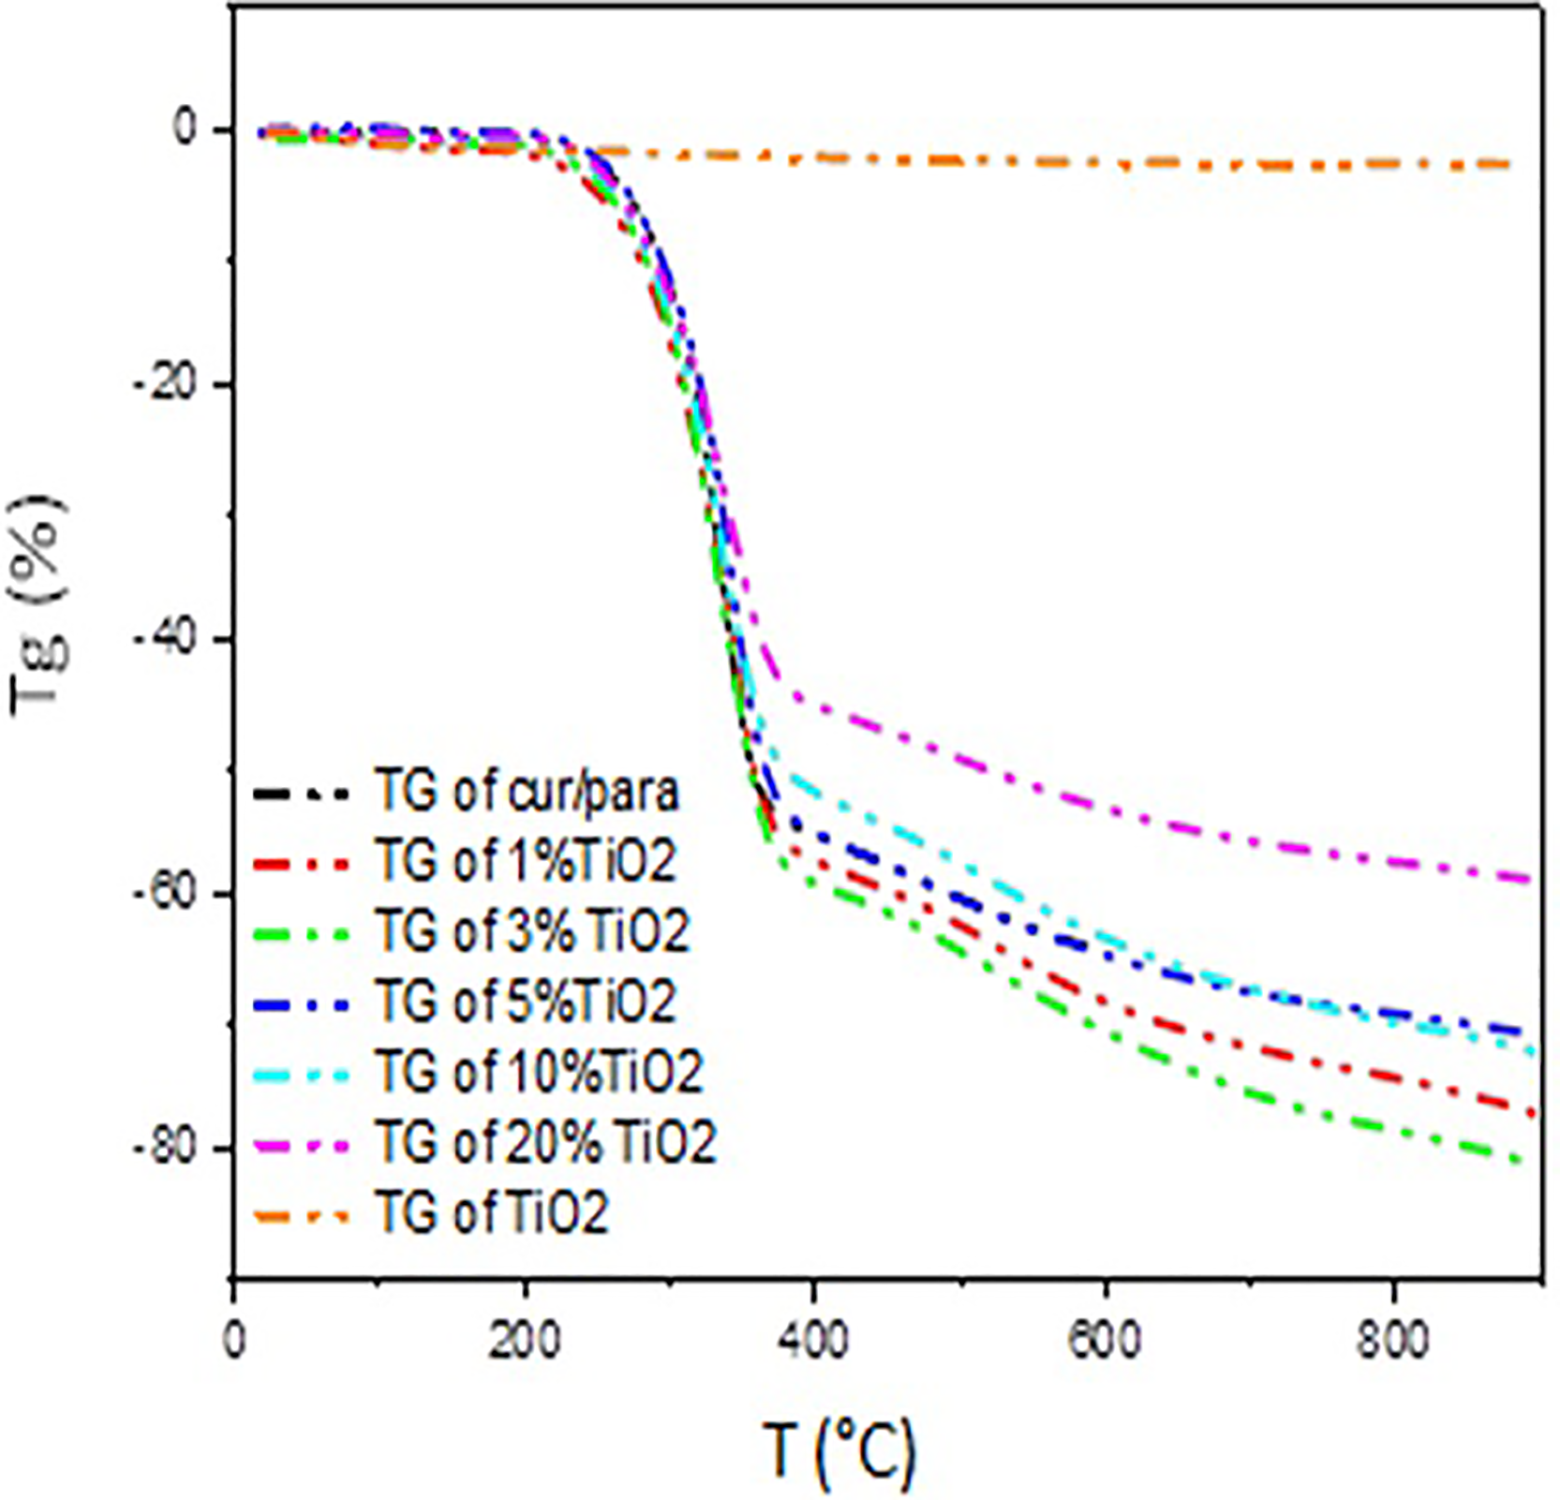
TGA curves of Cur-Para/x%TiO2 (x = 1, 3, 5, 10, and 20) mixture.
TGA curves have shown two weight loss steps between 207–377°C and 377–900°C related to the following mixtures: Cur-Para and Cur-Para/x%TiO2 with x = 1, 3, 5, 10, and 20.
The first step represents a degradation of the weights with percentages (53%, 56%, 58%, 53%, 50%, 44%) that correspond to the exothermic peaks. 31 The second step of low mass loss is attributed to ashes.
Figure 5 shows the endothermic peaks in the differential thermal analysis (DTA) curves, which determine the melting temperature of the mixtures (Table 1). These results suggest that increasing the concentration of TiO2 in the supramolecular Cur-Para increases the thermal stability.

DTA of Cur-Para/x%TiO2 (x = 1, 3, 5, 10, and 20) mixture.
The melting temperature of Cur-Para/x%TiO2 (x = 1, 3, 5, 10, and 20) mixture.

Cur: curcumin; Para: paracetamol; TiO2: titanium dioxide.
This confirms that there is no chemical modification or degradation of (Cur/Para) molecules during the formation of the organic-based nanocomposites, the FTIR spectra are recorded for Cur-Para and Cur-Para/TiO2 mixtures. Figure 6 and Table 2 group the values of the important peaks. The spectra of FTIR show the irregular peaks of curcumin and paracetamol molecules. Indeed, it shows that the broad band at 3511 cm−1 is due to vibrations of the free hydroxyl-group of phenol (Ar–OH), 32 while the bands at 3324 and 3158 cm−1 are assigned as stretching vibration mode of N–H and O–H concerning paracetamol. The peak at 2794 cm−1 is attributed to the stretching vibration mode of the C=O and O–H carboxylic acid.

The FTIR spectrums of Cur-Para/x%TiO2 (x = 1, 3, 5, 10, and 20) mixture.
The values of the important peaks from FTIR analysis.

FTIR: Fourier-transform infrared spectroscopy.
The contribution of the aromatic C–C bonds can be observed at 1609, 1512, and 1027 cm−1. 33 The bands at 959–500 cm−1 are attributed to the bending vibrations of the C–H bond of alkene groups (RCH=CH2). 34
A broad absorption peak in the range of 700–400 cm−1 is attributed to Ti–O stretching and Ti–O–Ti bridging stretching modes 35 as emphasized by the black dotted box in Figure 6.
These results suggest that the Cur-Para/20%TiO2 mixture has the best spectral overlapping among the characteristic of infrared (IR) peaks related to the chemical structures of curcumin, paracetamol, and TiO2 molecules.
Figure 7 shows the typical absorbance spectra recorded for the solutions of Cur-Para due to the different percentages of added TiO2 (0%, 1%, 3%, 5%, 10%, 20%, and 100%).

The UV-Vis spectrums of Cur-Para/x%TiO2 (x = 1, 3, 5, 10, and 20) mixture.
Subsequently, the curves related to the OScs mixtures show a steep jump in the visible region of the spectra except with TiO2. This characteristic jump concerning all the OScs is due principally to the fundamental absorption of light in the visible range around 500–515 nm assigned to the band π → π* of the OSc. In contrast, the TiO2 molecule is transparent at this wavelength range. As mentioned from literature, 36 the absorbance variation in this region of the spectral window is exploited to determine the optical bandgap; this value can be estimated according to equation (1).
The example represents the optical bandgap expressed in eV and λ a.e that denotes the absorption edge wavelength expressed in nm, obtained from the offset wavelength derived from the low energy absorption band as schematically represented in Figure 7. 37

where Eg is the bandgap energy, h is the Planck’s constant, f is the frequency, c is the light velocity (ms−1), and λ a.e. is the wavelength.
Table 3 and Figure 8 illustrate the optical energy gap values as a function of the amount of TiO2 present in the mixture. According to this curve, the optical gap varies under a small range of values due to the fact that the optical gap still remains around 2.4 eV independently from the TiO2 percentage present in the mixture.
The values of the optical gap from UV-Vis analysis of Cur-Para/x%TiO2 (x = 1, 3, 5, 10, and 20) mixture.

UV-Vis: ultraviolet–visible spectroscopy; Cur: curcumin; Para: paracetamol; TiO2: titanium dioxide.

The variation energy gap with x% of TiO2.
This result suggests that the presence of TiO2 in Cur-Para with a small percentage (1% and 3%) makes a small shift in the obtained supramolecular structure of the resulting mixture. This is a change in the intramolecular and intermolecular coupling among the reactants, which will induce changes into the energy gap among high occupied molecular orbital (HOMO) and lowest unoccupied molecular orbital (LUMO) bands assimilated, respectively, to the valance and the conduction bands of the resulting heterogeneous system.
The stability of the optical gap in the mixtures with percentages of 5%, 10%, and 20% of TiO2 has also the advantage of possessing optical properties of Cur/Para and thermal and structural properties of the nanocomposite (Cur-Para/x%TiO2).
The structural characterization of the powders has been performed using the Rigaku miniflex 600 X-ray diffractometer with Cu Kα radiation in the 2θ range of 10–70°.
The data reported in Figure 9 compare the XRD patterns of Cur-Para and Cur-Para/x%TiO2 mixtures. The Cur-Para exists in a crystalline state.

XRD patterns of Cur-Para/x%TiO2 (x = 1, 3, 5, 10, and 20) mixture.
All the characteristic peaks of Cur-Para pure sample have been observed as well in Cur-Para/x%TiO2 mixtures, but they are characterized by various peak widths and intensities. In particular, the increase of the full width at half maximum of each peak indicates that the size of the particle under analysis decreases. The crystallinity of the samples is determined from the peak intensity. Thus, it is suggested that the increasing crystallinity of the samples is a function of the percentage decrease of TiO2 in Cur-Para, while the particle size decreases with decreasing TiO2 percentage in the mixtures.
The peak observed at 2θ = 25.39° in the pure anatase phase of TiO2 appears as well in the mixtures with 5%, 10%, and 20% of TiO2 but with different intensity.
The SEM images, in Figure 10, show the morphology of the prepared mixtures of Cur-Para/x%TiO2 in their supramolecular arrangements.

The SEM of pure Cur-Para (a) and Cur-Para/20%TiO2 (b).
Figure 10(a) shows the Cur-Para molecular system in its supramolecular arrangement in combination with paracetamol molecules, which are characterized by different sizes stucking on a platform of curcumin. On the other side, Figure 10(b) shows that the size and morphology of the curcumin and paracetamol molecules remain unchanged if compared with the pure Cur-Para system, but it can be observed that the TiO2 particles are adsorbed on the surface of the Cur-Para system. Indeed, the TiO2 particles, of nanometric size, are much smaller than the size of Cur-Para molecules. These experimental indications can confirm quite well that the morphology of the heterogeneous Cur-Para/x%TiO2 mixture does not differ from that of pure Cur-Para system, and the TiO2 nanoparticles are well distributed and glued on the surface of OSc system.
Conclusion
Cur-Para/x%TiO2 nanocomposite was prepared by a simple chemical synthesis using a microwave. The Raman and FTIR analyses indicate that nanocomposite can basically be mixed for high percentages.
The appearance of peaks indicates that a strong interaction exists at the interface of Cur-Para and nano-TiO2. The XRD spectra illustrate the effect of TiO2 concentration in nanocomposite on the grain size and the crystallinity.
The results from the TGA and DTA show that the Cur-Para/20%TiO2 material is the best composite due to their high thermal stability.
Finally, according to the optical analysis, the results confirm that nanocomposites are semiconductors based on their optical gap.
Footnotes
Acknowledgements
Many thanks to Prof Belarbi El Habib, director of Synthesis and Catalysis Laboratory University of Tiaret, for the kind support in the performance of the experimental tests. Many thanks to Mrs Elena Fabbri—technical staff at the Department of Engineering “Enzo Ferrari” University of Modena and Reggio Emilia, Italy—for her kind support in the performance of the experimental tests.
Declaration of conflicting interests
The author(s) declared no potential conflicts of interest with respect to the research, authorship, and/or publication of this article.
Funding
The author(s) received no financial support for the research, authorship, and/or publication of this article.