
Abstract
Sensor array with pattern recognition method is often used for gas detection and classification. Processing time and accuracy have become matters of widespread concern in using data analysis with semiconductor gas sensor array for volatile organic compound gas mixture classification. In this paper, a sensor array consisting of four nanostructured semiconductor gas sensors was used to generate the response signal. Three main categories of gas mixtures, including single-component gas, binary-component gas mixtures, and four-component gas mixtures, are tested. To shorten the training time, extreme learning machine (ELM) is introduced to classify the category of gas mixtures and the concentration level (low, middle, and high) of formaldehyde in the gas mixtures. Our results demonstrate that, compared to traditional neural networks and support vector machines (SVM), ELM networks can achieve 204 and 817 times faster training speed. As for classification accuracy, ELM networks can achieve comparable results with SVM.
Keywords
1. Introduction
Some volatile organic compounds (VOCs), including formaldehyde (HCHO), acetone, toluene, ethanol, 2-propanol (isopropyl alcohol), and limonene, are emitted as gases from certain solids or liquids. Some VOCs have adversely impact people's health [1, 2]. Among various harmful VOC gases, HCHO is recognized as one of the carcinogens and an important air pollutant [3]. Traditional techniques to identify HCHO are based on gas chromatography, mass spectroscopy, FTIR analysis, electrochemistry sensors, and semiconductor sensors. Semiconductor gas sensors possess some advantages, such as cheap to make and easy to use, and can convert the gas concentration directly to electrical signals. However, one of the disadvantages of semiconductor sensors is poor selectivity.
The electronic nose is a relatively convenient way to solve the problem of poor selectivity and recognize gas mixtures [4-6] and has a wide range of applications, such as detecting explosive gas, controlling production processes, and monitoring environmental pollutions [7, 8]. The electronic nose is mainly composed of two parts. One is a semiconductor gas sensor array for getting signals. Another one deals with pattern recognition methods for converting signals into conclusion, including gas classification and/or concentration estimation. In many cases, the relationships between the sensor signals and conclusion are nonlinear correlative. Therefore, pattern recognition plays a crucial role in detecting the characteristics of the sensor signals. Many existing pattern recognition methods are used for gas detection and classification [9-11]. Artificial neural networks (ANN) and support vector machines (SVM) are most commonly used [12-14] in pattern recognition methods.
Extreme learning machine (ELM) is a single-hidden-layer feedforward neural network with a fast novel learning algorithm. In ELM learning algorithm, the input weights of linking the input layer to the hidden layer and hidden biases are randomly chosen. ELM parameters do not need to be manually tuned and ELM only needs to predefine the network architecture [15]. Target gas and interfering gases always exist at the same time in gas detection and classification application. Accuracy has become a matter of widespread concern in this application. In this report, a sensor array consisting of four different nanostructured gas sensors with pattern recognition methods were used for gas detection and classification. Three methods were used to classify the category of gas mixtures and the concentration level (low, middle, and high) of HCHO in the gas mixtures. Our experimental results showed that, compared to traditional neural networks (BP) and the SVM method, ELM has an extremely fast training speed in classifying VOC gas mixtures. In addition, a sensor array with ELM can successfully classify the category of gas mixtures and the concentration level of HCHO under different interfering gas conditions.
2. Experiments
2.1 Sensor array and gas mixture preparation
The sensor array consists of four different semiconductor gas sensors. Table 1 gives the details of the sensors in the sensor array. Four sensors are located on the vertices of a square test board, and the distance between two sensors is 0.8 cm. The principle in the choice of sensors is that each sensor has responses to four kinds of gas, but the response sensitivity is different. In this report, four sensors are all sensitive to HCHO, toluene, ethanol, and acetone. Sensors #1 and #4 are commercial SnO2 gas sensors with stable performance. The other two are fabricated in our laboratory. Sensor #2 is made of a mixture of In2O3 and TiO2 nanofibers, which has a relatively high response value. In2O3 nanofibers were prepared using an electrospinning system [16]. In(NO3)3 4.5H2O was added into ethanol under vigorous stirring. Then, PVP and DMF were added into the In(NO3)3 solution. The mixture of In(NO3)3 solution was stirred for 8 h at room temperature. Subsequently, the mixture of In(NO3)3 solution was loaded into a glass syringe and electrospun by applying 20 kV at an electrode distance of 10 cm. The polymer of In2O3 nanofibers was ejected from jets. The as-synthesized nanofibers were heated at 600°C for 2 h in air. PVP, DMF, and water in the polymer composite were volatilized during the heating process. Finally, In2O3 nanofibers were obtained. TiO2 nanofibers were prepared in the same way, except that Ti(OC4H9)4 was added in the spinning solution instead of In(NO3)3 4.5H2O.
Details of the sensors in the sensor array

Sensor #3 is made of La0.7Sr0.3FeO3 nanowires. The nanowires were synthesized by a hydrothermal method assisted CTAB [17]. In a typical synthesis process, the nitrate aqueous solution [La(NO3)3 6H2O, Sr(NO3)2, and Fe(NO3)3 9H2O] was added into the CTAB solution under constant stirring. Then, NH3·H2O was added dropwise into the mixed solution under vigorous stirring. The mixture was then transferred to Teflon-lined stainless autoclave, sealed tightly, and maintained at 180°C for 9 h. When the hydrothermal reaction was over, the brown precipitates were collected and washed. La0.7Sr0.3FeO3 nanowires were obtained after the washed precipitates were dried and annealed at 700°C for 6 h in air.
Sensors with nanometer sensing materials have higher response and batter selectivity. However, the selectivity of semiconductor gas sensors is not satisfactory in the application. Sensors still have a similar response value to different categories and concentration of gas mixtures. Each of the response of the gas sensor has the characteristics of itself. A sensor array consisting of multiple sensors can provide more useful information in the detection and classification of gas mixtures. Therefore, a pattern recognition method with sensor array can classify the target gas. In our sensor array, sensor #3 has very low response value, but its response value changed to each change of gas kind and concentration.
The purpose of this work is to classify HCHO from VOC gas mixtures. In the experiments, three major categories gas mixtures were prepared: single-component gas, binary-component gas mixtures, and four-component gas mixtures. Single-component gas is HCHO, toluene, ethanol, or acetone. Binary-component gas mixtures are composed of HCHO and one of the three gases, including toluene, ethanol, and acetone. HCHO, toluene, ethanol, and acetone are included in four-component gas mixtures. Among the three major categories of gas mixtures, the concentration levels of HCHO are low (10 ppm), middle (50 ppm), and high (100 ppm).
2.2 Sensor measurement
Gas sensing properties were measured by a static state distribution. The sensor was put into a 50 L test chamber for the measurement of the sensing properties. The resistance of the sensor was measured using a conventional circuit. The sample gas was injected into the test chamber. When the responses reached a constant value, the front door of the chamber was opened to recover in air. The resistance of the sensor was measured using a conventional circuit. An external resistor was used to connect with the sensor in series at a circuit voltage of 10 V. The resistance of the gas sensor in target gas was calculated as follows: RS=RL×(10-VL)/VL, where RS, RL, and VL are the resistance of sensor, the resistance of reference resistor, and the measured voltage, respectively. A computer monitored and recoded the change of voltage signal VL by an A/D data acquisition card. The responses of the gas sensor were defined as S=Rg/Ra, where Rg and Ra are the resistance of the gas sensor in target gas and in air, respectively.
2.3 Extreme learning machine (ELM)
ELM is a single-hidden-layer feedforward neural network. It has three layers: input layer, hidden layer, and output layer. g() is the activation function, wi = [wi1, wi2, …, win] T is the weight vector connecting the ith hidden node and the input nodes, βi = βi1, βi2, …, βim] T is the weight vector connecting the ith hidden node and the output nodes, and bi is the threshold of the ith hidden node. Given N arbitrary samples (xi, ti), where xi = [xi1, xi2, …, xin]T ∈ R n, ti =[ti1, ti2, …, tim] T ∈ R m, the mathematically modeled of ELM [18] is
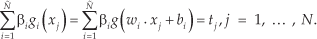
Equation (1) can be written compactly as

where


In the training process, there are given samples (x, t) of a problem, and w and b are randomly generated. The parameters in Equation (3) are all known, and the value of β is obtained by solving Equation (5).

In the testing process, the values of H and β, which are obtained in the training process, should be used to calculate the approximation value of testing samples.
3. Results and discussion
3.1 Nanomaterials and sensor response
Figure 1 shows the X-ray diffraction (XRD) patterns of the sensing materials used for the fabrication of sensors #2 and #3. The electrospun TiO2 powders indicate two phases (rutile and anatase) coexisting in the sample as shown in Figure 1a. The diffraction peaks show that the content of anatase TiO2 is higher than that of rutile TiO2 and the grain growth of anatase phase is better than that of rutile TiO2. In2O3 shows the typical single cubic phase (Figure 1b). All the main diffraction peaks can be indexed to the cubic structure of In2O3 (JCPDS 65–3170). Figure 1c displays the XRD pattern of La0.7Sr0.3FeO3 nanowires. The major phase coincides with the corresponding phase of the orthorhombic perovskite structure of La0.7Sr0.3FeO3 with pbnm (62) space group provided by JCPDS 89–1269.

XRD patterns of the oxides (a) TiO2 nanofibers, (b) In2O3 nanofibers, and (c) La0.7Sr0.3FeO3 nanowires
Figure 2 shows the SEM and TEM microstructures of the three oxides: (a–c) SEM images of TiO2, In2O3, and La0.7Sr0.3FeO3 and (d–f) TEM images of TiO2, In2O3, and La0.7Sr0.3FeO3. TiO2 and In2O3 oxides show a typical porous nanofiber, and La0.7Sr0.3FeO3 oxides show porous nanowires. These one-dimensional porous nanostructures are highly desirable for the metal oxide-based resistive-type gas sensors, which can enhance the gas diffusion in the sensing materials leading to a possible higher sensitivity [19,20].
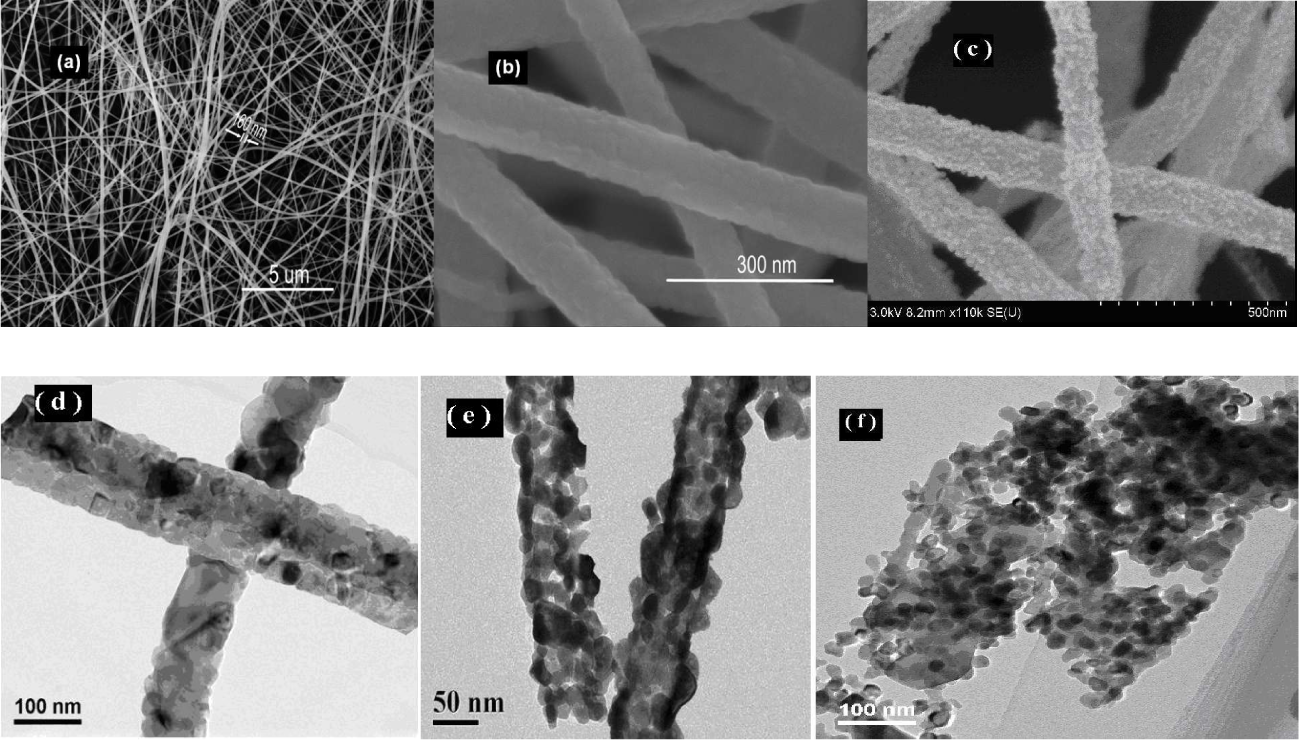
SEM and TEM images of the sensing material: (a and d) TiO2 nanofibers, (b and e) In2O3 nanofibers, and (c and f) La0.7Sr0.3FeO3 nanowires, respectively
Figure 3 shows the responses of the sensor array to gas mixtures: (a–d) responses of sensors #1 to #4, respectively. The X-coordinate denotes the component of gas mixtures. “1” stands for single gases, and it is one of HCHO toluene, ethanol, and acetone, respectively. “2” stands for binary gas mixtures, and it is composed of HCHO and one of the three gases, including toluene, ethanol, and acetone, respectively. “4” stands for gas mixtures, and it is composed of HCHO, toluene, ethanol, and acetone. The Y-coordinate denotes the concentration of HCHO. When the concentration of HCHO is zero, the responses of the sensor are for other gases in gas mixtures.

Responses of the sensor array to gas mixtures: (a) sensor #1, (b) sensor #2, (c) sensor #3, and (d) sensor #4
It is obvious that the responses of the sensor are nonlinear correlative to the concentration of HCHO with different interfering gases. It is not easy to classify the category of gas mixtures and the concentration level of HCHO.
3.2 Discussion of training time
Three kinds of pattern recognition methods were used to classify the components of gas mixtures: back-propagation neural network, SVM, and ELM.
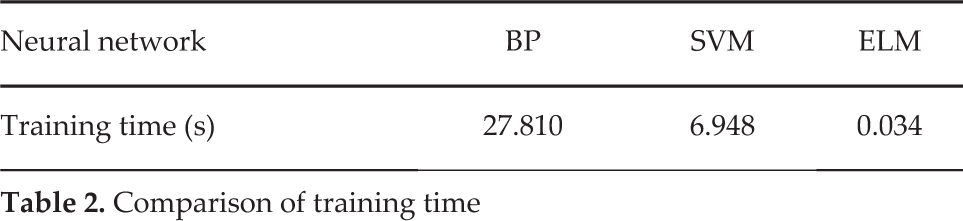
The three methods (BP, SVM, and ELM) were trained with 86 training samples that were picked from experimental data. The three methods were all carried out in MATLAB 7.0 environment running in a Core2 Duo CPU 2.20 GHz. Table 2 shows the mean training time of the three methods. The ELM learning algorithm spends 0.034 s CPU time. However, it takes 6.948 s CPU time for the SVM algorithm to finish the training. The ELM runs 204 times faster than the SVM. Compared with the traditional BP networks, the training speed of the ELM is 817 times higher.
Comparison of training time
The BP networks with Levenberg-Marquardt algorithm have the same structure as that of the ELM networks. The two neural networks consisted of an input layer with four nodes, which received the data from the sensor array, a hidden layer with 15 nodes with sigmoid function, and an output layer. The nodes of the output layer are the category of gas mixtures in the gas mixtures and the situation of the HCHO concentration level in the gas mixtures. The training time of ELM networks is hundred times faster than those of the BP networks in the experiments. The main reason for this is that the ELM training mechanism is different from those of the BP networks. In the BP networks, the weight vector of w, b, and β are iterative tuned until the accuracy meets the requirements. The weights of the networks are updated each time in the iteration procedure of the learning. Therefore, the long training time is used in the process of iteration. In this experiment, the simulations for SVM are carried out using compiled C-coded SVM packages: LIBSVM [21]. The parameter of the kernel function and cost function was trained with cross-validation. It takes a little time to train the function parameter with the training sample. In the ELM network, all the weight vectors do not need tuning or they need just tuning one time. Therefore, the ELM has little training time.
3.3 Experimental result
In an attempt to compare the accuracy rate with BP, SVM, and ELM, binary encoding and real number encoding were applied in the categories of gas mixture samples. In binary encoding, the output of the three methods is five bits binary code. Figure 4 shows the signification of the bit in binary code. In Figure 4, the first and second bits refer to the situation of HCHO. Codes 00, 01, 10, and 11 represent the concentration level of HCHO in gas mixtures. 00, 01, 10, and 11 indicate nonexistent, low concentration, middle concentration, and high concentration, respectively. The remaining three bits refer to the situation of ethanol, acetone, and toluene. If the value of the bit is 1, it means that the component exists in gas mixtures. On the contrary, the component does not exist.

Signification of bit in binary code
In real number encoding, the output are two real numbers. The first number refers to the category of gas mixtures, and the second refers to the concentration level of HCHO in the gas mixtures.
The experiments were performed using the same training samples and test samples. There were 22 samples tested. Table 3 shows the accuracy rate of the three methods. In binary encoding, the category of gas mixtures is obtained by statistical data of the five bits binary code.
Comparison of the accuracy rate
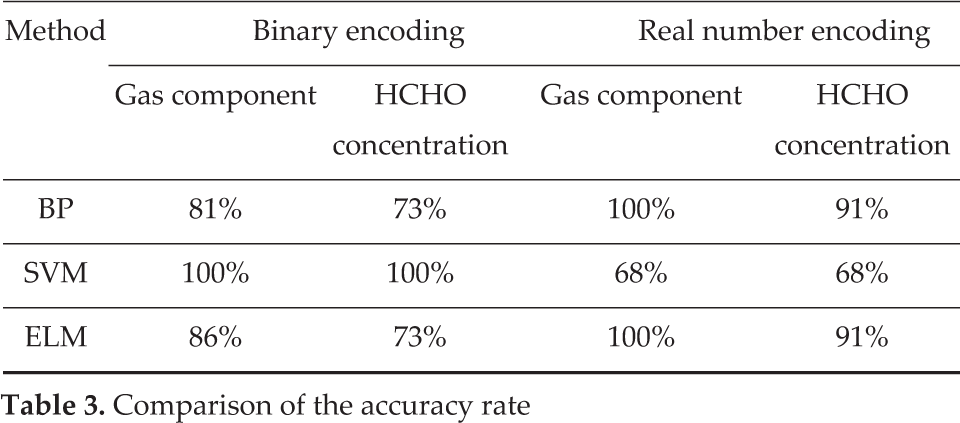
In this experiment, discrete binary code was suitable for SVM and continuous real number was suitable for BP and ELM networks. In the case of SVM, suppose some given data points each belong to one of two classes, and the goal is to decide which class a new data point will be in. In linear classifier, the data of the same classes have a margin. There are many hyperplanes that might classify the data. One reasonable choice as the best hyperplane is the one that represents the largest margin between the two classes. A new data point is classified by judging the sign of the hyperplane with input values. Discrete binary code is suitable for this method. In the case of BP and ELM networks, a discrete binary code will have a harmful impact on the weight vector in the training process. Thus, continuous real number is suitable for the training and test.
4. Conclusion
In this work, a sensor array consisting of four different nanostructured semiconductor gas sensors with pattern recognition methods was used for gas detection and classification. An ELM network was introduced to classify the components of VOC gas mixtures. Compared with the traditional neural networks (BP) and SVM, ELM networks have no iteration procedure and therefore have very fast training speed. The experimental results show that the ELM networks can achieve 204 and 817 times faster training speed than those of the SVM and BP neural networks.
The experiments were performed for two goals. One is the category of gas mixtures in the gas mixtures. The other is the concentration level (low, middle, and high) of HCHO in the gas mixtures. The results show that the accuracy rate of the three methods all can achieve 100% in the component classification. SVM is better than those of the ELM and BP networks in the classification of concentration level.
The experiments show that the accuracy rate was affected by the encoding ways. Binary encoding is more suitable for SVM. ELM and BP networks are performing better in real number encoding.
Footnotes
5. Acknowledgements
The authors thank the National Natural Science Foundation of China (61574025, 61176068, 61474012, 61501081, and 61131004) and the General Research Projects of the Department of Education of Liaoning Province (L2014578) for financial support.