
Abstract
This work aims to avoid pollution of the environment resulting from ashes accumulated due to the burning of agricultural wastes. Also, it aims to reduce the cost without impairing the mechanical properties of rubber vulcanizates. For this reason, this work was carried out as a possible solution by incorporation of cellulose fibers derived from bagasse waste as reinforcing fillers in rubber composites. Besides, it aims at reporting an investigation on a series of mixtures based on natural ground bagasse powder (GBP) and carbon black (CB) as reinforcing fillers to study their effects on the mechanical and physical properties of styrene butadiene rubber (SBR) composites. The GBP obtained from the grinding machine has a selective grain size distribution ranging from about 20 µm to 180 µm. In addition, 2.5 phr of added maleic anhydride was used to improve the interfacial adhesion between SBR and agricultural waste fillers (i.e. bagasse). Tensile strength, elongation at break, modulus at 100% elongation, resilience and hardness (Shore A), degree of swelling, and thermal properties of the rubber vulcanizates were studied. The prepared samples were also analyzed by X-ray diffractometer and scanning electron microscopy. The advantage of choosing the 25 phr bagasse concentration as a pivoting factor makes the road clearer to investigate that the optimum concentration of bagasse to be used simultaneously with CB in SBR composites is 30 phr. Furthermore, it was found from the obtained results that the addition of GBP up to 50 phr is possible without impairing the mechanical properties of SBR vulcanizates.
Introduction
Numerous studies have been conducted extensively on natural rubbers (NRs) filled with natural fibers. However, few studies deal with styrene butadiene rubber (SBR), because NR is a self-reinforced material having good mechanical properties without the need for reinforcing fillers. SBR is one of the most versatile synthetic rubbers and the most commonly used in rubber industry. The important limitations for SBR are poor gum strength, low resilience, low tear strength, and poor tack and thus, it needs reinforcing fillers to improve the mechanical properties and decrease the cost of rubber articles. 1
Fillers have always been an important constituent of the rubber industry. The most important reinforcing fillers are silica and carbon black (CB) known as white and black filler, respectively. Recently, the rubber industry is paying more attention on silica as the most used reinforcing white filler for rubbers, as it markedly presents great success in reducing the heat buildup and the rolling resistance in tires and provides strong mechanical properties for rubber products. However, it consumes a lot of energy for its production. 2,3 CB is considered as a universal compounding ingredient due to its high efficiency in increasing the mechanical properties of vulcanized rubber. 4 Many studies have been published explaining the reinforcing effect of CB in rubber. 5,6
Environmental awareness pays attention to natural fibers as a potential alternative reinforcing filler in rubber due to its unique advantages such as nontoxic, non-irritation to the skin, eyes, or respiratory system, non-corrosive properties, and causes no erosion to the machines parts during processing. 7
Agricultural wastes cause several problems to rural villages/areas in Egypt, namely, they can be incinerated in the field creating air pollution problems. The five crops producing the highest quantities of wastes are rice, sugarcane, corn, cotton, and wheat. These wastes include cobs (corn cobs), bagasse (sugarcane bagasse), straw (rice straw), and peeling (banana and orange peels).The estimated amount of agricultural wastes in Egypt ranges from 22 to 26 million dry tons per year. This huge amount should be beneficially utilized rather than being incinerated or disposed in a landfill. Agricultural wastes are mainly composed of lignocellulosic materials remained after collecting the valuable parts of crops. An account of lignocellulosic fiber-reinforced rubber composites has been documented. 8 The influence of cellulose as filler in vulcanized rubber composites was investigated by some authors. 9
In the past 10 years, many attempts have been made to use nanocellulosic fibers extracted from rice husk as a filler for other polymers such as polyvinyl alcohol by Abdel Bary et al., to get biodegradable polymers composites. 10,11 Lately, few attempts have emerged using natural fibers from bagasse as fillers for both natural and synthetic rubbers. 12,13 Most of the bagasse wastes are either used as a bedding material for animals or burned. In view of the perspectives for the growth of the sugarcane industry and the desire to promote sustainable development in Egypt, many studies have been carried out to find new applications for sugarcane bagasse residue. These studies show various applications of these residues in the form of ashes. The high mechanical strength of sugar bagasse (SB) fibers could be added to polymeric matrices to produce composite materials. In this study, we intended to introduce powdered bagasse in its very fine form in SBR composite in order to preserve the environment and reduce the weight and cost of the final product, while preserving its basic properties. The basic composition of bagasse has been reported by some authors (Table 1).
Basic composition of sugarcane bagasse.

Haghighat et al. 18 investigated the influence of adding α-cellulose powder to SBR compounds. They found that the modulus, hardness, and compression set were increased, while elongation at break (EB) and resilience decreased with increasing α-cellulose loading in rubber composites. On the other hand, tensile strength (TS), tear strength, and abrasion resistance were initially increased at low α-cellulose concentration (5 phr), after which these properties decreased with increasing α-cellulose content.
Additionally, for several more technical-oriented applications, the fibers have to be specially modified. 19 The performance and stability of composite-reinforced natural fillers depend on the development of strong interfacial bonding between the fiber and the matrix. Unfortunately, the high hydroxyl group content of cellulose is the main cause for poor compatibility between the hydrophilic natural fillers and the hydrophobic polymers matrix. 20 To produce reactive hydroxyl groups and a rough surface for adhesion with polymeric materials, plant fibers need to undergo physical and/or chemical treatment to modify the surface structure. 21 Khalf and Ward 22 studied the effect of maleic anhydride (MA) and different rice husk loading on the mechanical properties, swelling, dielectric properties, and morphology of SBR/LLDPE (linear low density polyethylene) blends composites. They reported that increasing MA concentrations in SBR/LLDPE blends resulted in an increase in the TS, EB, and hardness. After a certain concentration (2.5 phr), a reduction in these properties was found. Thereby, in this work, a great role was found in the case of using MA as a compatibilizer for all prepared natural fillers (i.e. ground bagasse powder (GBP))–SBR composites.
In this regard, this study was carried out to investigate the properties of reinforced SBR composites containing bagasse natural fiber as a supplement filler and MA as a compatibilizer. In this study, the mechanical, physical, and thermal properties were measured. Furthermore, the crystallinity of cellulose fibers was evaluated using X-ray diffraction (XRD) and the microstructure of all prepared composites was investigated using scanning electron microscope.
Experiments
Materials
Rubber: SBR (Buna-1502), Brazil.
MA was purchased from Merck KGaA Ltd, Germany.
Dibenzothiazyl disulfide (MBTS), as vulcanization accelerator was supplied by SunBoss Chemicals Corp. Canada.
Stearic acid and zinc oxide were supplied by Walworth Industrial Estate, Andover, England.
2, 2′-Methylenebis (4-methyl-6-tert-butylphenol) (C23H32O2) as phenolic antioxidant, Taiwan.
Curing agent: elemental sulfur was purchased from Kurusapa business Organization (Suksapan Panit), Thailand.
High-abrasion furnace CB N330 (HAF) as filler, China.
Processing oil (i.e. mobil1)
Solvent: Toluene, commercial grade.
Bagasse, used as a filler, was obtained from sugarcane mills after processing to extract sugar and liquor, dried at 80°C for 48 h, and then ground and sieved. Bagasse is sieved into different particle sizes. The bagasse was dried again at 80°C for 48 h before its incorporation into SBR rubber mixes. 23
Experimental techniques
Bagasse powder processing
Bagasse was collected from local mills and chemically treated. Surface modification of fiber bundles was accomplished by performing alkali treatment (5% sodium hydroxide (NaOH)) for 6 h at 60°C and after that neutralized by hydrochloric (HCl) solution. The fiber bundles were then rinsed with water and dried at 80°C for about 24 h in an oven. The chemically treated and dried bagasse was then ground and sieved using a deluxe-standard Retsch SK 100 laboratory mill operating with a rotor speed of 2850 r min−1 at 50 Hz, as shown in Figure 1(a). The size of the metal sieves used inside the grinding machine starts from 1.0 mm passing with 0.5 mm till reaching 0.12 mm (Figure 1(b)), in order to obtain a very fine bagasse fiber. The ground bagasse was dried again at 80°C for 48 h before its incorporation into rubber mixes. 23 Bagasse fibers (before grinding) and bagasse powder (after grinding) are clearly seen in Figure 2(a) and (b). The granular size distribution was measured using mechanical vibratory sieve shakers with certified standard US Standard Sieve Series (The WS Tyler Company, Cleveland, Ohio, USA) (see Figure 3(a)). The nominal sieve openings selected were 20, 45, 63, 75, 90, 125, and 180 µm. It was found that the received powder grain size distribution ranged from 20 µm to 180 µm and that 98.06% of the particles passed the 180 µm sieve as obviously statistically illustrated in the curve (see Figure 3(b)).
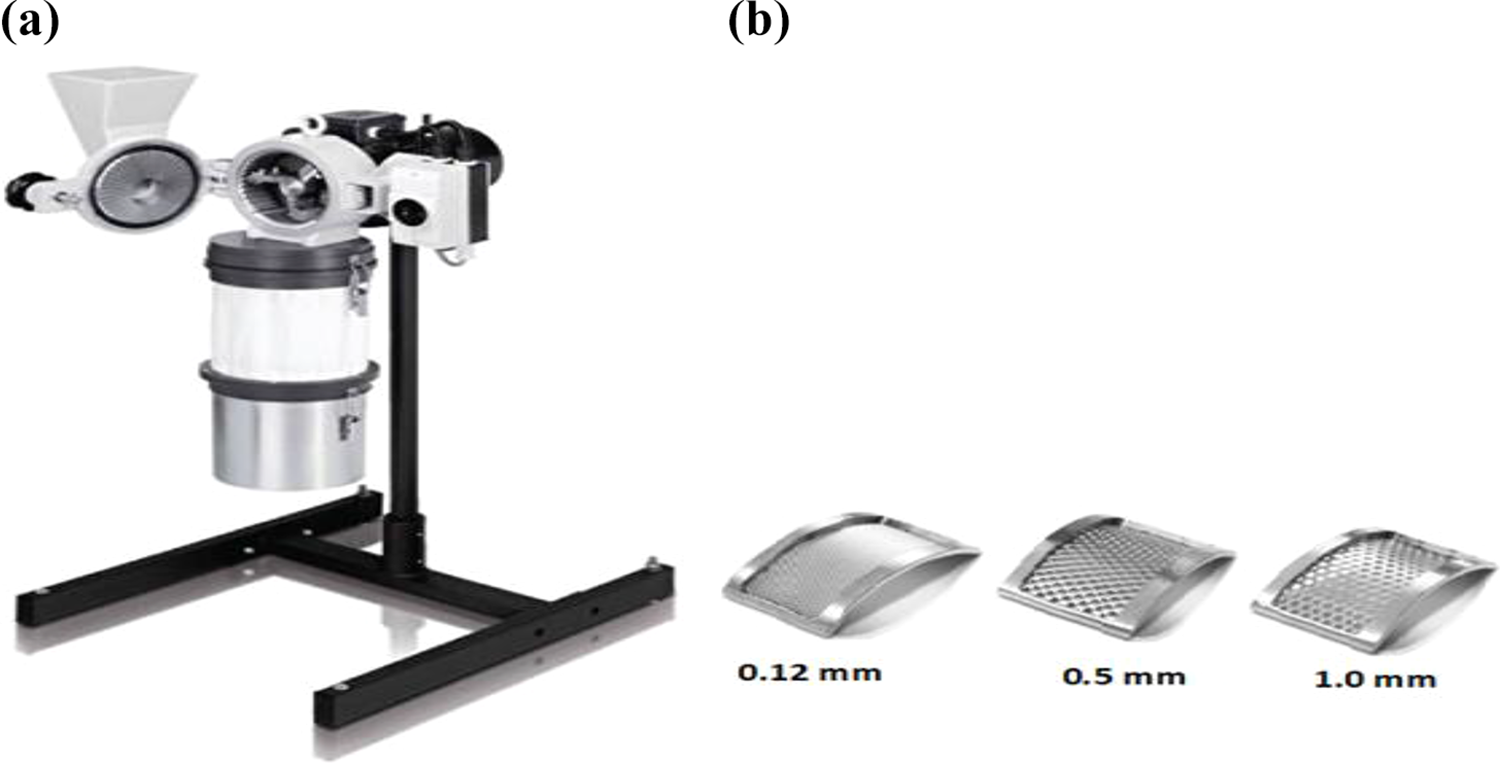
(a) Retsch SK 100 laboratory mill (grinding) machine and (b) different mesh size metal sieves.

Bagasse: (a) before grinding and (b) after grinding.

(a) Mechanical vibratory sieve shaker and (b) GBP granule distribution.
Rubber formulations and compounding
The optimum employed mixing sequence of SBR compounds was as follows: First, the rubber was masticated by passing it twice without banding at a roll opening about 0.2 mm and then it was banded with a mill opening of about 1.5 mm into a laboratory two-roll mill of outside diameter 470 mm and working distance 300 mm, speed of the slow roll at 24 r min−1, and friction gear ratio of 1.4:1 for 1.5 min in order to make it softer and easier to mix with the ingredients added. After mastication, a sequential in situ addition and mixing of MA followed by bagasse into the masticated SBR band formed around the roll mill takes about 3.5 min. After this the rest of the accurately weighed additives including activators, reinforcing CB, processing oil, accelerator, antioxidant, and finally the sulfur vulcanizing agent were added in a normal sequence with mixing stage of about 8–10 min. Three to four cuts were made at every 0.5 min alternatively from each side, taking into consideration that the rolls temperature was kept at about 60 C according to the ASTM D-3182 standards. The overall mixing time was about 13–15 min. Then, the obtained rubber mixes were sheeted in order to obtain sheets of thickness of about 2 mm and left for at least 6 h before being molded. Finally, the weights of the samples were checked after mixing. The compounded SBR mixes were compression molded (i.e vulcanized) at 152 ± 1°C under pressure of 10 ton in an electrically heated hydraulic press for the optimum time derived from the reograph. Then, the molded rubber sheets were left for at least 6 h before testing. Dumbbell-shaped TS was punched from the compression-molded sheet along the mill grain direction using C-type dumbbell specimens, according to ASTM D-412.
The first group of mixtures deals with the effect of different concentrations of CB ranging from 0 to 80 phr at fixed concentration of bagasse, that is, 25 phr. The second group of mixes employs the addition of bagasse with concentrations varying from 10 phr to 50 phr at 10 intervals with a fixed CB concentration of 40 phr. The size of GBP in all gum formulations ranged from 20 µm to 180 µm. The mixes with all its constituents are presented in Table 2.
Compound formulations of SBR.

CB: carbon black; SBR: styrene butadiene rubber; MA: maleic anhydride; GBP: ground bagasse powder; ZnO: zinc oxide; MA: maleic anhydride; MBTS: mercapto benzthiazyl disulfide; AO (Antioxidant): 2, 2′-methylenebis (4-methyl-6-tert-butylphenol); S: Sulphur.
Rheology measurements
The cure characteristics of rubber mixtures were carried out using an Oscillating Disc Rheometer (ODR) model 4308 from Zwick (Germany). These measurements were accomplished according to the ASTM D-2084 standard.
XRD analysis
Crystallinity of cellulose fibers and SBR filled with CB and GBP were all characterized and evaluated by XRD using an ARL™ X’TRA Powder Diffractometer and metal ceramic tube copper, Switzerland, operated by a generator at voltage of 45 kV and current 44 mA, with a speed of about 2° min−1 and scanning at an angle (2θ) in the range of 3–140.
Measurement of mechanical properties (ASTM D-412)
Mechanical properties such as TS, EB, and modulus M 100% and M 300% were measured. Crosshead speed was 500 mm min−1 using Zwick Tensile Testing machine (1445) Germany. The vulcanized sheets were cut into dumbbell-shaped specimens with appropriate punching dies of the standard width of 4 mm and length of 115 mm. The thickness of the test specimens was determined by a graduated gauge to 100 mm. The resilience of the specimens was determined using elasticity instrument type HGIB, produced by the VEB Thuringer (Bareiss Prüfgerätebau GmbH, Germany), according to ASTM D-1054 standard. It is expressed in percentage. The hardness of the samples was measured, according to ASTM D-2240 standard, using a shore “A” hardness tester of the type HGIB, produced by the VEB Thuringer.
Measurement of equilibrium swelling
The equilibrium swelling was carried out according to D471-97 (1998). The swelling was performed by immersing the specimens in toluene at room temperature 25 ± 2 C for 24 h. The variation of apparent percentage of change in mass was calculated. It is expressed as the increase percentage of the original mass. The swelling percent was calculated according to equation (1):

where w is the original weight of the sample and d is the final weight of the swelled sample.
SEM analysis
Scanning electron microscopy (SEM) was carried out using an FEITM Inspect model high-resolution imaging, with advanced chamber vacuum technology, England. The samples were mounted on a standard specimen stub, subjected to high-resolution Schottky field emission, with an operating accelerating voltage of 200 V–30 kV, probe current: ≤200 nA, continuously adjustable and with magnification 14–1,000,000×.
Thermal properties (TGA)
Thermogravimetric analysis (TGA, USA) was evaluated using a TGA Q500 (TA Instruments, USA). It was used to evaluate the thermal stability of different types of powder fillers and films of vulcanized rubber composite with thermo balance sensitivity of 0.1 µg. The samples were heated at a heating rate of 10°C min−1 under nitrogen gas at a flow rate of 50 mL min−1 from 25°C to 500°C. The differential curve was used to determine the weight loss of the sample at the corresponding temperature.
Results and discussion
Rheological properties
The rheological characteristics of the SBR mixes were measured at 152 ± 1°C for a period of 30 min, and the data are presented in Table 3. From the rheological data it can be seen that, as the concentration of bagasse is increased, the minimum and maximum torque values were increased, and the optimum cure time, scorch time, and cure rate index values were decreased. This means that the viscosity of the rubber mixtures increases with increasing the concentration of bagasse, which affects the ease of processing of uncured rubber. Our reported results are in accordance with Daham’s 24 results, which stated that scorch and cure time decreases while maximum torque increases with increasing concentration of the natural filler.
Rheometric characteristics of SBR vulcanizates containing different concentrations of bagasse fiber.
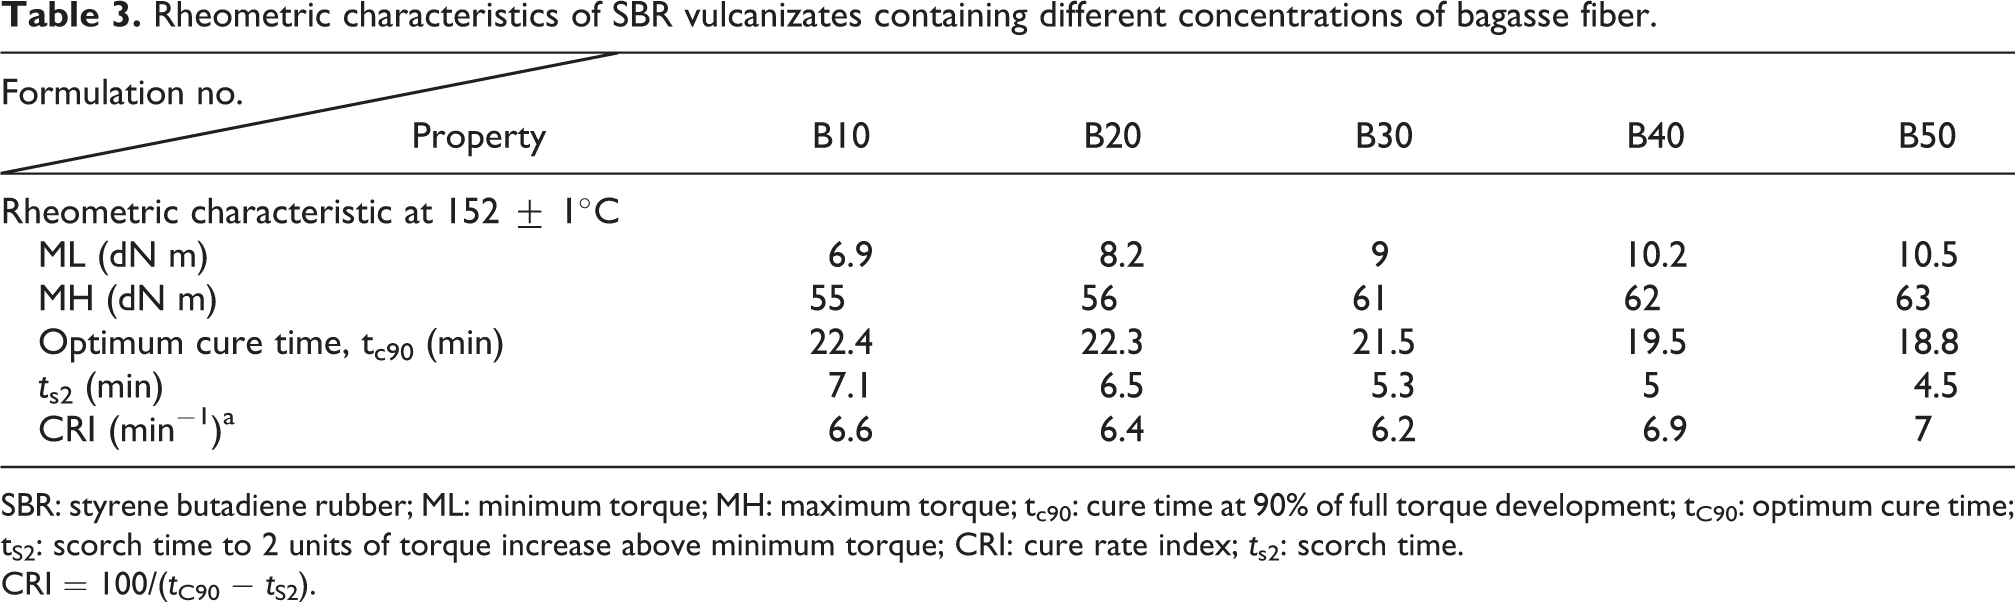
SBR: styrene butadiene rubber; ML: minimum torque; MH: maximum torque; tc90: cure time at 90% of full torque development; tC90: optimum cure time; tS2: scorch time to 2 units of torque increase above minimum torque; CRI: cure rate index; ts2: scorch time.
CRI = 100/(tC90 − tS2).
Physicomechanical properties
Effect of CB concentration on the tensile properties of SBR-bagasse composites
Figure 4(a) shows that TS initially increases with CB loading and reaches an optimum value at 60 phr and afterward, it remains almost flat and the breaking strain decreases with CB loading at all levels. Figure 4(b) shows that the modulus increases with CB loading at all levels.

Effect of CB contents on tensile strength, elongation at: (a) break and (b) modulus.
The improvement in the TS values of the samples is normal behavior and can be attributed to the reinforcing effect of CB. 25 The reason for the steady decrease in EB agrees with the work of researchers. 26 The increasing trend in modulus (M 100%) is due to higher physical and/or chemical crosslinks between rubber chains and CB surface, which leads to higher resistance to breakdown.
Effect of bagasse fiber concentration on the tensile properties of CB-reinforced SBR vulcanizates
Figure 5(a) and (b) shows the effect of bagasse fiber concentration on the TS values of the vulcanizates at a fixed concentration (40phr) of CB. As shown in Figure 5(a), the TS values slightly increase until they attain the maximum value at an optimum of 30 phr bagasse concentration. Above this point, further increase in bagasse fiber loading dilutes the concentration of carbon in the test sample and encourages the possible fiber–fiber contact, which results in a reduction of ductility of the composites, thereby reducing the toughness of the sample.

Effect of bagasse contents on tensile strength, elongation at: (a) break and (b) modulus.
This result indicates, per the earlier report, 27 that the presence of compatiblizer (2.5 phr of MA) leads to a slight improvement in the filler–matrix interfacial adhesion, better dispersion of the filler in the matrix, and better bonding between the constituents material.
Figure 5(a) shows an increase in TS values up to 30 wt% bagasse fibers. Above 30 wt%, the decrease was attributed to the physical interaction and immobilization of the polymer matrix due to mechanical restraints. This was expected because the TS of bagasse fiber (180–290 MPa) 28 is greater than that of vulcanized rubber. The presence of bagasse practically reinforces the composite. Hence, the more the bagasse fiber content, the higher the TS of the composites.
It is obvious that the EB percentage gradually increases with increasing the concentration of bagasse filler up to 30 phr and then decreases with increasing the concentration (see Figure 5(a)). This may be due to the increasing stiffness of the vulcanizates.
It can be seen that the modulus undergoes an overall gradual increase for both 100% and 300% elongation, as seen in Figure 5(b). As discussed earlier, this may be attributed to the improvement in the filler–matrix bonding, which leads to an increase in the efficiency of stress transfer from the matrix to the filler phases. The modulus 300% was found to increase with increase in fiber content due to the introduction of bagasse compared to the polymeric matrix (Figure 5(b)). 29 There are several aspects that play a major role in the resulting mechanical properties of the rubber vulcanizates, which are as follows: interfacial adhesion between bagasse fibers and SBR chains, the size of the filler, and the extent of dispersion. The adhesion and dispersion depend on the processing technique, the polarity, and the surface modification of the fillers. 29 This was promoted by hydrogen bonding resulting from hydroxyl groups on the surface of cellulosic nanocrystal CNCs interacting with polymer chains, which lead to an increase in modulus (from 2.4 to 4.3 N mm−2 and from 7.1 to 9.8 N mm−2 at 100% and 300%, respectively) and a corresponding increase in TS (from 12.99 N mm−2 to 14.22 N mm−2).
Effect of varying reinforcement on rebound resilience
According to the literature, 30 rebound resilience is the ratio of energy given up on recovery from deformation to the energy required to produce the deformation. Figure 6(a) and (b) shows the variation of rebound resilience of the composite with changing CB and bagasse fiber contents, respectively. As seen in Figure 6(a), the rebound resilience decreases generally as the concentration of CB increases from 0 to 80 phr. Similarly, rebound resilience also decreases as the bagasse fiber content increases from 0 to 50 phr (Figure 6(b)). This indicates that carbon content has influence on the rebound resilience of rubber composite. The best energy-absorbing composite is represented by the lowest rebound resilience occurred at 80 phr. Therefore, an increase in CB concentration is accompanied by an increase in the energy absorption capacity of the material. The decrease in rebound resilience values with increase in CB loading could be also explained by the presence of CB particles which cause less strain energy. Since the rebound resilience is directly proportional to the degree of elasticity and segment mobility, the presence of CB reduces the elasticity and segment mobility of the cured composites. 31 Using large amounts of filler results in increase in hardness and decrease in resilience values. 30 Therefore, the resilience decreases with increasing CB loading. It therefore shows that the carbon content has influence on the rebound resilience of rubber vulcanizates.
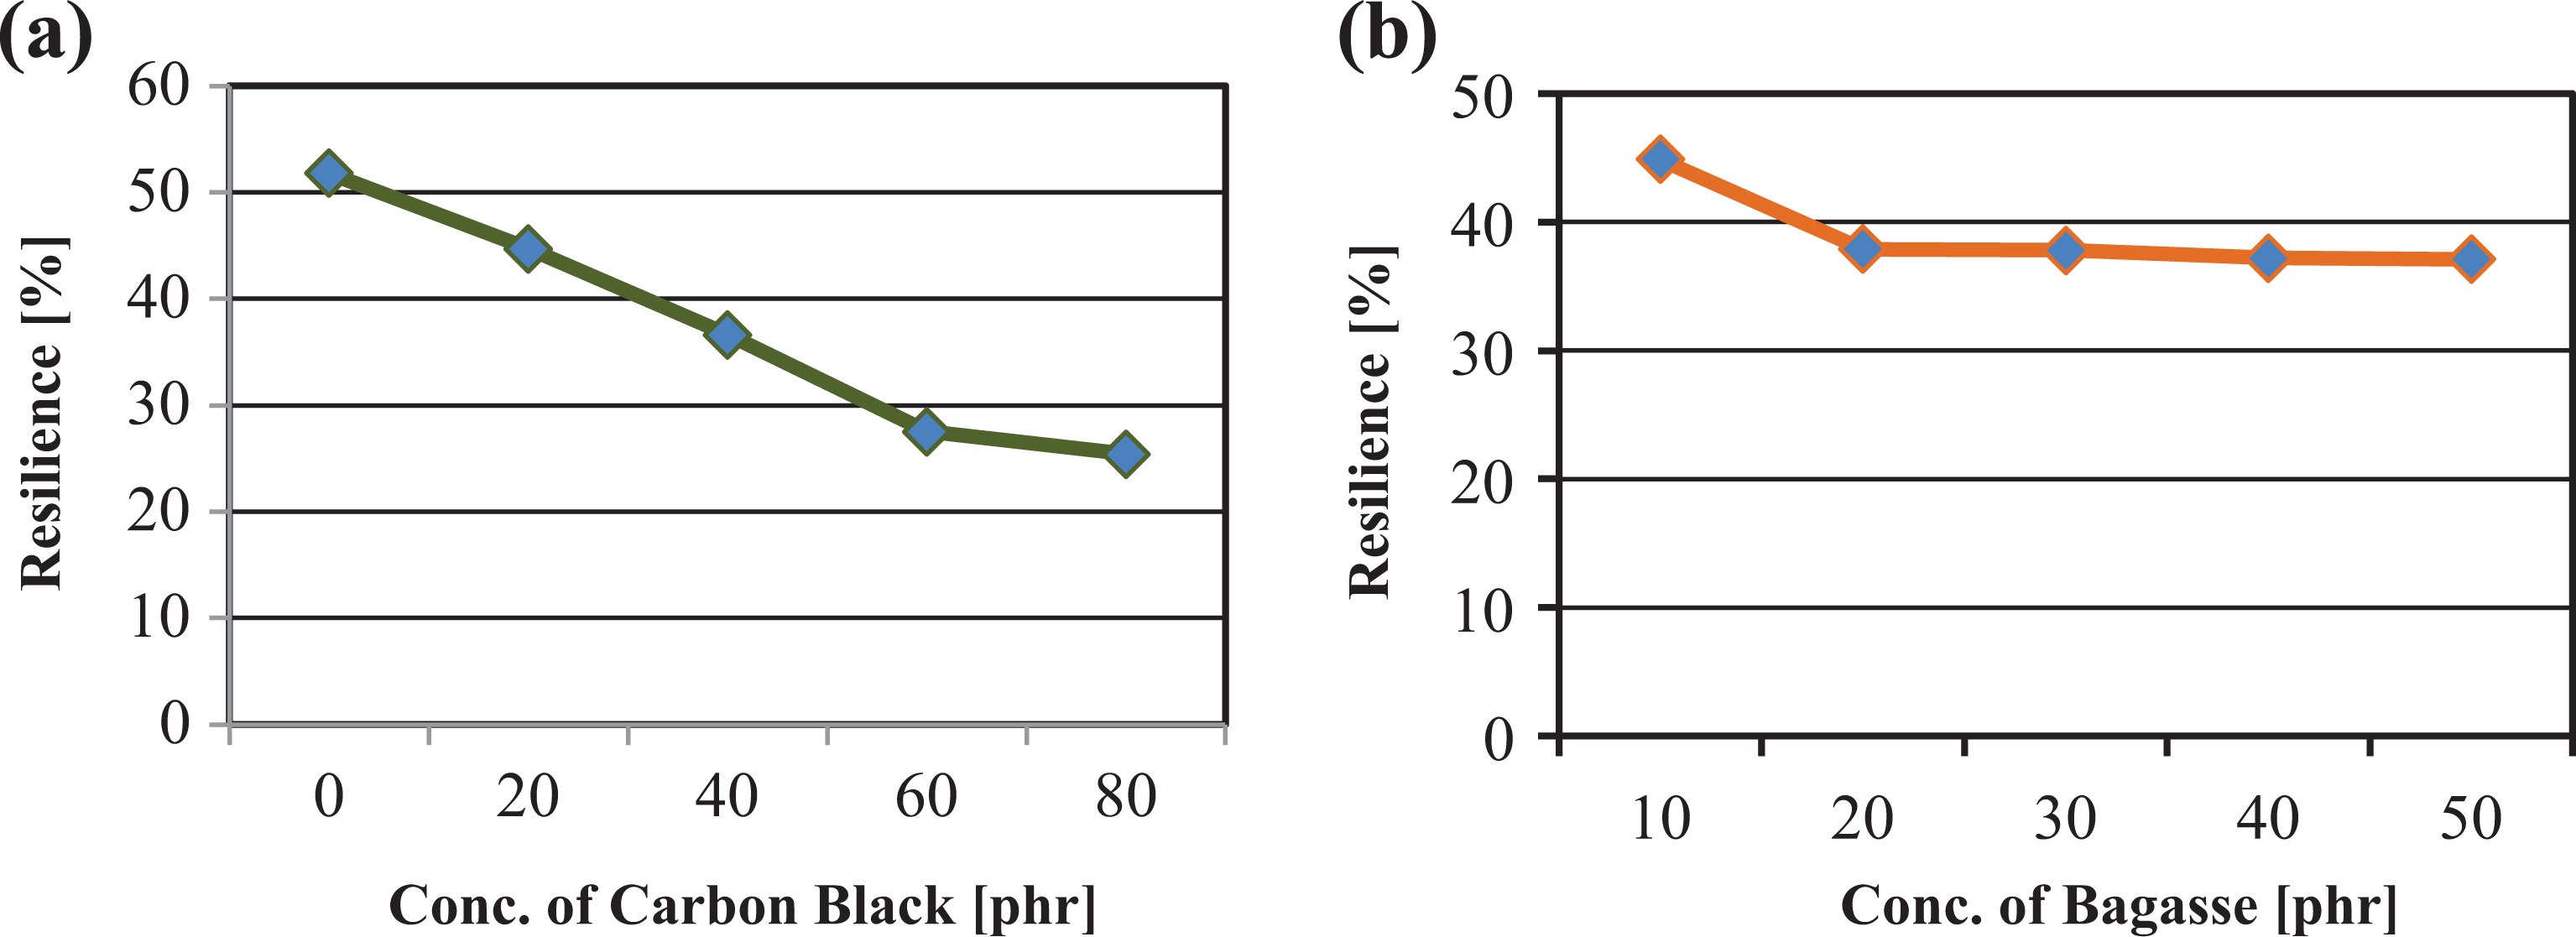
Variation of rebound resilience for: (a) different CB contents and (b) different bagasse contents in SBR vulcanizates.
Similar observations were reported for bagasse–SBR composites. Incorporation of the filler particles in the soft matrix reduced the elasticity of the polymer chains and consequently, the rebound resilience values decreases with increase in the bagasse concentration, as shown in Figure 6(b).
Increasing the cellulosic filler (based on bagasse with an average particle size approximately 20–180 µm) loading resulted in a gradual not significant decrease in resilience, as reported earlier for cellulosic cotton. 18 The decrease in resilience is explained by the cellulosic particles acting as fillers that decrease the strain energy. This is due to the decreased segment mobility of the matrix molecules arising from their interaction with filler particles, which results in an increased hysteresis. 32,33 Thus, hysteresis increases and, of course, the opposite trend is exhibited in terms of resilience. If a large amount of filler is used, the hardness achieved is high, but resilience decreases, 34 because there are more points of slippage between the filler and the matrix, and also because the filler tends to clump together so that the particles touch one another instead of being totally embedded in the matrix. 35 The mobility of the nanocellulose particles and slippage of chains attributed to applied stresses on vulcanizate increase the hysteretic behavior of the vulcanizate. 33 Therefore, the resilience decreases with increase in the cellulose loading.
Effect of varying reinforcement on hardness
The hardness value of a material is a measure of the resistance of the material to indentation. It was observed that hardness increases with the increase in CB and bagasse content, as shown in Figure 7(a) and (b), respectively. This result was expected because, as more CB contents were incorporated into the rubber matrix, the plasticity and flexibility of the rubber chains were reduced, resulting in more rigid composites. 36 This is because CB had been reported to be harder than SBR on a Mohr scale, 37 therefore increase in CB content will automatically increase the resistance to indentation. Increase in hardness can also be due to a higher extent of cross-linking of the polymeric materials as a result of increase in carbon contents as reported, 35,38,39 which show that rubber hardness had good correlation with the elastic modulus. Higher loading and large microsized filler particles cause more rigid compounds. The hardness depends on the amount and distribution of the filler in the host matrix and increases by increasing the filler content.

Variation of hardness for different: (a) CB contents and (b) different bagasse contents in SBR vulcanizates.
If we look at four mixes; 25, 30, 40, and 50phr of bagasse-filled SBR composites as seen in Table 4, we can observe that 30 phr is an optimum employed content for bagasse, and from this perspective, we can propose that bagasse as natural filler can be used as a partial replacement for CB in some applications.
Comparison between SBR formulations containing different concentrations of bagasse.

SBR: styrene butadiene rubber; TS: tensile strength; EB: elongation at break. The grey shade is applied to point for the optimum employed bagasse content.
TGA analysis
Effect of CB and bagasse content on thermal stability of the vulcanizates
TGA is used to evaluate both the thermal stability and the percentage of the inorganic filler in the composites. As seen from Table 5 and Figure 8, all the composite materials lost weight to a certain degree after which they became constant.
Thermal analysis data for different concentrations of CB-filled SBR vulcanizates.
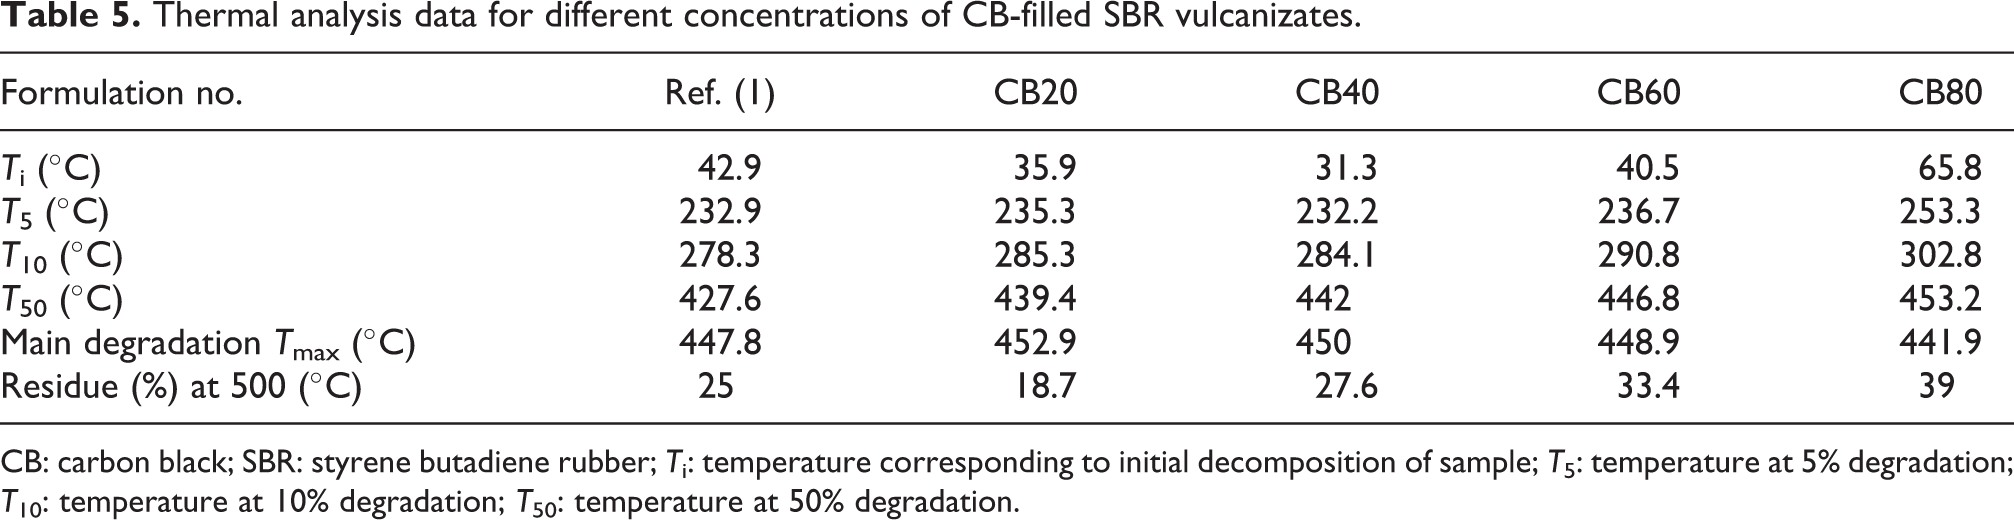
CB: carbon black; SBR: styrene butadiene rubber; Ti: temperature corresponding to initial decomposition of sample; T5: temperature at 5% degradation; T10: temperature at 10% degradation; T50: temperature at 50% degradation.

Variation of weight loss behavior for different concentrations of CB-filled SBR.

Variation of weight loss behavior for different concentrations of bagasse-filled SBR.
Figure 8 shows the percentage weight loss as a function of temperature changes for different CB-filled SBR composites. By comparing the weight loss as a function of temperature, the effect of CB on the thermal stability of SBR vulcanizates can be analyzed.
The thermal stability of the SB-based fillers was studied by several authors to evaluate the effect of the extraction processes and surface modification. 40 -42 The degradation steps of the fillers give an idea of the resulting product after the extraction process. Surface modification of the fibers can also change their thermal degradation behavior. 43 Table 6 gives the thermal analysis data and Figure 9 shows the TGA curve of unfilled and bagasse-filled SBR vulcanizates.
Thermal analysis data for different concentrations of bagasse-filled SBR vulcanizates.

SBR: styrene butadiene rubber; Ti: temperature corresponding to initial decomposition of sample; T5: temperature at 5% degradation; T10: temperature at 10% degradation; T50: temperature at 50% degradation.
It is obvious from the results that all the bagasse-filled SBR composites start their degradation earlier compared with that for the unfilled one at Ti (0.05)°C. A similar observation can nearly be seen for the 5% (T5)°C and 10% (T10)°C weight loss, respectively, whereas this trend is obviously reversed by approaching the 50% (T50)°C and Tmax°C weight loss by shifting the temperature to higher values for the bagasse-filled composites. Consequently, the residue of filler at the end of each test was found to be higher for the bagasse filled than for the unfilled SBR composite, which is a good indication that the thermal stability for the SBR–bagasse-filled composites was slightly improved or at least fairly reserved.
Equilibrium swelling properties
The effect of increased CB and bagasse concentration on mass swell (in toluene) for SBR-filled composites is seen in Figure 10(a) and (b). From the figure, it is obvious that the equilibrium swelling in toluene decreases with increase in the CB and bagasse concentrations. It is clear that the weight fraction of the rubber part decreases with increasing non-swellable filler loadings and this, in turn, decreases the equilibrium swelling of the corresponding vulcanizates and thus, the equilibrium swelling of the composites decreases with increase in fiber loading. This is also mainly due to the increased hindrance exerted by the fibers at higher fiber loadings and due to the good fiber–rubber interactions. 45
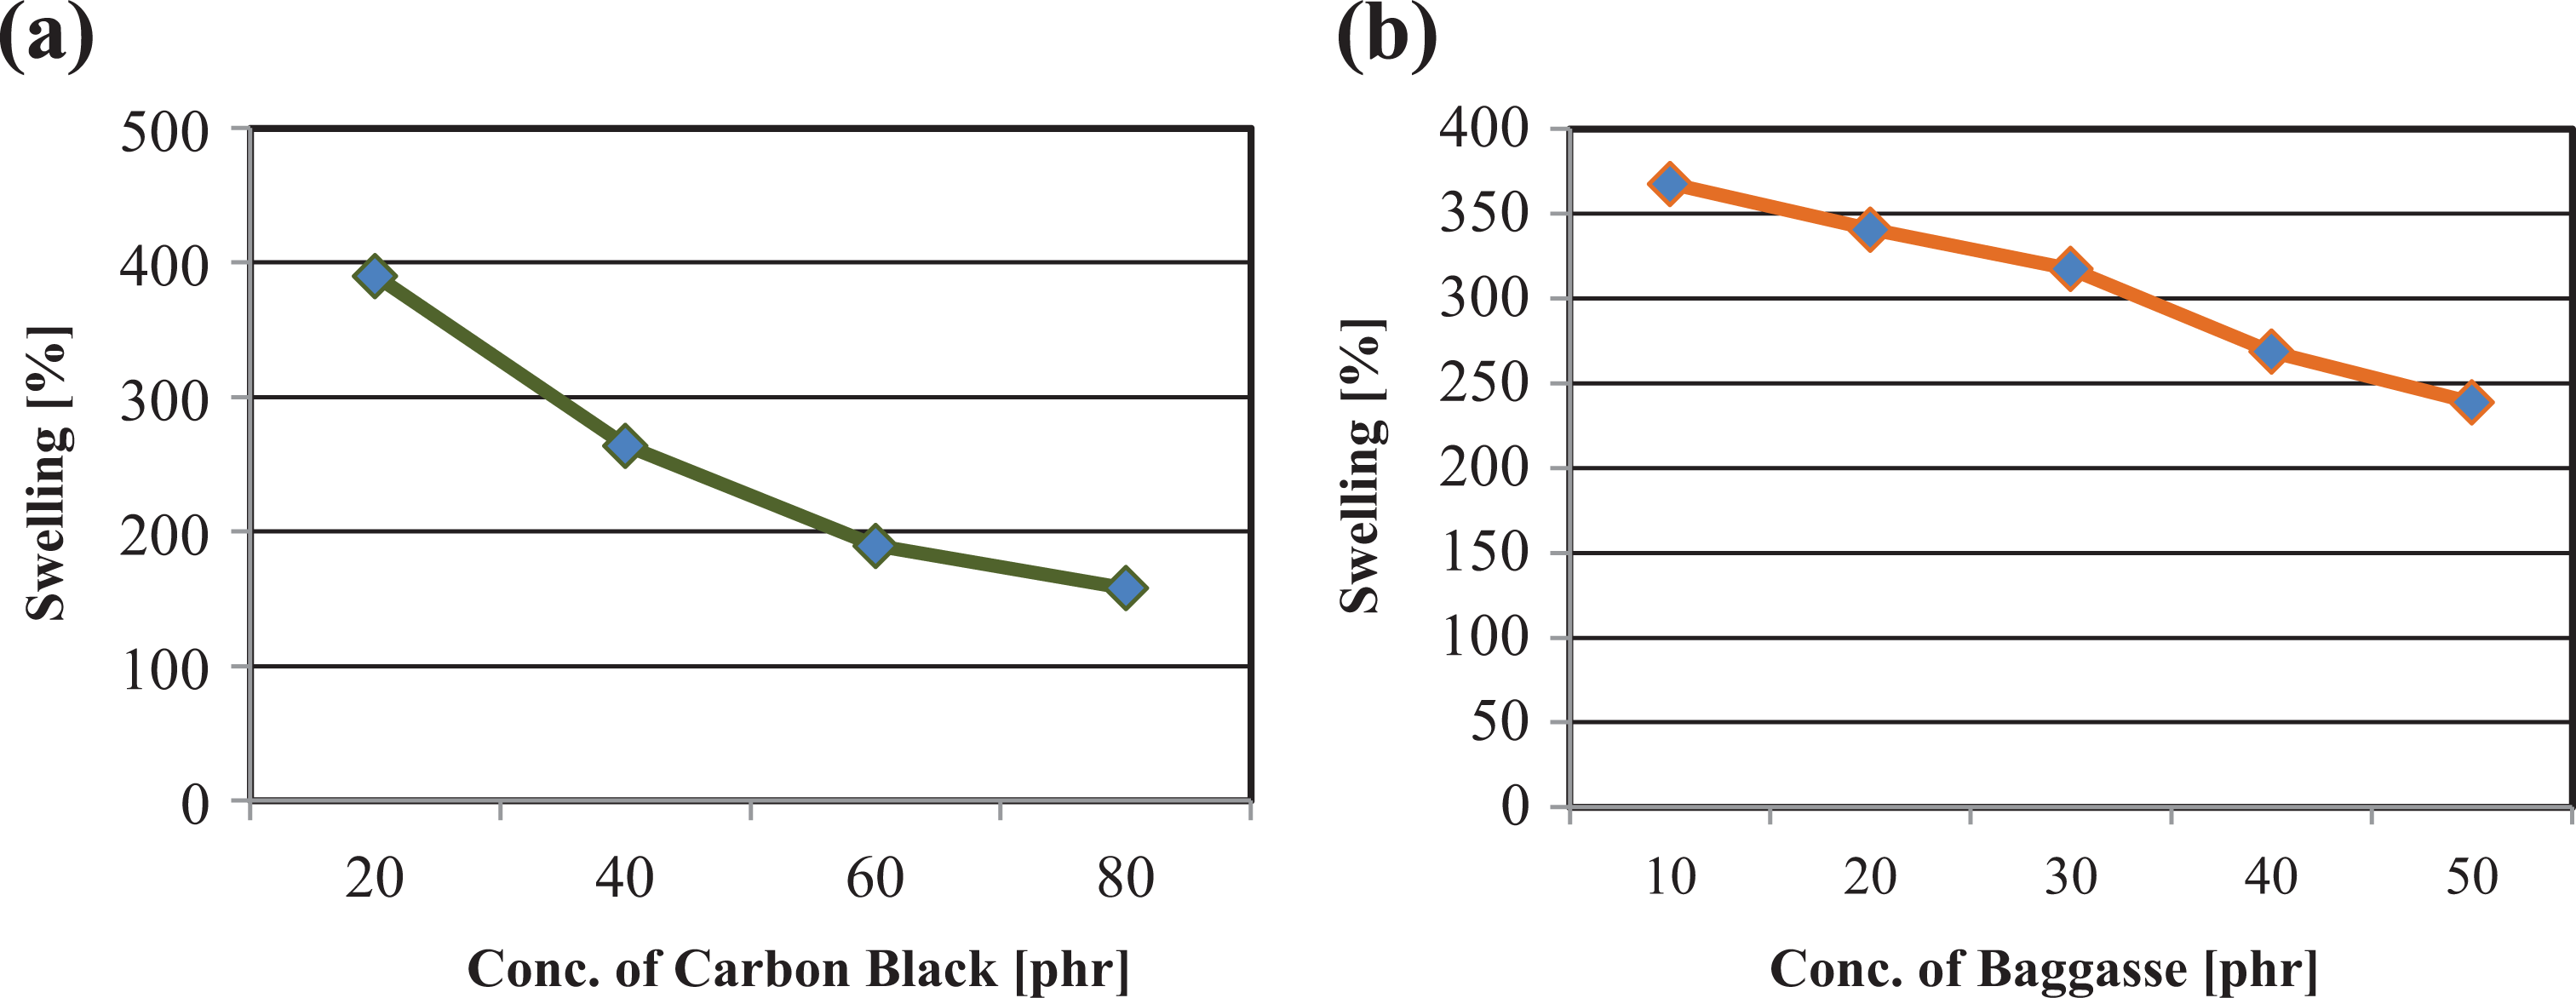
Variation of swelling behavior for: (a) CB mixes and (b) bagasse mixes. 44
SEM of microfractured surfaces
SEM produces clear images of the microfractured surfaces. Figure 11(a) to (e) shows micrographs for the CB-filled SBR composites after rupture. The red block arrows, dashed blue circles, and yellow ovals are all illustrating shapes, indicating the presence for some but not all fibers, voids, and agglomerates in the different produced composites. The well-viewed fibers were found to be somewhat homogeneously dispersed throughout the whole matrix. The agglomerated portions appear when the fiber concentration gradually increases, specifically in that of 60 and 80 phr of CB (Figure 11(d) and (e)). Also, clusters of bagasse particles imbedded in the matrix are shown as black arrows.

SEM micrographs of: (a) SBR loaded with 25 phr bagasse; (b) SBR loaded with 20 phr CB; (c) SBR loaded with 40 phr CB; (d) SBR loaded with 60 phr CB; and (e) SBR loaded with 80 phr CB.
Figure 12(a) and (b) shows the fibers of GBP and the fine structure of SBR filled with 40 phr CB, respectively.

SEM micrographs of: (a) fibers of GBP; (b) fine structure of SBR filled with 40 phr CB; (c) SBR loaded with 10 phr bagasse; (d) SBR loaded with 20 phr bagasse; (e) SBR loaded with 30 phr bagasse; (f) SBR loaded with 40 phr bagasse; and (g) SBR loaded with 50 phr bagasse.
Fine morphology is generated by the compatibilizer. In addition, the presence of MA improves the interfacial bonding between the bagasse and SBR, as seen in Figure 12(c) and (f). However, poor dispersion occurs by increasing bagasse concentrations (see Figure 12(g)).
Poor filler dispersion gives rise to certain detrimental effects such as reduced product life, poor service performance, and poor product appearance. SBR composite containing 30 phr of bagasse shows better dispersion with less dewetted or undispersed filler agglomerates (see Figure 12(e)). In Figure 12(g), it can be seen that there are many dewetted filler agglomerates on the surface. These micrographs explain why the mechanical properties of SBR–bagasse-filled composite decreased by increasing bagasse loading.
XRD analysis
Figure 13(a) and (b) shows, respectively, diffractograms of treated bagasse powder and different concentrations for treated bagasse inside the SBR composites. XRD analysis was carried out to detect the effect of mixing and vulcanization of rubber mixtures on the crysallinity of nanocellulose. As can be observed, all samples exhibit typical cellulose diffraction peaks, where the highest peak corresponds to the 002 crystallographic planes. This phenomenon is due mainly to the removal of lignin and hemicellulose (amorphous substances) and not necessarily due to changes in the crystalline structure of the biomass.
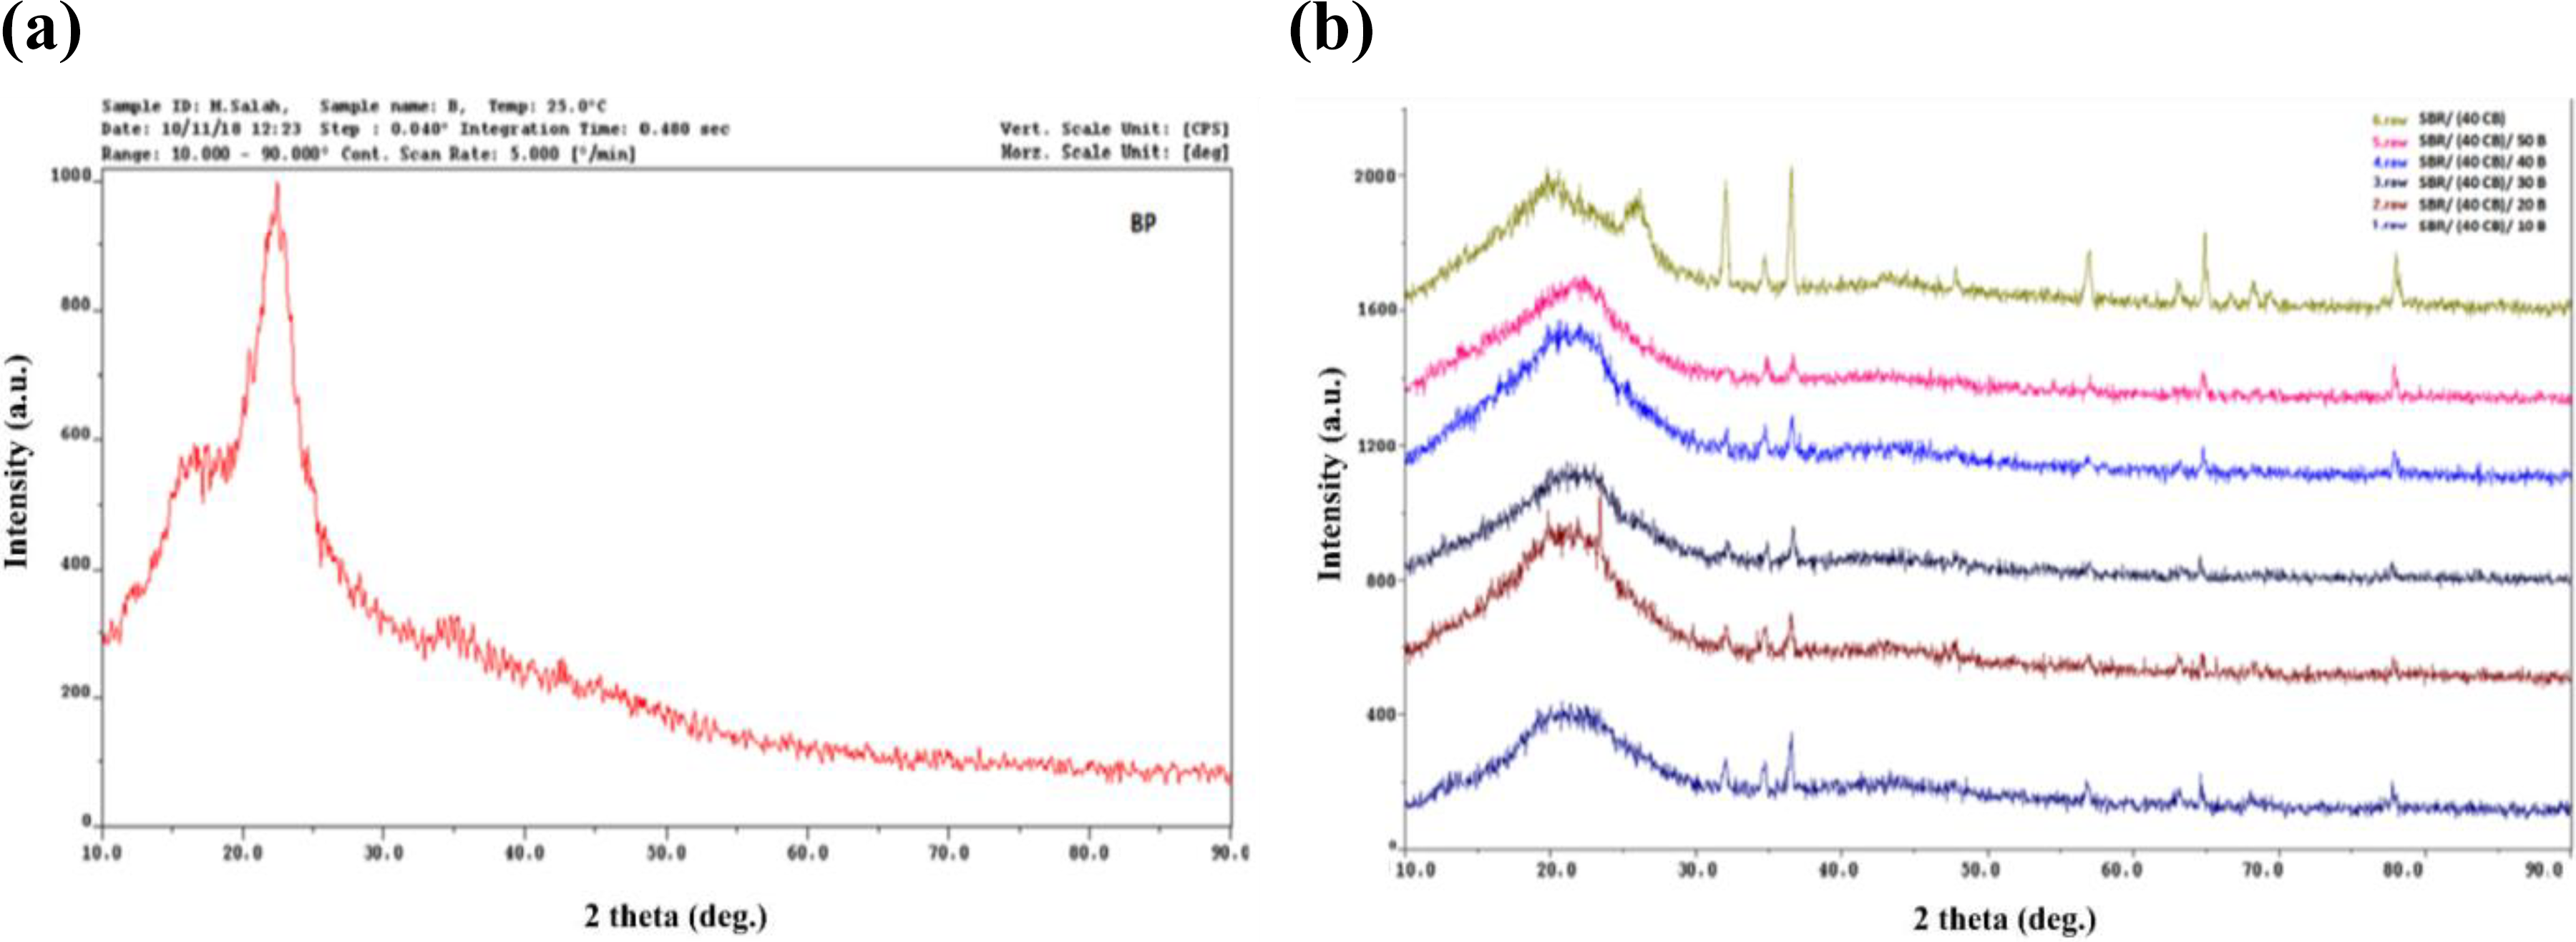
Diffractograms of: (a) treated bagasse powder and (b) different concentrations for treated bagasse inside the SBR composites.
The crystallinity of lignocellulose biomass accounts for the relative amount of total crystalline cellulose in the solid component. The crystallinity is strongly influenced by the composition of biomass; the relative amount of lignin, hemicellulose, and cellulose varies according to the nature of the biomass. The crystallinity index (CI) was obtained from the ratio between the intensity of the 002 peak (I002, 2θ = 22.5) and the minimum dip intensity of the background scatter (Iam, 2θ = 18.5) between the 002 and the 101 peaks according to equation (2). 46,47

where I002 is the intensity value of plane 002 for the crystalline cellulose (2θ = 22.5° for cellulose I) and Iam is related to the amorphous cellulose structure (2θ = 18° for cellulose I). 48 It is obvious from Table 7 that there is a steady increase in %CI with increasing bagasse loading.
Crystallinity index data for different concentrations of bagasse-filled SBR vulcanizates.
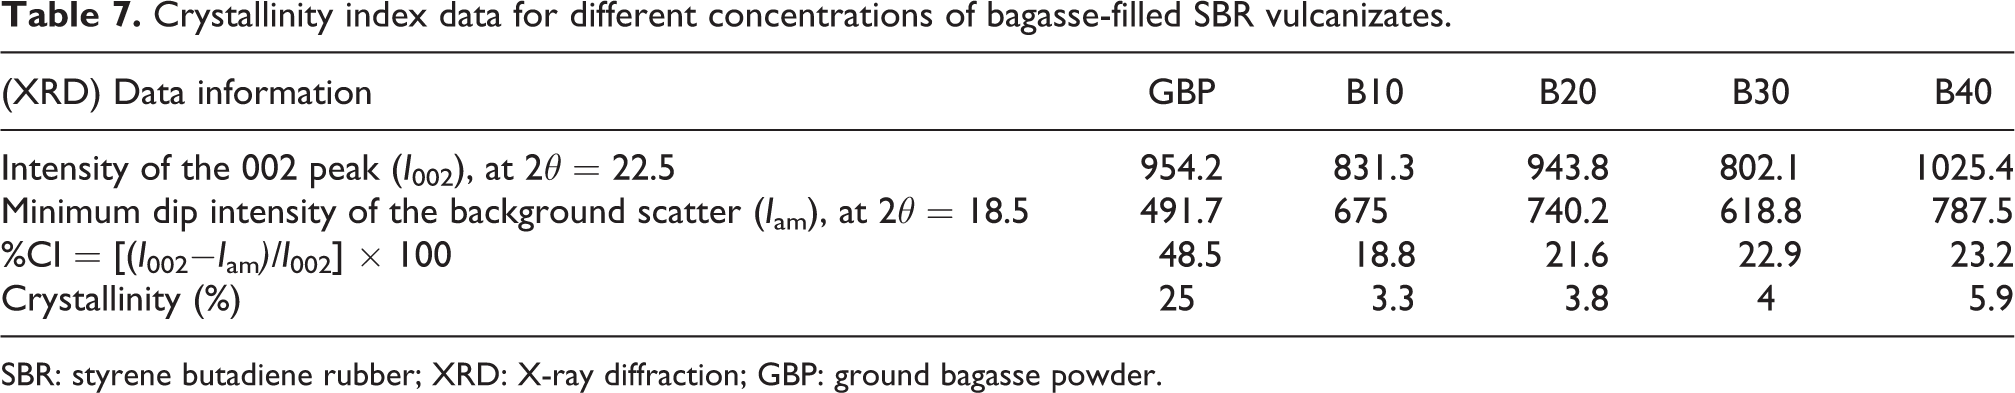
SBR: styrene butadiene rubber; XRD: X-ray diffraction; GBP: ground bagasse powder.
Conclusions
From the above-mentioned results the following conclusions can be derived:
The optimum concentration of bagasse is 30 phr in combination with 40 phr CB in SBR composites.
The presence of compatiblizer (2.5 phr of MA) leads to a slight improvement in the filler–matrix interfacial adhesion and better dispersion of the filler in the matrix.
The microstructural characterization of the fillers and SBR filled with agricultural wastes clearly shows the distribution of the fibers and their adhesion with the matrix.
XRD shows that the crystallinity of cellulose has not been affected by compounding of rubber mixtures and vulcanization.
TGA shows that a bagasse fiber has no recognized adverse effect on the thermal stability of SBR vulcanizates.
Bagasse fibers can be utilized for advanced and engineering product development for different applications.
Footnotes
Acknowledgements
The authors gratefully acknowledge the German University in Cairo (GUC) mechanical laboratory. The authors are also indebted to the (STCE) Science and Technology Center of Excellence and the main laboratory of chemical warfare (Egyptian Armed Forces) in Cairo, Egypt, and specially thank the laboratories of Chemical Department, Faculty of Engineer, Alexandria University, Alexandria, for the use of their facilities.
Declaration of conflicting interests
The author(s) declared no potential conflicts of interest with respect to the research, authorship, and/or publication of this article.
Funding
The author(s) received no financial support for the research, authorship, and/or publication of this article.