
Abstract
The present research has been made to investigate the characteristics of a new composite material made up of limestone as particle reinforcement. New composites are made by taking limestone particles in five different sizes and jute as woven reinforcement in polypropylene matrix. Mechanical characteristics of the composites that include strengths against tension, compression, flexural, impact and hardness are evaluated and a comparative investigation is made among the composites. The effect of particle size on the properties is analysed and found that the composite with medium particle size bears the highest strength in all aspects. In addition, microscopic image analysis is carried out to investigate the distribution of particles, bonding capacity and other morphologies. The results showed that limestone will be apt particle reinforcement and its presence enhances all the characteristics of the composite.
Introduction
Among the several classifications, polymeric composites are the one that supports the engineering industries as structural components in all sectors. At the inception, polymeric composites are made with artificial reinforcement in polymer matrix, and this supported many industries in terms of strength, durability and manufacturing cost. Although these composites are good in its characters, they are very poor in recycling ability. This made researchers to look for alternate materials derived from the plants and minerals. 1 -3 Among the different types of natural materials, fibres derived from various parts of the plants are majorly taken by researchers as the reinforcements. These fibres have exhibited an on par and sometimes better characters than the man-made fibres like glasses and carbon. 4 -7 A natural fibre may not be used in its own form. Pre-treatment methods like treating with standard chemicals and heat treatment are done to improve the suitability of a natural fibre in a composite and also to improve its strengths. 8 -10 On the other hand, minerals taken from the earth are also used by many researchers as reinforcements in composites and other materials.
Minerals are naturally occurring material and have a specific chemical content. They are available as sediments under the earth and in the form of rocks and they possess extremely good physical characteristics. These minerals have been used as reinforcements in polymeric composites by many researchers. One among those is the clay, a natural rock in the form of fine particles and composed of minerals. Clay is used in pottery industry, and they are plastic when wet but hard under dry conditions. Mechanical characteristics have been investigated on the clay-filled epoxy composites and concluded that 2% clay-filled composite produced a highest flexural strength and storage modulus. 11 Sepiolite is a porous clay material available abundantly in nature. It is special in its compressive properties and thus helps in improving the compressive behaviour of the composites. 12 On the other hand, the compressive performance could also be enhanced by adding granite powder as the reinforcement. An optimum reinforcement composition of 50% must be used to attain a maximum compression strength in the composites. 13
Talc is another clay mineral that majorly contains hydrated magnesium silicate and used as a primary material for manufacturing talcum powders. Composites have been prepared with talc, calcium carbonate and glass as reinforcements in polypropylene matrix. Analysis on the mechanical behaviour showed that the inclusion of talc fillers increased the tensile strength and toughness of the composite to a considerable extent. 14 Few other research studies have also been made on the characterization of talc/polypropylene 15 and calcium carbonate/polypropylene 16 and proved that they are competent mineral fillers and suitable for polymeric composites. Glass fibres are used as reinforcement in polypropylene matrix, and it has been suggested that they are more suitable for high gas barrier applications. 17 , 18 Hydroxyapatite (HA) is a natural mineral that is obtained from the earth in the form of calcium apatite. HA is mainly used as a filler material for bones and teeth. A research on materials used HA as particle reinforcement in the polyethylene matrix and concluded that increase in HA particles enhanced the storage modulus but decreased the damping capacity at all temperatures. 19 Although the inclusion of HA particles increases the storage modulus, it has been reported that HA particles are very poor in interfacial bonding with the matrix, thus alleviating the impact strength, 20 whereas HA in combination with nanosilver will be a more suitable material for bone cement. 21
Kaolinite is a stone made of alumina and silica particles and majorly used by the paper industry. Rubber-based composites reinforced with kaolinite particles improves the thermal stability of the composites by the introduction of kaolinite. 22 Hematite is a mineral that contains iron oxide as its main constituent. It is widely available in soil and rock and is majorly used as gems in jewellery. Ilmenite is another mineral from titanium–iron oxide and used as an ore for extraction of titanium. Investigations on composites developed by reinforcing hematite and ilmenite particles concluded that the shielding property of the composite is enhanced by decreasing the particle size of both the minerals. 23 Similarly there are several other minerals which by proper processing may be utilized as reinforcements in polymeric composites. Limestone is a naturally occurring mineral which is mainly used by the cement industry for manufacturing of Portland cement. Limestone along with bamboo has been used by He et al. 24 for preparing a composite floor and suggested that limestone particles suits well for making composite and improved the strength, elasticity and comfortableness of the floor. There is a research gap on the use of limestone as reinforcement in a proper polymeric composite. This made the author to choose limestone as particle reinforcement and jute in woven form to make a polymeric composite. The particle sizes have been varied and the influence of particle size on the mechanical characteristics have been investigated and presented in this study.
Materials and methods
Limestone is composed of three main minerals namely calcite (82%), quartz (15.5%) and dolomite (2.5%). Limestone particles in the size of 0.2, 0.4, 0.6, 0.8, and 1 mm are supplied by Parasakti Cement Industries (Guntur district, Andhra Pradesh, India). The limestone particles are cleaned by washing it in soap water to remove the impurities and washed thoroughly in distilled water and finally dried. 25 Jute in 0°/90° woven form is taken as the supporting reinforcement and polypropylene is used as the matrix resin. Five composite samples have been prepared with 20 wt% of limestone particles, 10 wt% of woven jute and 70 wt% of matrix. The size of limestone particle in first composite is 0.2 mm and named as LS02. In the same way, composites with 0.4, 0.6, 0.8 and 1 mm particle size are named as LS04, LS06, LS08 and LS10, respectively. The composites are developed by compression moulding technique and the composites are prepared in the size of 300 × 300 × 8 mm3.
Mechanical properties are tested for the developed composites according to ASTM standards. Tensile testing is carried in accordance with ASTM D638 and the composite is cut in the shape of a dog bone and positioned in between the jaws of the universal testing machine. Flexural strength is recorded during a three-point bending test in accordance with the ASTM D790 standard. The test sample is cut in the rectangular shape and placed over the movable jaws which make a simply supported beam. Compression testing is done in accordance with the ASTM D695 standard. The sample is cut in a square shape and placed in between the movable jaws of universal testing machine. The stress–strain curve, ultimate strength and maximum strain before failure are recorded during these tests. Impact energy is recorded in the impact test conducted on the test sample cut in the shape of a rectangular piece with square cross section. A notch angle of 45° is maintained according to the ASTM D256 standard. During each testing, three samples have been cut for each of the composite, and tests are performed three times. The average of three readings is taken as the strength of the composite. Hardness of the composites is measured by Shore D hardness test. During hardness testing, the test indenter is made to indent at five different places on the surface of the composite according to ASTM D2240. The average of five readings is taken as the hardness of the composite. The shape of composite samples during each test is shown in Figure 1.

Composite samples for testing (a) tensile test, (b) flexural test, (c) compression test and (d) impact test.
Results and discussion
To investigate the quality of composite fabrication technique and also to study the interaction between the fibre and the matrix in a qualitative manner, the surface morphology of the fabricated composites is studied using scanning electron microscope (SEM) as shown in Figure 2. The distribution of limestone particles in the matrix is clearly viewed in the morphology and found to be uniform and widespread in all the composites. The particle size seems to be uniform in each composite, and there is no evidence for mixing of two unequal sized particles. There are very few cavities and micro holes present in the composite with medium- and large-sized limestone. This shows that the bonding of limestone with the matrix declines with increase in the particle size. In very few areas, limestone is not observed and those areas are called voids. Also, there is no presence of excess irregularities like high peaks and low valleys in the morphology. This shows that there is a uniform filling of the resin in the mould, and the resin has widely moved in all the directions during the composite fabrication. The overall morphology of the composites is found to be good with a widespread of particulates in the vicinity of study.
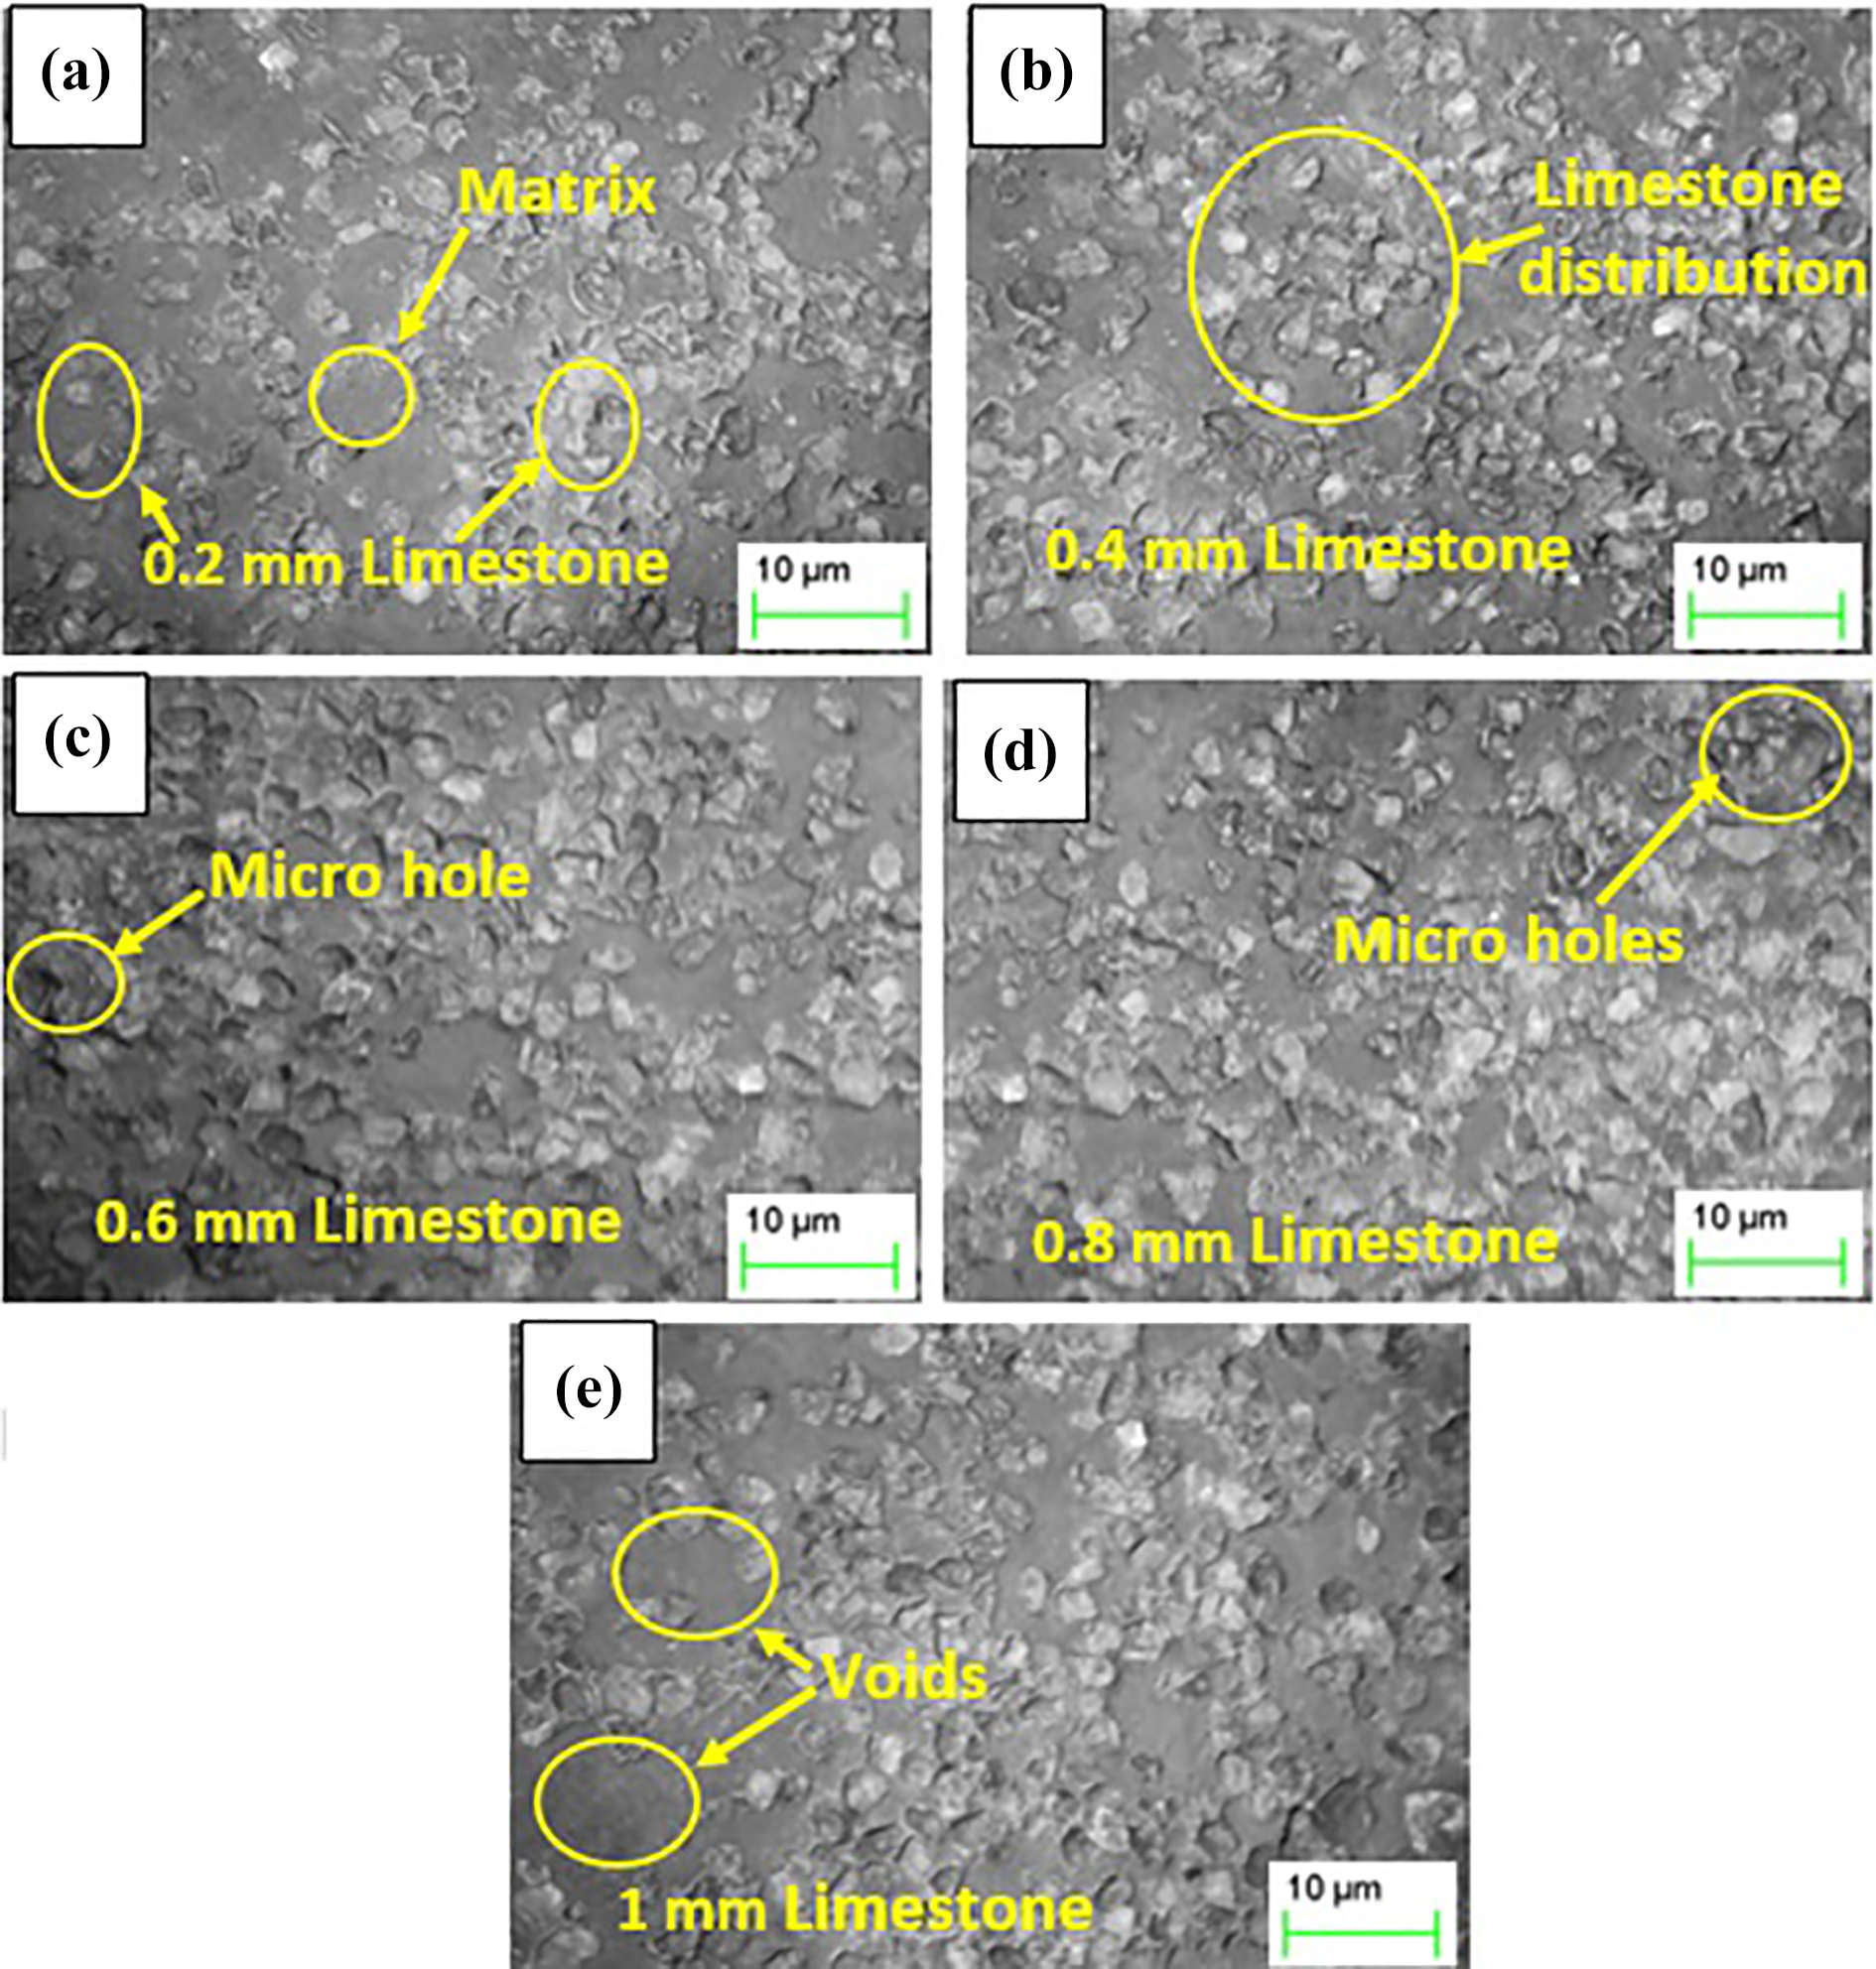
Surface morphology of the prepared composites: (a) LS02, (b) LS04, (c) LS06, (d) LS08 and (e) LS10.
Tensile strength analysis
The tensile strength plot for the fabricated samples is presented in Figure 3. Tensile strength goes up with the hike in particle size until 0.8 mm and thereafter it is diminishing. A 0.2-mm hike in the particle size enhances the strength by 2.46 MPa, and a 0.4-mm hike in the particle size improves the strength by 6.21 MPa. The maximum hike of 14.7 MPa is observed by increasing the particle by 0.6 mm and the maximum tensile strength is observed to be 18.74 MPa for the sample LS08. With further increase of 0.2 mm in particle size, the tensile strength drops to 13.4 MPa. This shows that a too large-sized limestone particle is not suitable for improving the tensile strength of the composite. 26 A similar result has been presented in another study and revealed that small-sized particles have more interfacial adhesive bonding with the surrounding matrix than large-sized particles. 27 It has been observed that the optimum size is 0.8 mm for obtaining a maximum tensile strength.

Tensile strength plot.
The tensile stress–strain curve is shown in Figure 4. It has been observed that all the composites behave like a pure elastic material in the low strain region from 0% to 2.5%. This is revealed by the straight line portions at the inception of the curves. As the samples are stressed further in the high strain region, they start to behave like a plastic material, and this maintained until the ultimate point as observed from the plot. The plastic property occurs because of the damage of the matrix in the form of deformation and microcracks. This leads to breakage of bond between the particles and the matrix, and hence there will be a decline in the stress. 28 The behaviour of composites after the ultimate point is quite different from each other, and this takes place due to the variation in the particle size in the composites. Except the sample LS10, the tensile stress of all samples decreases to a certain extent before the breakage. Also, it has been observed that the rate of decrease in the tensile stress goes on decreasing with the increase in particle size. Sample LS10 behaves like a pure brittle material in which there is a sudden breakage after the ultimate point. The strain behaviour of all the composites is presented in Table 1. Sample LS02 shows an extended elongation of 7%. It has been observed that as the particle size is increased in the composite, the elongation at break goes down. A minimum elongation of 5.5% has been found in composites LS08 and LS10. This behaviour is quite opposite to the tensile strength where the strength is enhanced with increase in the particle size. Hence, for any application where there is extended strain, the use of composite with minimum particle size will be the correct option.

Tensile stress–strain plot.
Strain behaviour of composites.

Flexural strength analysis
Flexural strength represents the ability of a body to withstand the bending load. The test is carried out using a three-point bending technique. Hence, the sample is placed in between two simple supports, and the load is applied at the middle of its span. Flexural strength plot is shown in Figure 5. The plot almost resembles like the tensile plot with a maximum flexural strength of 54.75 MPa for sample LS08. Like the tensile strength plot, flexural of composites increases with the increase in the particle size until 0.8 mm and then decreases with further increase. A 0.2-mm hike in the particle size enhances the flexural strength by 5.48 MPa, and a 0.4-mm hike in the particle size improves the strength by 9.13 MPa. The maximum increase of 18.25 MPa is observed by increasing the particle by 0.6 mm. With further elevation of 0.2 mm in particle size, the flexural strength drops to 1.82 MPa. This shows that the composite with 0.8 mm particle size is highly effective in dispensing load applied over a large area. This helped the composite to offer more resistance to crack propagation and thus increases the strength of the composite. Hence, the composite with a particle size of more than 0.8 mm is not suitable for enhancing its flexural strength.
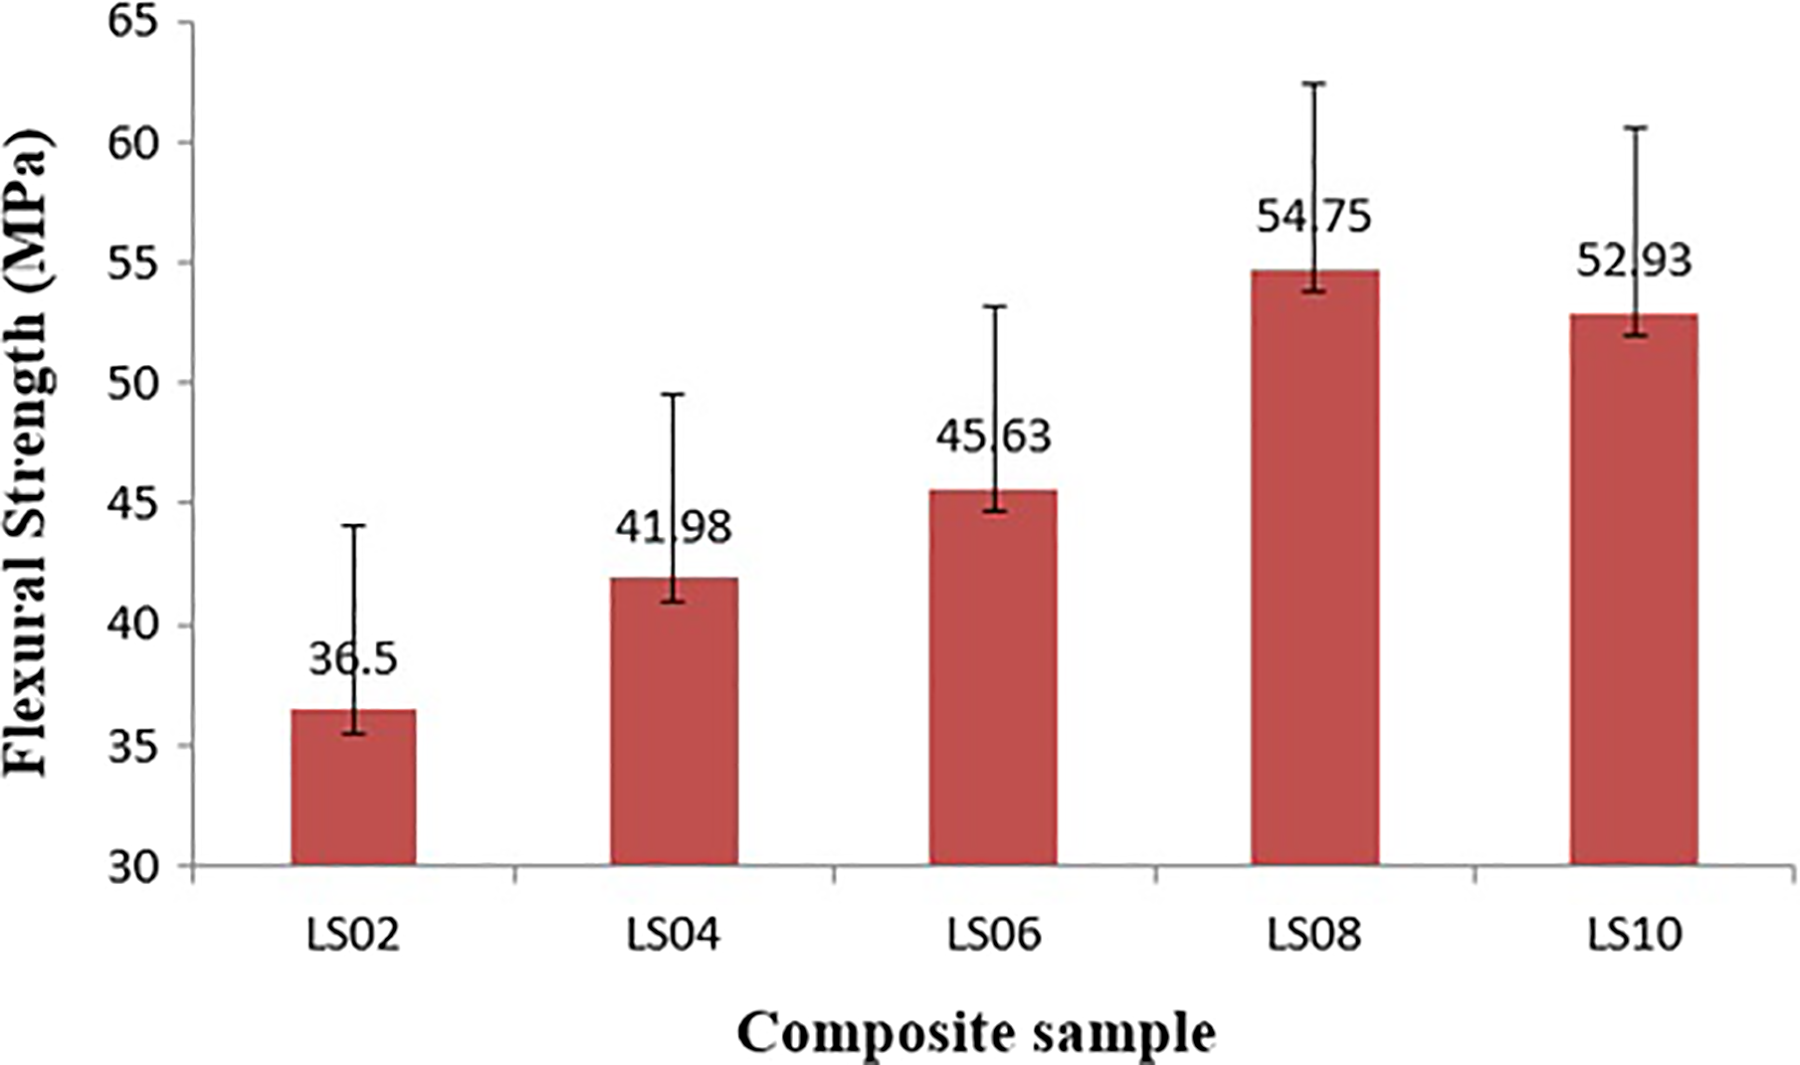
Flexural strength plot.
The flexural stress–strain plot is presented in Figure 6. The curves show an elastic behaviour only up to a very low strain of 2%, and thereafter all the composites show a plastic behaviour as seen from the non-uniform increase until the ultimate point. As compared to the tensile stress–strain curve, none of the composite shows a sudden breakage after reaching the ultimate point. The flexural stress increases, reaches the ultimate point and then drops slightly before breakage for all the composites. A maximum strain of 7% has been observed in composite LS08 and a minimum strain of 6% is found with composite LS02 as shown in Table 1. This shows that the strain increases with the particle size until 0.8 mm and then decreases. This behaviour is quite different from an earlier research on snail shell powder-reinforced composites in which it has been reported that the flexural strain decreases with an elevation in the particle size. 29 Hence, it is evident that the behaviour of composites is not always similar in nature. It is highly influenced by the properties of the particle, selection of particle size, magnitude of load applied and size of the composite. The strain behaviour of composite samples is quite different from its tensile elongation behaviour. It is clear that the composite LS08 is found to be suitable for maximum flexural loading and also for an extended bending strain.

Flexural stress–strain plot.
Compression strength analysis
The compression strength of all the composites is shown in Figure 7. Like the tensile and flexural strength, composite LS08 does not show a maximum strength. Here, the compressive strength increases with the increase in the particle size until 0.6 mm and then start to decline with further increase. A 0.2-mm hike in the particle size increases the compressive strength by 23.35 MPa and a 0.4-mm increase in the particle size enhances the strength by 78.12 MPa. A further increase in the particle size alleviates the compressive strength gradually but not less than the strength showed by the composite with 0.2 mm particle size. This happens because the magnitude of compressive stress concentration around the particulates increases with a hike in the particle size and due to which the bonding between the matrix and the particulates breaks easily and makes the composite to fail earlier. Also, the composite with a very smaller particle size does not give the requisite barrier to the matrix under deformation during the application of compressive load. 30 Due to this reason, the composite with very small particle size is not suitable for taking high compressive loads. Hence, as far as compressive strength is concerned, a particle size of 0.6 mm must be maintained in the composite to achieve a maximum strength.
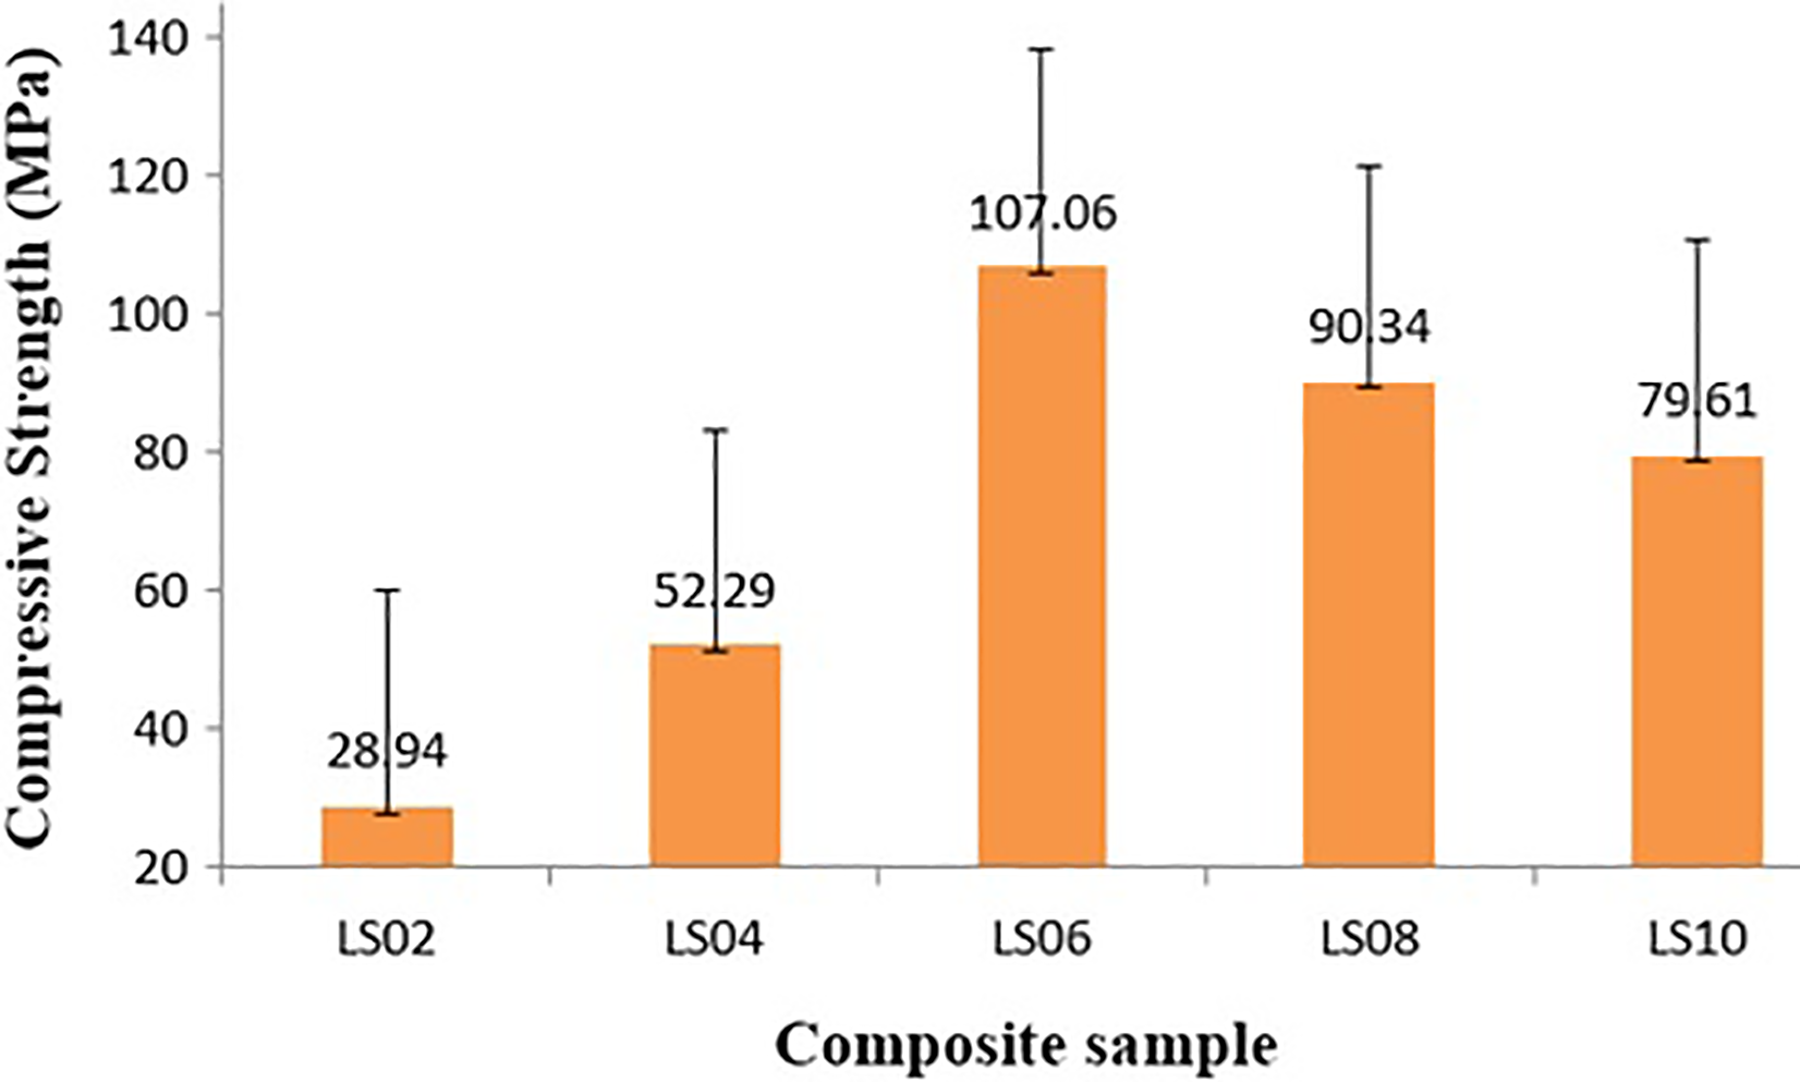
Compression strength plot.
The compressive stress–strain plot is presented in Figure 8. The compressive behaviour of all composites seems to be plastic in nature from the inception to the ultimate point. This is revealed by the non-uniform increase of the curve, and it is observed that there is no much decline in the stress before the breakage like the flexural stress–strain plot. Also, it is observed that all the composites fail at a much lower strain as compared to that of the tensile and flexural behaviour. A maximum strain of 6.5% is observed in composites LS06 and LS08. This is followed by composites LS10 and LS04. The strain is found to be almost proportional to the stress, that is, increase in the particle size increases the strain until 0.8 mm and then decreases with further increase. This behaviour is somewhat similar to that of the flexural strain as the maximum flexural strain and compressive strain are observed in composite LS08.

Compression stress–strain plot.
Impact energy and hardness analysis
Impact energy represents the amount of energy absorbed during the shock loading. The capacity of the composite to absorb maximum energy during the plastic damage of the matrix as a result of breaking of the adhesive bond between the reinforcement and the matrix and also during the breakage of the supporting reinforcement is said to be the impact strength. 30 The impact energy plot is shown in Figure 9. Impact energy increases with the increase in the particle size until 0.8 mm and then it is maintained constant with further increase. A 0.2-mm hike in the particle size enhances the impact strength by 0.3 J and a 0.4-mm increase in the particle size elevates the impact strength by 0.6 J. A 0.6-mm increase in the particle size enhances the strength by 1 J and a further hike in the particle size does not make any significant change in the strength. This behaviour is quite different from the compressive behaviour of the composites and a particle size from 0.8 mm to 10 mm will be suitable for achieving maximum impact strength. This enhancement of impact strength with a hike in the particle size takes place due to the reduction in the stress concentration around the large-sized particulates. As a result, the stress transfer mechanism between the boundaries would be achieved effectively and makes the composite to withstand high impact loads. This behaviour is similar to the previously reported results. 31 Although this behaviour is quite similar to the tensile and flexural strength, it has been shown that the composite LS10 is not suitable to achieve a maximum tensile and flexural strength.
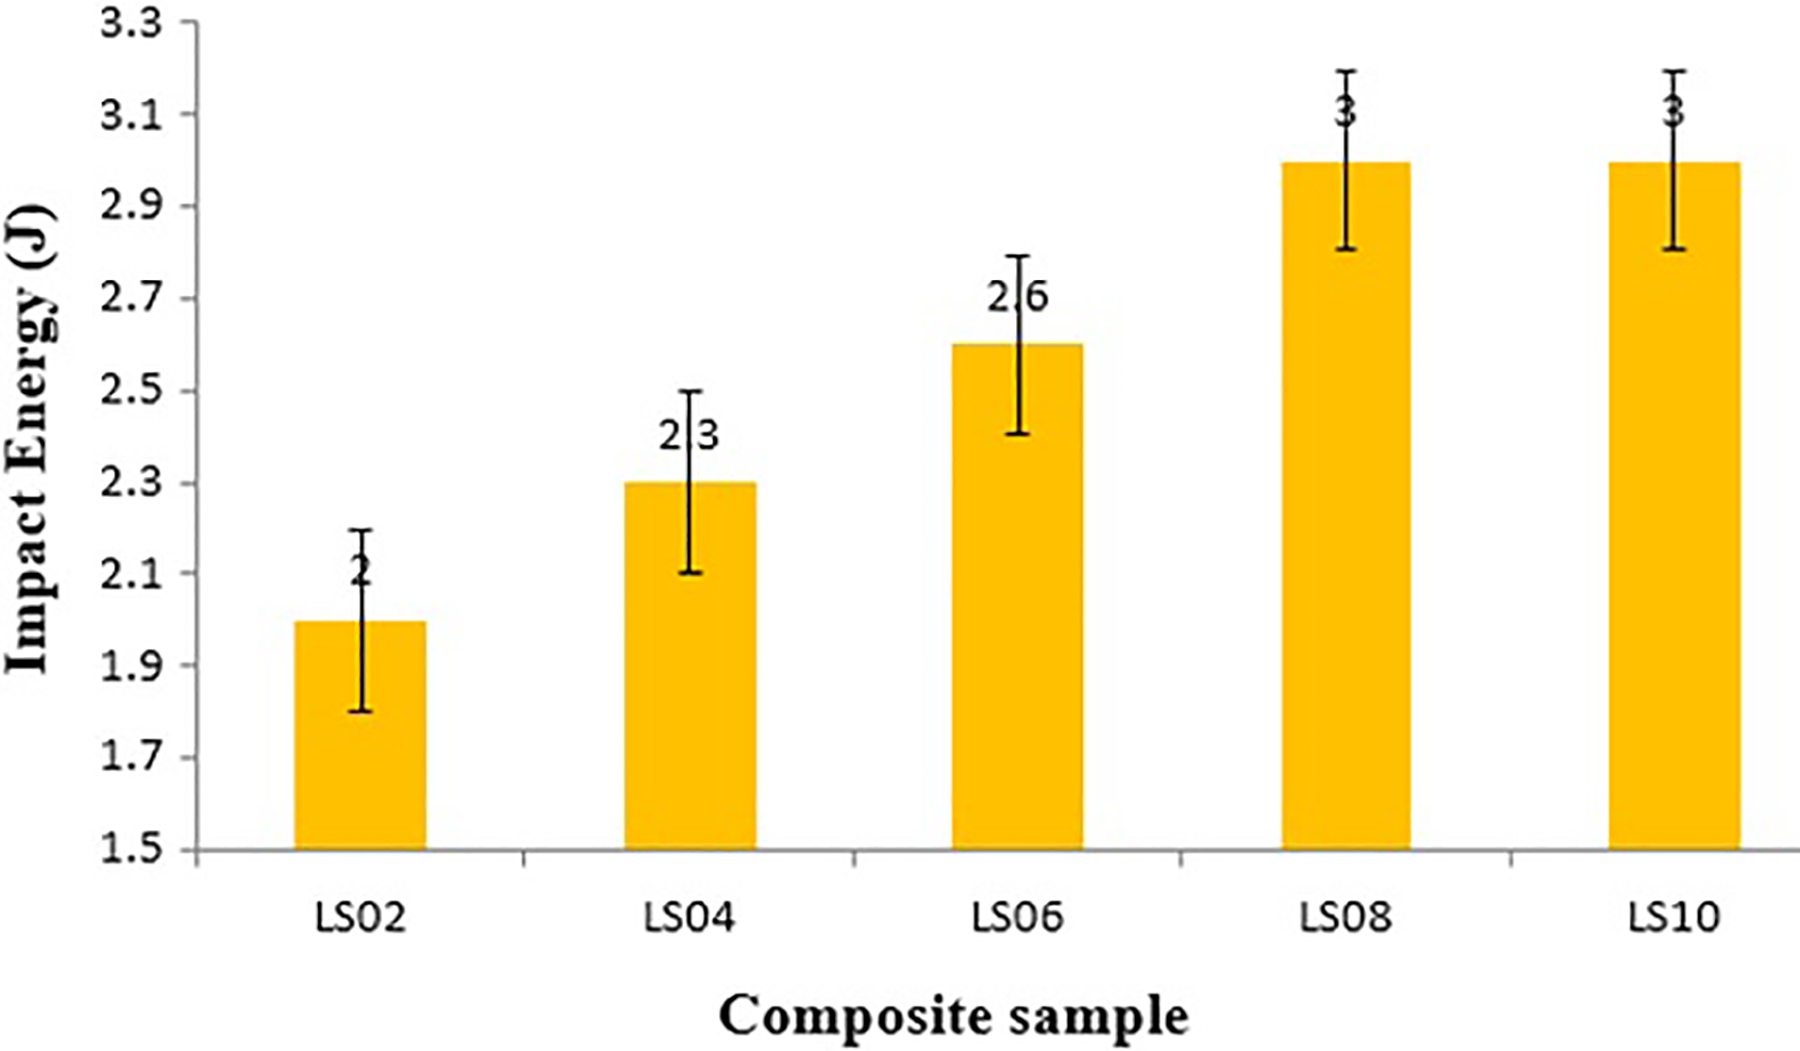
Impact energy plot.
Shore D hardness is measured at five different points on each composite. The average of the five readings is taken as the hardness of the corresponding composite as shown in Table 2. Hardness of a material refers to its ability to offer resistance against forces applied on the surface. Hardness of the composites decreases with the increase in the particle size. A 0.2-mm increase in the particle size decreases the hardness by 3.4% and a 0.4-mm increase in the particle size reduces the hardness by 5.3%. In the same way, a 0.6-mm increase in the particle size alleviates the hardness by 11% and a 0.8-mm increase in the particle size alleviates the hardness by 20%. Hence, there is a gradual reduction in the hardness with a hike in the particle size. This variation is almost similar to an earlier research on wood particle-reinforced polymer composites. 32 Hardness of a material is often compared with its tensile strength as there is a strong relation between them. An elevation in the hardness due to the hike in the particle size affects the tensile strength in an undesirable way. This happens because an increase in the hardness makes the composite to become brittle and loses its elastic and plastic properties. Hence, when a tensile load is applied, it is prone for failure at an earlier stage. This is quantified by comparing the tensile strength plot (Figure 3) and the hardness measurement table (Table 2).
Hardness measurement.

Surface morphology analysis
The morphology of tensile fractured composites is studied using SEM photography under a magnification of 4000× and is presented in Figure 10. The major defects observed in the morphology are formation of cavities, micro-holes, fracture of the matrix, de-bonding of the matrix/particulate and so on. The morphology of composites LS02, LS04 and LS08 majorly shows the cavities which are produced as a result of the removal of limestone particles from its position in the matrix and fracture which happens due to the crack propagation resulting in the breakage of the composite. De-bonding of limestone particles from the matrix is also clearly viewed in composite LS04 which happens due to the breaking of adhesive bonding between the matrix and the particles as a result of the applied tensile load. The presence of micro-holes in composite LS06 is greatly influenced by the movement of the limestone particles from its location during loading at the ultimate point. Due to these major defects, composite samples LS02, LS04 and LS06 are prone to failure at an earlier stage. The morphology of LS08 shows very less defects. There is no presence of cavities, micro-holes and there found to be very minimal de-bonding of particles from the matrix. This shows the evidence of maximum bonding between the particulates and the matrix and helps the composite to bear a maximum tensile load. The morphology of composite LS10 also witnesses de-bonding of the particle which leads to cavities in the matrix. The overall views of the morphologies clearly presented various micro-level deviations in a qualitative manner.
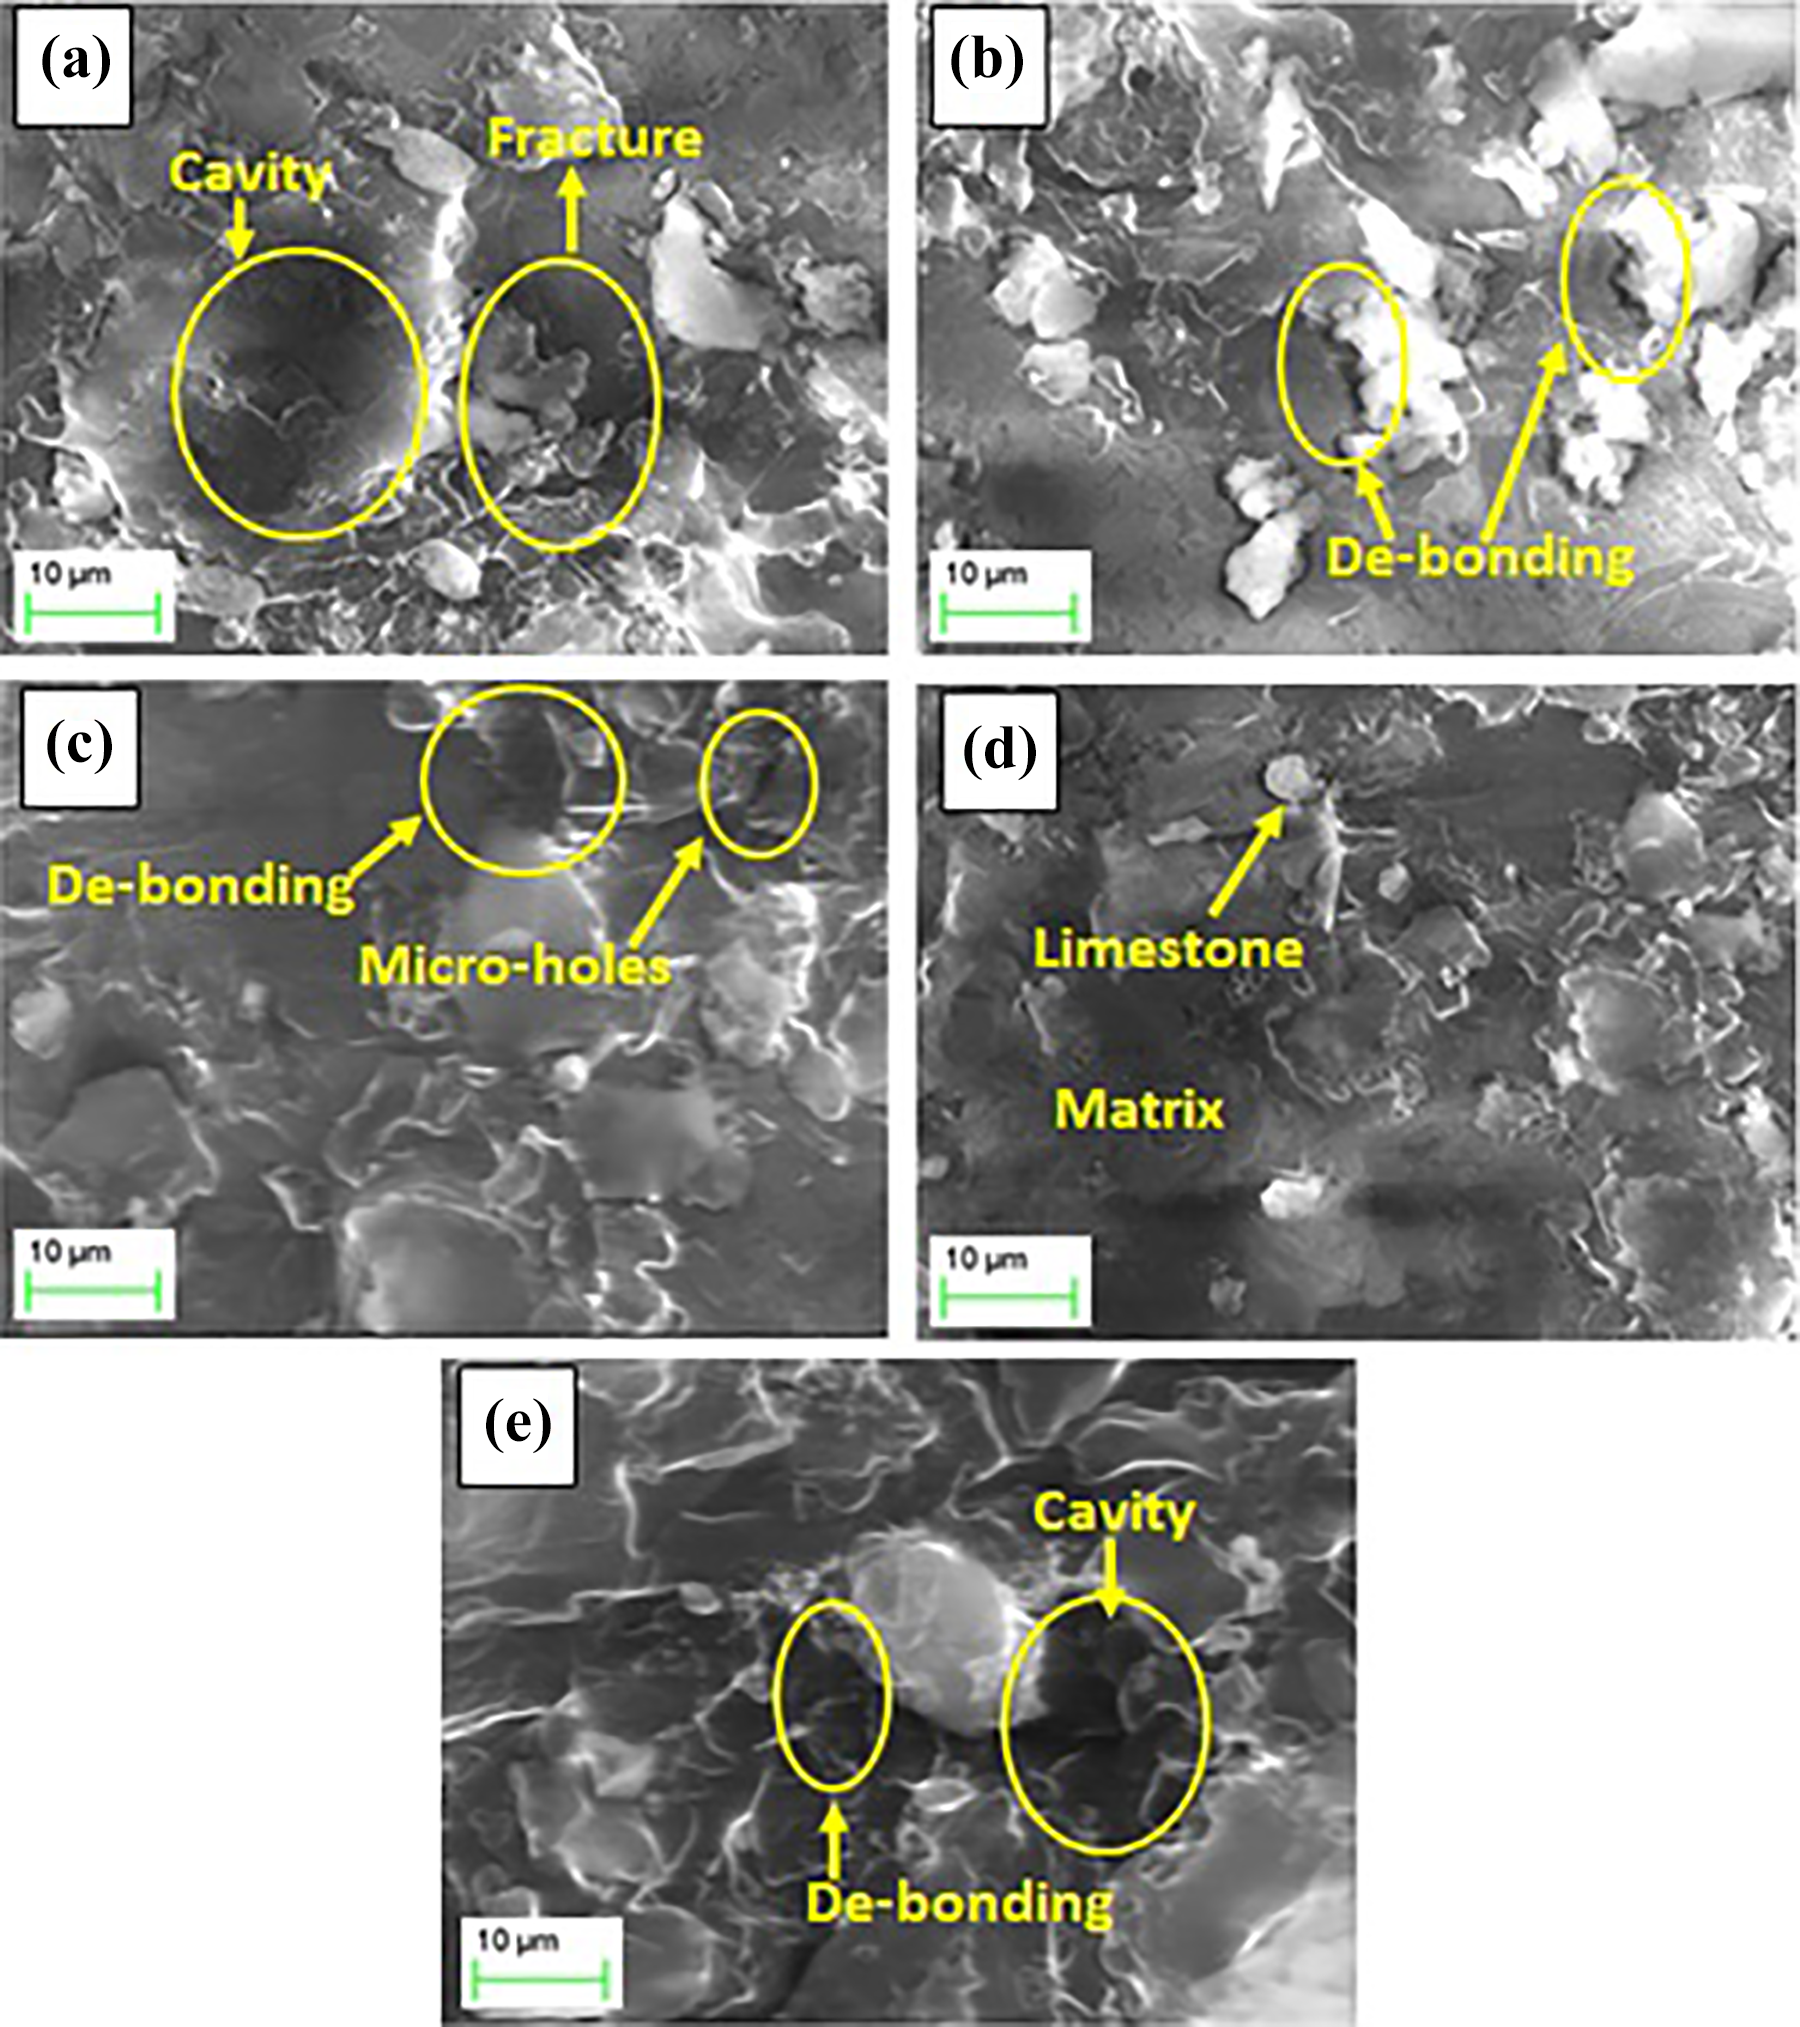
Surface morphology of fractured composites: (a) LS02, (b) LS04, (c) LS06, (d) LS08 and (e) LS10.
Conclusion
In the present study, hybrid composites are prepared by introducing limestone as reinforcement in particulate form. Mechanical characterization has been made based on the variation of particle size in the composite. Tensile strength and flexural strength of the composite goes up with the elevation in the particle size until 0.8 mm and then falls with a further increase. Increase in the particle size increases the compression strength only up to 0.6 mm and then falls with a further hike. Impact strength of the composite also follows a similar trend like the tensile strength, whereas the maximum strength is maintained constantly after a hike from 0.8 mm. Hardness of the composite directly goes down with an increase in the particle size, and this trend is quite opposite to tensile, flexural, compressive and impact behaviours. Hence, a particle size between 0.6 mm and 0.8 mm would be a correct option to obtain highest mechanical strengths with a sacrifice in the hardness. The tensile elongation behaviour is quite opposite to its strength and a maximum strain of 7% is found with composite LS02. The strain at break during tensile and flexural tests is not similar and a maximum strain of 7% is shown by composite LS08. In the same way, a maximum compressive strain at break of 6.5% is found with composites LS06 and LS08. Hence, the selection of particle size in the composite plays a vital role in deciding the mechanical properties. The study also witnessed that each particle size has its own influence on the composite property and fulfilling all the properties to a maximum extent by taking a particle of constant size is difficult. A best overall behaviour may be obtained by selecting a particle size between 0.6 mm and 0.8 mm.
Footnotes
Declaration of conflicting interests
The author(s) declared no potential conflicts of interest with respect to the research, authorship, and/or publication of this article.
Funding
The author(s) received no financial support for the research, authorship, and/or publication of this article.