
Abstract
Carbon material (carbon black (CB) and carbon nanotube (CNT)-reinforced composites are being studied widely. The content of the reinforcing materials is known as the main influencing factor. However, the dispersion of the reinforcing materials is often neglected or, where it is investigated, not thoroughly evaluated. In this article, the dispersion states of carbon materials in the composite materials were quantitatively analyzed using an image processing method. Meanwhile, the reliability of the image analysis was verified through the testing results of the mechanical and rheological properties of the composites. Both CB and CNTs improved the mechanical properties of maleic anhydride-grafted polypropylene (PP)/ethylene propylene diene monomer composites, wherein their dispersion was the dominant factor instead of their content. The dispersion of the easily agglomerated CNT was significantly poorer than that of CB. Therefore, CB was better in inducing the crystallization of PP.
Introduction
Composite material science, as an emerging material discipline, involves many theoretical systems and a wide range of applications. 1 Therefore, it is particularly important to study the reinforcement mechanism of composite materials. Composite materials are produced mainly by blending reinforcement and matrix into a whole under certain conditions, in which the particle-reinforced composite materials are the most common ones. 2 For example, carbon black (CB)-reinforced rubber tire products utilize the active adsorption property of CB to entangle a polymer such as rubber and to improve the mechanical properties of the rubber product. Berki et al. compared the enhancement effects of pyrolytic CB and industrial CB on styrene–butadiene rubber. 3 He et al. studied the mechanical and tribological properties of silica-reinforced silicone rubber. 4 Young et al. explored the mechanism of graphene nanoplatelet-reinforced polymers through theoretical formulas and experimental tests. 5 Various particle reinforcements not only improve the mechanics, rheology, and crystallization of composite materials, 6 but also enhance the electrical and magnetic aspects. George et al. designed and developed a conductive segregated network of multiwalled carbon nanotube (CNT) to prepare high-performance conductive rubber materials. 7 Wetterskog et al. studied the properties of magnetic nanoparticle dispersions by asymmetric flow field-flow fractionation (AF4) and ferromagnetic resonance. 8
There are many factors that affect the particle reinforcement effect. Further, their relationship is also complicated, including the matrix material properties, the content, size, and dispersion of the particles. First, the viscosity or flow properties of matrix materials affect the distribution of the particles and their functional properties. Epoxy resins 9 have good fluidity as a commonly used thermosetting matrix. The particles can be easily incorporated but are also easily precipitated. On the other hand, when a thermoplastic polymer with a high viscosity is used as a matrix, the particles are well suspended but are difficult to sufficiently disperse. Therefore, when selecting different types of matrix materials, processing techniques and agitation methods are taken into consideration. 10 Secondly, the particle content in the composite is considered to have the most important role. 11,12 The role of particles has an increasing trend as the content increases, thereby improving the properties of the composite. However, too much particle content will reduce the relationship between the interfaces, making the particles an impurity in the composite material, greatly reducing its performance. 13 Therefore, the particle content needs to be adjusted so as to optimize the interface between the reinforcement and the matrix. 11 At the same time, the particle size is also an important parameter in determining the interface area. The functionality of the particles is mostly reflected by the interface area. However, sometimes, the agglomeration of the particles reduces the contact of the interface and changes the specific surface area of the particles. 14,15 Pan and Bian developed a new method for studying the effects of aggregation on CNT composites. 16 This method derives analytical expression based on spherical inclusions embedded in the fictitious matrix and then predicts the effective elastic modulus of the composite. The particle dispersion in the composite is also an important factor in evaluating the reinforcement effect. However, the dispersion is a more complicated factor than the three factors mentioned (the function, content, and size of the particles). As a factor concerned, it is difficult to be quantified. 11 From the perspective of theoretical models, Holmes and Morawska outlined the different types of diffusion models available and evaluated the applicability of diffusion modeling for different methods in different environments: with regard to scale, environmental complexity, and concentration parameters. 17 Sumitomo et al. compared the dispersion behavior of aggregated particles in liquid under ultrasonic irradiation and mechanical stirring conditions from a process perspective. 10 However, the characterization of the particle dispersion is important and also difficult to be identified and compared.
This article showed the following two aspects: (1) a direct observation method of collecting image information of the particle distribution in the composite material and quantitatively analyzing it by numerical conversion and (2) an indirect measurement method, obtaining the overall performance of the composite material and verifying it by numerical comparison. Wang et al. analyzed the dielectric and viscoelastic properties of nanocomposites by quantifiable and visual methods. 18
Carbon materials (CB and CNT) with different particle sizes and dispersions were selected. Both particle reinforcements enhance the mechanical properties of the polymer elastomer. Moreover, the two deep-colored particles are more clear when compared to the light-colored polypropylene ethylene propylene diene monomer (PP/EPDM) matrix, 19 -21 facilitating accurate image feature extraction. Since the observation range is on the micrometer scale, the image acquisition method is observed using a microscope. 22 This observation method is relatively simple and convenient for image processing, as well as for verification tests, including mechanical stretching, rheological viscosity, and crystallization changes. 23 -26 In this article, we optimized the process conditions so as to improve the consistency of particle dispersion so that image acquisition and verification tests could be highly representative. On this basis, the test samples were processed in a single batch to ensure a strong reference for the results of the image processing and verification testing.
Experiment
Raw material and sample preparation
PP (maleic anhydride-grafted PP from Saudi Basic Industries Corporation, SABIC, grafting rate: 1.2%) and EPDM (DOW, 4760P) were selected as matrix materials and mixed at the weight ratio of 7:3 in a mixer (08-12-K005 Wuxi Zhongkai Plastic & Rubber Machinery Co., Ltd., Wuxi, China, 08-12-K005). The twin roll temperature of the mixer was set at 170°C.
CB (high-purity carbon powder, 5–10 μm, 1.8 kg·m−3, N330 Shanghai Bai Yan Industrial Co., Ltd, Shanghai, China) and CNT (multiwalled CNTs, 1.8 kg·m−3, Suzhou Heng Ball Graphene Technology Co., Ltd, Suzhou, China) were selected as reinforcing materials and added into the matrix material at the volume ratios of 0.3, 0.5, 1.0, and 1.5%, respectively.
The composite materials were made into small pieces using flat vulcanizer (Wuxi Zhongkai Plastic & Rubber Machinery Co., Ltd., Wuxi, China, QLB-50D/Q) and a pulverizer (Kunshan Jing Quan Crushing Technology, Kunshan, China, XS-02A). The composite materials were used as test samples (Figures 1 and 2) through the miniature twin screw extruder and experimental microinjection molding machine (Shanghai Xin-Shuo Precision Instrument Machinery Co., Ltd, Shanghai, China, WZS10D). The barrel temperature was set to 200

Mechanical test samples.

Rheological test samples.
Microscopic observation and image processing
The composite sheets were placed in a slide and coverslip and pressed into a thin film at a high temperature, while the distributions of CB and CNT in the composites were observed using a microscope (Leica DM 2500P). The carbon material was black, which was in sharp contrast to the white matrix material (Figures 3(a) and 4(a)).

Dispersions of CB in composites (a) ×50 original picture, (b) binarized image, and (c) 3-D columnar distribution (X- and Y-axes correspond to the vertical and horizontal sides, respectively, and Z-axis is the proportion in the cell).

Dispersions of CNT in composites (a) ×50 original picture, (b) binarized image, and (c) 3-D columnar distribution (X- and Y-axes correspond to the vertical and horizontal sides, respectively, and Z-axis is the proportion in the cell). CNT: carbon nanotube.
Since the microscope was used as the point light source, it enhanced the brightness of the central area. For better image processing, the fill light was adjusted to ensure the accuracy of processed results.
MATLAB Open Source Software R2017b(9.3.0.713579) was used to edit the image processing program. The original color image (Figure 3(a)) was converted into a black and white binary image (Figure 3(b)) and the threshold was adjusted to show a clear carbon material morphology. The area ratio of the carbon materials could also be considered. To better visually represent the distribution of the carbon materials, the binary image was divided into 100 cells to quantify the comparison, where the cell height (Z-axis) was the carbon material proportion (Figure 3(c)). The dispersion of CB and CNT was analyzed by comparing the distribution of carbon materials with different contents.
Mechanics testing
The mechanics testing (microcontrol electronic universal testing machine, T-20A, Shenzhen Reger instrument Co., Ltd) involved vertical tensile tests and three-point bending tests. The effects of the different carbon materials on the mechanical properties of the composites were compared, along with an analysis of the influence of the dispersion of the carbon materials on the enhancement effect.
Rheological testing
The rheological samples consisted of a disc with a diameter of 25 mm and a thickness of 2 mm (Figure 2). The temperature of the rotary rheometer (ARES G2 Rheometer, Shanghai, TA Instruments-Waters LLC) was set at 190°C and the rotation range was 0–100 rad min−1. The solid samples were melted under constant temperature conditions, which produced a simple shear flow by the rotary movement of the rotor and reflected the viscoelastic of the composites when flowing.
Differential thermal analysis testing
The composite materials were powdered with a weight of less than 10 mg. The temperature change of a differential scanning calorimeter (DSC Q2000, Shanghai, TA Instruments-Waters LLC) was set to 40–200°C and the temperature change rate was set at 10°C·min−1. The effect of the carbon materials on the thermal behavior of the matrix material was compared and its enhancement effect was analyzed using the ISO-113571. The degree of crystallinity (χc) of the PP phase was calculated as follows:
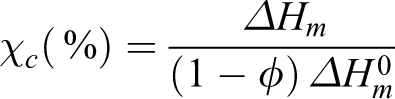
where ΔHm means the melting enthalpy of the samples; ϕ means the mass fraction of PP; and
Results and discussion
Statistical analysis of the image data
The analysis process of the dispersion situation of CB and CNT in PP/EPDM composites is shown in Figures 3 and 4, respectively. A is the image magnified ×50 by an optical microscope. Black particles are carbon materials. Their distribution was random. Due to this, it was also difficult to identify the dispersion of the carbon material using the processing conditions and the dispersant for effective control. From the tone of the picture, the spot and dark layers were clearly observable. The spot formation was the reflection of the light source, which was caused by the crystallization on the material surface. The dark layer was the matrix material with high light transmittance. It was difficult for color to cover the CB material.
Figures 3 and 4 under B show the binary images processed by the Matlab program. The white portion corresponds to the shape of the carbon material in A. The expansion or contraction of the white region was adjusted to enable the shape area to coincide with the A phase. In a contrasting observation, B could be accurate in showing the vital information of the A data, which was the distribution of the carbon material while shielding all bright spots and dark layers. By increasing the content of the carbon material, the white region of the binary image gradually increased and the potential energy between particles became larger. The dispersion level of CB was larger than that of CNT, namely the entropy was larger because it was easy for CNT to agglomerate. The area ratio of the carbon material could also be easily calculated. With the high transparency of the matrix material, it was reasonable to deduce that the white area ratio in the binary image was greater than that of the setting ratio, especially in the CB material.
Figures 3 and 4 under C show the histograms based on the matrix pattern (10 × 10) about the region and content of the carbon material. The X and Y axes of the matrix histogram (C) are related to the vertical and horizontal sides of the binarized image (B) while the Z-axis is the content of the carbon material in each cell. The CB columnar fluctuation was weaker than that of CNT. The matrix histogram was better at visually showing the distribution of the carbon material, but it was difficult to evaluate the dispersion of carbon material with different contents.
Figure 5 shows the dispersion comparison of CB and CNT with the use of the statistical data of C in Figures 3 and 4. The horizontal axis represents the area ratio of the carbon material, which is an integer value. The vertical axis represents the frequency in the same proportion, having a total of 100 times. The curve graph showed the distribution result of all the hundred values, while the dot plot intended the result of an area ratio of less than 10%. By increasing the carbon content, the distribution curve shifted to the larger direction. Here, CB was more obvious than CNT along the direction. The numerical mean values of CB0.3–1.5 were 0.372, 1.530, 4.508, and 5.397%, respectively. The mean values of CNT0.3–1.5 were 0.279, 0.611, 1.116, and 1.546%, respectively. For CB, the calculated area ratio was greater than that of the setting volume ratio. From Figures 1 and 2, it could be noted that the transparency of CB was low, while CB in the inner layer was seen in the highly transparent matrix material. Therefore, in the same volume ratio, the volume ratio of CB was significantly higher than that of CNT. When the content was 0.3%, the volume ratio and area ratio were approximately equal. As the content increased, the dispersion became increasingly difficult to control. The greater the difference between the calculated and setting ratios indicates that the dispersion of the carbon material in the matrix material was less desirable, which would have an effect on the performance of a composite. Among them, the difference values of CB0.3–1.5 were, 0.072, 1.030, 3.508, and 3.897. The difference values of CNT0.3–1.5 were −0.021, 0.111, 0.116, and 0.046. We concluded that the larger difference value means the worse dispersion.
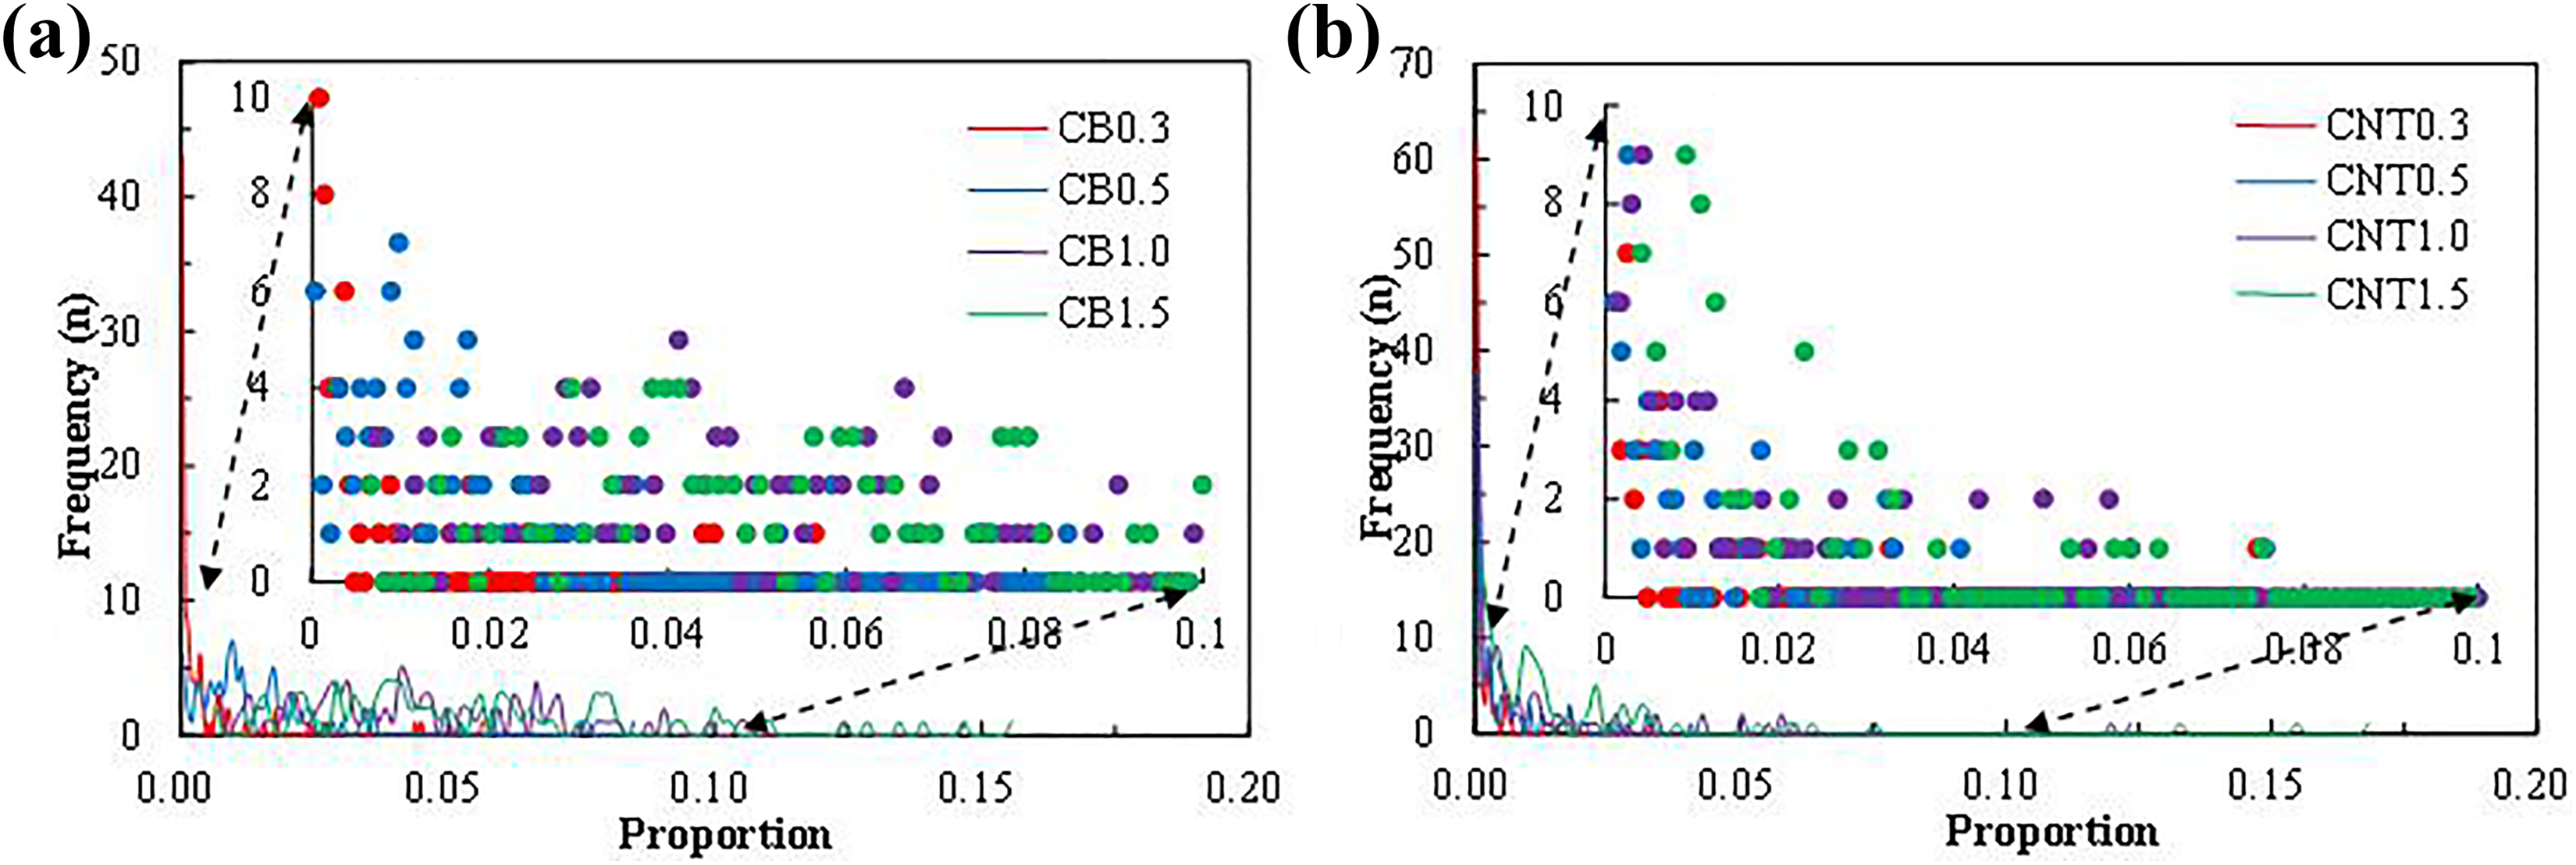
Dispersion comparisons of (a) CB and (b) CNT in composites.
Mechanical properties of the composites
Figure 6 illustrates the tensile results (tensile strength and elongation) of CB- and CNT-reinforced PP/EPDM composite. The carbon material is the node combined several molecular segments into a longer molecular chain. This phenomenon was similar to the increase of the degree of polymerization, thereby enhancing the flexibility of the PP/EPDM composite, namely the enlarging of the tensile elongation. The carbon material mainly used the weak van der Waals force and a portion of a strong chemical bond to absorb the molecular chain segments. The sliding elongation of the segment occurred when the force was applied, thus improving the stress and strain of the composite material. When continuous external force was applied, the molecular segments kept slipping and increased their supramolecular structure, whereby all segments could withstand the external forces until the beginning of a fracture. In this process, the enhancement effect of the carbon material was fully reflected.

Tensile results of (a) CB- and (b) CNT-reinforced composites.
On the whole, the proper addition of a carbon material increased the tensile strength and toughness of the composite. Further, the trends of the tensile strength and elongation results were similar. However, the enhancement effect did not increase completely as the content increased. Particle dispersion may play a more important role relative to the change in particle content. According to the analysis results of Figure 5(a), the dispersion of CB0.3 and CB0.5 was better than that of CB1.0 and CB1.5. Therefore, in the range of a small number of additives, the dispersion of the particles played a dominant role in the properties of the composite. However, the content factor was still an important factor. As seen from the tensile results of CB1.0 and CB1.5, the particle content was positively correlated with composite performance.
As shown in Figure 6(b), the enhancement effect of CNT0.3 was optimal, which shows that the dispersion of CNT0.3 was the best, and the agglomeration phenomenon of CNT0.3 was not obvious, therefore making CNT a better specific surface area to enhance its reinforcing ability. When the dispersion degree was similar and the agglomeration changed linearly, the CNT content factor returned as the dominant one.
Although the bending test is different from the tensile test in force direction, the reinforcing mechanism of the particles is the same. Therefore, as shown in the bending results of Figure 7, the reinforcing effect of CB and CNT on the PP/EPDM composite can also be referred to in the analysis of the tensile results.

Bending results of (a) CB- and (b) CNT-reinforced composites.
Rheological properties of the composites
The dispersion of the carbon materials was highlighted based on its uniformity and particle size. For example, the size of CB was larger than that of CNT, but CNT was easier to agglomerate showing a larger particle size than CB. When rotating with a faster speed, the better dispersion of the carbon material provided greater viscosity of the composite material. In Figure 8, the horizontal axis shows the rotation rate and the vertical axis shows the viscosity value. PP/EPDM, as a reference, had the best viscosity, having 892.12 Pa s at 0.1 rad·s−1. The carbon materials were not-molten inorganic materials and therefore could reduce the viscosity of the composite materials. However, as the content increased, the viscosity did not show a decreasing trend. Similar to the mechanical properties, the rheological properties were also affected by the dispersion of the carbon materials. The poor dispersion and high content of CB1.0 resulted in a low rheological value of the composite. CNT1.5 had a higher degree of dispersion and significant agglomeration, resulting in a high viscosity at a low rotational rate. However, with the increase of the rotation rate, the CNT agglomeration was reduced and the content factor returned as the dominant one. CNT can induce PP crystallization, which enhanced the initial viscosity of the composite. However, CB showed better results.

Rheological results of (a) CB- and (b) CNT-reinforced composites.
Thermodynamic properties of the composites
In Figures 9 and 10, A is the cooling process that can eliminate the thermal history, while B is the second heating process. Adding the carbon material changed the molecular segment structure in the composite, which also affected the energy conversion of the composite. Both CB and CNT increased the crystallization and melting temperatures of the composite, and the former was more obvious. In Table 1, for high-crystallinity materials, such as PP, CNT could induce crystallization as a nucleating agent and increase the melting enthalpy of PP. By calculating crystallinity, the ability of CNT to promote crystallization was verified. Based on the dispersion results, this crystallization capacity was mainly affected by the dispersion. The poor dispersion of CB1.0 and CB1.5 resulted in a significant decrease in crystallinity, while the good dispersion of CNT0.3 led to a significant increase in the crystallinity of the composites. These were the indirect methods of verifying dispersion and their results had essential coherence.

(a) Differential scanning calorimetry cooling and (b) second heating curves of CB-reinforced composites.

(a) DSC cooling and (b) second heating curves of CNT-reinforced composites.
Crystallization and melting parameters of samples.
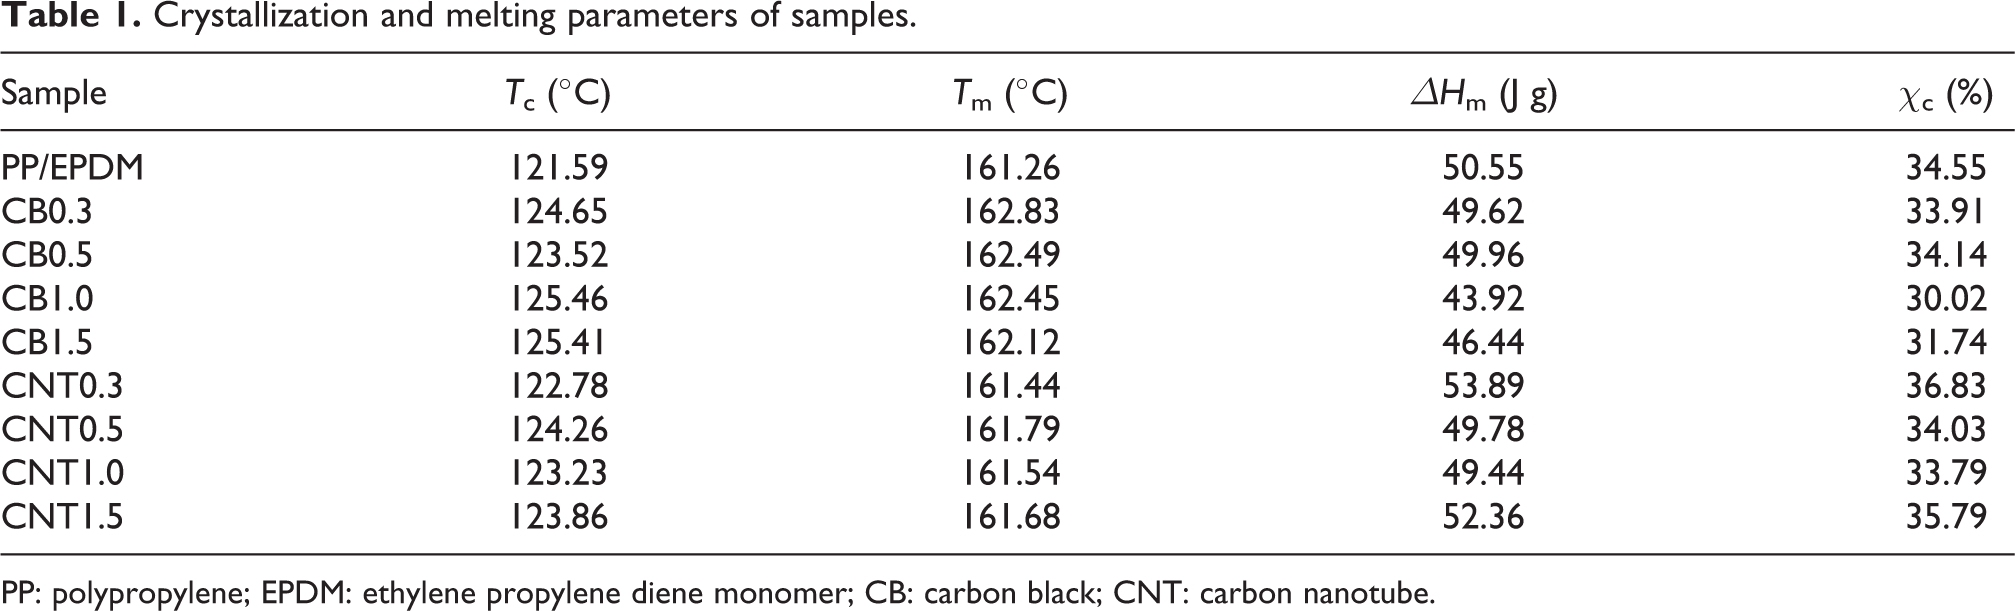
PP: polypropylene; EPDM: ethylene propylene diene monomer; CB: carbon black; CNT: carbon nanotube.
Conclusions
This article evaluated the dispersion of CB and CNT in their reinforced composites. With the use of various image processing technology, the image details of the carbon material distribution were effectively extracted. The performance results of the composite materials were analyzed through indirect measurement methods. The relevance of image information and performance results were validated. This article stressed the importance of the dispersion of reinforcing materials in the enhancement process and provided a solution regarding the quantitative dispersion problem. This research method can be further extended to some functional materials such as conductive rubber. The reinforcing materials should further include graphene as it is currently being researched heavily.
Supplemental material
Supplemental_Material - A study on dispersions of CB and CNT in PP/EPDM composites and their mechanical reinforcement
Supplemental_Material for A study on dispersions of CB and CNT in PP/EPDM composites and their mechanical reinforcement by Xiaohang Tuo, Guizhi Ma, Qian Tan, Yumei Gong and Jing Guo in Polymers and Polymer Composites
Footnotes
Acknowledgment
The authors acknowledge the support from Shanghai Xin-Shuo Precision Instrument Machinery Co., Ltd.
Declaration of conflicting interests
The author(s) declared no potential conflicts of interest with respect to the research, authorship, and/or publication of this article.
Funding
The author(s) disclosed receipt of the following financial support for the research, authorship, and/or publication of this article: This work was supported by the National Natural Science Foundation of China (51773024) and also by Shanghai Xin-Shuo Precision Instrument Machinery Co., Ltd.
Supplemental material
Supplemental material for this article is available online.
References
Supplementary Material
Please find the following supplemental material available below.
For Open Access articles published under a Creative Commons License, all supplemental material carries the same license as the article it is associated with.
For non-Open Access articles published, all supplemental material carries a non-exclusive license, and permission requests for re-use of supplemental material or any part of supplemental material shall be sent directly to the copyright owner as specified in the copyright notice associated with the article.