
Abstract
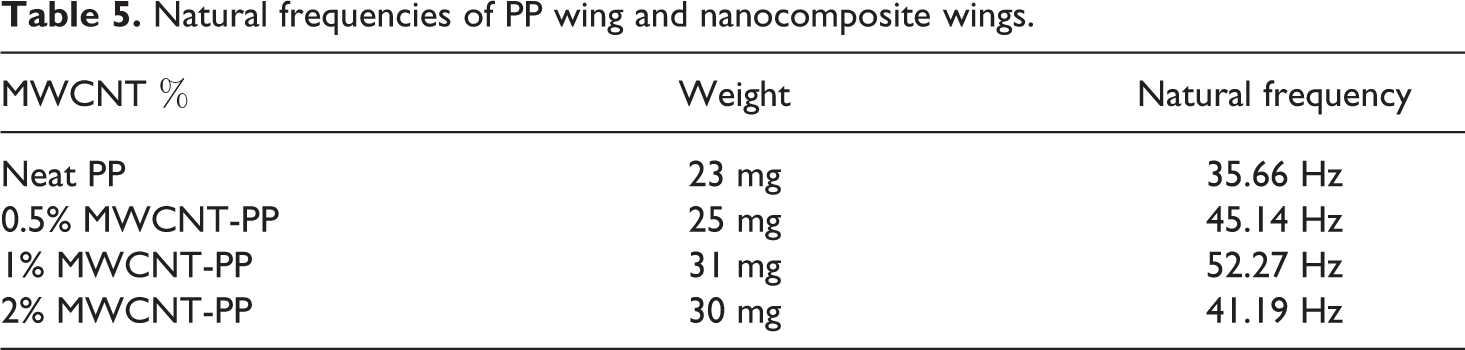
Functionalized carbon nanotubes dispersion in polypropylene is optimized and investigated using thresholding based image segmentation. Carbon nanotubes polypropylene films are developed using solution casting method and MWCNT dispersion is optimized upto 1% MWCNT concentration. Dispersion state is investigated by thresholding based image segmentation and agglomeration estimation method applied on scanning electron microscopy (SEM) images. K-means clustering algorithm is applied further to validate the thresholding algorithm by calculating the MWCNT weight % in processed SEM images. It is found that the proposed clustering algorithm can detect MWCNT concentration significantly upto 1%. To further validate the dispersion studies, developed nanocomposite films are used to fabricate the dragonfly inspired artificial flapping wings. The natural frequency was found maximum for 1% MWCNT-COOH-PP wing at 52.27 Hz.
Introduction
Understanding the principles of flapping flight of small insects and birds has increased, since the mimicking of small scale natural fliers is important in the design of Micro Aerial Vehicles (MAVs) flapping wings.1–5 To study the lift and thrust mechanism of natural fliers during flapping, structural dynamic behaviour of birds and insect inspired bio-mimicked flapping wings is essential to analyse at resonance excitation.6–8 Several polymers such as LDPE (low density polyethylene), PDMS (polydimethylsiloxane) and epoxy variants with carbon nanotubes (CNT) as fibres has already been used to develop thin, flexible and light weighted bio-mimicked flapping wings1,6,7 among which polypropylene (PP) and its composites are one of the most promising materials due to their excellent mechanical properties, easy and cheap availability.9–11 Multi walled carbon nanotubes (MWCNTs) have been identified due to their large aspect ratio (typically in the 100–1000 range), low density, high electrical conductivity, high tensile modulus and strengths.10,12–17 Carbon nanotubes are bonded with high Van der Waals attraction due to which spherulites and agglomerates are developed. This reduces the stress transfer efficiency from matrix to fibre and lead to catastrophic failure of structure. 18 Functionality in carbon nanotubes lowers C–C attraction and improve its dispersion into polymer matrix. Advances in functionality and reliability of CNT-composite materials require careful formulation of processing methods to ultimately realize the desired properties. 19 Due to limited strength of unmodified MWCNTs in composites, 20 functionalization of multiwalled carbon nanotubes (MWCNT) with –COOH (carboxylic group) was reported in increasing thermal stability and strength upto 1% MWCNT concentration as compared to pristine MWCNT.21,22 Research shows that ultrasonic treatment improves dispersion and rheological properties of ultrahigh molecular weight polyethylene (UHMWPE) nanocomposites, 23 however long term and high temperature sonication and curing degrade the mechanical, thermal and physical properties of the material.10,21–24 Despite of numerous attempts in dispersion analysis of nanotubes in polymers,12,14,15 agglomeration quantification is still an ongoing research. Computer vision techniques are proved to be efficient in identifying dispersion state, delamination and damage from microscales to nanoscales.25,26 K-means clustering algorithm was implemented by many researchers27–34 in clustering of acoustic emission data for the analysis of damage mechanism in glass/polyester composites and glass/epoxy composites under delamination. Clusters were correlated to the damage mechanism of composites.
We observed that dispersion study of MWCNT in polymers should contain agglomeration information and weight fraction of filler in support of dispersion algorithm. In the present study, we modified the solution casting process by changing sonication time and incorporating –COOH functionalized MWCNTs in the development of nanocomposites. Surface morphology is observed using field emission scanning electron microscopy (FESEM) and the presence of –COOH functionality is validated by Fourier-transform infrared spectroscopy (FTIR). Agglomeration content is estimated by thresholding based image segmentation technique. An openCV-based algorithm is applied for thresholding operation and agglomeration analysis. K-means clustering analysis was performed to validate the algorithm by calculating MWCNT weight percent in processed images. To further validate the technique, nanocomposite flapping wings made from modified solution casting process are dynamically tested for their natural frequency which was found maximum (52.27 Hz) for 1% sample.
Experimental
Modified solution casting process
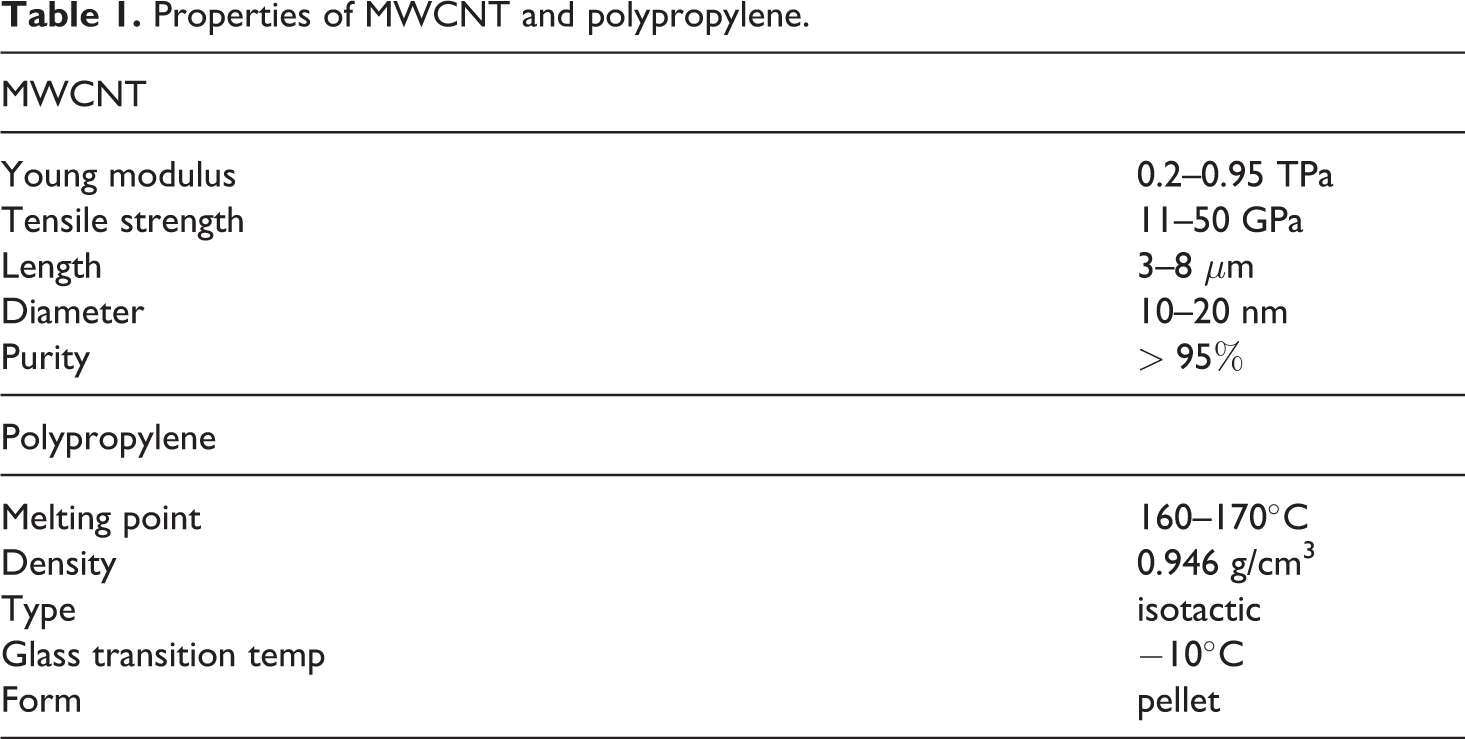
MWCNT-COOH supplied by Nanoshel pvt. ltd. and Isotactic PP supplied by Sigma aldrich are taken as per the properties given in Table 1. Figure 1 shows modified material fabrication details. We sonicated the MWCNT-xylene solution in an ice-bath environment for 30, 60 and 90 minutes in the slots of 15 minutes each and the solution was kept under observation at room temperature upto 24 hours to observe MWCNT dispersion state in xylene as shown in Figure 2.
Properties of MWCNT and polypropylene.
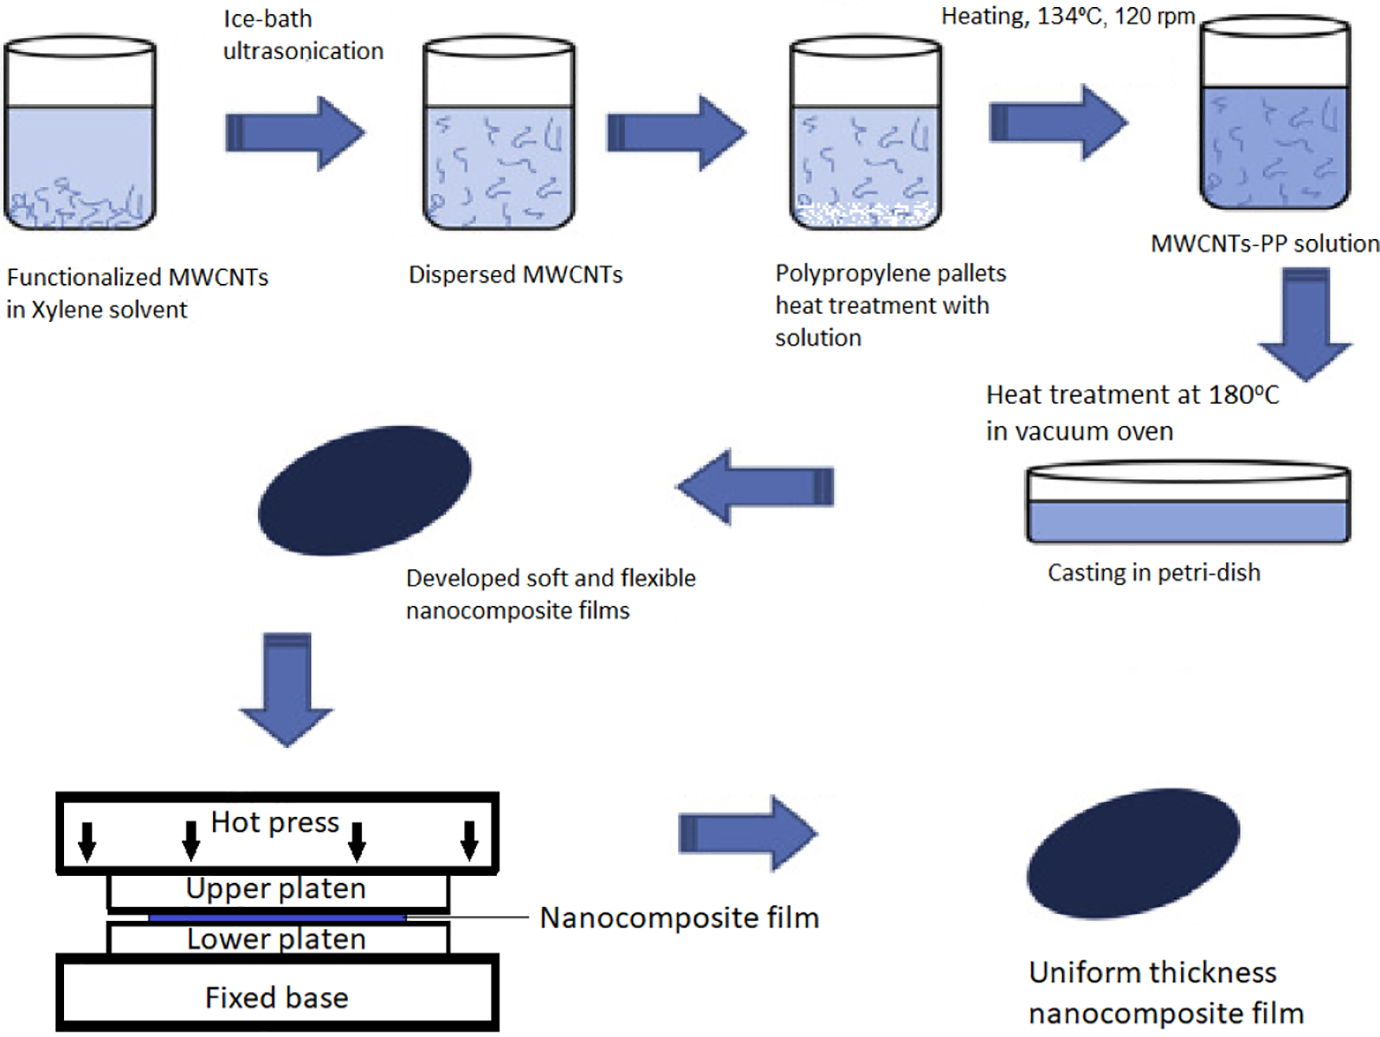
Material development.
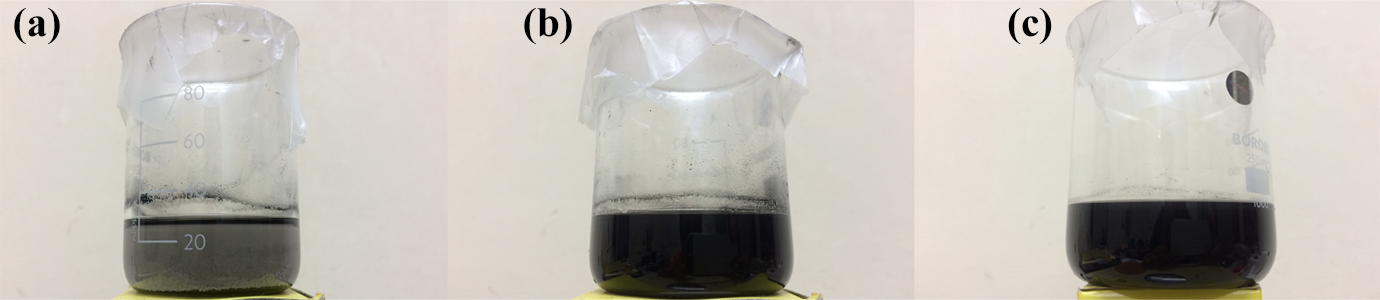
Dispersion state after 24 hour (a) 30 mins (b) 60 mins (c) 90 mins of sonication for 1% MWCNT in xylene solvent.
The solution was then heated with PP pellets (10% g/ml concentration of xylene) at 135°C in a magnetic stirrer using a reflux condensor to prevent the solvent evaporation. The obtained solution was poured in a petri-dish kept in a vacuum oven for heat treatment at 180°C for 2 hours and 140°C for 1 hour to obtain solid film. To maintain the thickness uniformity, the petri-dish was kept over a aluminium base plate, which was levelled horizontal using spirit-level. Nanocomposite films of thickness of the order of 300 microns were developed. Developed films were non uniform in thickness, unsuitable to be used as wing skin, therefore a semi-automatic hydraulic press (capacity 10 tons) was used to uniformly compress the films. Material was kept in between smooth stainless steel plates covered with teflon sheet. This setup was kept in between top and bottom platens of hot press at 250°C and a uniform pressure of 5 tons was applied. The melting point of PP was 160°C–170°C.10,22 As the load decreased, the temperature was reduced to 160°C for heat treatment for 4 hours. The membranes formed, were of thickness
Morphological studies
MWCNT-PP nanocomposites are investigated using field emission scanning electron microscopy (FESEM) to observe nanotubes dispersion. Prior to microscopic observation, samples were gold coated for 40 seconds. Thermogravimetric analysis (TGA) was performed at ramp rate of 4°C per min from room temperature to 100°C. Fourier-transform infrared (FTIR) (Bruker Tensor 27 spectrophotometer, Germany) spectra between the absorption band 700–4000 cm−1 are recorded to identify the –COOH functionality and other chemical structure of nanocomposites.
Uniaxial tensile characterization
Uniaxial tensile tests in displacement control mode are performed at 0.1% strain rate as per ASTM D-882 35 to study the effect of sonication time on strength of nanocomposites. Samples (10 mm width and 80 mm in length) were cut from nanocomposite films and tested in TINIUS OLSEN Universal testing machine with 250 N load cell. 5 samples were tested for each nanocomposite sample.
Thresholding based image segmentation, agglomeration calculation and contour detection
Image processing demonstrates the image characteristics using digital technique including pre-processing, feature enhancement and display of the final image.29,36 Thresholding is probably the most frequently used technique to segment an image. The thresholding operation is gray scale remapping operation “g” defined by Equation 1 and 2.


where f(x, y) represents the grey value at location (x, y) in the given image and t is the threshold value (or pixel intensity).
After thresholding operation, grey valued image is segmented into two segments identified by pixel values 0 and 1, in other terms we can say thresholding maps a grey-valued image to a binary image. So if the intensity of the pixel f(x, y) is higher than threshold, then the new pixel intensity is set to maximum value as shown in Figure 3.
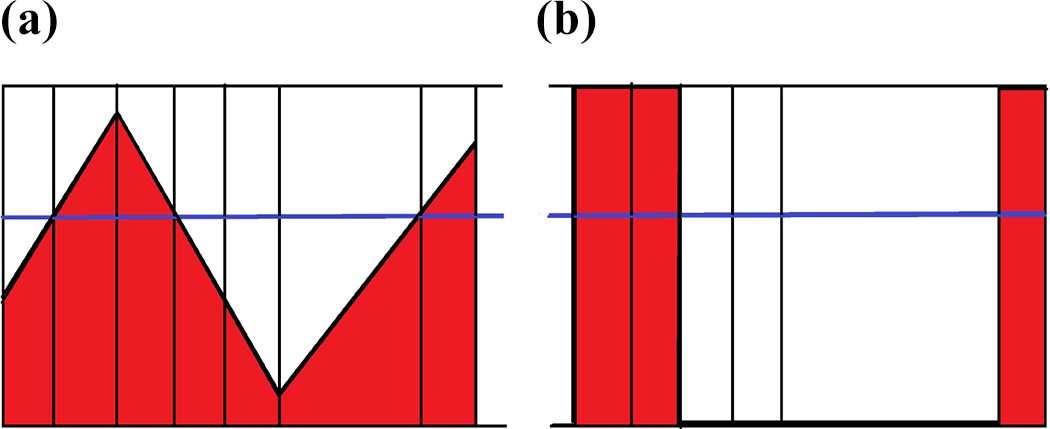
Pixel intensity representation (a) Original (b) After binary thresholding.
Binary thresholding and contour detection
We used a thresholding function as given in Equation 3 using open CV in python, to get thresholded binary image as a result. Thresholding based image segmentation and contour detection were performed using four input parameters named

Binary thresholding technique was applied on the scanning electron microscopic images of neat PP and nanocomposites to detect MWCNTs and agglomerates.
Agglomeration calculation
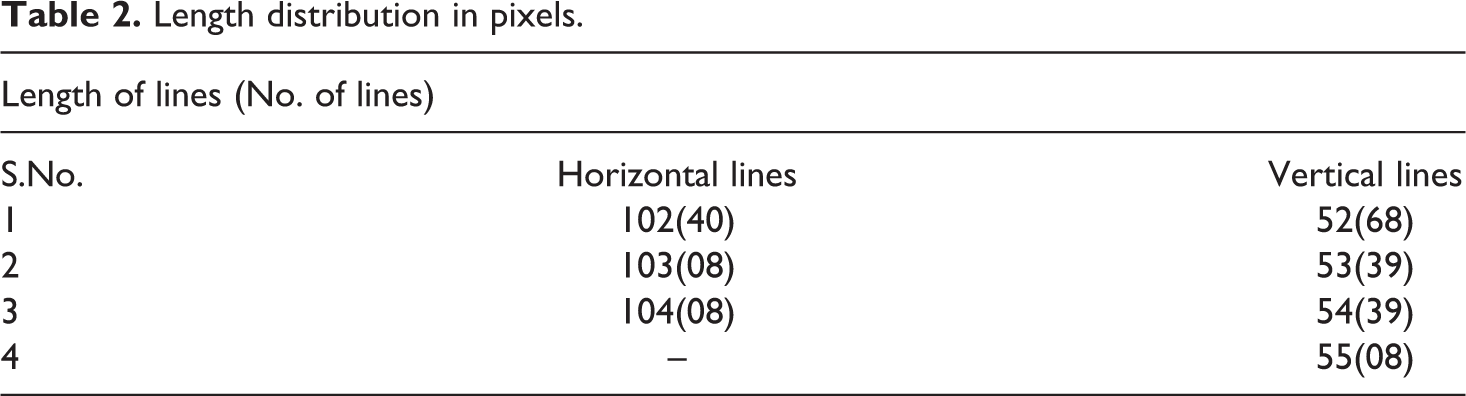
The algorithm was validated first for the detection of horizontal and vertical lines to observe the pixel wise length distribution of horizontal and vertical lines as shown in Figure 4 and 5. The idea was to validate the code for edge detection. The average length of lines and their occurrence, listed in Table 2, was found 102.5 pixels for horizontal lines and 52.91 pixels for vertical lines as shown in Figures 6 and 7. Agglomeration was calculated by detecting the contour area of MWCNTs (in pixel units) and their respective occurrence.

Code validation for horizontal lines.
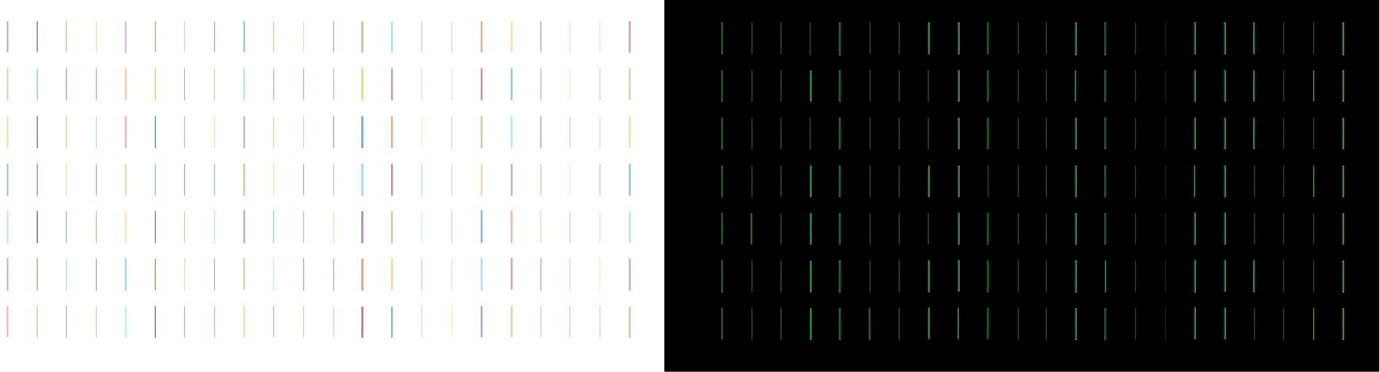
Code validation for vertical lines.
Length distribution in pixels.
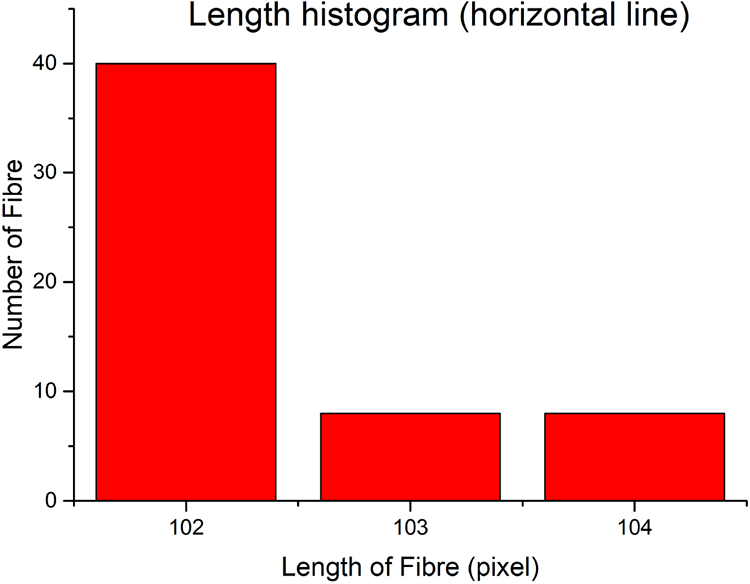
Length histogram for horizontal lines.
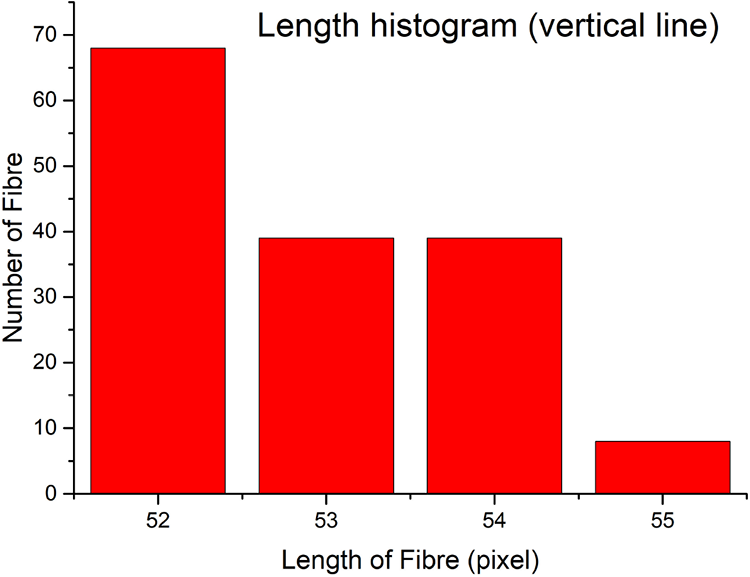
Length histogram for vertical lines.
In present study, OpenCV algorithm stated above, was applied for thresholding of SEM images, contour detection and calculation of MWCNT clusters areas.
K-means clustering for validation of MWCNT concentration
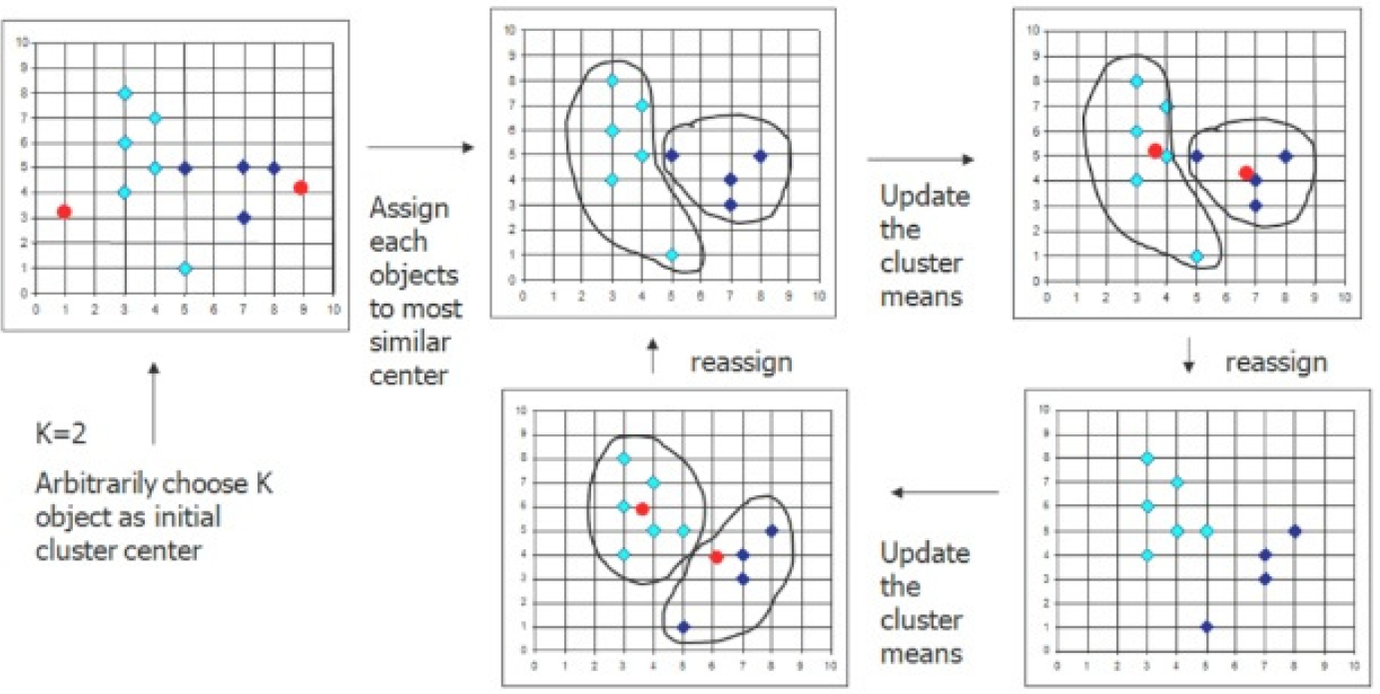
K means clustering is a point based clustering method that starts with the cluster centres initially placed at arbitrary positions and proceeds by moving at each step the cluster centres in order to minimize the clustering error.
27
The clustering aims to partition n observations, into K clusters in which each observation belongs to the cluster with the nearest mean. An optimal solution for a clustering problem with K clusters can be obtained using a series of local searches.27,32 At each local search the
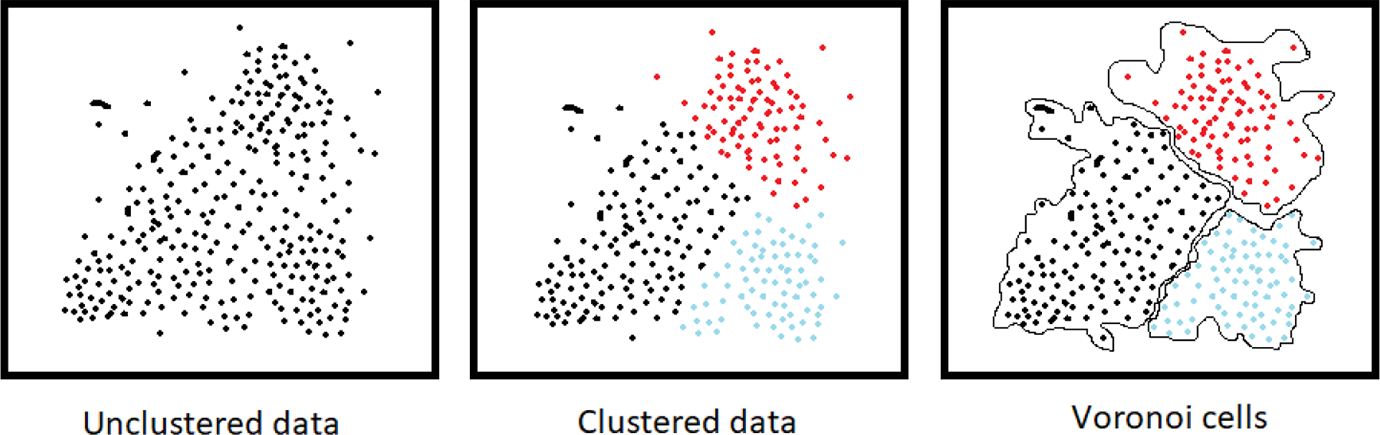
Voronoi cells development from K-means clustering.
Distance metric for k-means clustering
k-means clustering algorithm is based on distance metric between the sample points. Let
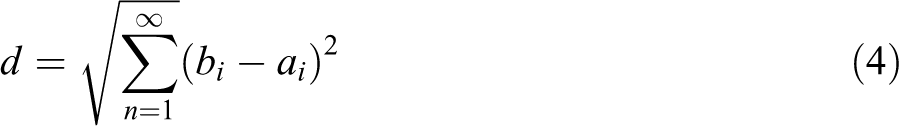
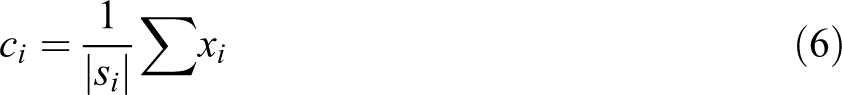
Algorithm starts by arbitrary selection of minimum number of required clusters (k = 2) that takes two random seeds and map the data points to these seeds. Each observation belongs to cluster with nearest mean. The iteration continues till overall penalty term is minimized.28,29 First step is data assignment. Each data point is assigned to its nearby centroid based on square euclidean approach. Based on the distance calculated, an initial cluster centre is assigned for a group of data points called as mean point of clusters. If ci is the collection of such centres in set C, then sample points x are assigned to every centre as given by Equation 5.

Selection of K-value and cluster centroid update
Selection of an optimum k value require the algorithm to be iterated for different K-values by comparing mean distance between data points and their cluster centroid. The centroid is to be updated until the euclidean distance is minimized. K-value depends on keeping the total within-cluster sum of square to be minimum and chosen according to elbow method. 34 The process terminates when there is no change in the k value further when any data point is added and centroid is stabilized. The algorithm iterates between steps one and two as shown in Figure 9.
where
Cluster centroid update.
Voronoi cells development
After clustering the data set for a fixed k-value, voronoi cells are developed. Voronoi diagram is a partitioning of a plane into regions based on distance to points in a specific subset of the plane. That set of points is specified beforehand, and for each seed there is a corresponding region consisting of all points closer to that seed than to any other. These regions are called Voronoi cells. We detected MWCNT contour centroid coordinate with the help of software package
Results and discussions
Morphological study
TGA plot in Figure 10, indicates no significant weight loss in samples in between 20°C to 100°C. Micro structure of MWCNT-PP nanocomposites with 90 secs of sonication is shown in Figure 11. It was observed that upto 1%, nanotubes are well dispersed in matrix with small MWCNT bundles. This could be attributed to reduced Van der Waals energy during sonication between each pair of carbon atoms 21 and functionalization of MWCNTs with –COOH. 10 MWCNT concentration of 2% showed spherulites and clusters of size more than 1 μm. FTIR spectroscopy results are shown in Figure 12. In nanocomposites, the peaks in between 1600–1680 cm−1 correspond to C=C double bond stretching, whereas presence of carboxylic group C=O present in MWCNTs is observed at 1725 cm−1 and 1560 cm−1. The 1560 cm−1 peak is due to the carboxylate anion stretching. Peaks present between 3100 cm−1 to 3625 cm−1 indicates O–H stretching vibrations. Presence of polypropylene constituents include C–H stretch vibration modes identified in peaks between 2800 cm−1 to 2950 cm−1 whereas C–H bending vibrations were identified in between 1376 cm−1 to 1480 cm−1.39–42
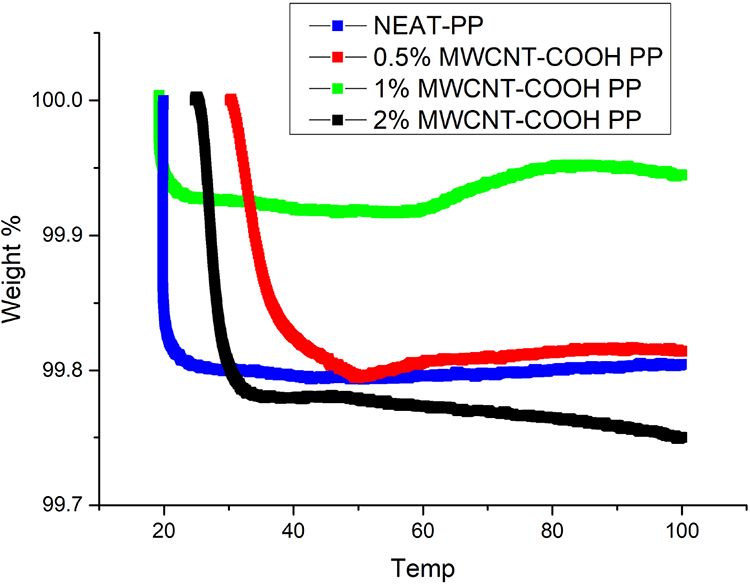
TGA Curves of nanocomposites.
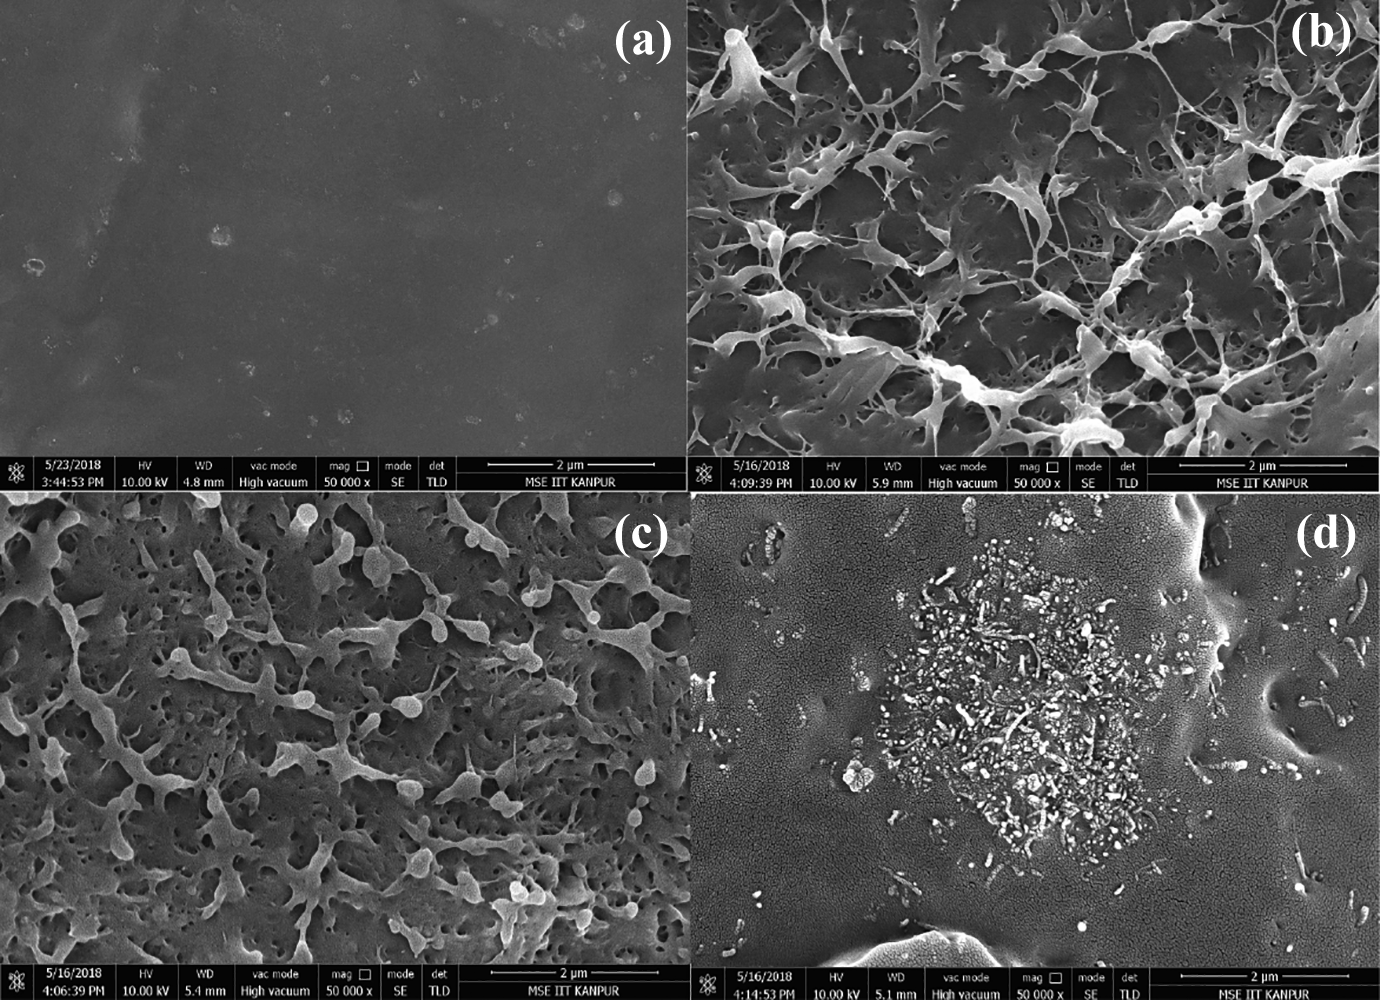
Surface morphology of nanocomposites.
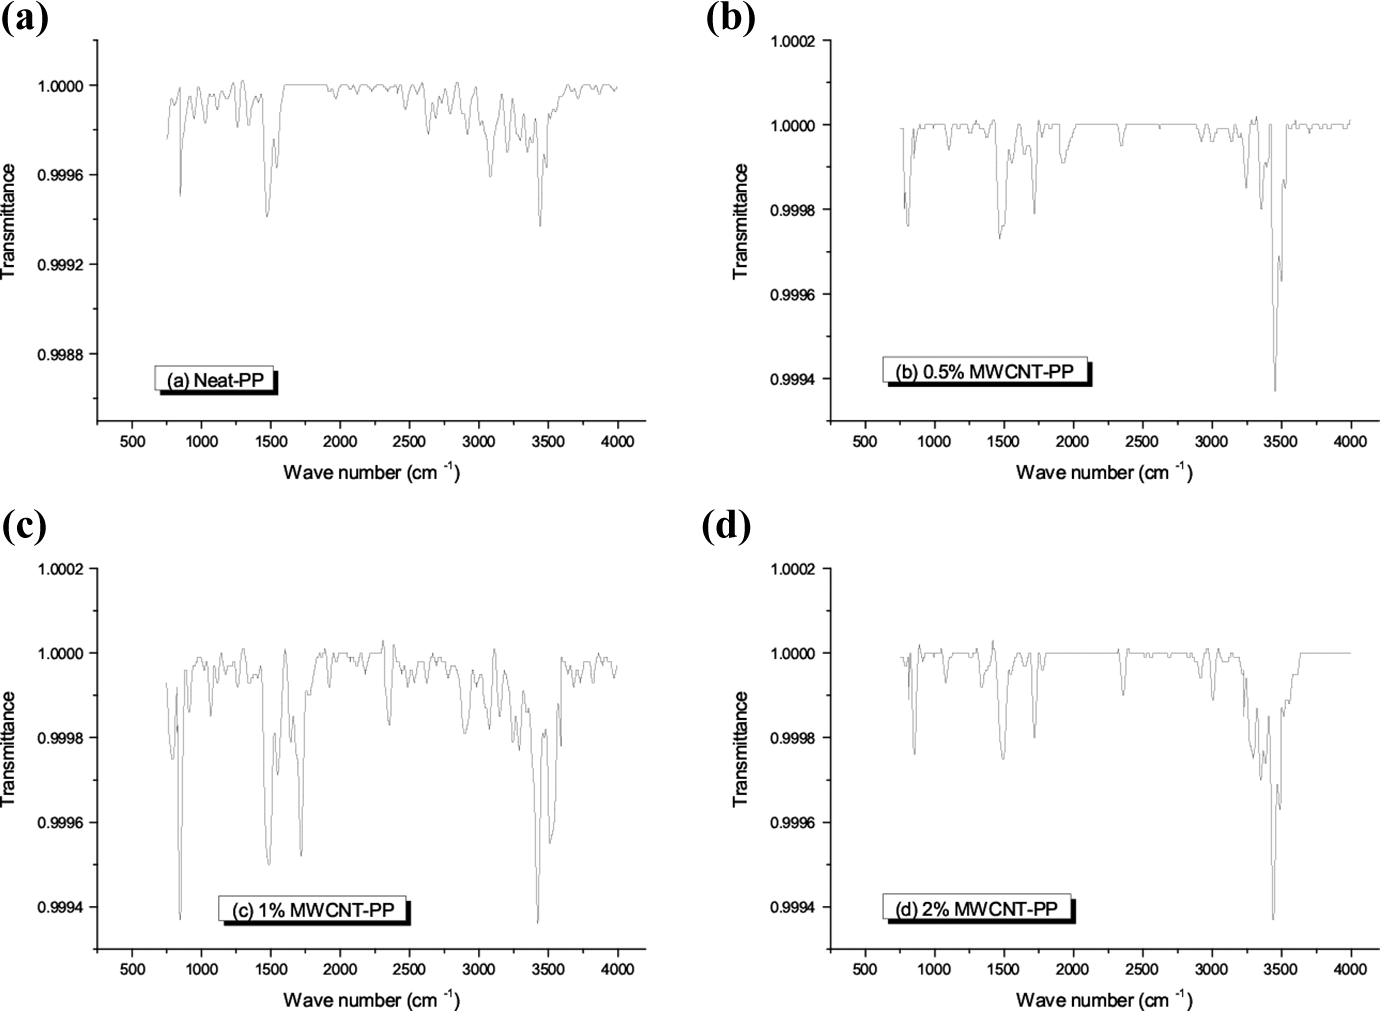
FTIR spectra for (a) Neat polypropylene and (b) 0.5% (c) 1% (d) 2% MWCNT-COOH-PP nanocomposites.
Uniaxial tensile tests
The tensile strength and failure strain of nanocomposites with 90 secs sonication was increased to 24.5 MPa and 3.95% respectively for 1% concentration sample as shown in Figure 13. This could possibly be due to large clusters and agglomerates bonded with high Van der Waals attraction which reduce the material stiffness and stress transfer efficiency from polypropylene matrix to individual MWCNTs.10,18,21,24 As expected, it was observed that even 90 secs sonicated 2% sample also has higher strength as compared to neat polypropylene and vice-versa for sample with 30 secs sonication. On the other hand, lower failure strength 2% sample was observed as compared to neat polypropylene in both 30 secs and 90 secs sonication cases.
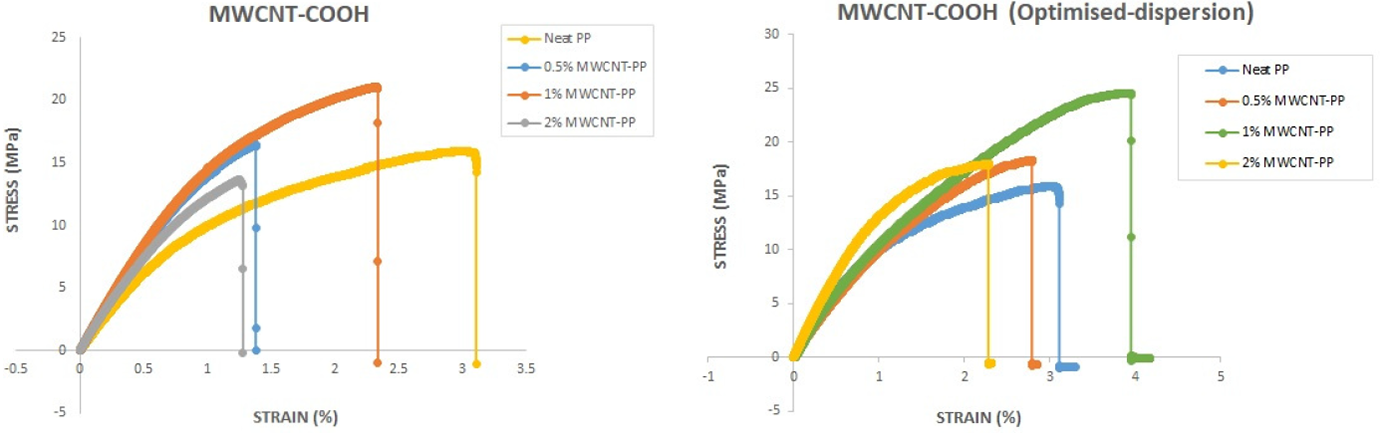
Uniaxial tensile test results for 30 secs sonication (left) and 90 secs sonication (right) of –COOH Functionalized MWCNT-PP nanocomposites.
Thresholding based image segmentation, agglomeration calculation and contour detection
Figure 14, 15 and 16 shows binary thresholding of MWCNT-PP samples. It is evident that thresholding value of 120 shows better cluster visualization as compared to thresholding values of 90 and 150. Therefore SEM images after thresholding value of 120 were considered for clustering analysis.
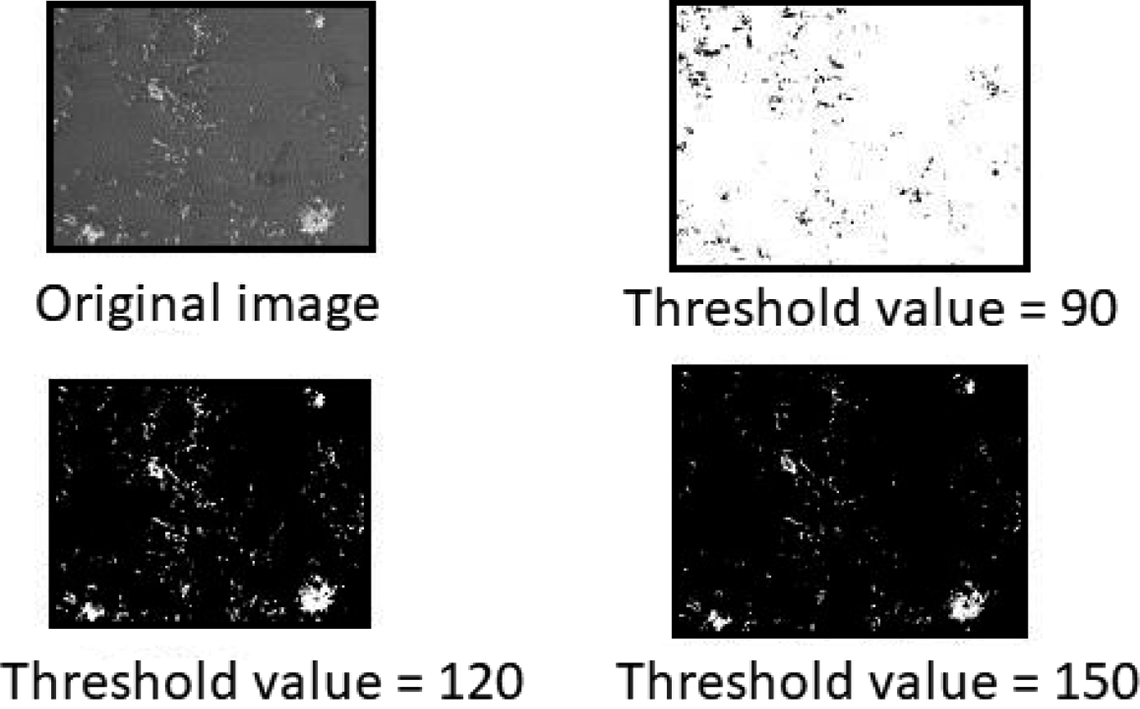
Binary thresholding for 0.5% MWCNT-PP.
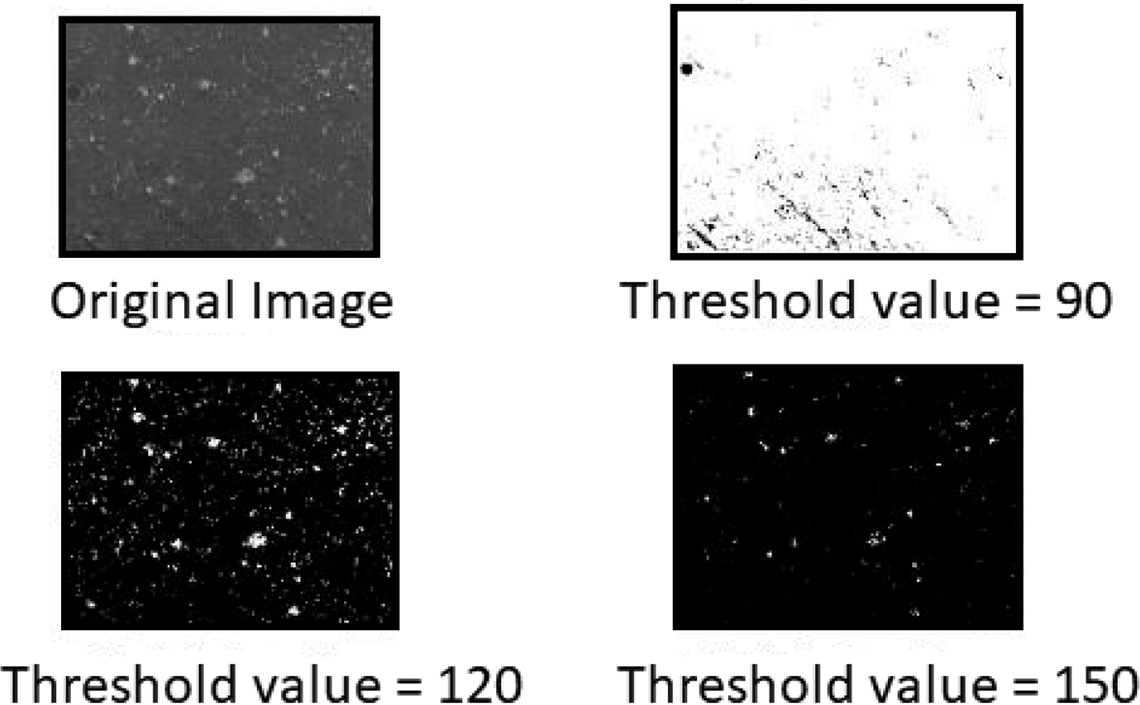
Binary thresholding for 1% MWCNT-PP.
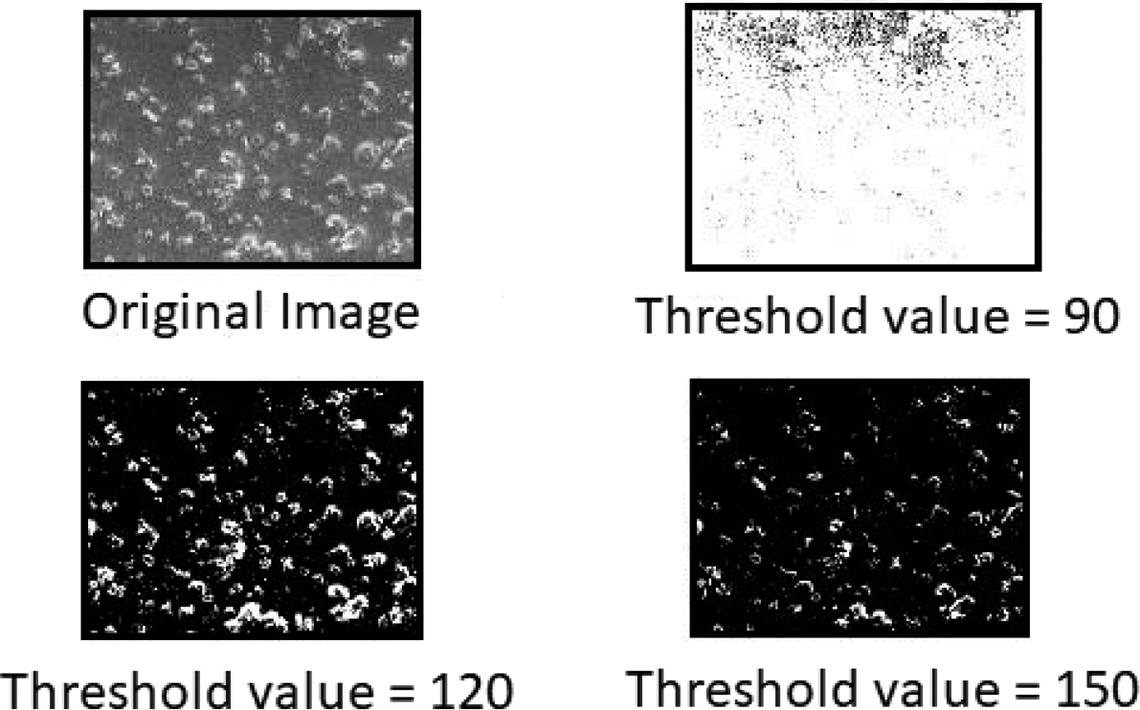
Binary thresholding for 2% MWCNT-PP.
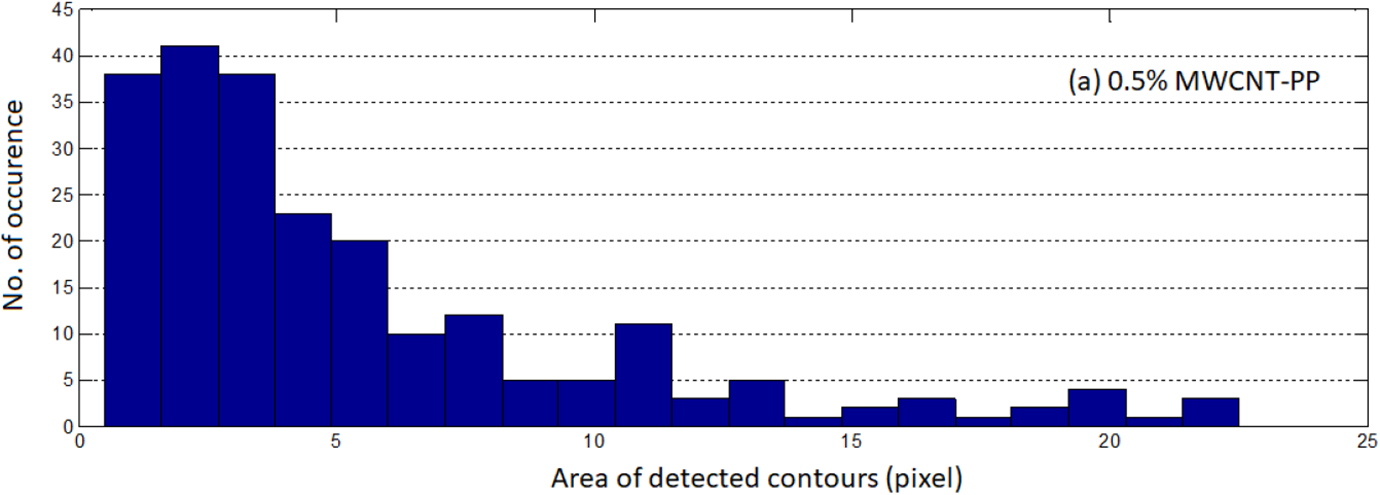
Total number of contours and frequency of their occurrence were obtained and plotted with the respective areas for 0.5%, 1% and 2% MWCNT-PP as shown in Figures 17, 18 and 19. Occurrence of similar contours areas (in square pixel) were observed repeatedly, which signifies presence of MWCNTs and agglomerates of almost similar sizes. It was observed that 1% sample show higher frequency of occurrence of similar contour area clusters, which were even smaller in their areas. This indicate the satisfactory implementation of proposed method.
Occurrence of contour areas for 0.5% MWCNT-PP.
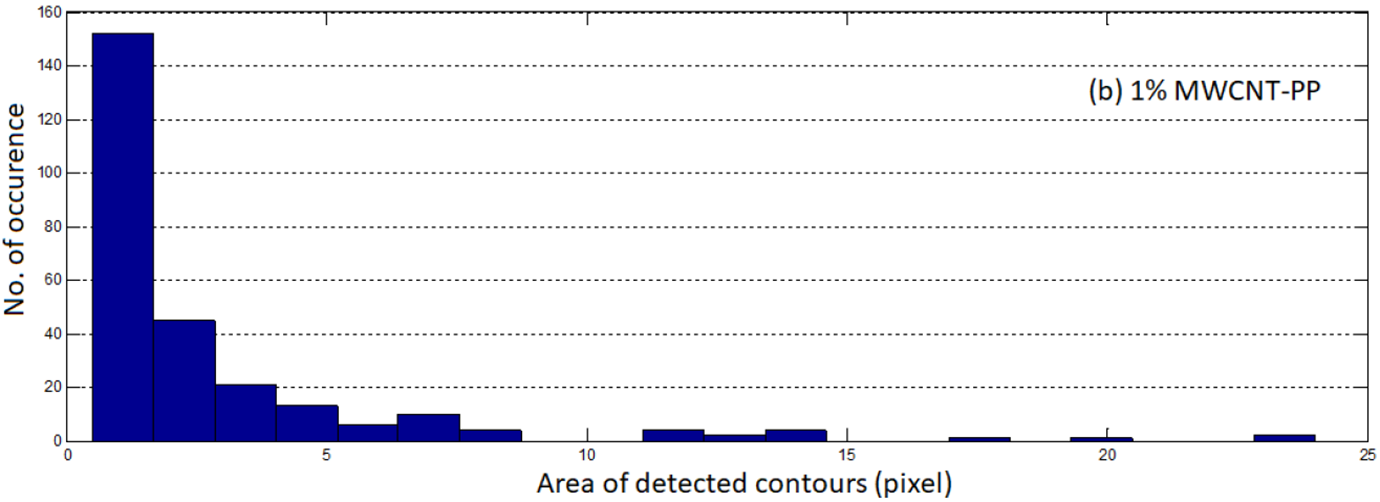
Occurrence of contour areas for 1% MWCNT-PP.
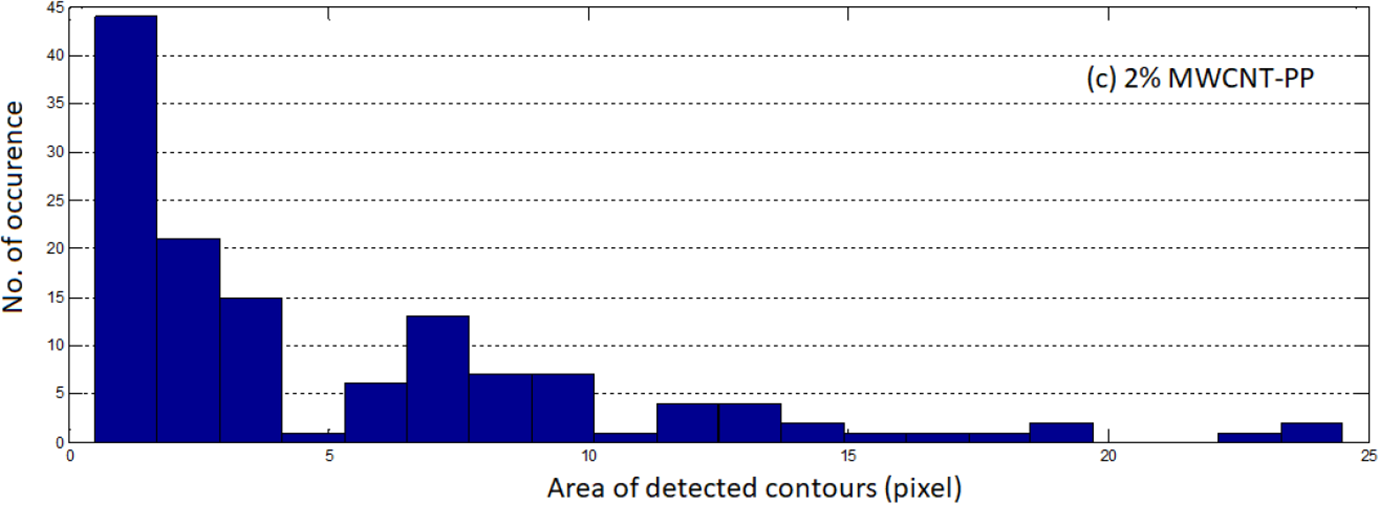
Occurrence of contour areas for 2% MWCNT-PP.
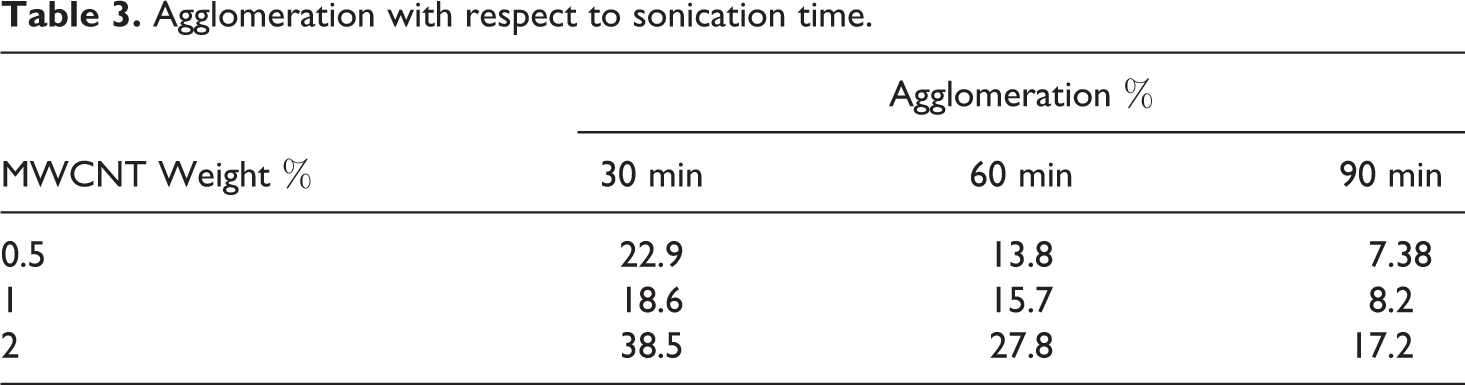
We obtained the agglomeration percent in each sample for 30, 60 and 90 secs sonication as given in Table 3. The contour area and agglomeration percent for optimized dispersion period of 90 secs is found 6.89, 3.47 and 6.02 square pixels for 0.5%, 1% and 2% MWCNT-PP samples respectively. However geometrical specifications of these contours is not studied in present study. We assumed these identical areas to be either MWCNTs or small clusters. Readers are encouraged for further studies.
Agglomeration with respect to sonication time.
Effect of sonication time on tensile strength and agglomeration content of the nanocomposites is represented by Figure 20, 21 and 22. It is evident that 90 secs of sonication enhances tensile strength to 24.5 MPa for optimized dispersion upto 1% concentration. Similar trend was observed for 0.5% and 2% samples.
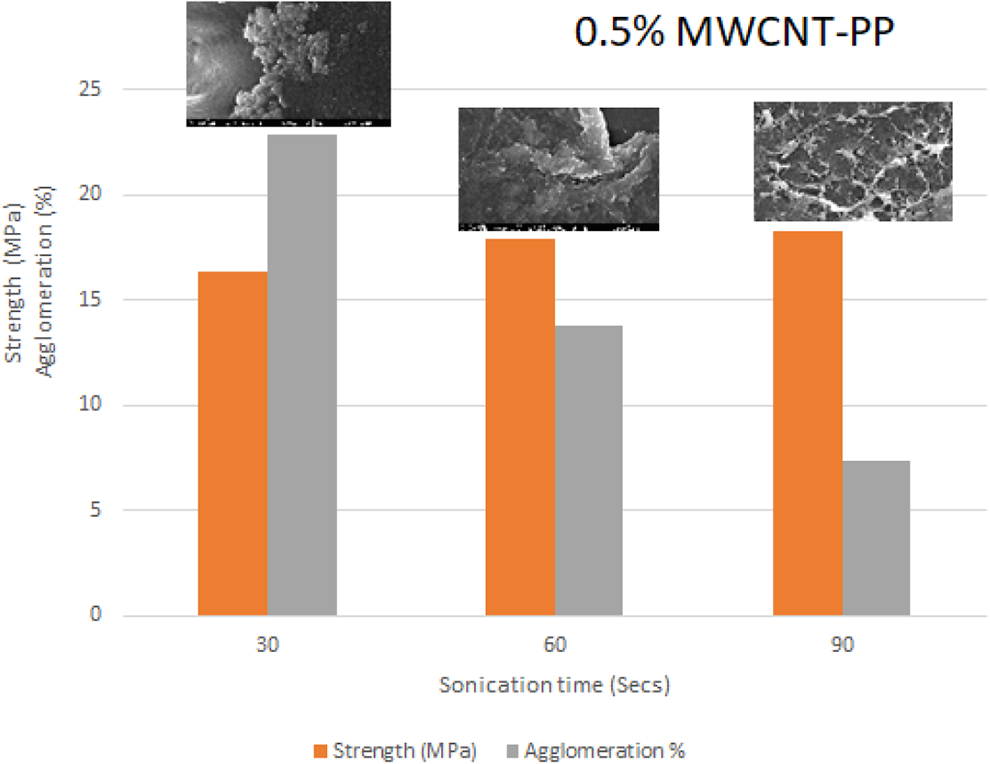
Strength and agglomeration content for 0.5% MWCNT-PP.
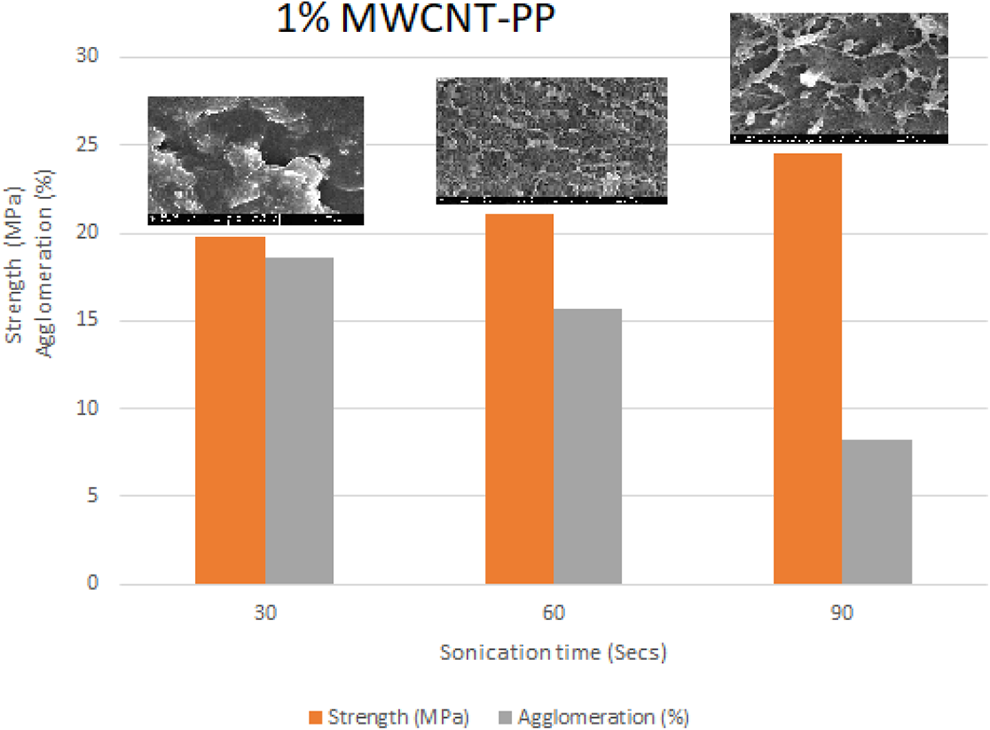
Strength and agglomeration content for 1% MWCNT-PP.
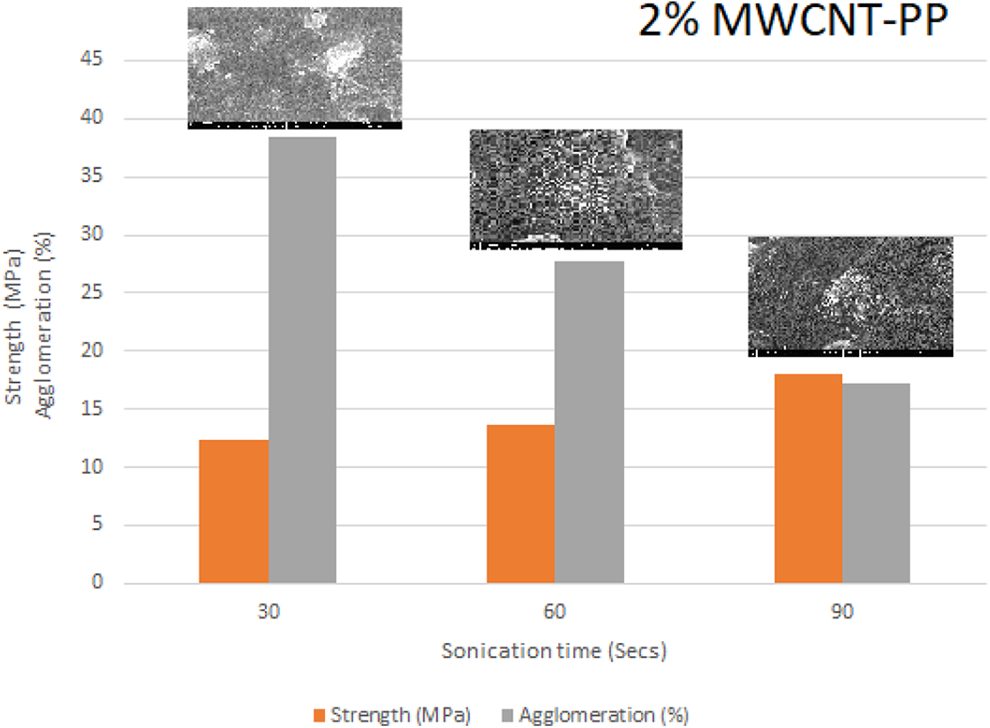
Strength and agglomeration content for 2% MWCNT-PP.
K-means clustering algorithm
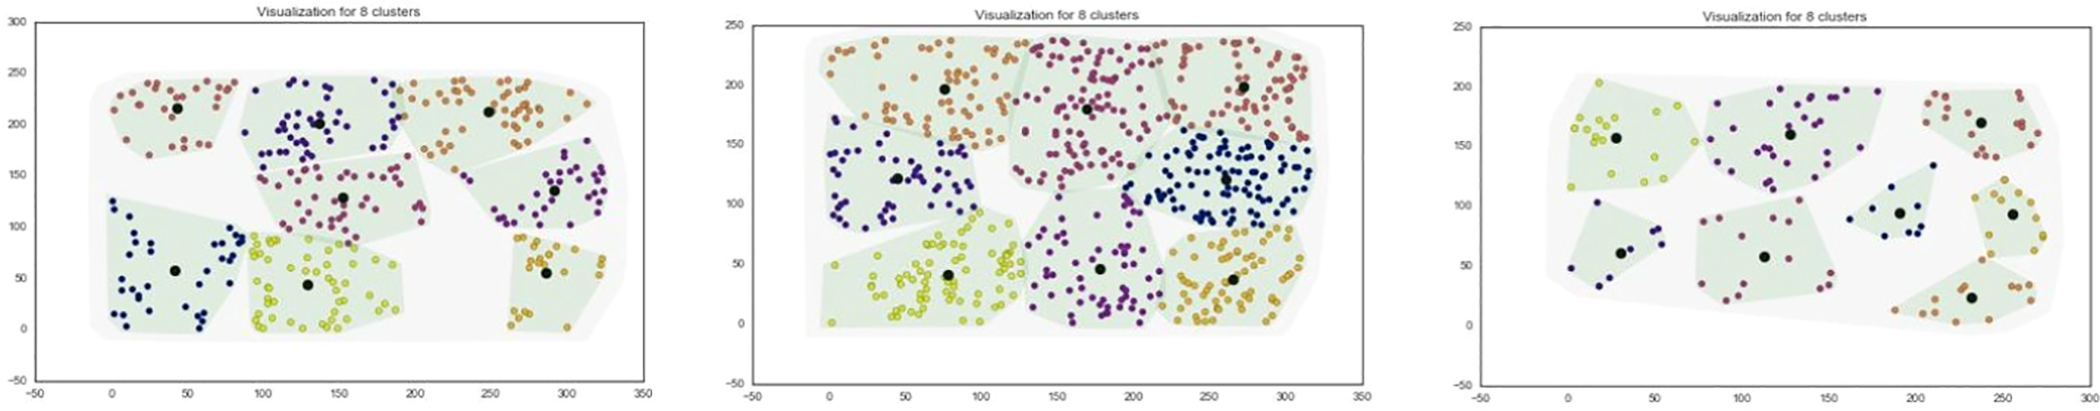
Clustered data set was divided into voronoi cells. Different concentration thresholded FESEM images, are processed with different k-numbers. Finally clustering analysis is performed for the data sets at different K-points for 0.5% 1% and 2% MWCNT-PP. Clustered data set for 1% MWCNT-PP sample at
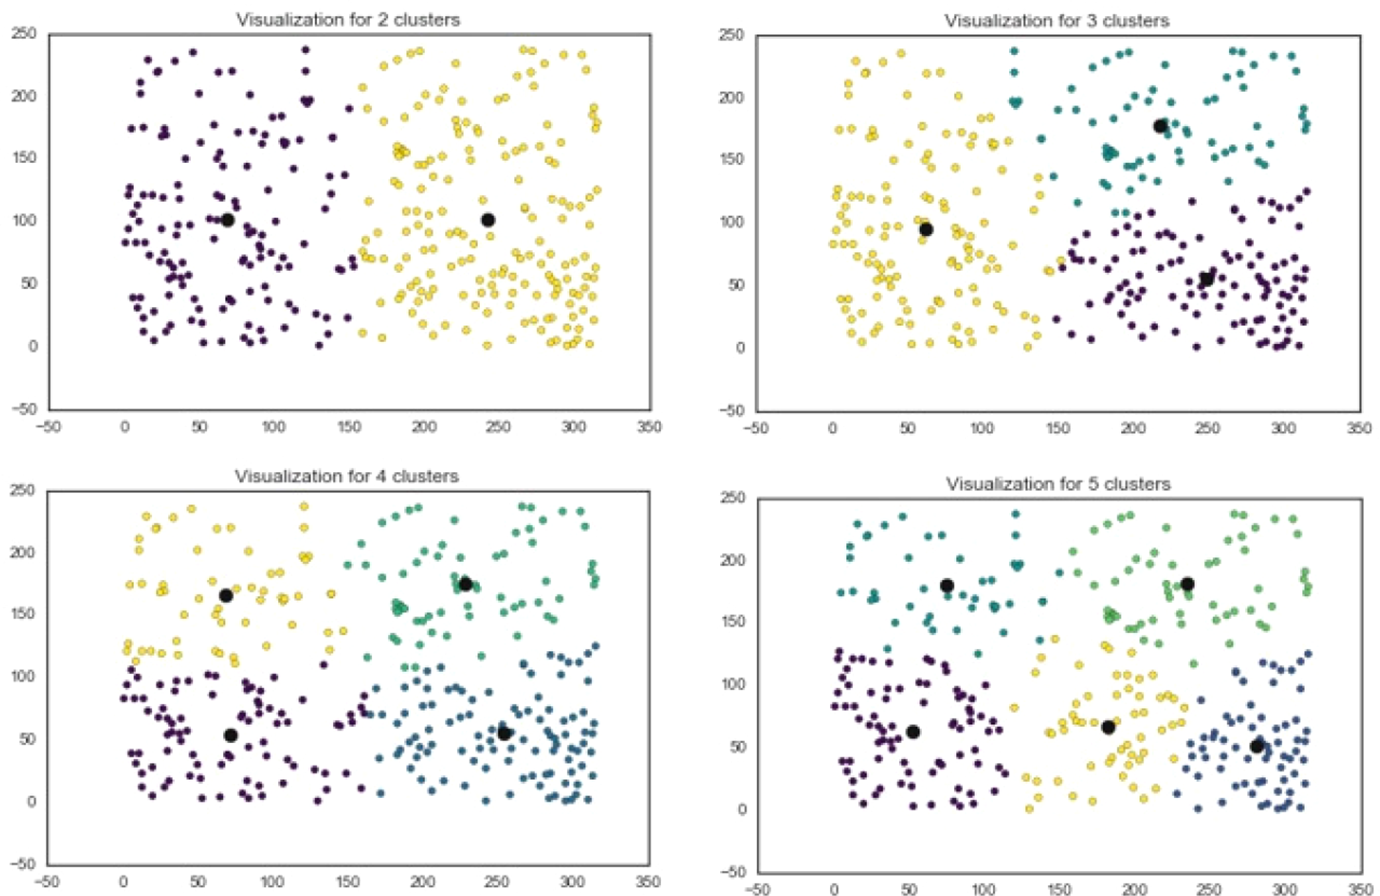
Cluster visualization for k = 2, 3, 4 and 5.
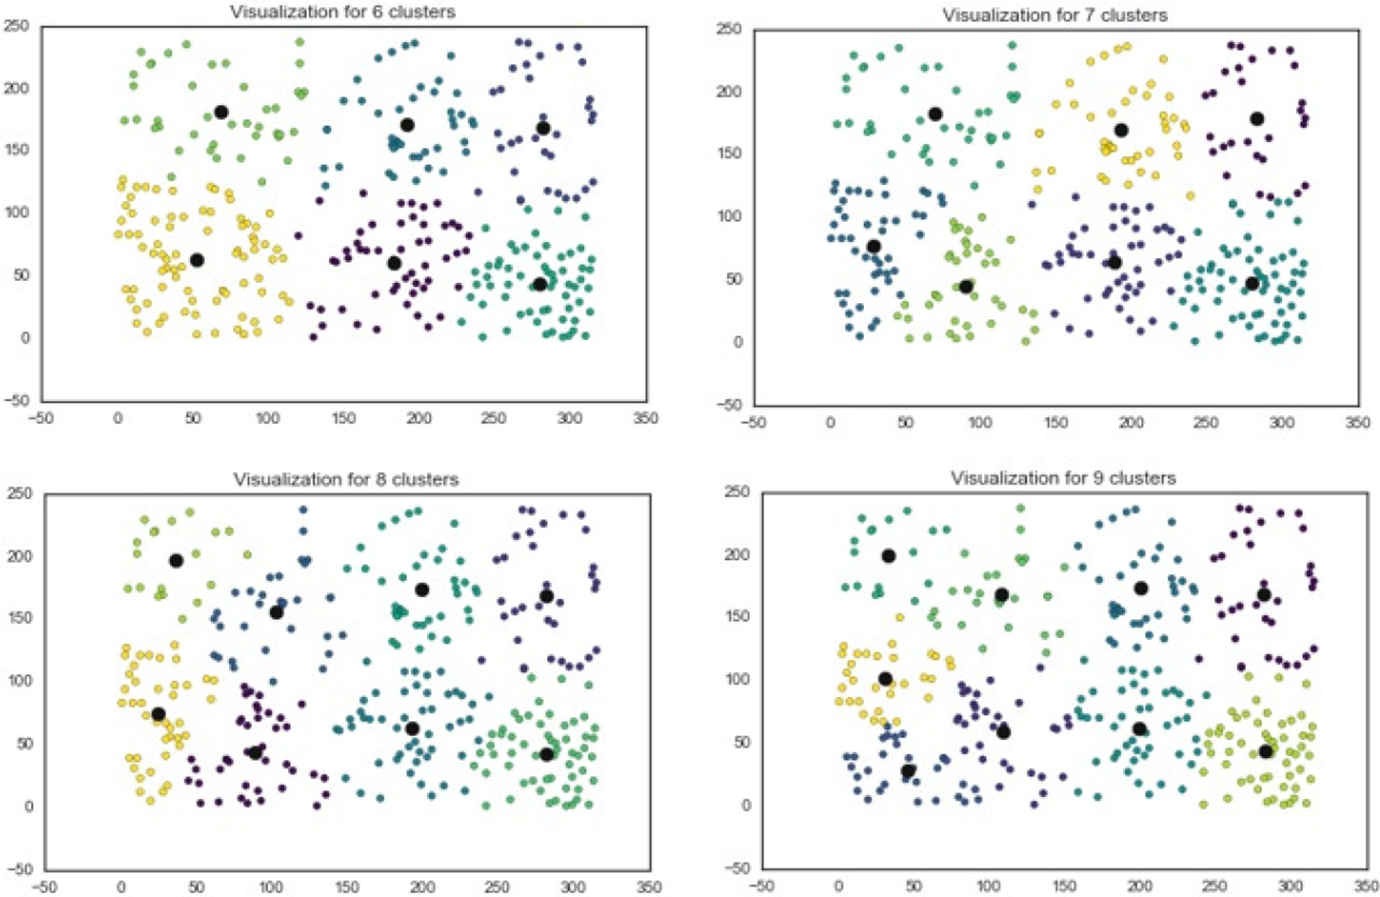
Cluster visualization for k = 6, 7, 8 and 9.
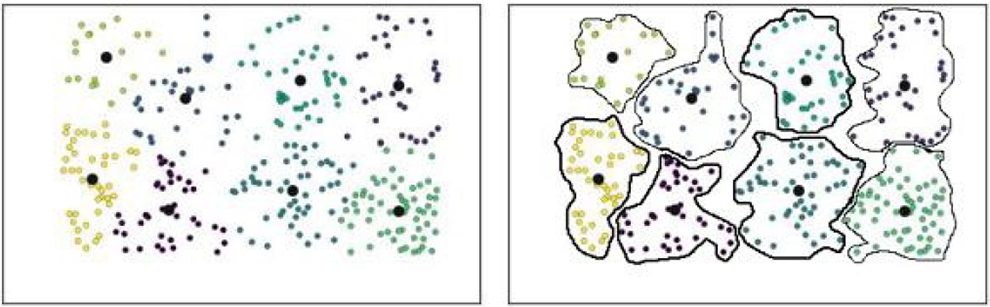
Voronoi cell representation from clustering at k = 8.
Cluster visualization
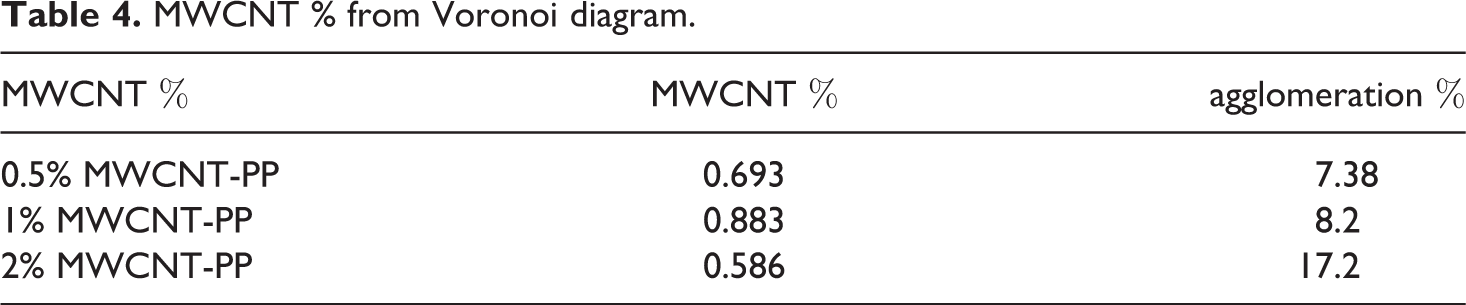
K-means clustering of 0.5%, 1% and 2% MWCNT-PP nanocomposite samples for optimized sonication period of 90 secs is shown in Figure 26. It was found that voronoi cell for eight clusters represents more closest number of MWCNT weight fraction as shown in Table 4. Interesting to note that 1% sample represents more uniformly dispersed MWCNTs and agglomerates, whereas accumulated clusters were seen in case of 2% sample. Apart from dispersion state, the contour area of all eight clusters in 1% sample are also almost identical to each other which again indicates good dispersion as compared to 0.5% and 2% samples where clusters contour areas are non uniform with significantly less MWCNT space.
Validation of MWCNT-PP weight fraction from Voronoi diagram.
MWCNT % from Voronoi diagram.
Application of the developed nanocomposites to fabricate insect-inspired artificial flapping wings
Dragonfly inspired bio-mimicked flapping wings were developed using the developed and optimized nanocomposite samples. The wing skin was made of MWCNT/PP nanocomposites and wing skeleton was made out of carbon fibre/epoxy composites. Wing development was carried out in three major steps, development of MWCNT-PP nanocomposites, preparation of wing skeleton using a mold and assembly of wing skeleton and wing skin.
The development of dragonfly wing skeleton was carried out by preparing through-cut stiff paper molds as per the CAD model of wing skeleton shown in Figure 27. The cutting of the paper molds is done using laser micro-machining.
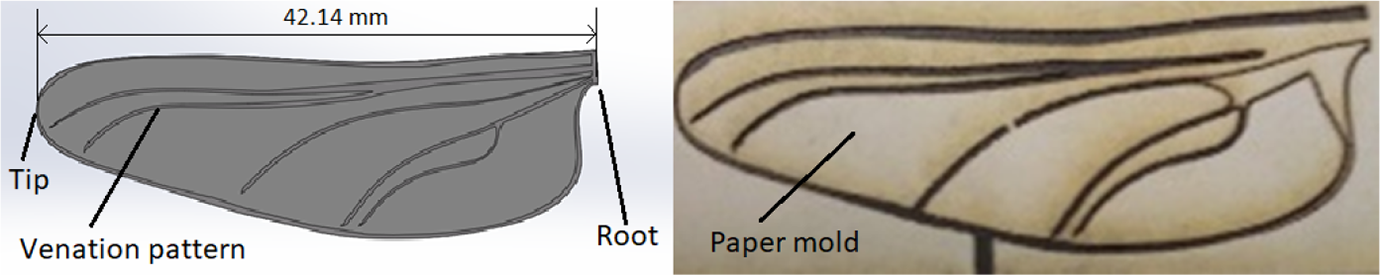
CAD model and mold for dragonfly skeleton development.
Nanocomposite film was kept below the mold to be used as wing skin. High strength carbon fibres were bonded to the wing skin using epoxy as a binder. Carbon fibre strands were dipped in the epoxy solution and dragged over a clean paper to remove excess epoxy. These sticky strands were then pasted over the mold, as per the shape of wings skeleton mold cavities. The walls of the molds were sprayed with silicon oil before pasting the strands. The skeleton-wing skin assembly was kept for curing at room temperature for 12 hours. This was done for perfectly bonding of skeleton the skin and then mold was peeled out carefully without damaging the skeleton-wing skin assembly. Excess Wing skin was cut as per the desired wing shape using surgical blade. Carbon fibres strands with a collective thickness of ≤15 µm were taken. The final wing was of span 42.14 mm as shown in Figure 28.
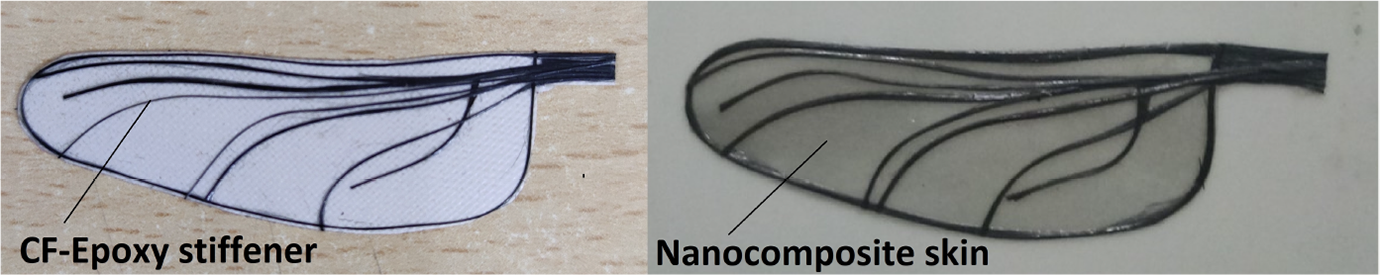
Developed polypropylene wing (left) and 1% MWCNT-PP wing (right).
Developed nanocomposite wings were light and flexible. The mounting of any physical sensor would have altered its dynamic properties. Digital image correlation is a non-contact and non-destructive measurement technique for testing of light, thin and flexible materials for their structural dynamic properties. The developed nanocomposite wings were tested and their natural frequency are obtained. Nanocomposite wings were mounted on a test fixture coupled with brass stud to the electrodynamic shaker and given sinusoidal excitation at their root using a power amplifier. The images were captured using two high speed cameras (speed 10000 fps) mounted on a rigid frame. A correlation algorithm was applied on the images captured and natural frequency of the wings were obtained. 43 Dynamic tests performed exhibit increase in natural frequency of the developed nanocomposite wings with modified solvent casting process. The natural frequency of PP wing and MWCNT-PP nanocomposite wings shown in Table 5, was found to be greater than those obtained previously in the similar weight category.
Natural frequencies of PP wing and nanocomposite wings.
Concluding remarks
In the present study, polypropylene nanocomposites are prepared using modified solution casting method using –COOH functionalized multiwalled carbon nanotubes with
As an application, structural dynamic analysis of dragonfly wings also indicate increase in modal frequencies upto
Footnotes
Acknowledgements
The authors would like to thank the members of structures and materials characterization laboratory for their help with the test facilities. The authors express their sincere thanks to Mr. Lavendra singh for his technical assistance. Authors would also like to thank Chemical engineering department and Material science and engineering department for providing FTIR and FESEM facilities respectively. Financial support from Ministry of Human Resource Development (MHRD, New Delhi) in form of research fellowship, is highly appreciated.
Funding
The author(s) received no financial support for the research, authorship, and/or publication of this article.