
Abstract
Wind blades are the most expensive parts of wind turbines made from fibre-reinforced polymer composites. The blades play a critical role on the energy production, but they are prone to damage like any other composite components. Leading edge (LE) erosion of the wind turbine blades is one of the common damages, causing a reduction in the annual energy production especially in offshore wind turbine farms. This erosion can be caused by rain, sand and flying solid particles. Coating the blade against erosion using appropriate materials can drastically reduce these losses and hence is of great interest. The sol–gel technique is a convenient method to manufacture thin film coatings, which can protect the blades against the rain erosion, while having negligible effect on the weight of the blades. This article provides an extensive review of the liquid erosion mechanism, water erosion testing procedures and the contributing factors to the erosion of the LE of wind turbine blades. Techniques for improving the erosion resistance of the LE using carbon nanotubes and graphene nano-additives are also discussed.
Introduction
Global energy demand is continually rising due to an increasing population and industrialization and increasing dependence on electric and electronic devices. According to the British Petroleum (BP) energy outlook 2017, the population of the world will be nearly 8.8 billion by 2035. The increasing global energy demand and the limited fossil fuels resources and environmental concerns make the expansion of renewable energy resources essential in order to supply the demand. Hydropower, wind turbines and solar power are the top three sources of renewable energy. 1
A wind turbine is a machine that converts the kinetic energy of the wind into mechanical energy and then by the help of a generator converts this mechanical energy into electricity. The performance of the wind turbine is dependent on the appropriate design of blades and the endurance of the blade shape and geometrical dimensions during its lifespan, 2 hence attention to the structural health of the blades is important in the design phase. Poor erosion resistance of blade materials will result in suboptimal operation of the blade and may also compromise the structural integrity of the blade. A consistent erosive pattern has been reported that consists of four phases: upper core breach, lower core breach, leading edge (LE) core breach and advanced erosion. 3 Most of the structural damage of the wind turbine was found in the blades and tower of the turbine. 4 It is reported that 15% to 20% of the total turbine cost is on the manufacture and installation of the blades. 4 Repairing the blades is the most expensive and most time-consuming process in the maintenance of wind turbines. 5 Currently, there are two general surface coating systems that are commonly used by wind turbine manufacturers. One group called ‘gelcoat’ either applied in mould during the manufacturing process (polyester-based) or painted on the blade (epoxy-based). The second group is polyurethane-based surface coating/paint which can be applied to the surface by spraying. The polyurethane coatings are highly elastic and durable material that act as an energy absorber at impacts, have shape memory as a result of high elasticity, resistant to gouging and abrasion. 6 These coatings serve to protect the underlying composite laminates from weathering and foreign object impact. 7
There are two main aerodynamic forces at work in wind turbine blades, lift and drag forces. 8 A suitable blade is designed to have a maximum lift to drag ratio which is called glide ratio. The blades of wind turbines are cantilever beams up to 100 m in length. As a result, the weight of the blade is one of the most important factors in the selection of the materials for the blade. Different parts of the blade are subjected to compression load, tension load or a combination of compression and tension. Materials should be chosen in a way to maintain the defined shape of the blade under various loads during its operation; they must be strong enough to resist the extreme loads, sufficiently stiff avoid buckling and to prevent collision with the tower under extreme loads and also the materials need to last the expected life (20–30 years) of the turbine under fatigue loading. 9,10 Fibre-reinforced polymer (FRP) composites are used typically to manufacture the blades and the nacelle of the turbines while the generator and tower are manufactured from metals as they have all characteristics to meet these requirements. Currently, the most used FRP composites in the structures of wind turbine blades are glass fibre-reinforced polymer (GFRP) and carbon fibre-reinforced polymer (CFRP) composites. Glass fibres have good specific strength, low specific stiffness and are inexpensive, while carbon fibres have high specific strength and are about five times stiffer than GFPR but they are more expensive. Using CFRP reduces the tip deflection of the blades and also allows the manufacturer to make longer blades, but the cost is much higher. 11 Recently, research showed that hybrid carbon/glass composites represent an interesting alternative to the pure GFRP or CFRP materials. Hybrid composites has been used in the manufacturing of LM Wind Power 84.4 m wind turbine blade 12 which has a blade mass of 34 t and a rated tip speed of 80 m/s. The trend of increasing the rotor diameter is continuing in the future resulting in higher tip speed. When considering the impact of rain droplets, the tip speed is a key contributor to erosion damage. The erosion of the blade will cause turbulence and lead to a decrease in lift and an increase in the drag forces. It was shown that drag can be increased from 6% to 500% depending on the degree of LE erosion 13,14 ; increasing the drag by 80% will reduce the annual energy production (AEP) of the wind turbine by 5%. 15 Excessive damage could lead to total failure of the blade. This is more significant for offshore wind turbines with larger blades and higher tip speeds than onshore turbines. 16 As a result, development of erosion-resistant coatings for protection of the blades is very important, for both Levelized Energy Cost and maintenance of the structural integrity of the blade to avoid weight unbalancing.
There is no comprehensive review in the literature on LE erosion protection using sol–gel technique. In this article, the state-of-the-art erosion-resistant coatings for wind turbine blade are reported. Various tests methods and apparatus developed by different researchers for accelerated testing of the coated blades materials under water impact condition are presented. The use of carbon nanoparticles (CNPs) for improving the erosion resistance of sol–gel coating is discussed.
Erosion of the wind turbine blade
Erosion has been reported after 2 years of operations in some wind turbine blades. 17,18 Inspection of 201 blades in 67 wind turbines operated by EDP Company showed that erosion occurred at the LE of 174 blades which is around 87% of inspected blades. 14 Modern and large wind turbines are affected less by particle erosion in comparison with the small turbines. The reason may be because of the increased influence of the blade flow field towards a deviation of the incoming particles. 3 It was noted that offshore wind farms are subjected to more intense particle erosion than the majority of in land installations. The main causes of blade damage were identified as sand grains and rain drops, other impactors such as insects and hailstones do not have a significant effect on the erosion of wind turbine blade. 3 LE erosion causes an increase in surface roughness of the blade and thereby an increase in the air flow boundary layer thickness over the airfoils on the blade when it is operating. The increased boundary layer thickness causes an increased drag coefficient and a decreased lift coefficient, and thus reduces the aerodynamic performance, particularly at higher angles of attack. 15 The consequence is severe losses in energy production. It has been reported that eroded blades in wind turbine can reduce AEP by as much as 20% to 25%. 13,19 Coating the blade against erosion using appropriate materials can drastically reduce these losses and hence is of great interest.
Due to the impact of erosion on the operation of wind turbine blades, they need to be monitored during their lifespan; however, the health monitoring process of a blade surface is time-consuming and costly. 20 During the monitoring process, wind farm need to be shut down and then photographed from the ground. The location, depth and roughness of the damaged areas are the main aspects that are monitored as they affect the aerodynamic performance of the blade.
Liquid impingement erosion is important primarily where the target body moves at high speeds and collides with liquid drops that are moving much slower as is the case for wind turbine blades. Due to the higher blade speed at the outer part of the blades, erosion mostly appears at the LE in this area (Figure 1). For this reason, maintenance of the LE of the blade is not only recommended but it is essential if blades are expected to reach their life expectancy.

LE erosion of the wind turbine blades can cause water ingress, with water entering the blades through surface defects due to erosion resulting in degradation to the constituent components of the blades. Water absorption by the resin will increase the weight of the composite structure causing imbalances and an increase in wind turbine vibrations. 24 In some studies instead of water, rubber balls are used to impact specimen surfaces. 25,26
The erosive force of rainfall is expressed as rainfall erosivity. 27 Rainfall erosivity considers the rainfall amount and intensity and is most commonly expressed as the R-factor in the Universal Soil Loss Equation model and its revised version. Estimation of the potential erosion caused by rain at specific wind farm sites is more challenging at sea than at land due to the limited available precipitation data. Over land, the rainfall erosivity for soil degradation has been assessed from 1541 precipitation stations in all European Union Member States and Switzerland, with temporal resolutions of 5 to 60 min. 27,28 The map on rainfall erosivity in Europe at 500 m spatial resolution assessed by European Soil Data Centre (ESDAC) is shown in Figure 2. 27 This database is valuable for the production of a rain erosion map for wind turbines where precipitation, wind speed and turbine characteristics such as tip speed would be input. 29
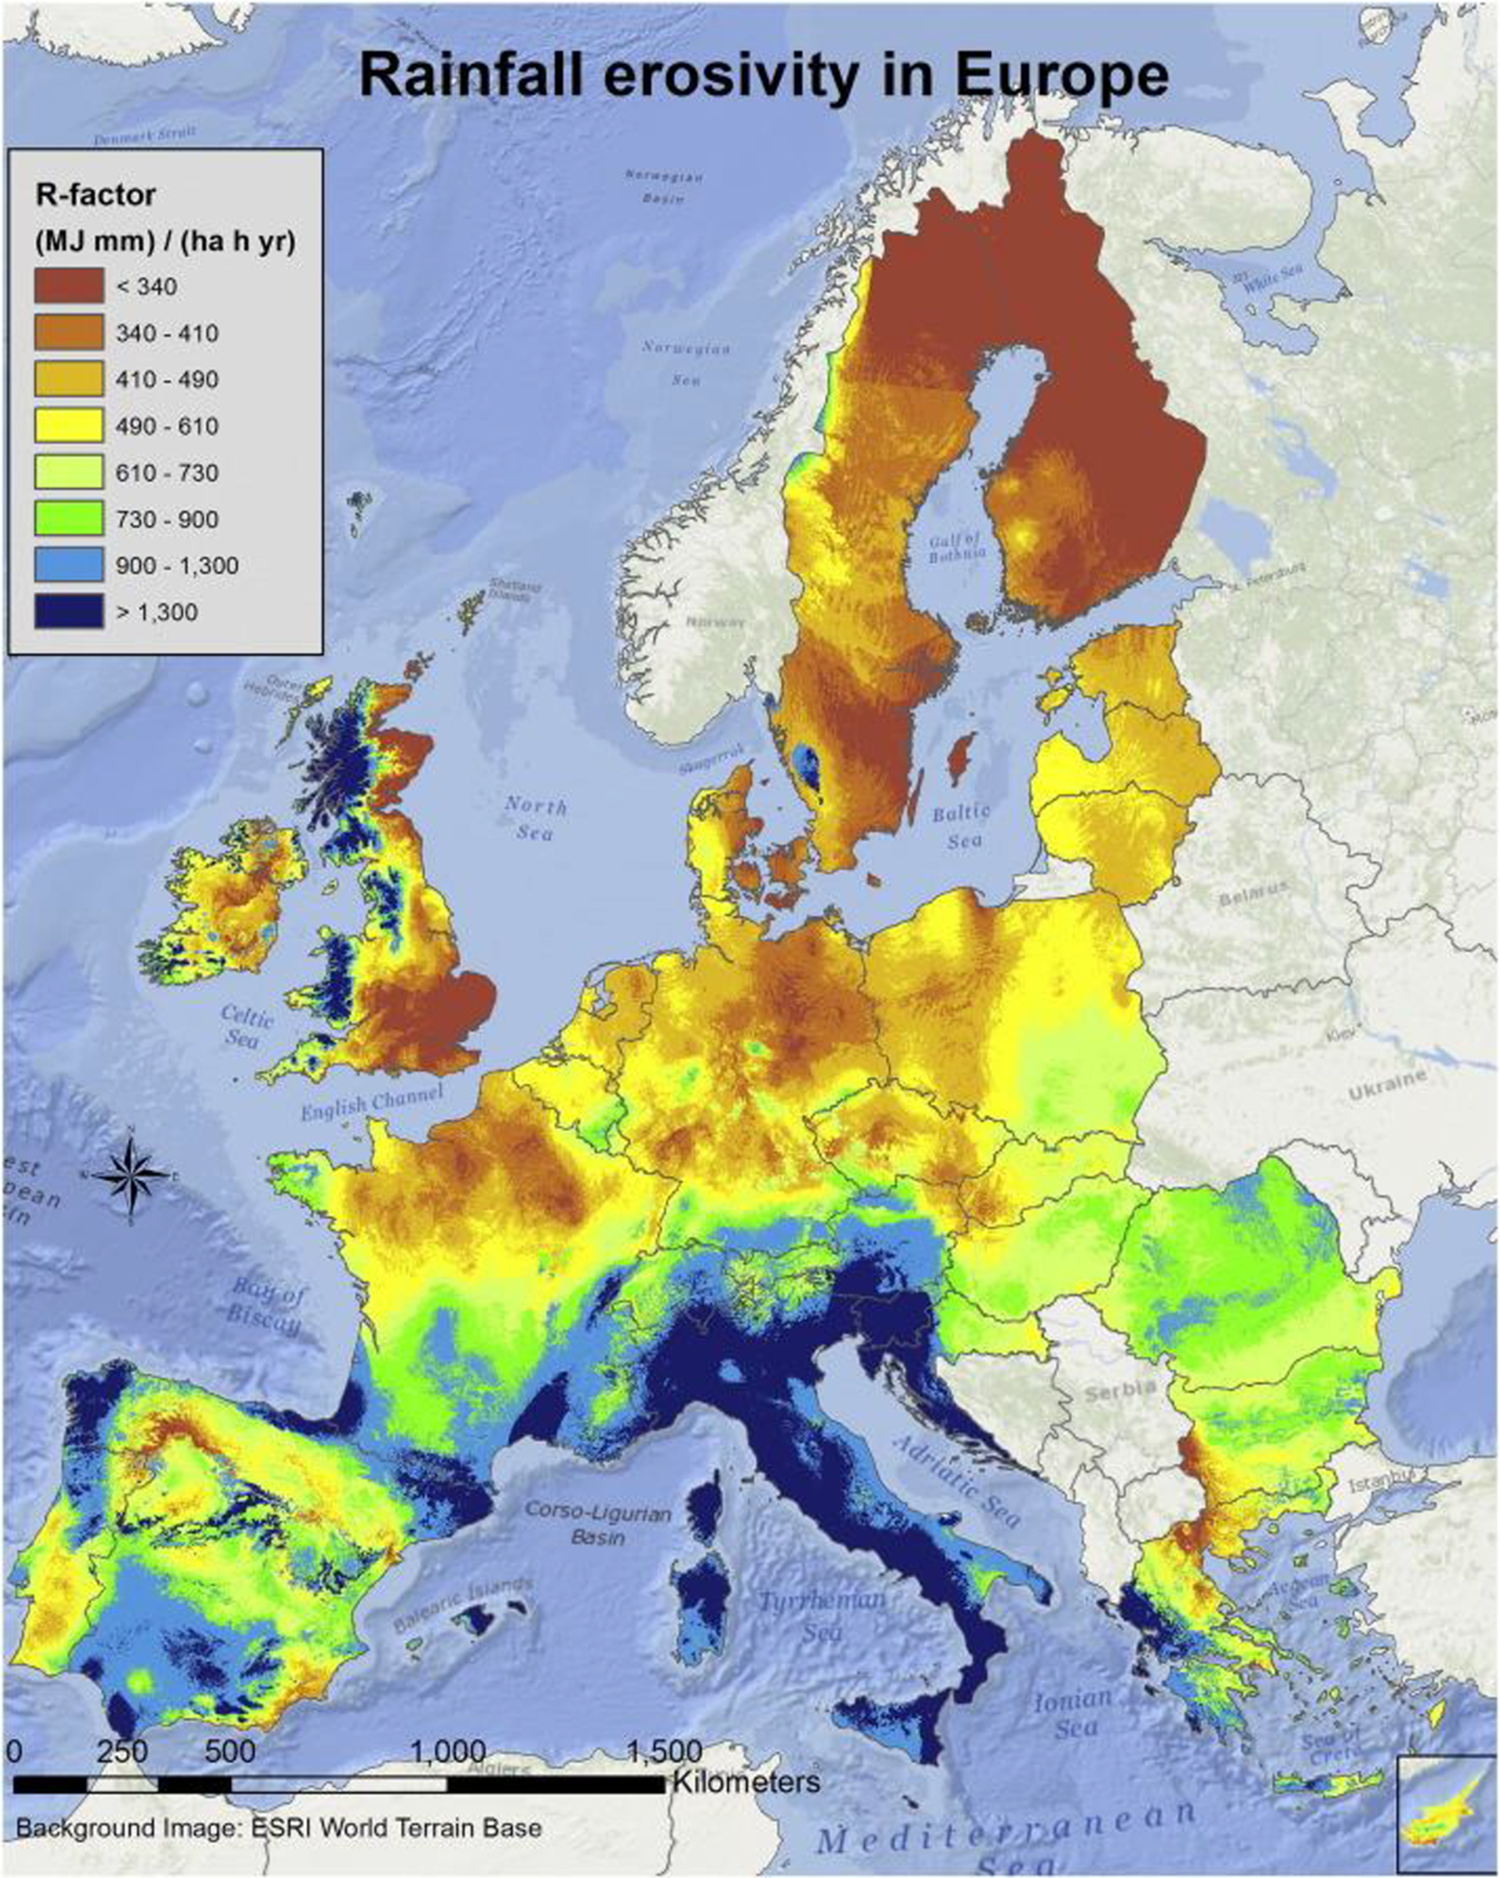
Rainfall erosivity in Europe at 1 km grid cell resolution. Reprinted from Panagos et al. 27 with the permission of Elsevier publishing.
In order to understand the details of erosion process and characterize the failure mechanism, numerical models of rain droplet impact simulations are necessary. 30,31
Liquid erosion parameters
There are a number of parameters that affect erosion by liquid droplets. These parameters are speed of impact, impact angle, droplet size, liquid density, acoustic velocity, cyclic properties of materials, hardness and geometrical aspects.
Impact speed
To explain the relationship between the erosion rate and impact speed, equation (1) can be used

where V m is erosion rate and c is a constant. The erosion rate V m can be evaluated from equation (1) by using the experimental data of the droplet velocity V, the droplet diameter (d) and the number of impinging droplets n m. 32 The droplet velocity can be measured by particle image velocimetry, its diameter by shadowgraph technique and the number of impinging droplets in a unit area can be counted by a sampling probe. 32 –34
Recently, the influence of the liquid film on the erosion rate is found to be the other influential droplet parameter. The thickness of the liquid film is an important factor for quantitative prediction of erosion rate. 34,35 Generally, the erosion rate is directly proportional to the droplet size. 36 Different sizes of droplet cause different erosion damage, the difference is more significant for lower velocities. To analyse the effect of the droplet size on the erosion phenomena, two aspects should be considered. First, the same volume of water should impinge the samples, and second, samples should be tested at speeds higher than the threshold speed to damage. Although droplet size and shape has an effect on the impact velocity, impact pressure is independent of the droplet size or shape. 36 Increasing the impact frequency of the water droplet also increases the damage depth rate and decreases the incubation period. 37
Impact angle
Impact angle is the angle between the direction of the water motion and the target surface. 38 The effect of the impact angle can be neglected if the incubation period for crack formation is short enough 39 ; but if the incubation period is not short enough, the amount of volume loss will be different for different impact angles and the highest volume loss will be at a 90° angle of attack.
Initial surface condition
A slightly roughened surface will erode faster than a smooth surface. So the constant rate of erosion at the terminal stage for rougher surface can be realized in a shorter time period than for a smooth surface. 34,40
Mechanical properties of the surface
Although hardness is the most common property that determines erosion damage, yield strength, modulus of elasticity, wear resistance, ultimate rebound resilience and fracture toughness are the other factors that have an influence on erosion damage.
Temperature
Both the environmental temperature and liquid drop temperature have an effect on the erosion damage. The erosion rate will increase at higher temperatures due to the reduction in the viscosity of the liquid.
Liquid erosion mechanism of the blades
Failure due to liquid impact of water droplets which causes damage in the form of pitting or peeling over time is divided into two regimes.
Water droplet inlet
When the contact edge travels across the surface of the target at a velocity (V c) greater than the velocity of shock wave (C) propagating into the water drop, the initial damage occurs (Figure 3). This damage happens because of the water hammer pressure which can be up to several MPa. This pressure can introduce initial cracks in the coating which can lead to the second stage of erosion mechanism (shear stress). 42

Sequence of liquid impact from initial impact through to release of high pressure: (a) at impact; (b) where water drop is compressed due to lack of free surface; (c) at release; (d) after shock wave has overtaken contact edge allowing decompression and jetting; dark regions in (b) and (d) represent area of compressed fluid. Reprinted from Jackson and Field. 41
To calculate the shock wave velocity into the water drop, the following equation can be used for impact velocity up to 1000 m/s

where C 0 is the acoustic velocity, V is the droplet impact velocity and value for k is approximately 2.
Lateral jets
After the first stage, the water trapped in the compressed region can escape and generate water flow across the surface producing a high velocity sideways jet of fluid. 42 The velocity of the lateral jet is greater than the impact velocity and can cause material loss and extension of cracks (Figure 4).

Damaging effects of lateral jetting; left-hand side damaged by Rayleigh wave only; as lateral jetting crosses surface it tears off asperities it collides with. Reprinted from Jackson and Field. 41
Droplet after shock wave overtakes contact edge and generates a free surface which allows the compressed region to be released. From this free surface, three types of waves propagate into the water droplet to reduce the water hammer pressure. This incompressible pressure can be calculated by following equation 43

where ρ is the water density 1000 kg/m3, C is the shock wave velocity and v is the droplet impact velocity as before. As an example, water impacting at 500 m/s gives an impact pressure of about 1250 MPa. The stagnation pressure of continuous jet acting at this speed calculated from ρV2/2 is about one-tenth of this value. 36
Compression, shear and Rayleigh are the three stress waves which play critical roles in the erosion process (Figure 5). The compression wave is the fastest one, whereas the shear wave is slower. The compression wave has small effect on causing the damage. The Rayleigh wave is the one which interacts with the surface cracks. This wave has both vertical and horizontal components. The vertical component penetrates into the depth of the surface and it depends on the impact velocity and radius of the drop. The total impact energy divided between these three waves is Rayleigh wave (67.4%), shear wave (25.8%) and compression wave (6.9%). Stress reflections oscillate repeatedly through the coating and substrate structure until they dampen out and the energy of the initial shock wave is reduced. 45

Three types of stress waves generated in isotropic brittle solid. Reprinted from Zahavi and Nadiv. 44 with the permission of Elsevier publishing.
Spalling and lateral delamination between two coatings can be expected because of mismatch of the physical properties of both materials. In another word, when an elastic wave reaches a free surface or interface between solids having different physical properties, the resultant wave can cause material failure. 45,46
The process of liquid erosion occurs in the following stages: Incubation stage, where the surface remains unaffected and there is no record of significant mass loss (Figure 6). This stage may not appear if the impact conditions are severe enough to cause material loss for a single impact. Acceleration stage, during which rate increases rapidly to a maximum. Maximum rate stage, where the erosion rate remains (nearly) constant. Deceleration (or attenuation) stage, where the erosion rate declines to (normally) 1/4 to 1/2 of the maximum rate. Terminal (or final steady-state) stage, in which the rate remains constant once again indefinitely. However, in some cases, the erosion rate can continue to decline or fluctuate. Also, for some brittle materials, the rate can increase once again in what is called a ‘catastrophic stage’.
36

Generally, surface erosion in the turbine blade gradually expanded from the pressure side near the stagnation point to the suction side and the depth and width of the erosion increases in section closer to the tip. 14
Evaluation of erosion damage
Damage caused by rain erosion can be evaluated by analysing the erosion depth and incubation period.
Erosion depth
It is the local volume of damage per small area and it can be calculated by equation (4)

where E d is the damage depth in millimetre, R d is the damage depth rate in millimetre per second, t is the time and I p is the incubation period in second. 34
Incubation period
All the materials exhibit an incubation period where no damage is observed up to a certain level of exposure to rain impact, but beyond this period of exposure, erosion damage increases rapidly. 43,49 The amount of erosion damage per unit mass of droplets can be calculated by using the following equation

where E is the erosion damage per unit mass of droplets (mm3 kg−1), R d is the damage depth rate (mm/s), F req is the impact frequency of the water droplet (number mm2 s−1) and D is the diameter of the water droplet. 37
Erosion prevention systems
Erosion by liquid impingement can be reduced by a lower impact velocity, a decrease in normal component of the velocity (e.g. ‘tilting’ the surface), smaller droplet size, shorter operation times under severe conditions, more resistant materials and the application of a shielding layer.
The most effective system to protect the wind turbine blades against the erosion is using an erosion-resistant coating. There are two common techniques to produce an effective surface coating, in-mould application and post-mould application. For the in-mould application, a surface coating layer of material similar to the matrix material is added to the surface of the blade as part of the moulding process. In the case of post-mould application, a surface coating is applied after the moulding process by different methods of coating. 11 It should be kept in mind that using the coating to protect the LE of the blades from the rain erosion will change the shape of the initial aerofoil section slightly which can have effect on the aerodynamic performance of the turbine, but this effect is negligible in comparison with the effects of the eroded blade on the performance of the turbine. 13,50
Coating of the wind turbine blades
Materials are coated for a number of reasons such as to make a substrate biocompatible, increase a material’s thermal, mechanical or chemical stability, increase the wear resistance, improve the durability, decrease friction, inhibit corrosion or change the overall physicochemical and biological properties of the material. 51 As they are the most sensitive area of the wind turbine, protective layers such as tape or paintable and elastic coating are used for mitigating LE erosion of the blades. These layers absorb the impact energy without crack formation. The ability of a coating to absorb and distribute the energy from an impact can vary and this is expressed by the impact frequency. 17 Current blade coating systems typically consist of a putty layer which is applied for filling pores in the composite substrate, a primer to secure good adhesion of the subsequent coat and a flexible topcoat usually from a polyurethane-based formulation. 17 If LE protection has not been applied during the manufacturing process, LE erosion can occur within 2 years of operation. A rough estimation suggests 50% of new large wind turbines are specified with a blade coating. 20 There are a variety of procedures for coating including: vapour deposition, chemical milling, layer-by-layer coating, dip coating and sol–gel coating technique. 51 The development of new coatings which can protect the LE of the blades against the erosion is a topic of current research. Super hydrophobic coating using nanoparticles embedded in a resin, 52 hydrophobic coating with anti-icing capability 53 and ceramic coating materials with a high-erosion resistance 18 are some of these coating which are used in the industry to protect the LE of the wind turbine blades.
Design of liquid impact testing apparatus
There are two methods for performing accelerated rain erosion tests; one method uses a whirling arm, which carries the specimens and rotates them under an artificial rain field produced by nozzles or needles 48 and in the other method, a high velocity stream or jet of water is fired onto a stationary test specimen. 54,55 The two methods are generally similar, one of the differences between these methods is the active/passive impact mode between water droplets/jet and test specimens 17 and another difference is that the continuous jet produces stagnation pressure, whereas the discrete impacts in liquid droplet impingement produce much larger shock wave pressures.
Critical parameters for design
Stand-off distance
The distance between the nozzle and the specimen surface has a significant effect on the erosion rate (see Figure 7).
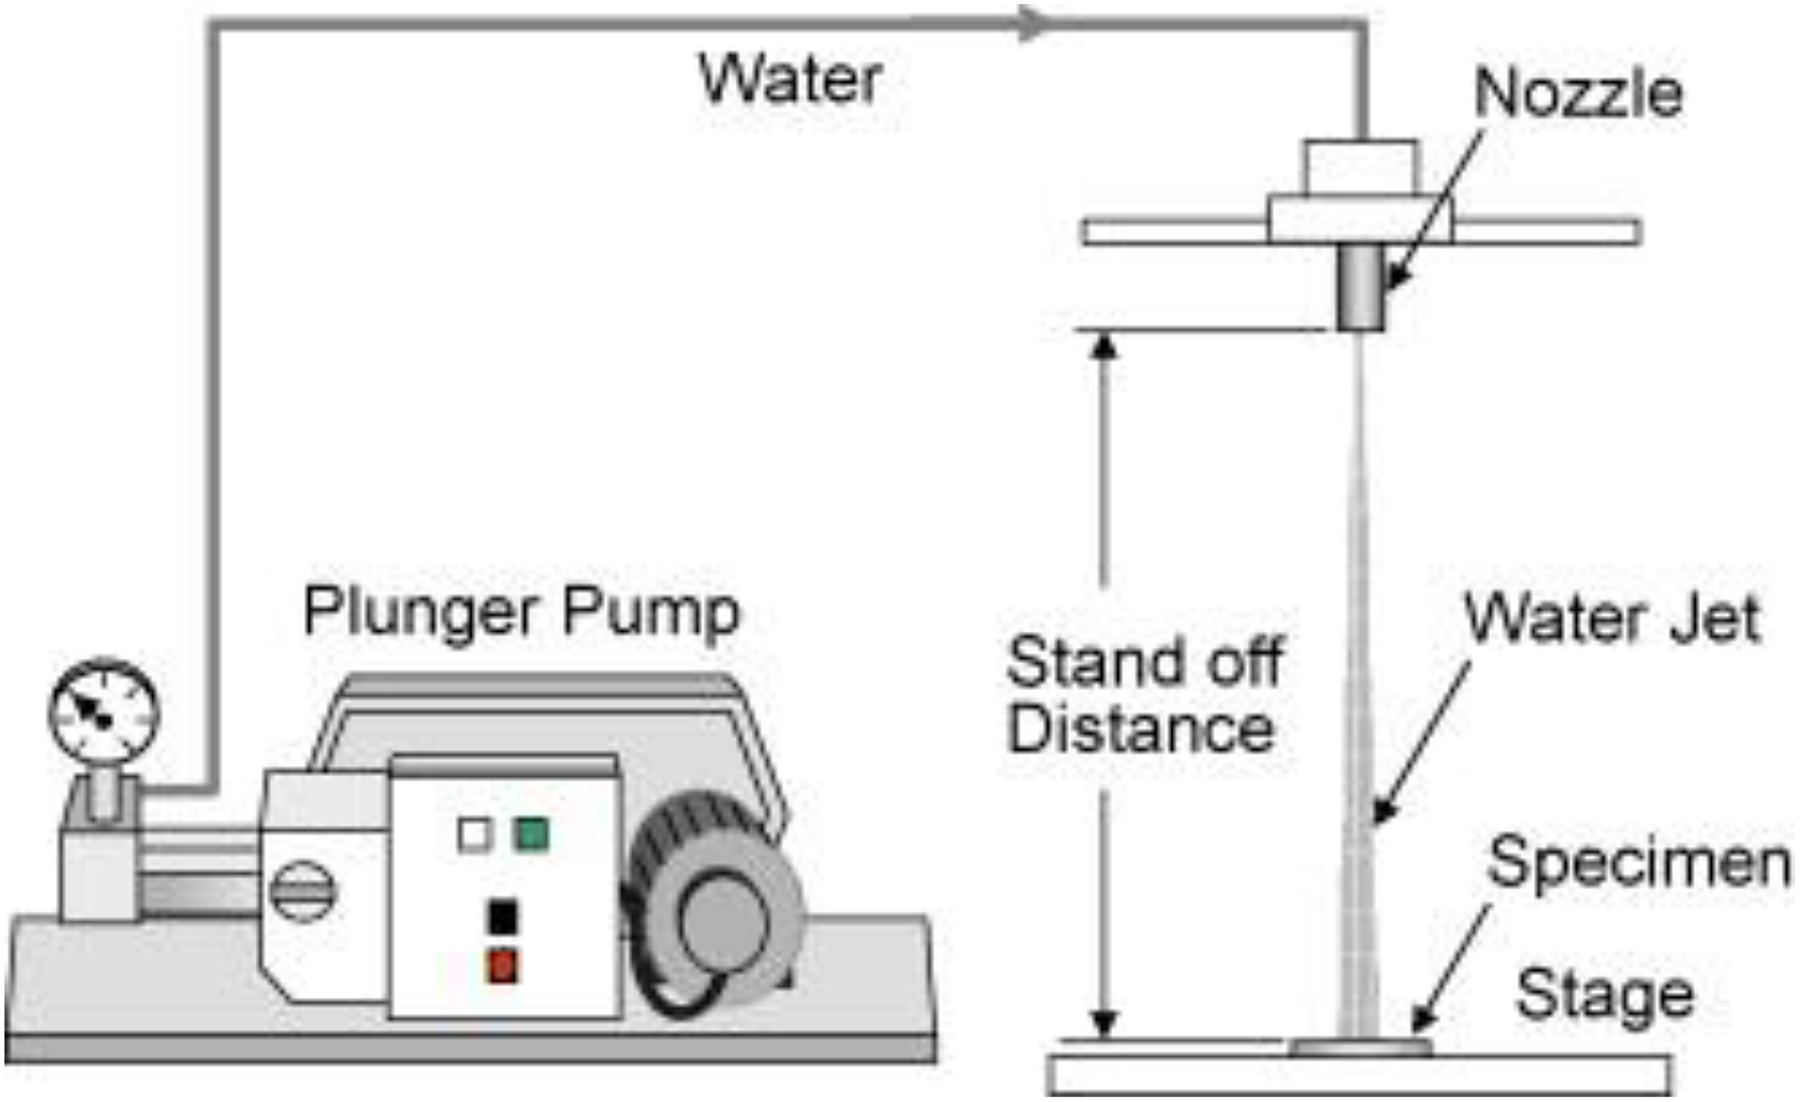
Schematic illustration of a testing apparatus. Reprinted from Oka and Miyata 18 with the permission of Elsevier publishing.
The damage depth rate will decrease for very short or very long stand-off distance (SOD). If the distance is too short (less than the intact length), it will cause negligible material removal because in the short SOD, the water that hits the surface forms a water column instead of water droplet. It is known that water droplet impact is more damaging than the impact of an intact fluid stream. 38,46,56 Intact length is the minimum distance from the nozzle over which the liquid jet is still connected. 57 –59 The effect of the SOD on the erosion volume can be explained in four steps. As can be seen in Figure 8, erosion starts immediately after the incubation period and is then followed by the acceleration, maximum rate, deceleration and terminal erosion stages. 36 The decrease of the erosion rate far from the nozzle can be explained by the decrease in the droplet velocity; however, the decreased erosion rate in the near field is because of the influence of the liquid film over the specimen.

Characteristic erosion versus time curves. (a) Cumulative erosion (mass or volume loss) versus exposure duration. (b) Corresponding instantaneous erosion rate versus exposure duration. The following stages have been identified: (A) incubation stage, (B) acceleration stage, (C) maximum rate stage, (D) deceleration stage and (E) terminal or final steady-state stage, if assumed to exist. Reprinted from Heymann. 36
It is proven that the maximum pressure on the solid surface due to the impingement of a droplet of diameter 100 µm is damped down by 10% because of the presence of a liquid film with 2.5 µm thickness over the solid material. 56 Furthermore, the erosion in the near field is higher than the erosion rate in the far field, which is due to the higher local flow rate in this area. 32
Impact angle
As explained before, the maximum rate of mass loss will happen at an impact angle of 90°. 39,57
Testing time, nozzle diameter, droplet size and impact velocity are the other important parameters that need to be well-defined when designing a liquid erosion testing machine.
Whirling arm-based system
This type of apparatus has been used for the study of liquid droplet impingement erosion by droplets having a diameter larger than 1 mm 58 ; moving the sample is good way to simulate the impact taking place when a moving object is exposed to a rainfall. The well-known rig which is used for this method is the whirling arm. In the following, some of the previously designed systems are explained.
The Whirling Arm Rain Erosion Rig (WARER) was designed and built by University of Limerick. 48 It consists of a rotating arm that carries the sample on the tip of itself (Figure 9). In this machine, water droplets are introduced into the test chamber through 36 blunt dispensing needles with an internal diameter of 0.15 mm. 48

WARER at University of Limerick. Reprinted from Tobin et al. 48 with the permission of Elsevier Publishing.
SAAB is another erosion testing facility (Figure 10); designed in the 1960s it has a prominent history in the field of rain erosion. 49 The sample is placed on a rotating arm at a radius of 2.19 m. The system is able to simulate impact speeds of up to 300 m/s. This system also is able to vary the droplet size and rainfall rate.

SAAB rain erosion test facility. Reprinted from Tobin et al. 49
Zhang et al. 17 designed a laboratory water jet setup to analyse the liquid erosion of blade coatings. In this machine, 22 coated panels can be placed on the rotating wheel with the diameter of 52 cm and speed range of 126–160 m/s (Figure 11). In this system, the distance between the nozzle orifice and the sample surface was kept at 10 cm and erosion evaluated by inspecting samples every half an hour. The rainfall intensity is 30–35 mm/h and the water droplet size is 1–2 mm.

Water jet erosion rig. Reprinted from Zhang et al. 17 with the permission of Elsevier publishing.
Stationary sample erosion test
This apparatus allows the study of the liquid droplet impingement erosion for smaller droplets with diameters in the order of few hundreds of micrometres. 32 This method is simple, economic and reliable (Figure 12). The specimen is fixed and water hits the surface of the specimen through a water jet nozzle.
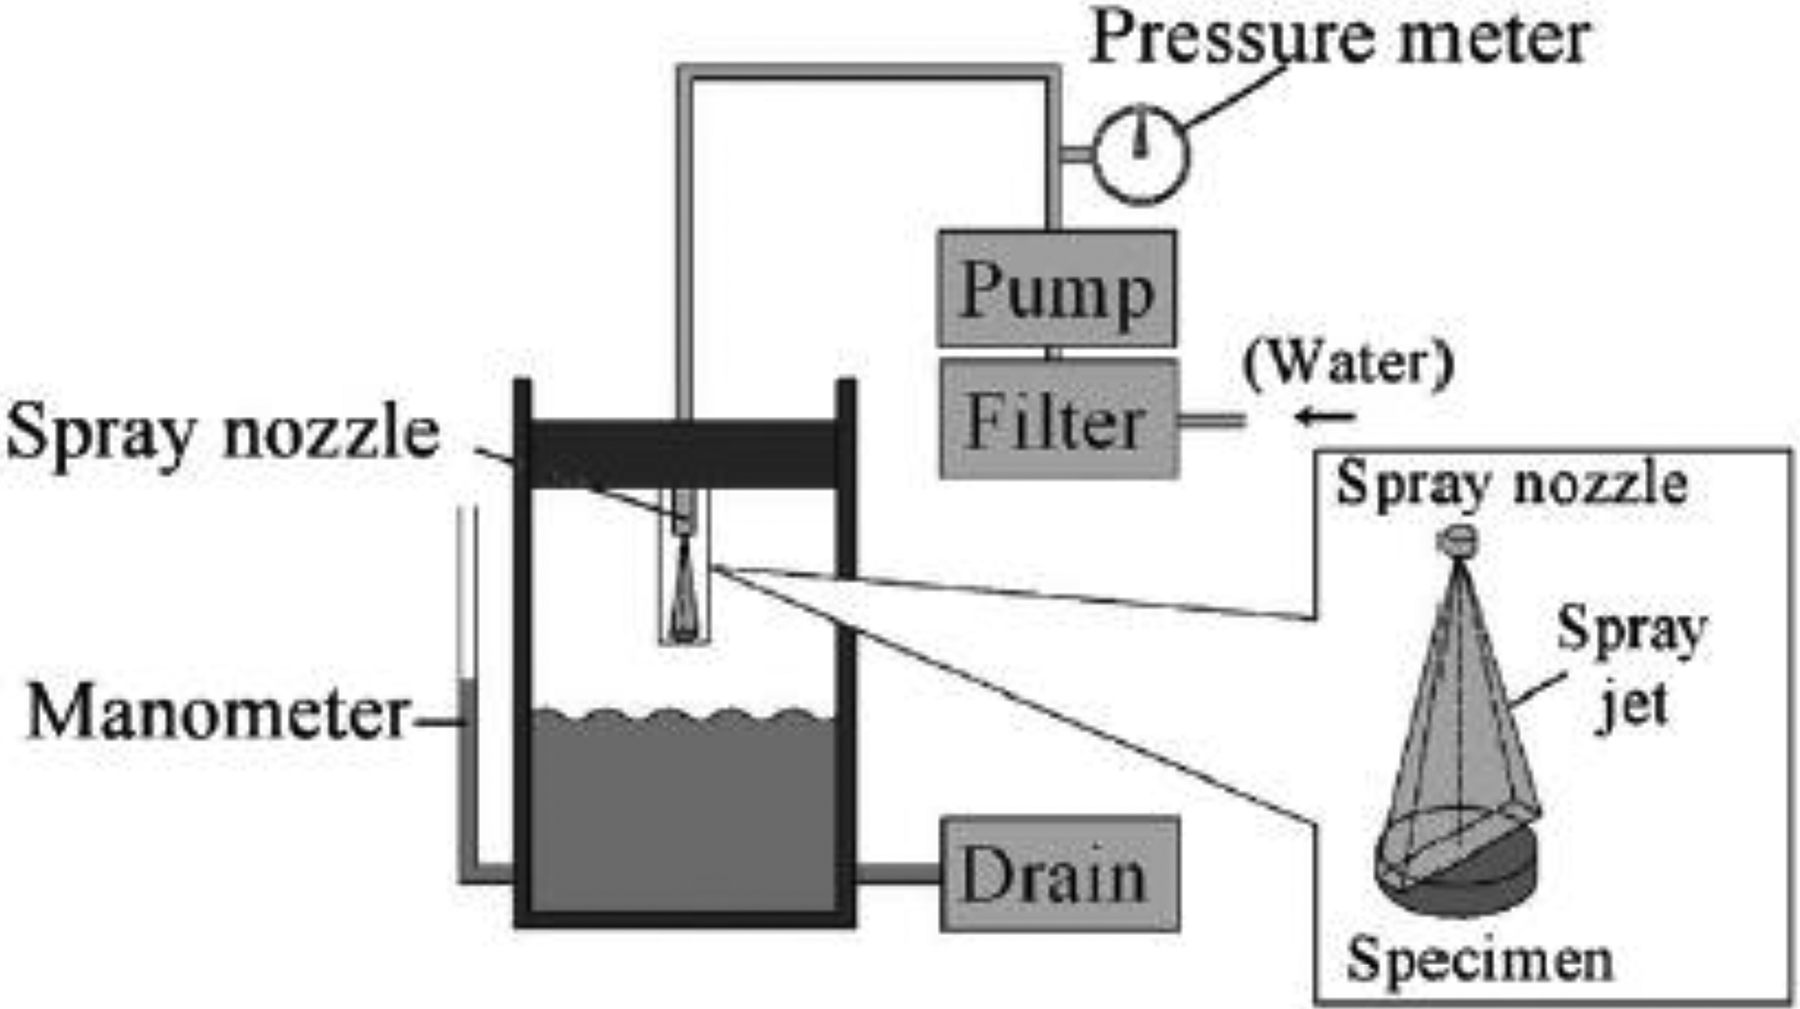
Experimental apparatus for liquid impingement erosion by high speed spray. Reprinted from Fujisawa et al. 32 with the permission of Elsevier publishing.
Grundwürmer et al. 44 used stationary sample erosion test (SSET) water jet for liquid erosion testing (see Figure 13). The SSET unit was setup with fixed SOD of 300 mm between the nozzle and sample surface, impact angle of 90° and droplet diameters starting from 0.3 mm down to below 0.1 mm. The water jet was moved across the sample surface at two different feed speeds: 0.017 and 0.25 m/s resulting in exposure times of 4.8 and 0.32 s per water jet crossing.

Stationary sample erosion test. Reprinted from Grundwürmer et al. 44 with the permission of Elsevier publishing.
Fujisawa et al. 33 designed an experimental apparatus for water droplet impingent testing (Figure 14). They setup two different units for their experiments, one unit with a 0.8-mm diameter nozzle having SOD of 270 mm with the nozzle pressure of 16 MPa, and the other unit with the same nozzle but SOD of 480 mm and nozzle pressure of 28 MPa, for both units the impact angle was 90°. 33

Experimental apparatus for LDI erosion. Reprinted from Fujisawa et al. 33 with the permission of Elsevier publishing. LDI: liquid droplet impingement.
Pulsating jet erosion (PJET) is an erosion test facility in which a high pressure water jet is forced through a nozzle of 0.8 mm diameter and is subsequently cut into individual water jets by a rotating disk (Figure 15). This system can provide different impact velocity and impact frequency as well. 48,54

Principle of PJET test method. Reprinted from Tobin et al. 48 with the permission of Elsevier publishing.
The sol–gel technique
Over the last few decades, the sol–gel techniques have been used for production of a variety of mixed-metal oxides, nanomaterials and nanoscale architectures, nanoporous oxides and organic–inorganic hybrids. The sol–gel processing is the most convenient manufacturing method because of its simplicity, good mixing of starting materials, relatively low reaction temperature and easy control of chemical composition of the end product. Sol–gel synthesis is utilized to fabricate advanced materials in a wide variety of forms: ultrafine powders, thin film coatings, porous or dense materials.
The sol–gel technique is a wet chemical technique that can produce polymeric networks of hybrid organic/inorganic materials that can be used as composite coatings. This composite materials which produced by sol–gel techniques have the properties of organic polymers such as flexibility and the properties of inorganic materials such as hardness at the same time. In a sol–gel, solid particles are suspended in a liquid to form a colloidal solution (sol) that acts as the precursor to an integrated network (gel) of either discrete particles or a polymer network. 59 The hardness and the flexibility of the sol–gel-derived coating can be adjusted by the amount of inorganic-rich compounds as well as by the degree of cross-linkage, for example, increasing the non-cross-linking organic groups will increase the flexibility of the coating.
The sol–gel process enables the deposition of films and coatings of thicknesses from 0.01 to 5 µm. The properties of sol–gel-derived coatings can be engineered at the molecular level for optimum physical and chemical behaviour, providing control over adhesion, hydrophobicity, permeability, texture, morphology, optical properties and other characteristics. 60
For enhancement of resistance to liquid erosion, the hybrid network provides sufficient mechanical stability to avoid cracks caused by droplet impact and is also flexible enough to absorb the kinetic energy of droplets. 44 Hard ceramic coatings experience higher wear at a 90° impingement angle while soft metallic coating experiences higher wear at low impingement angles (e.g. 30°). Therefore, a mixture of a soft polymer matrix containing hard ceramic particles in a composite coating may offer superior protection for different applications. The degree of cross-linking determines the hardness and the mechanical stability of the coatings, which is important to avoid crack initiations in the layer and crack growth. 61
The most promising coatings for commercial applications made using the sol–gel technique are Organically Modified Ceramics (ORMOCER) and Organically Modified Silica (ORMOSIL)
62
: ORMOCER is inorganic–organic composites on a molecular or nano-level. The inorganic backbone may be synthesized alkoxides or soluble oxides. Organic components can be introduced through the formation of carbon–silicon bonds, covalent bonds or through electrostatic interactions (i.e. ionic bonding). Introduction of organic polymeric chains leads to a second type of network; this network can be chemically linked to the inorganic backbone or act as an interpenetrating network. Properties of the materials can be varied by changing stochiometries, reaction conditions and processing. Their applications run from thermoplastic materials (e.g. sealing) to brittle coatings (hard coatings).
63
The basic properties of ORMOCER® which make them very attractive materials for coating applications are their transparency, their good adhesion to various substrates, their chemical stability and their good abrasion resistance due to the inorganic structures in ORMOCER®.
64
ORMOSIL, the silica surface consists of two types of functional groups, siloxane (Si–O–Si) and silanol (Si–OH). Thus, silica gel modification can occur via the reaction of a particular molecule with either the siloxane (nucleophilic substitution at the Si) or silanol (direct reaction with the hydroxyl group) functions. Reaction with the silanol group constitutes the most common modification pathway. There are three main methods in which functional groups are attached to the silica surface
2
: (i) reaction of organosilanes or other organic molecules and silica surface functions, (ii) chlorination of the silica surface followed by reaction of the Si–Cl with an appropriate reactant (e.g. amine or alcohol), (iii) via sol–gel methodology followed by post-modification, wherever necessary.
65
Advantages of sol–gel technique over traditional techniques
There are several coating methods in the industry, some of them are expensive because of expensive equipment (e.g. plasma spraying), some of them produce low-quality coatings (e.g. flame spraying), some methods are not practical to coat the internal surface of the small cylindrical (e.g. high velocity oxygen fuel spraying) and some of them are time-consuming and so challenging to produce thin film (e.g. powder coating technique). On the other hand, purely inorganic coating materials are very expensive coatings and they have poor adhesion to substrate due to the difference in thermal expansion coefficient between the coating materials and substrate.
Sol–gel technique is an alternative to traditional coating techniques, which makes it possible to produce organic–inorganic hybrid coating. 66,67 In this method, individual coating layers are limited to less than 0.5 μm to prevent cracking and coating failure during thermal processing as a result of trapped organics within the coating, 68 which has negligible additional weight on the substrate. Sol–gel-derived coating provide excellent adhesive between the metallic layers to the top coat, this is achieved by using precursors containing functional groups which are able to form chemical bonds to the substrate such as epoxy, vinyl and methacrylate. By sol–gel method, it is possible to produce coating layer which is thick enough for corrosion protection as well. 69 In this method, having the ability to use different silane precursors allows modification of the properties of the gel. 70 Control of stochiometries allows control of the hardness and the amount of non-cross-linking organic groups determines the flexibility of the coating.
In addition, in sol–gel technique, mixing is done at the molecular level, so the coating has high purity and uniformity. Sol–gel coatings are normally performed at relatively low temperature, so there is no need to reach the melting point, the method is more energy efficient than other methods of coatings that require temperature approaching melting point of materials, 71,72 temperature can be as low as room temperature up to a maximum of 500°C, which is the upper limit for the temperature stability of the organic groups. 73
This technique (sol–gel) has some disadvantages as well; one of them is the high permeability of the coating and the difficulty in controlling the porosity, which is important as erosion resistance is strongly linked to porosity of the coatings. 74 Shrinkage of the wet gel during curing process can also cause crack formation in the coating structure, and finally, the sol–gel method is highly substrate-dependent, primarily due to limitations imposed by thermal mismatch between the coating and substrate. 69
Sol–gel process
Sol–gel process has four steps: (a) Preparation of a stable suspension of colloidal particles (sol) in a liquid. (b) Depositing the solution on the surface by one of a variety depositing methods and produces the coating. (c) Polymerization of the sol through the removal of the stabilizing components and produce a gel in a state of a continuous network. (d) Heat treatments to pyrolyse the remaining organic or inorganic components and form an amorphous or crystalline coating.
The reactions in the sol–gel process depend on the parameters such as: nature and concentration of alkoxides, amount of water added, type of the catalyst used, sequence of adding components, mixing schedule and temperature.
Techniques for deposition of sol–gel coatings
Dip coating technique
Dip coating technique is a process where the substrate which needs to be coated is immersed in a liquid and then withdrawn with a well-defined withdrawal speed. This process is performed under controlled temperature and atmospheric conditions (Figure 16). In this technique, two parameters control the thickness of the coating: the viscosity of the liquid and the angle between the substrate and liquid surface. This method is suitable for coating the curved surfaces like bulbs, eyeglass lenses and bottles.

Dip coating process. Reprinted from Attia et al. 72
When the viscosity and speed is high, the coating thickness can be estimated by

where c 1 = 0.8 for Newtonian fluids.
When the substrate speed and viscosity is low, as is the case for sol–gel process, the coating thickness can be found from
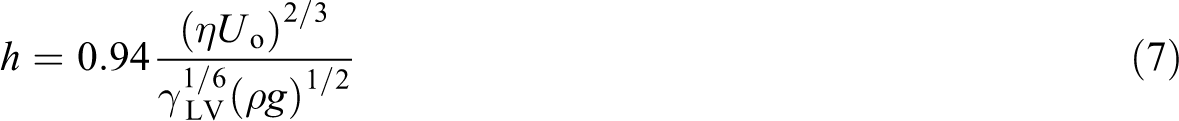
In the above, h = the coating thickness, η = viscosity of the sol–gel, U o = substrate speed and γ LV = liquid–vapour surface tension.
Spin coating technique
Spin coating is an incredibly effective technique for producing high quality, uniform thin films. In this technique the substrate spins around an axis which should be perpendicular to the coating area (Figure 17).

Spin coating process. Reprinted from Attia et al. 72
This technique has four steps: deposition of the sol, spin up, spin off and gelation by solvent evaporation. In comparison with the dip coating method, spin coating technique can produce homogeneous thin coatings, even for non-planar substrates. A model is presented for the description of thin films prepared from solution by spinning; using only the centrifugal force, linear shear forces, and uniform evaporation of the solvent, Meyerhofer 75 split the spin coating into two stages: one controlled predominantly by viscous flow and the second controlled by evaporation. He calculated the final thickness of the film as functions of the various processing parameters as:

where h is the final thickness, ρ
A is the mass of volatile solvent per unit volume and
Bornside et al. 76 predicted film thickness based on the initial properties of the polymer solution, solvent and spin speed. They reported a wet film thickness, h w, at which the film is supposed to become immobile can be found from

where κ is the mass transfer coefficient,

The above analytical model proposed was found to agree within 10% over the whole film thickness range. 77
Flow coating process
In this method, the coating liquid is poured over the substrate. The thickness of the coating depends on the angle of inclination of the substrate, the coating liquid viscosity and the solvent evaporation rate. In this technique usually after the coating, spinning the substrate helps to generate a more homogeneous coating, otherwise the thickness of the coating will increase from the top of the substrate to the bottom (Figure 18).

Sol–gel, flow coating technique. Reprinted from Attia et al. 72
Spray coating technique
This method is used widely in the industry and is suitable for coating irregularly shaped objects. In comparison with the dip coating method, this method is faster and wastes less of the sol material.
Capillary coating technique
In previous four methods, there is some wastage of the coating liquid, for example, in the spray coating, 100% overspray is done, 72 while in dip coating and flow coating only 10% to 20% of the coating liquid is used in the fabrication of the final coating. This waste can be overcome using the capillary technique (Figure 19). In this method, the substrate is held upside down by the help of a chuck and then a tubular dispersal unit is moved gently under the surface of the substrate and deposits the coating liquid on to the surface. A solution reservoir collects the excess of fluid and pumps it back into the system to ensure that the deposition of the solution is continuous during the process. 72

Sol–gel capillary coating technique. Reprinted from Attia et al. 72
The coating thickness depends on the deposition rate vd according to equation

where the exponent a and empirical factor k are dependent on the viscosity, surface tension and density of the fluid used.
Roll coating technique
In this technique, the liquid flows into a narrow gap between two rotating cylinders. This method is good for the painting, photographic and tape-recording industry, where coating of a large surface area with one or several uniform layers is desired.
The coating quality strongly depends on the substrate preparation; for that reason using solvent cleaning or sand blasting and surface activation through plasma treatment are strongly suggested before coating to remove the dust and organic materials such as oil stains from the substrate and also improve the adhesion properties through the addition of functional groups to the substrate.
Sol–gel applications
Sol–gel coatings are considered as potential candidates to substitute environmentally unfriendly chromate surface treatments for metallic substrates. These coatings are used for different purposes as explained below.
Wear-resistant coating
This technique is used to manufacture erosion-, corrosion- and abrasion-resistant coatings to protect substrates such as wind turbine blades, aeronautic structures, submarine body, low-carbon structures and mild steel industrial components. 44,59,71
Hydrophobic coating
Coatings with water-repellent properties are being increasingly used to serve as protective coatings on windows, car windshields, solar panels, building exteriors, wind turbine blades and other large outdoor surfaces. Sol–gel technology is the preferred route to produce such coatings; for instance, Dou et al. 78 developed a single-layer hydrophobic antireflective SiO2 coating prepared by sol–gel method with 300 nm thickness, 97% transmittance and large static water contact angle (WCA) of 130.6° to improve the optical performance of the optical system efficiency by restrain the absorption of the moisture in the air.
Anti-fog coating
The sol–gel process is also used to produce hydrophilic coatings on glass materials by dispersing the water across the surface and preventing aggregated water molecules to be seen as a droplet and produce fog. There are variety of applications for these glasses, for example, optical lenses, eyeglasses, bathroom mirrors, covers for headlights and vehicle windows.
Self-cleaning coating
This coating has many applications in different industries like textiles, paints, window glasses and cements. This coating saves the costs of cleaning and also increases the duration of woven products. The self-cleaning coating can be hydrophobic or hydrophilic.
Antimicrobial coating
This coating is really important to reduce the presence of bacteria on different surfaces that people touch in their daily life, For example, using silver-titanium dioxide nanocoating in subway train interiors reduces the presence of bacteria by up to 60%. 79
Anti-stain coating
This coating has wide applications in different industries such as textile, construction, automotive and electronic because of stain-resistant and hydrophobic characteristics. Anti-stain coatings are hydrophobic coating and they are able to decrease the attachment of the foreign particles to the surface. In this area, using organic–inorganic hybrid systems are attractive because they can improve the quality of the coating. For example, polyimide/silica hybrid anti-stain coating which synthesized by sol–gel method has characteristics such as hydrophobic, hydrophilicity and optical transparency. 79
Self-healing coating
One of the most important problems with the polymer composites in structural applications is the formation of microcracks. From engineering point of view, the ability to repair microcracks can increase the lifetime, safety and durability of a structure. Self-healing materials are able to repair and recover structural ability after damage. Self-healing can be done in a form of capsule or vascular which are different in term of the damage volume that can be healed, repeatability of the healing process and the recovery rate for each approach. 79
Evaluation of mechanical properties of sol–gel-derived coatings
The mechanical properties of the sol–gel-derived coatings strongly depend on the residual stress in the coating. 80 It has been reported that stress is induced in the coating on deposition and it increases as the coatings are consolidated during the curing process and even during the heat treatment condition. 81 The total stress in the coating is the sum of stress developed after the evaporation of the solvents during drying. The stress causes shrinkage of the coating. 82 The stress within the coating also depends on the density of the coating material, heat treatment temperature (increasing the heat treatment temperature will increase the stress level in the coating), water–precursor ratio (higher water–precursor ratio will result in a higher level of stress in the coating), coating thickness (increasing the thickness of the coating will increase the level of stress in the coating). The stress should be kept as low as possible in order to produce a good coating. 80
For the mechanical properties evaluation of the sol–gel-derived coatings, the following tests are commonly performed: The adhesion properties of the coating, Pencil hardness test, and Abrasion resistance.
Evaluation of adhesion of sol–gel coatings to substrate
The adhesive bonding of the coating to the substrate is assessed by the amount of force required to separate the coating from substrate. Coating can fail in two ways: interface deboning of the coating from the substrate and cohesive failure due to crack propagation through the coating. 67 This can be analysed using different tests as described below.
Indentation test
This test is used to analyse the adhesion in relation to the performance of real engineering components in service. 83 Fracture toughness can be measured from the interfacial cracking when the film cracks during indentation.
Scratch test
This test is used to analyse the adhesive properties of the coating (Figure 20), the results are influenced by coating thickness, substrate mechanical properties, interfacial bond strength and test conditions such as scratch speed, load and indenter tip radius. 67
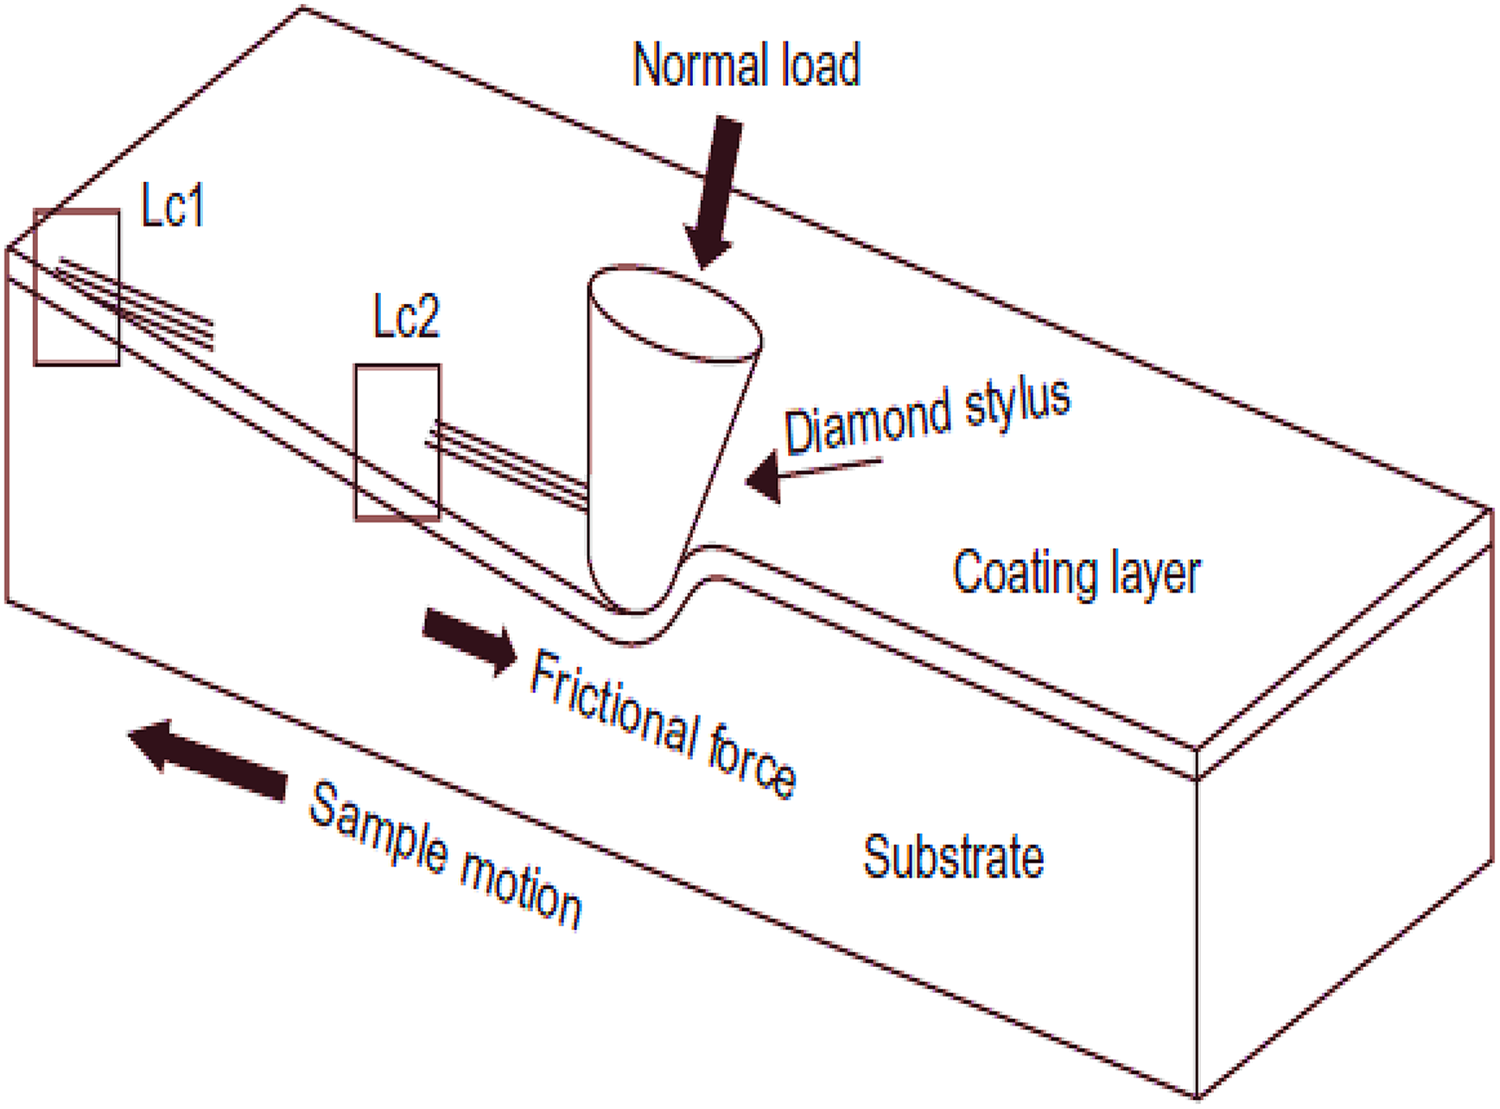
Schematic diagram showing the indenter scratching the work piece. Reprinted from Kalidindi et al. 67 with the permission of Elsevier publishing.
Cross-hatch cut and scotch tape test
This is a standard test for the evaluation of the adhesive properties of a coating involving the measurement of the material removed from the square grid by using a cutter with sharp cutting edges spaced at 1 mm from each other that pressed against the coating and scratched to make deep grove. This test is based on the material removal and adhesion of the coating, which is ranked from 5B (excellent adhesion) to the 0B (very poor adhesion) as shown in Table 1.
Classification of adhesion level of the coating by cross-hatch cutting. 84

UV: ultraviolet; MW: microwave.
Pull-off adhesion test
This test is used to if a coating is fit for service. The result is often critical to the acceptance or rejection of a coating process, as the adhesion value quoted by the coating manufacturer can be adversely affected by aspects of the coating process. Low adhesion values are indicative of inadequate surface preparation of the substrate.
In this test, a test dolly is glued to the coated surface and then a perpendicular tensile force is applied to the surface in an effort to remove both the dolly and the coating from the substrate. ASTM D4541 and BS EN ISO 4624 describe several different test apparatus. A measure of the adhesion of the coating system is the force at which the coating fails and the type of failure obtained.
Evaluation of hardness of sol–gel coatings by pencil hardness test
This test measures the hardness of the sol–gel and other organic coating on any rigid substrate. According to the standard ASTM D3363-05 (200) for this measurement, a set of pencils with increasing order of hardness are used (9B to 9H) to make a scratch on the coated substrate by holding the pencil firmly in a rolling holder at 45° to the ground and pushed for a scratch length of 6.5 mm.
Evaluation of abrasion resistance of sol–gel coatings
Crockmeter and Taber tests are the most common tests for analysing the abrasion resistance of sol–gel nanocomposite coatings.
Crockmeter test
This test employs a 10 mm diameter finger rubbing on a flat work piece in a reciprocating motion. In this method, a normal load of 4.5 N for a minimum stroke length of 20 mm is applied to the work piece.
Taber test
The advantage of this test over the Crockmeter test is quantification of the worn surface by measuring the weight of the sample before and after the test. In this test, two loading arms are provided for applying normal load and holding abrasive wheels of 52 mm diameter and a width of 12.7 mm on the specimens. There are different grades of abrasive wheels for this test, which are CS17 for hard coatings and CS10, CS10F for relatively soft coatings. 85
Sol–gel fast curing
Typically, sol–gel coated surfaces need a separate curing treatment involving heating at temperatures between 100°C and 200°C. This treatment increases the manufacturing costs, especially when a sol–gel coating is applied to already existing production chains, but it can make a major contribution to the enhancement of the sol–gel coatings properties such as their hardness and adhesion. 86 For instance, for the silane base coating, formation of the –Si–O–Si– silaxane chains through the condensation of excess silanol groups can result in a dense network layer that can be act as a barrier against species like water drops. This dense layer can be formed upon curing, so the curing time and temperature are key factors of this process. If the curing period was inadequate, the result would be a porous film with low cross-linking density. On the other hand, if the curing time and temperature exceed the optimum range, it might lead to formation of a brittle film. A variety of curing techniques have been used including thermal curing, ultraviolet (UV) curing, microwave (MW) curing, dual process (UV + MW) and infrared curing. 66 A fast curing technique is a major commercial requirement; the short curing times for UV and MW techniques means they are preferred to thermal methods even though they provide coating with the lower pencil scratch hardness. 66
UV curing
This is a clean and fast technique which provides a high-quality finishing. 87 UV curing has some advantages over the traditional methods, such as high speed, easy to control, energy efficient, low temperature needed, no solvent needed (as curing process done by polymerization) and the high finishing quality. Factors that affect the curing rate are monomer component in the UV resin, coating thickness and the intensity of UV per unit area. It should be mentioned that the UV energy decreases exponentially with depth and the curing speed will increase with the amount of UV energy per unit area at a non-linear rate.
Cakir 88 used a UV curing technique to cure the sol–gel-derived hybrid polymer-based coating, which used to cover the aluminium substrate. He first heated the coating at 35°C in a vacuum oven for about 10 min to remove the trapped air from the mixing process and then UV curing process was performed by using a medium pressure mercury lamp (150 w/cm, λ max: 320–390 nm), with the speed conveyor belt of 5 m/min.
MW curing
MWs are electromagnetic waves with a frequency from 300 MHz to 300 GHz. Sowntharya and Subasri 66 performed four different curing processes to analyse the effect of each one on the coating (Table 2). As can be seen in the Table 3, when MW or UV curing methods were used alone, samples showed very poor pencil scratch hardness, even lower than the substrate scratch hardness, but by using a dual curing process it was increased. Samples which are thermally cured show greater hardness in comparison with the samples that are cured by dual curing methods because of the curing time, dual curing technique is preferable to the thermal curing method as it is a fast curing technique.
Setup of four different curing techniques. 66

UV: ultraviolet; MW: microwave.
Thickness and pencil hardness of SiO2-TiO2 hybrid coatings cured by different methods. 66

UV: ultraviolet; MW: microwave.
Sol–gel with additive carbon nanotubes and graphene nanoparticles
In sol–gel coatings, the hardness and mechanical resistance can be increased by adding nanoparticle reinforcement to the coating. 44 Many researchers have developed different methods of dissolving the additive nanoparticles in an appropriate solvent and then made hybrid materials which take advantage of the exceptional material properties of the nanoparticles. As a result, they improved the mechanical, thermal and electrical properties of the coating.
In this section, the review is focused on previous works on using CNPs, specifically carbon nanotubes (CNTs) and graphene for improving the erosion resistance of coatings.
Carbon nanoparticles
In the last two decades, many researchers have investigated nanomaterials, with diameters less than 100 nm, as additives in the manufacturing of coatings. 89 There are a variety of nanomaterials interesting properties. Among them, one of the most promising is CNPs. 90 With their attractive properties such as nanoscale diameter, high aspect ratio, low weight, high electrical conductivity and extraordinary mechanical, optical, and thermal properties, CNTs and graphene have attracted much attention in the last decade. Many investigations have shown that a small amount of these nanomaterials resulted in a dramatic improvement in the electromechanical properties of their composite materials. However, due to their agglomeration or tangled coils as a result of strong van der Waals interactions, their functionalization is essential in achieving proper dispersion in polymer matrices and obtaining outstanding electromechanical properties. Figure 21 displays the number of published research papers recorded on Scopus containing the word carbon nanotubes, CNT and graphene from 2010 to 2017. It is clear that in recent years, more attention is devoted to graphene and the ratio of graphene/CNT published works in 2017 is 2.27 while the number of CNT published work is stabilized around 5300 articles.

Number of publications with titles including ‘carbon nanotubes’ and ‘graphene’.
Carbon nanotubes
CNTs are an allotrope of carbon and have a long one-dimensional cylindrical tube shape of carbon atoms. 91 CNTs are classified as single-walled (SWCNTs) originally reported in 1993, 92 and multi-walled (MWCNTs) first discovered in 1991 both by Iijima. 93 SWCNTs are created by rolling a single layer of graphite into a seamless cylinder. SWCNTs have two separate regions, sidewall of the tube and its end cap. The transmission electron microscope (TEM) images of a SWCNT and a MWCNT are shown in Figure 22. 94
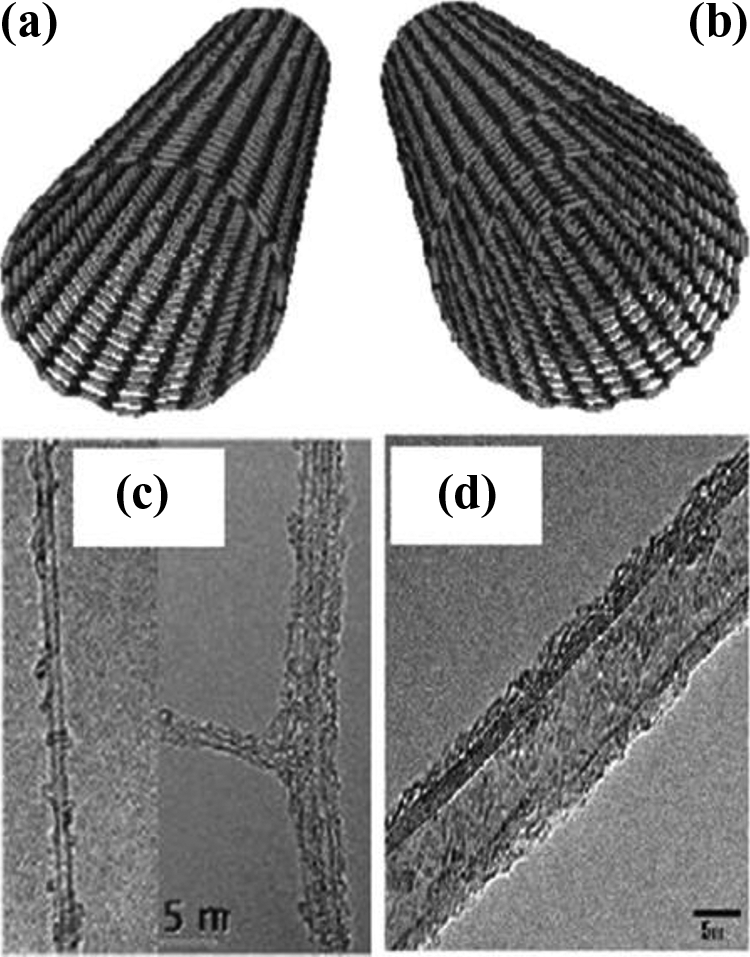
Schematic structure of (a) SWCNT and (b) MWCNT. The TEM images of a (c) SWCNT and (d) MWCNT. Reprinted from Eatemadi et al. 94 with the permission of Springer Publishing.
In the SWCNT structure, covalent bonds are acting like a beam element between the carbon atoms, resisting stretching, bending and torsion.
81
The morphology of SWCNT is classified according to the way that the single layer of graphite sheet (hexagonal structures) is wrapped into a cylindrical tube and capped with half shape of fullerene structure.
95
The orientation and magnitude of chiral vector

where
On the other hand, MWCNTs consist of multiple layers of graphene that form concentric tubes. Depending on the number of layers, the inner diameter varies from 0.4 nm up to a few nanometres and the outer diameter varies from 2 nm up to 30 nm. Also the distance between the graphene layers is approximately 0.34 nm to 0.39 nm. 94 MWCNTs can be found in two structural models; Russian doll model which is when a CNT contains another nanotube inside it with a smaller diameter than the outer one and Parchment model is the one when a single graphene sheet is wrapped around itself manifold like a rolled up scroll of paper. 94
CNTs have high tensile strength and are as strong as a carbon–carbon bond. In Table 4, the material properties of SWCNTs and MWCNTs are compared with graphene and stainless steel. 97
Comparison of CNTs and graphene material properties with stainless steel.
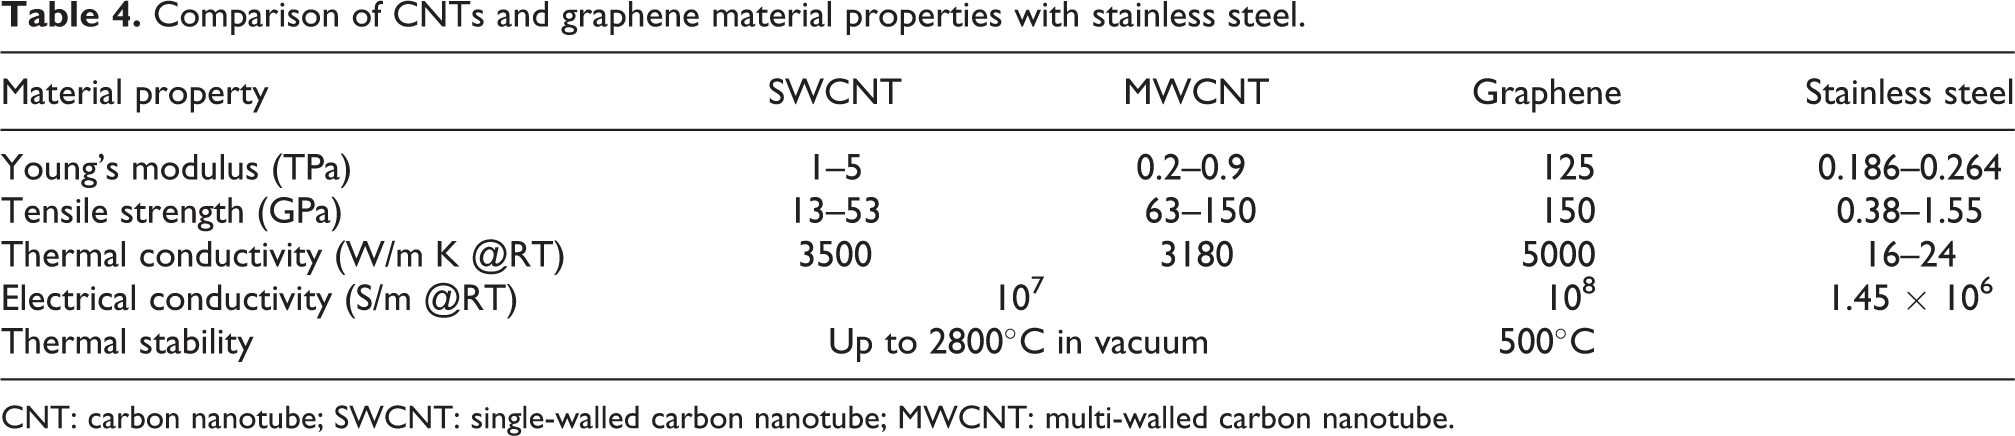
CNT: carbon nanotube; SWCNT: single-walled carbon nanotube; MWCNT: multi-walled carbon nanotube.
CNTs are used in many different areas including the fabrication of flat panel displays, gas storage devices, toxic gas sensors, lithium batteries, advanced polymer matrices, lightweight composites, conducting paints and electronic nanodevices and so on.
Graphene
Graphene is a two-dimensional allotrope of carbon which is only one carbon atom thick and arranged in a hexagonal lattice, 91 first discovered in 2004. 98 Graphene is super strong, about 200 times stronger than steel, and has a very high stiffness. It is believed that graphene and CNTs are two of the toughest materials ever tested to date. 99 Graphene is highly transparent, extremely light and an excellent conductor of heat and electricity. Graphene has the highest thermal conductivity of all carbon allotropes and it can carry heat better than any other material. 98 It is possible to stretch the graphene by 25% of its original length without any breakage happening in its structure. Because of the superior mechanical properties of the graphene, it is used to produce hybrid composites which are stronger, tougher, thinner and also lighter than the existing composites. Graphene is also used to increase the electrical conductivity of the composites as well. 99
Functionalization of CNTs and graphene
When introducing the individual CNPs into a polymer matrix, it is important to achieve thorough dispersion of the CNPs and strong interfacial interactions between the CNPs and the host polymer matrices. However, due to strong van der Waals forces, it is difficult to disperse CNTs and graphene into the matrix. Therefore, surface functionalization of CNPs is required in the fabrication of nanocomposite coatings.
Usually after purification of CNTs, to increase the solubility of the CNTs further chemical treatments are needed. These chemical treatments are called surface modification of CNTs which increases the solubility of the CNTs in most organic and aqueous solvent. 100 Different methods for functionalizing CNPs have been developed Figure 23. These methods include chemical, mechanical, electrochemical, and irritation reactions. Using these methods, the carbon surface can be activated for subsequent interaction with the host matrix through covalent bonding or non-covalent interactions. 101 Covalent functionalization is done by directly binding heteroatoms or functional moieties to the carbon lattices by chemical modification. Amino-functionalization of CNTs enhances the activity of the CNT as both modifier and cross-linker to form covalent bonding with host polymer matrix.

Different surface functionalization methods for CNPs. Reprinted from Alam et al. 101 with the permission of Elsevier Publishing.
The functionalization efficiency can be characterized and quantified using a range of analytical techniques, including: X-ray photoelectron spectroscopy (XPS), thermogravimetric analysis (TGA), Raman spectroscopy, Fourier transform infrared spectroscopy (FTIR), transmission electron microscopy (TEM), scanning electron microscopy (SEM), atomic force microscopy (AFM), X-ray diffraction (XRD), contact angle measurement and Brunauer-Emmett-Teller (BET) surface area measurements. TGA is commonly used for quantitative determination of grafting molecules bound to the surface of nanomaterials. 102 High residual char content is representative of a high amount of carbon skeleton while the mass losses can be related to the mass of grafted molecules. The extent of functionalization can be determined using the following equation 103

where R is the graft ratio, x is the weight loss of the CNP, Ma and MC are the atomic weight of carbon and molecular weight of the grafting molecule, respectively.
In chemical oxidation functionalization, the distribution and the nature of the functional groups on the surface of CNTs are highly dependent on the type of oxidant used. As can be seen in the Figure 24, different oxidants affect the distribution of functional groups on the surface of MWCNTs. 104 MWCNTs oxidized with (NH4)2S2O8, H2O2 and O3 yielded higher concentrations of carbonyl and hydroxyl functional groups while HNO3, H2SO4/HNO3 and KMnO4 formed higher fractional concentration of carboxyl groups. 104 However, such modification is detrimental to the intrinsic optical, electrical and thermal conductivity properties of CNTs.

Influence of the oxidant on the distribution of oxygen-containing functional groups on the surface of MWCNTs. Reprinted from Wepasnick et al. 104 with the permission of Elsevier Publishing.
In the Table 5, some of these chemical oxidation techniques and their procedure are summarized.
Summary of different oxidation procedures to functionalize MWCNTs.
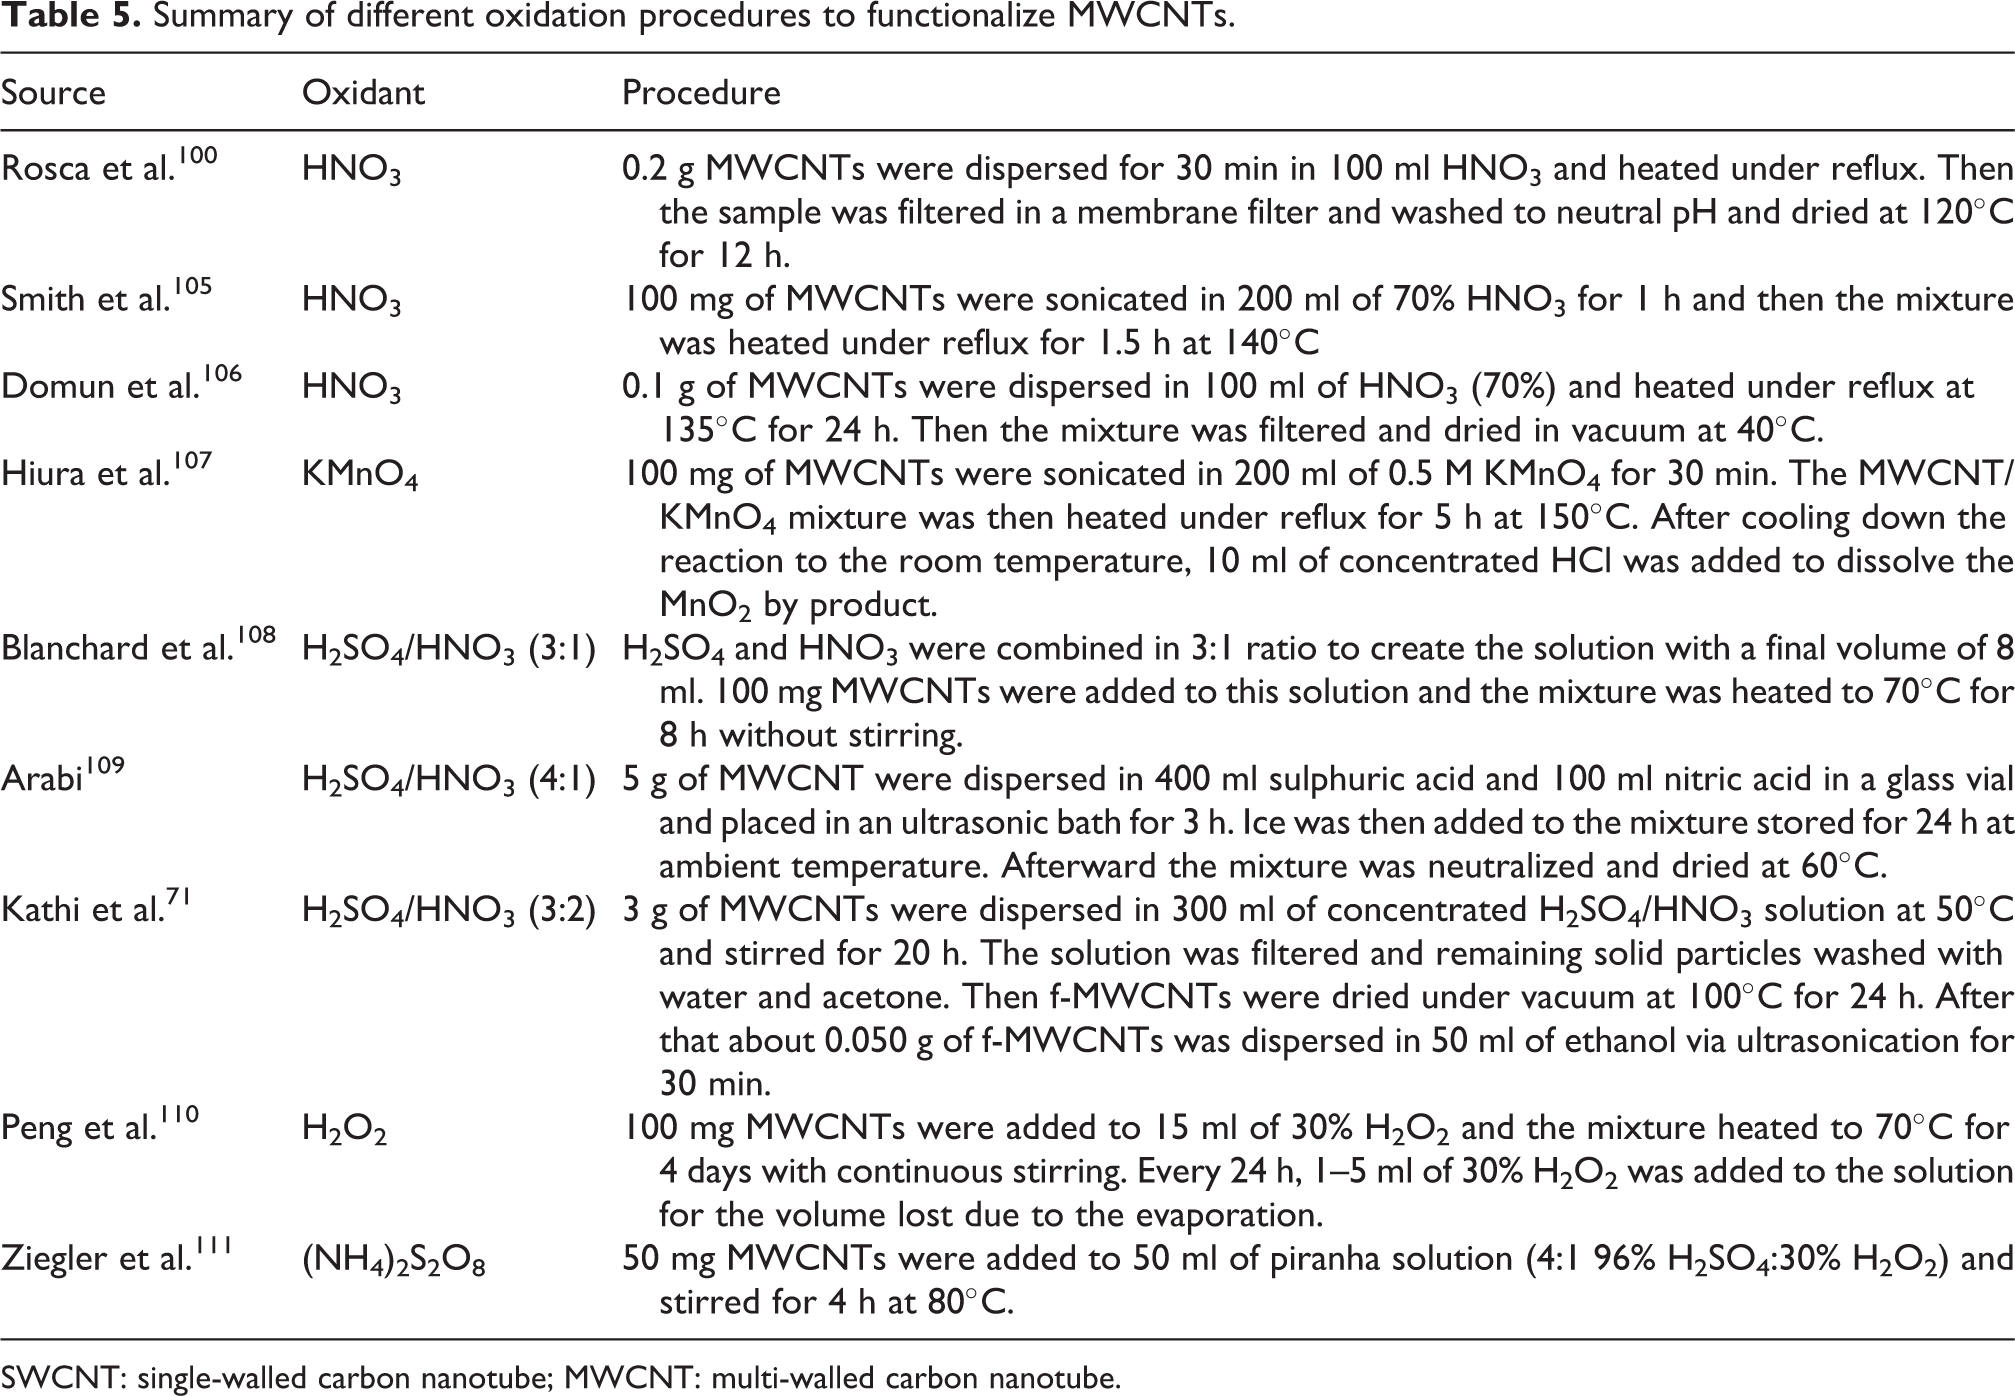
SWCNT: single-walled carbon nanotube; MWCNT: multi-walled carbon nanotube.
Amine-functionalized CNTs may be covalently bonded to polymer matrices, such as polyepoxides, polyimides and polyamide. 112 Amine-functionalized graphene CNTs have been used as reinforcing agents, cross-linkers and in catalysis, and play multiple functions in epoxy composites. 113
Functional groups can be created on the carbon surface as a consequence of mechanical grinding and shearing. Ball-milling exfoliates graphite into multi-layer carbon nanoplatelets 114 and breaks MWCNT agglomerates under certain treatment conditions (e.g. duration, temperature and organic modifiers), generating functional groups on the carbon surface. Similar levels of dispersion of MWCNTs were found for those treated by ball-milling for 20 min with those treated with concentrated acids for 120 min, but the MWCNTs were highly shortened after ball-milling. 115
The edges of graphene nanoplatelets (GNPs) can be functionalized by ball-milling of graphite in the presence of hydrogen, carbon dioxide, sulphur trioxide and/or carbon dioxide/sulfur trioxide. The amount of functional groups formed was around 65–87 wt%, determined from TGA at 800°C in nitrogen. From Raman spectroscopy, the intensity ratios I D /IG of the D-band (1350 cm−1) to G-band (1584 cm−1) were in the range 0.79–1.50, 116 indicating a significant size reduction in platelet size due to mechanochemical cracking and edge distortion.
In addition to the wet chemistry and mechanochemistry methods, cold plasma, especially low-pressure plasma treatments have become one of the key technologies for surface modification of materials. The highly energized gas species of the plasma can penetrate and break covalent bonds to a depth of several nanometres. The activated surface can then readily react with the excited gas species to form functional groups. The level of surface functionalization is determined by the gas type and treatment parameters such as pressure, power input, flow rate and time. 117
Different plasmas can introduce different functional groups onto the surface, as shown in Figure 25. 101 For surface modification, a variety of inert gases such as oxygen-containing gases including O2, CO2 and H2O; nitrogen-containing gases including NH3 and N2, as well as other gases such as H2, Ar, P and He have been investigated. Fluoro- or hydrocarbon containing gases such as BF3, CF4, styrene, allylamine, acrylic acid or maleic anhydride can induce plasma polymerization reactions to form pinhole free polymer nanocoatings on the surface. Ammonia, sometimes in a mixture with other gases (N2, Ar, O2, CF4), is often used as precursor to introduce amine functionality to CNPs to enhance hydrophilicity and biocompatibility. 117 Oxygen plasma treatment can generate oxygen-containing functional groups such as –COOH, C=O, –OH, C–O–C, and –CO3 on the surface of carbon, providing a reaction platform for further interaction with polymers. Ammonia, N2, and N2/H2 plasmas introduce primary, secondary and tertiary amines, as well as amides. 118

Possible functional groups formed via plasma modification of CNPs. Reprinted from Alam et al. 101 with the permission of Elsevier Publishing.
Several chemical procedures have been developed to obtain dispersible functionalized graphene. One of the most effective is the covalent attachment of functionalities to pristine graphene). 119 The main advantage of this method is increasing the dispersibility of graphene sheet in organic solvents which is an important move towards formation of nanocomposite materials with graphene. For instance by functionalization, allows the addition of chromophores, which can help improve conductivity. 120 Covalent bonds can be formed by reaction between free radicals or dienophiles and C=C bond of pristine graphene or between organic functional groups and the oxygen groups of graphene. Figure 26 shows different graphene covalent functionalization methods.

Graphene covalent functionalization methods. Reprinted from Park et al. 121 with the permission of ACS Publishing.
For example nitro-phenyls functionalization of the graphene sheet has been achieved via radical chemistry, Figure 27.

Chemical doping of graphene with 4-nitrophenyl groups: (a) schematic representation; (b) SEM image of a graphene nanoplatelet between Pt electrodes; (c) AFM image of a fragment of a monolayer graphene. Reprinted from Sinitskii et al. 122 with the permission of ACS Publishing.
Another alternative is using carbene precursors to functionalize the graphene sheet, 123 Chloroform and diazirine as carbine precursors have been used to functionalize graphene oxide.
Nitrenes have also been used in the functionalization of graphene sheet. Graphene sheets were reacted with Boc-protected azidophenylalanine in ODCB. The product was determined to have 1 phenylalanine substituent per 13 carbons (Figure 28).
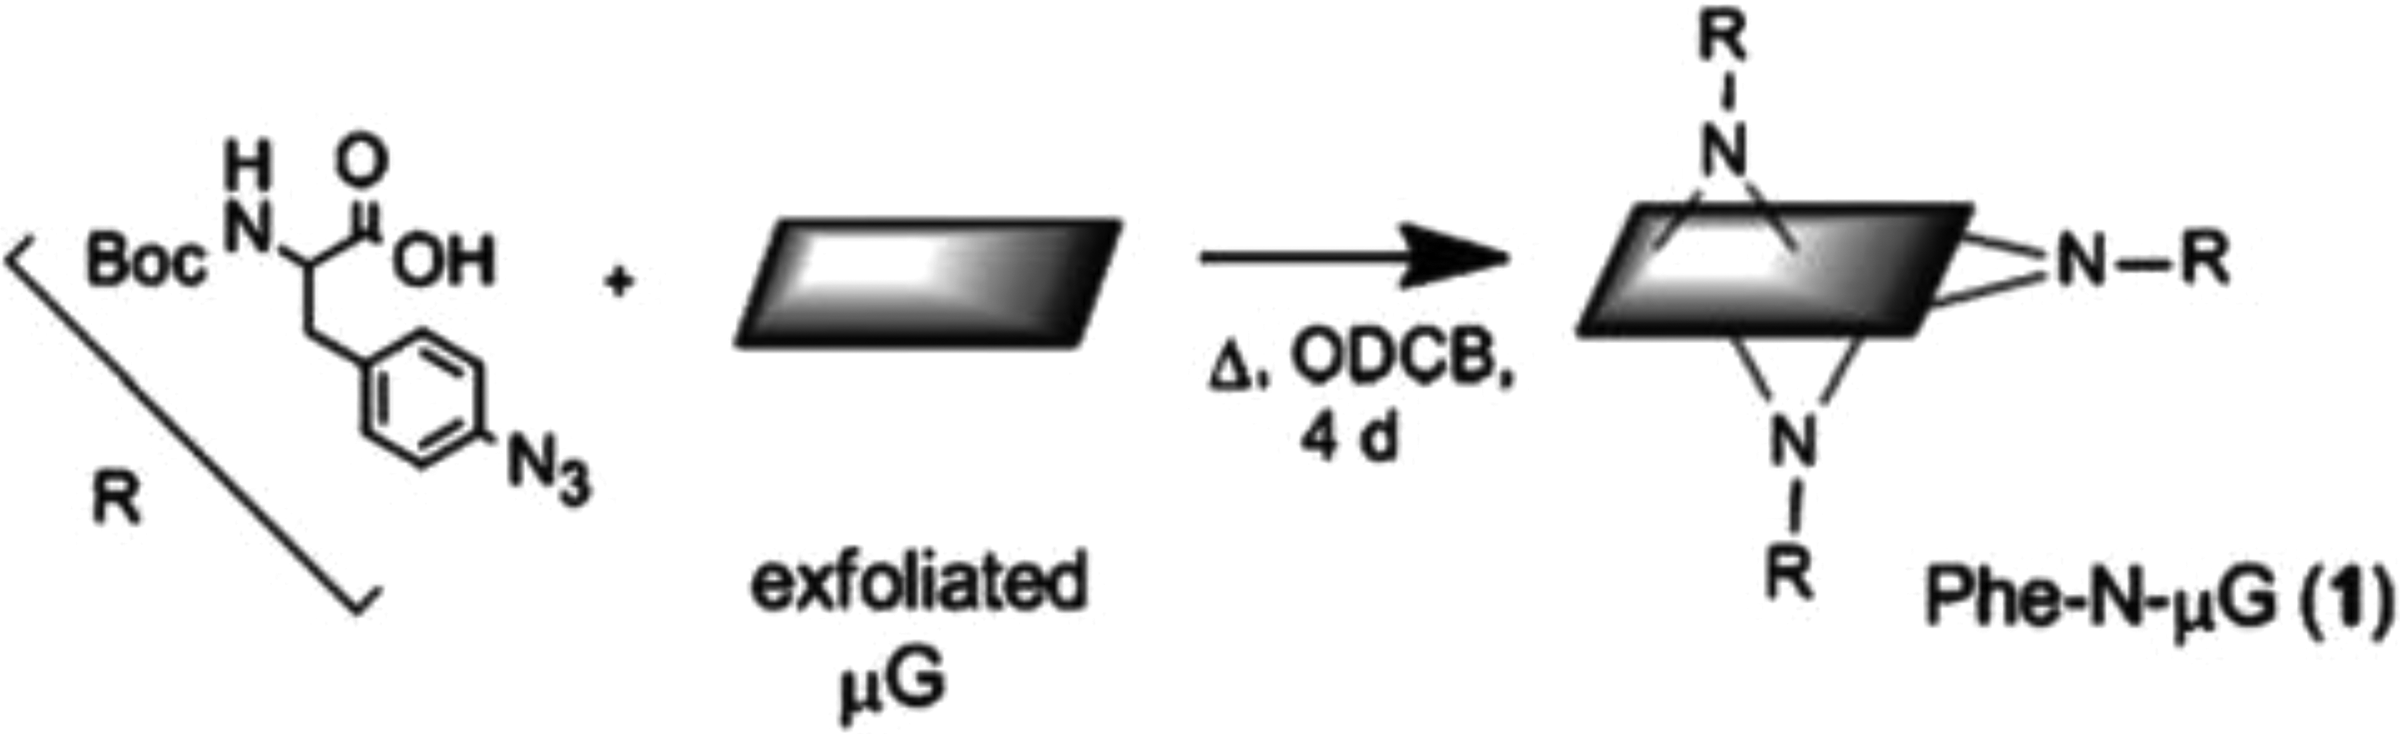
Nitrene addition to graphene sheets using Boc-protected azidophenylalanine. Reprinted from Strom et al. 124 with the permission of RSC Publishing.
In this method the degree of functionalization is dependent on the amount of nitrene added to the reaction mixture (Figure 29).

The reaction of alkyl nitrenes with graphene sheets. Reprinted from Vadukumpully et al. 125 with the permission of RSC Publishing.
In general covalent modification breaks the extended conjugation of π-electrons in graphene, resulting in band gap opening and change in conductivity, Also added functional groups to the surface of the graphene sheet will control the chemical properties of the graphene and allows further conjugation of additional molecules and materials to the graphene; beside that covalent modification can improve their solubility and ability to be processed. 121
Increasing hardness of sol–gel coating
Increasing the hardness of the coating makes it more durable under the impact loading by the liquid droplet, 38,44 Figure 30 shows the main parameters that have an effect on the hardness of the sol–gel-derived coating.

Main parameters that have effect on the hardness of the sol–gel-derived coating.
Andrade et al. 126 provided an economic and convenient inorganic sol–gel route to improve the hardness of the sol–gel coating by adding SWCNTs to the silica matrix. They used water as a precursor of silica and SWCNTs with an average diameter of 1.2 nm and a length of 2–4 μm as a reinforcing agent. In their study, they used pure silica pellets as a reference and prepared composite silica-SWCNTs with 4 wt% CNT loading. The microhardness of the pellets was measured using a diamond Vickers indenter with a load of 9.8 N and a dwell-time of 10 sec (at least 10 measurements per samples). The composite and the pure silica showed a microhardness of 600 Hv100 and 470 Hv100, respectively. UV-Vis and Raman spectroscopy were used to investigate the microstructure of the composites. The Raman spectrum the hybrid CNT-silica film showed a high energy mode (HEM) of SWCNTs around the 1591 cm−1 which proves an interaction between the silica and SWCNTs (Figure 31).

Raman spectroscopy of the silica-CNTs composite film obtained by dip coating. Reprinted from Jung de Andrade et al. 126 with the permission of Wiley Inter Science Publishing.
SEM images of the silica-SWCNTs showed an interaction between the silica matrix and SWCNTs as well; they could improved the interfacial stress transfer in the composite and hindered crack propagation because of the effect of crack bridging by SWCNTs.
Lopez et al. 127 prepared a silica-MWCNTs hybrid coating with a 0.1 wt% MWCNT loading. They analysed the effect of the mixing technique of the sol–gel process on the hardness, fracture toughness and Young’s modulus of the hybrid coating. They used the dip coating technique (with a withdrawal speed of 10 cm/min) to deposit the coating on a magnesium alloy substrate. For the characterization purpose, field emission scanning electron microscopy (FESEM) and transmission electron microscopy (TEM) for the microstructural observation were performed. AFM was used to study the morphology and surface roughness. The nanoindentation technique was used to measure the hardness of the coating by applying maximum test loads of 100, 200 and 300 μN. The energy loss during indentation as a result of the coating failure was measured by Bushan’s procedure. The coating indentation fracture toughness (K c) was calculated from the size of the geometry of the residual imprint and the fracture dissipated energy (U fr), using the following equation:

where Ef and vf are the Young’s modulus and Poisson’s ratio of the coating, respectively, and Afr is the area of the coating which is 2πCR and CR is the length of the cracks developed from the indent edges.
Also the energy associated with coating failure, Ufr, can be derived from the difference between the experimental curve and the hypothetical curve which is obtained in absence of failure.
In this study the coatings were fabricated by two mixing methods, mechanically mixing (MM) and ultrasonic mixing (UM). For the UM sol, FEG-SEM showed a different result, Figure 32, for the unreinforced coating at the low magnification the coating seems to be uniform and free of cracks, while at higher magnification small defects are revealed in the flatter zone of the surface. It shows that when the coating is reinforced with MWCNTs an extremely porous microstructure is observed. For the reinforced coating made by UM method there were no free CNTs observed and all the CNTs completely embedded to the coating structure.

FEG-SEM micrograph of the ultrasonic mixed coatings, unreinforced condition (a) at low magnification, and (b) at high magnification; reinforced condition (c) at low magnification and (d) at high magnification. Reprinted from Lopez et al. 127 with the permission of Elsevier Publishing.
As can be seen in the Table 6 the reinforced ultrasonicated coating (UM + CNTs) was the softest material tested, and the values measured for the MM and MM + CNTs coatings were similar. The results highlight that the inclusion of the CNT in the sol–gel material by conventional method did not modify in great extent the silica coating properties.
Average Young’s modulus and hardness of the different tested specimen obtained by nanoindentation. 127
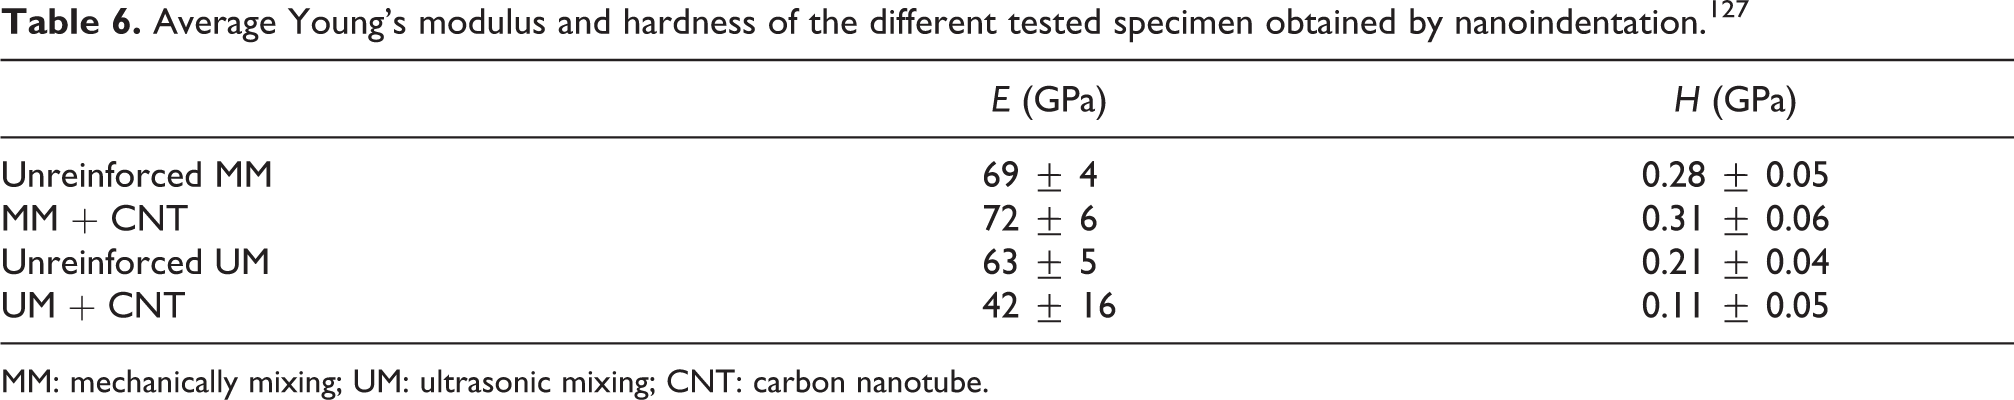
MM: mechanically mixing; UM: ultrasonic mixing; CNT: carbon nanotube.
Maeztu et al. 71 used a multi-layered sol–gel nanocoating to fabricate a new coating on the aluminium with a dual property of hydrophobicity and corrosion resistance. This combination consisted of hybrid sol–gel matrix with a graphene oxide base to provide the corrosion resistance and a simple sol–gel matrix containing fluorinated polymeric chains to provide hydrophobic properties. 71 In their study they tried to optimize the mechanical properties of the coating by performing thermal treatment (180°C- overnight). After thermal treatment, the hardness of the hybrid coatings was determined using the pencil hardness test. The result of pencil hardness tests revealed that thermal treatment provided a chemical cross-linking between alkoxides, which increased the hardness of the hybrid coating by a factor of three.
Grundwürmer et al. 44 tried to enhance the mechanical properties of the sol–gel coating by adding ZrO2 nanoparticles to the structure of the hybrid sol–gel coating. For this purpose, they developed two types of coatings:
Sol-A, which is glycidoxy propyltrimethoxy silane (GPTMS) and tetraethylortho silicate (TEOS) and sol-B, which is GPTMS, aminopropyltriethoxy silane (APTES), phenyltrimethoxy silane (PTMS) and aluminium-sec-butoxide (AlB) with the ratio of (6.5:0.4:1:2). The hardness of the coatings was measured with Berkovich indenter, the average values of loading–unloading curves of three different maximum loads (300 mN, 100 mN, 30 mN, dwell time: 3 S) can be seen in. As a result of hardness measurement, it was found that adding the nanoparticle reinforcement to the coating which has the higher ratio of organic/inorganic components will reduce the hardness of the coating and erosion resistance, as well. Because the high organic content results in limited inorganic cross-linking between the nanoparticles and the inorganic part of the sol–gel matrix; however, adding the nanoparticles to the coating with the ratio (1:1) of organic/inorganic component will increase the hardness and erosion resistance of the coating. As can be seen in Figure 33 for the sol-B, adding the nanoparticles decreases the erosion resistance of the coating dramatically, while adding the same nanoparticle to the sol-A with the same ratio of organic/inorganic component will increase the erosion resistance.

Liquid impact erosion resistance. Reprinted from Grundwürmer et al. 44 with the permission of Elsevier Publishing.
Najafabadi et al. 38 focused on the optimization of compositional and process parameters of hybrid nanocomposite sol–gel coatings, resistant to rain erosion, by using a statistical design of experimental methodology based on Taguchi orthogonal design. The adhesion (pull-off), flexibility (impact and mandrel bending), hardness (a pencil scratch hardness measurement), wear (Taber wear index) and rain erosion resistance (SSET) of optimized coatings were analysed. The selected five parameters which have the main effect on the rain erosion resistant properties of the coating are: inorganic/organic molar ratio, hydrolysis water content, drying temperature, curing temperature, and curing time.
As a result of their study, the optimum coating with the highest rain erosion resistant have a GPTMS/TEOS ratio of 3/7, hydrolysis water content of x = 12, dried at 60°C, and cured at 130°C for 90 min. This coating had pencil hardness higher than 6H.
Increasing the resilience of the sol–gel coating
Resilience is the ability of a coating to absorb energy when it is deformed elastically, and release that energy upon unloading without formation of any cracks or other mode of failures. Higher resilience results in more erosion-resistant coating. 44
Grundwürmer et al. 44 analysed the effect of adding nanoparticle on the resilience of a sol–gel-derived coating. In their study, they added ZrO2 nanoparticles to the hybrid sol–gel coating. The flexibility of the coatings were measured by two different types of tests; impact test (ISO 1519) and mandrel bending test (ISO 1519). The tests are considered as passed when no cracks are observed and the coating remains stuck to the substrate without spalling.
All 6 types of sol–gel coating tested passed the impact test but three of them failed the mandrel test (sol-A (1:2), sol-B, sol-B-Zr) (Figure 34).

Results from impact and mandrel bending tests. All samples are flexible enough to pass the impact test. Less flexible coating failed the mandrel bending test. Reprinted from Grundwürmer et al. 44 with the permission of Elsevier Publishing.
For all six sol–gel systems, adding nanoparticles showed no negative effect on the flexibility of the coating. sol-A (1:2) which has a large inorganic/organic ratio, the coating shows less flexibility which means, a lower organic component (GPTMS) increase the degree of cross-linking and reduced resilience (flexibility) of the coating. For the sol-B having the harder component in its structure (AIB) decreases the flexibility of the coating and that is why it failed at mandrel bending 2 mm. However, for the sol-B-Zr, the addition of a large amount of nanoparticles (30 wt%) to its structure resulted in an increase in the hardness of the coating, causing the coating to fail in the 2 mm and 6 mm mandrel bending tests.
Najafabadi et al. 38 optimized the flexibility of a coating by performing impact (ASTM D2794) and mandrel bending (ASTM D522) Tests; their optimum coatings could pass the conical mandrel bending test and 151.15 in-lb impact resistance. A visual examination of the coated substrates showed that there were no cracks or loss of adhesion of the coating in the region of impact or the area of the bend. The results of the tests show that the optimized coating has excellent fracture toughness, and these coatings are very flexible and can withstand the stresses during fabrication. Also the study shows that the optimized coating good rain erosion resistance as it is hard enough to avoid cracks from rain droplet impact and also resilient enough (flexible) to absorb the impulse transferred by the water droplet.
Increasing the adhesion of the sol–gel coating to the substrate
With the sol–gel techniques it is possible to manufacture coatings with good adhesion to the substrate. The adhesion can be strengthened through covalent bonding between the sol gel and the surface via condensation with hydroxyl groups or via other linking groups (e.g. amines and epoxides) (Figure 35).

Schematic layer composition of the organic–inorganic hybrid coating reinforced by nanoparticles based on silica. Reprinted from Grundwürmer et al. 44 with the permission of Elsevier Publishing.
Grundwürmer et al. 44 used ZrO2 nanoparticle to enhance the adhesion properties of the coating. For this purpose cross cut tests (EN ISO 2409, GT0 = no spalling, GT5 = complete spalling) were performed and the results showed no negative effects on the adhesion properties as a result of adding nanoparticles to the coating (Figure 36).

Adhesion measured by cross cut test (ISO 2409, GT 0 = no spalling, GT 5 = complete spalling). The adhesion was measured prior to 14 days water immersion at RT (pre-H2O) and afterwards (post-H2O). Reprinted from Grundwürmer et al. 44 with the permission of Elsevier Publishing.
Najafabadi et al. 38 tried to optimize the adhesion properties of the sol–gel coating by changing the hydrolysis water content and the ratio of organic/inorganic components in the composite mixture. Adhesion of the coating to the substrate was evaluated by pull-off method. They found that increasing the hydrolysis water content and decreasing the organic content increased the silanol (Si–OH) concentration. This increases the possibility of the formation of Si–O–Allinks, and consequently, increasing adhesion of the coating to the substrate.
Increasing the WCA in sol–gel coating
Maeztu et al. 71 proposed a multi-layered sol–gel nanocoating onto aluminium to fabricate a new surface with a dual property of hydrophobicity and corrosion resistance. This combination consists of hybrid sol–gel matrix which is graphene oxide-based to provide the corrosion resistance and a simple sol–gel matrix which has fluorinated polymeric chains to provide the hydrophobic properties. 71 The surface and coating morphology was analysed by AFM, profilometry and scanning electron microscopy (SEM). The hydrophobicity properties and WCA were measured and the corrosion resistance was analysed by potentiodynamic polarization and electrochemical impedance spectroscopy.
Table 7 summarizes the WCA for the aluminium substrate coated with two step layer by layer coating (coating 1 and 2) at 6.
Effects of the two different types of coating, dips and thermal treatment on the WCA. 71

GPTMS: glycidoxy propyltrimethoxy silane; WCA: water contact angle; PFAS: perfluorooctyltriethoxysilane; MTEOS: methyltriethoxysilane; GrOx: graphene oxide.
Cyclic potentiodynamic polarization tests were used for corrosion resistance analysis. The results presented in Table 8 show that the corrosion resistance increases with increasing thickness of the samples (1 to 6 dips). Also the hybrid-coating GPTMS-MTEOS-GrOx-PFAS which was prepared by a two-step layer by layer coating had the lowest amount of pitting corrosion. In addition, it was found that an increase in the WCA correlated with an increase in the corrosion resistance. 71
Pitting corrosion as a function of the number of dips and thermal treatment. 71

GPTMS: glycidoxy propyltrimethoxy silane; PFAS: perfluorooctyltriethoxysilane.
Conclusion
The development of rain erosion coating for wind turbine blades requires tools for erosion lifetime prediction and identification of suitable combination of coating and composite substrate. It has been shown that protecting the LE of wind turbine blade against rain erosion is very important for making wind turbine energy production cost competitive. An overview of the liquid impact phenomena allowing one to identify how adhesion and erosion are affected by the shock wave caused by the collapsing water droplet on impact are discussed. It is reported that eroded blades can reduce the AEP of the wind turbine by 20–25%. Coating the blade against erosion using appropriate materials substantially reduces these losses and it is more economical to protect the blades from environmental erosion than repair or replace them.
The emphasis was on the sol–gel coatings for LE of wind turbine and their advantages and drawbacks are discussed; methods of depositing the sol–gel-derived coating on the substrate and improving the mechanical properties of the coating by using CNPs in the structure of sol–gel are reviewed.
A sol–gel-derived coating typically has a maximum thickness of the 10 μm which has a negligible effect on the weight of the blade. A sol–gel coating with increasing the hydrolysis water content, hardness and flexibility plus decreasing the organic/inorganic molar ratio will increase the rain erosion resistant. On the other hand, poor adhesion of the coating to the substrate will decrease the rain erosion resistant.
Various studies showed that addition of CNPs, especially CNTs and graphenes, in the structure of the coating greatly enhances the erosion resistant of the coating. However, proper functionalization of CNPs is required for effective dispersion which positively affects the properties of the coating.
Rain erosion durability testing of the coatings through accelerated rain erosion testing was discussed. Establishing the incubation time of the erosion damage is required from the rain erosion tests. The mechanical testing involved for establishing a suitable coating includes pull-off testing, peeling–adhesion testing and nanoindentation testing of the coating. In order to understand the details of erosion process and characterize the failure mechanism, numerical models of rain droplet impact simulations are necessary.
Prospect of new development of erosion resistance coating
At the moment there are different types of the erosion protection systems which are used to protect the wind turbine blades against environmental effects, such as tapes, paintable coatings and vacuum techniques like chemical vapour deposition. It is desirable to develop a new generation of coatings which are cost effective, durable and easy to apply. The new coating should have additional advantages over the existing coatings, such as: – Thin layer coating: having negligible effects on the weight of the blades. – Multifunctional properties: resistant to erosion, corrosion, abrasion, de-icing and having flexibility at the same time. – Lower temperature required for curing process: the coating should be able to be cured at room temperature or low temperature to reduce the energy consumption of the curing process. – Environmental friendly: can be achieved by using organic compounds in the structure of the coating. – Desirable mechanical properties: High tensile strength and flexibility, good adhesion to the substrate and having stable chemical properties which can be achieved by using CNPs in the structure of the coating.
The sol–gel technique has the potential for development of coatings with the above characteristics.
Footnotes
Declaration of conflicting interests
The author(s) declared no potential conflicts of interest with respect to the research, authorship, and/or publication of this article.
Funding
The author(s) received no financial support for the research, authorship, and/or publication of this article.