
Abstract
Mg1.5Al2O4.5:x% Eu3+ (0 ≤ x ≤ 2) nanopowders were successfully synthesized via sol–gel method. The X-ray diffraction (XRD) spectrum revealed that the Mg1.5Al2O4.5:x% Eu3+ matches the single phase of face-centred cubic MgAl2O4. The estimated average crystallite sizes calculated using the XRD spectra were found to be in the order of 4 nm. The estimated crystal size was confirmed by the high-resolution transmission electron microscopy. The energy dispersive X-ray spectroscopy confirmed the presence of all expected elementary composition (Mg, Al, O and Eu). The field emission gun scanning electron microscope showed that varying the Eu3+ concentration influence the morphology of the prepared nanophosphor. The photoluminescence results showed that the host emits the violet colour at around 382 nm, which was attributed to the defects within the band gap (E g) of host material. The Eu3+-doped samples showed the emission at around 560, 580, 593, 618, 655 and 704 nm which are, respectively, attributed to the 5D1 → 7F3, 5D0 → 7F0, 5D0 → 7F1, 5D0 → 7F2, 5D0 → 7F3 and 5D0 → 7F4 characteristic transitions in Eu3+. The International Commission on Illumination colour chromaticity showed that the Eu3+ doping influences the emission colour.
Keywords
Introduction
Oxide material such as MgO·n-Al2O3 possesses a large variety of phenomenal properties, which are either attributed to the structural characteristics or to the defects within the lattice matrix. The excellent radiation damage resistance of the spinel has been attributed to its structural characteristics, 1 whereas the optical property has been ascribed to the defects such as the F and F+ centres. 2 Several colouration studies have been reported focusing on lattice defects such as vacancies and emission from the impurities (dopants). 2 Magnesium aluminate (MgAl2O4) has a marvellous structural peculiarity which is the ability to accommodate various cation species of different valence states into the tetrahedral (Td) or the octahedral (Oh) site. Due to the simplicity of ion incorporation or doping, MgAl2O4 is widely used as a host material for rare earth elements (REs) 3 and transitional metals (TMs). 4 Trivalent europium (Eu3+) ion is one of the most used or preferred dopants from the RE family where the red-to-pink emission is anticipated. 5,6 Kolesnikov et al. 3 reported the cubic MgAl2O4:Eu3+ nanocrystalline phosphors synthesized via the modified Pechini method. The X-ray diffraction (XRD) illustrated that the increase in Eu3+ doping concentration shifts the peak positions to the higher diffraction angles corresponding to the decrease of the crystal unit cell. The photoluminescence (PL) showed the presence of the broad band in the ultraviolet visible (UV) region which was assigned to the charge transfer (CT) transition between O2− and Eu3+ ions, which is an electron transfer from O2− (2p6) orbital to the empty orbital of 4f6 of Eu3+. Melato et al. 7 have reported the effects of annealing at different intervals on the MgAl2O4:0.3% In3+ system. The PL results showed that the photoexcitation of the F (277 nm) and F+ (342 nm) centres caused the radiative relaxation channel with the emission peaks located at 388 and 560 nm, which were, respectively, attributed to defect centres located at different levels. This host material has also been doubly doped 8 and recently triply doped 9 with other REs and TMs. 4,8 Brito et al. 8 have presented co-doped MgAl2O4 with Eu3+, Dy3+. The infrared spectroscopy (IR) spectra showed the presence of the bands around 700 and 520 cm−1, which correspond to the AlO6 groups building up the MgAl2O4 spinel. The Eu3+ ion was partially reduced to the divalent (Eu2+) state at the annealing temperature of 700°C and 800°C. This possibility of reduction of Eu3+ to Eu2+ at this temperature has recently been confirmed by Motloung et al. 9 on the triply doped MgAl2O4 system. The PL results revealed the existence of the energy transfer from Eu2+ → Tb3+ → Ce3+. The International Commission on Illumination (CIE) colour chromaticity confirmed that the emission colour can be tuned from bluish to greenish by varying the Tb3+ concentration and excitation wavelength. In all of these studies, 3 –5,8,9 the mole ratio of Mg:Al were fixed or kept constant at 1:2 without any clear motivation. Our previous results 10 in Mg x Al2O3+x :0.88% Cd2+ system have showed that the optimum mole ratio of Mg:Al is 1.5:2 for the optimum PL emission intensity. With this in mind, note that the Mg1.5Al2O4.5:x% Eu3+ system has never been reported in the literature to date. Hence, this study investigates the effects of Eu3+ concentration in Mg1.5Al2O4.5 nanophosphor with the main aim of developing or fabricating the alternative phosphor materials for the practical application such as in the light-emitting diodes (LEDs).
Experiment
The Mg1.5Al2O4.5:x% Eu3+ (0 ≤ x ≤ 2) series was synthesized via sol–gel technique. The host material was prepared by dissolving stoichiometric masses of magnesium nitrates hex-hydrate (Mg(NO3)2·6H2O, 99.9%), aluminium nitrates nanohydrate (Al(NO3)3·9H2O, 98.5%) and citric acid (C6H8O7·H2O, 99%) in deionized water. The stoichiometric molar ratio of Mg:Al was kept at 1.5:2 for all the prepared samples. A specified amount of europium nitrate penta-hydrate (Eu(NO3)3·5H2O, 99.9%) was added to dope with various x% Eu3+ at a range of (0 ≤ x ≤ 2). Note that all of the employed chemicals were purchased from Sigma-Aldrich. The heating temperature was kept at approximately 80°C for all the samples while constantly stirring the solution using a magnetic stirrer. The gels were then annealed at 800°C in a furnace for 1 h and the resulting samples were ground into fine powders.
The powder samples were then analysed using different techniques. Bruker D8-Advance powder XRD with a CuKα (1.5405 Å) radiation was used to study the crystal structure of the prepared nanopowders. Zeiss supro field emission gun scanning electron microscope (FEG-SEM) coupled with Oxford XMaxN energy dispersive X-ray spectroscopy (EDS) was used to study the surface morphology, elementary composition and distribution. JEOL 2100 LaB6 high-resolution transmission electron microscopy (HR-TEM) was used to study the crystallite size of the prepared nanopowders. Diffuse reflectance spectra were recorded using a Lambda 950 UV–vis spectrophotometer with an integrating sphere using spectralon as a reflectance standard. PL spectra and the lifetime measurements were performed at room temperature by the Hitachi F-7000 fluorescence spectrophotometer.
Results and discussion
XRD
Figure 1 presents the XRD patterns of the Mg1.5Al2O4.5:x% Eu3+ (0 ≤ x ≤ 2) series. The XRD patterns show the broad diffraction peaks indicating the small crystalline sizes of the prepared samples. It can be seen that the prepared materials are fully crystalline and the diffraction peaks could be indexed to the standard patterns of the face-centred cubic single phases of MgAl2O4 (JCDPS 75-1797). No extra peaks related to the impurity phases were detected by XRD. These results are consistent with the results reported by Kolesnikov et al., 3 where the XRD patterns of MgAl2O4 were not altered by the different concentration of Eu3+.
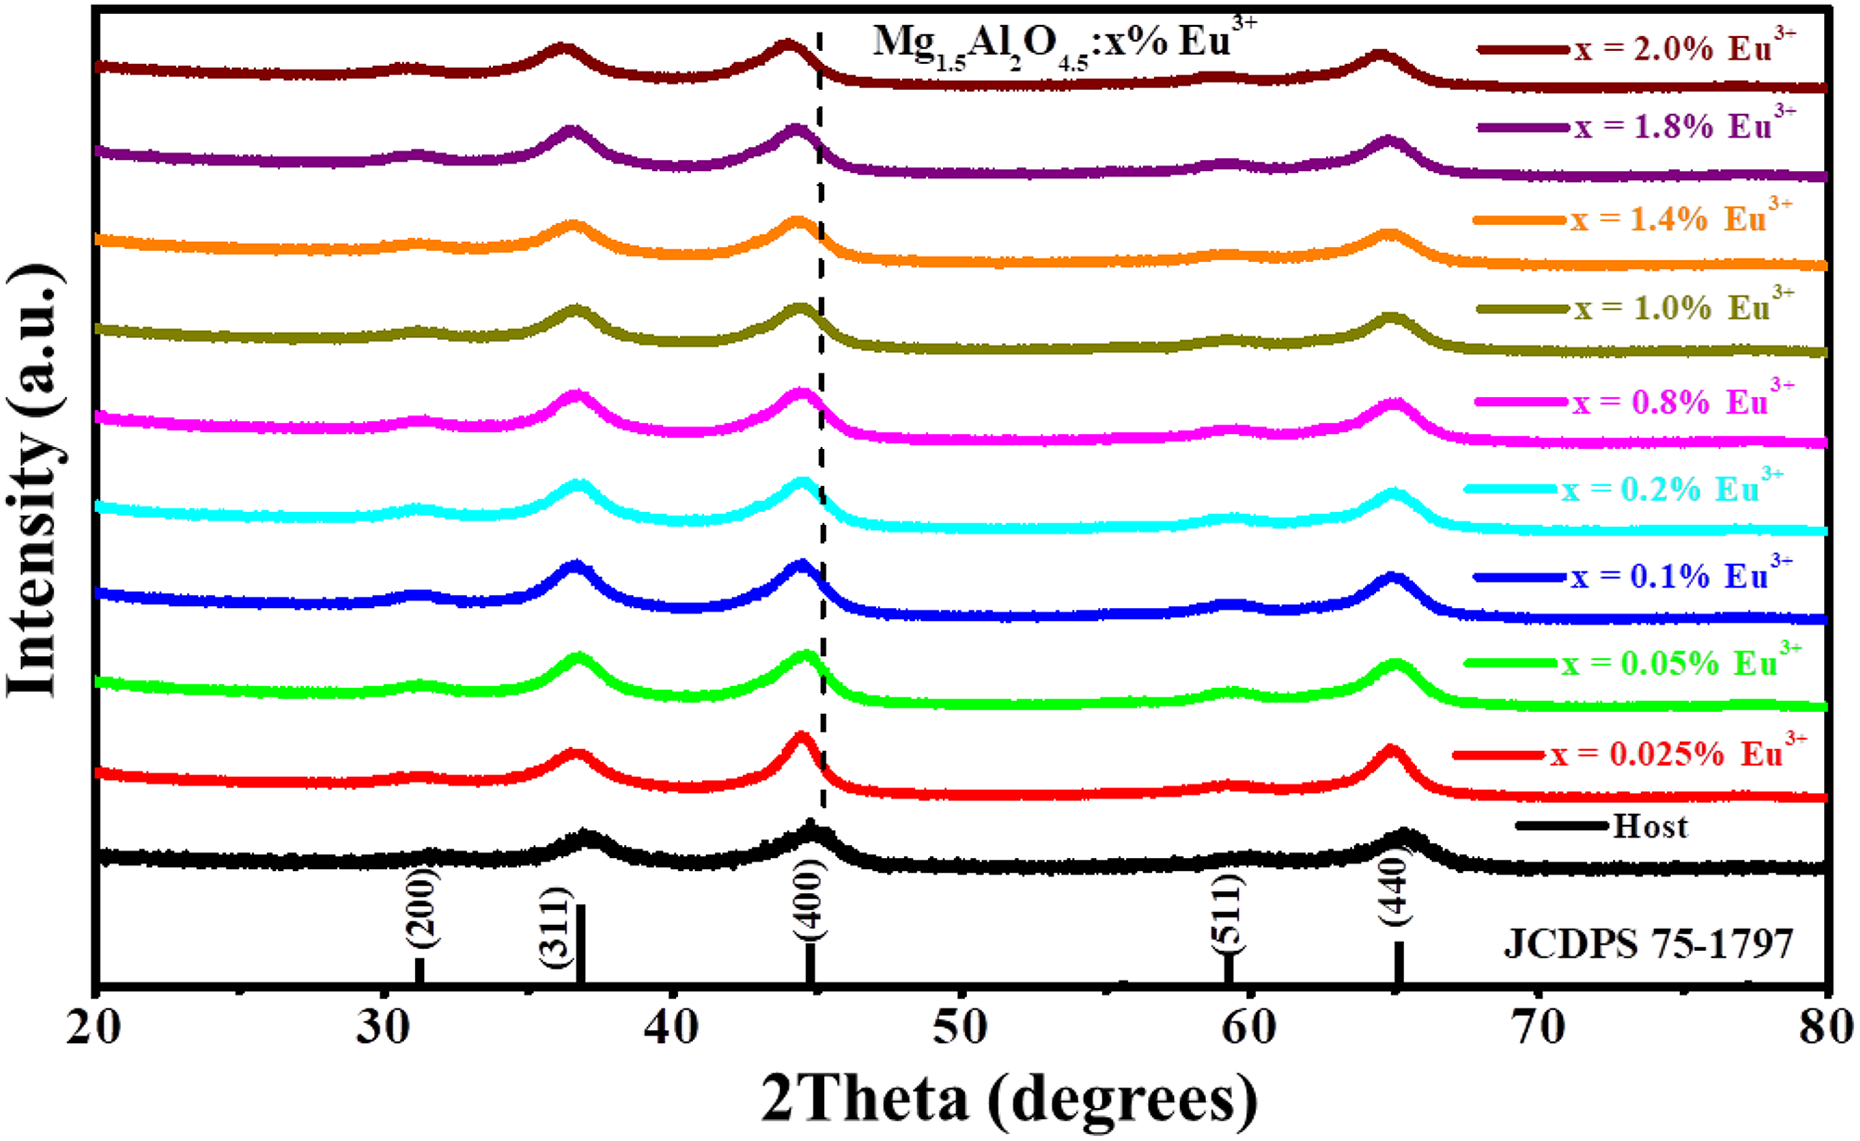
The XRD pattern for the Mg1.5Al2O4.5:x% Eu3+ (0 ≤ x ≤ 2) series. XRD: X-ray diffraction.
The analysis of the most intense diffraction (400) peak for the Mg1.5Al2O4.5:x% Eu3+ (0 ≤ x ≤ 2) series is illustrated in Figure 2(a). When comparing the host and Eu3+-doped samples, the diffraction peak slight shifts to the lower diffraction angle suggesting the expansion of the lattice parameter. 11 Similar results were seen in MgAl2O4, where the most intense peak shifted to lower diffraction when the concentration of Cd2+ was increased. The lattice parameter of the MgAl2O4:x% Cd2+ also increased with an increase of Cd2+ concentration. 4

(a) Analysis of diffraction peaks intensity of (400) for Mg1.5Al2O1.5:x% Eu3+ (0 ≤ x ≤ 2) and (b) lattice parameter (a) as a function of Eu3+ concentration.
Figure 2(b) shows the lattice parameters a as a function of Eu3+ concentration. The values of a were calculated using the following equation

where a is the lattice parameter, d is the interplanar distance and hkl are the miller indices. The values for each sample are presented in Table 1. It can be clearly seen that the lattice parameter increases sharply as the concentration of Eu3+ ion increases up to x = 0.1%. We propose that this behaviour might be due to the substitution of the smallest ion between Mg2+ (0.72 Å) 12 and Al3+ (0.53 Å) 4 by the bigger Eu3+ (0.95 Å) 13 and this means the observed behaviour is due to the occupation or replacement of Al3+ sites by the Eu3+. From x = 0.1% Eu3+, the lattice parameter is observed to slowly increase with an increase in Eu3+ concentration, which can be attributed to the substitution of Mg2+ by the Eu3+. The slow increase is basically attributed to the dissimilarities in their bigger ionic sizes compared to the smaller Al3+. Thus, we anticipate to also observe the unique absorption and PL emissions at below and above x = 0.1% Eu3+. The sudden increase in a at x = 2.0% Eu3+ might be due to the replacement of both Al3+ and Mg2+ sites by Eu3+simulteneously. It is well known that the incorporation of foreign atoms into the host matrix influences the diffraction intensity. It can be seen that doping the host with Eu3+ ions increases and also decreases the diffraction intensity, which suggests the loss and gain of crystalline quality during the growth of Mg1.5Al2O4.5 nanocrystals. 10 The crystallite sizes of the Mg1.5Al2O4.5:x% Eu3+ (0 ≤ x ≤ 2) series were calculated by using the Scherrer’s equation 14

where D is the crystallite size (nm), λ is the radiation wavelength (0.15406 nm), β is the full width at half maximum (FWHM) (radians) and θ is the angle of diffraction (degrees). The respective calculated values are presented in Table 1. It can clearly be seen and concluded that varying the Eu3+ concentration in Mg1.5Al2O4.5:x% Eu3+ system does not significantly influence the crystallites sizes.
Summary of the samples identification, decay times and CIE colour coordinates.

CIE: International Commission on Illumination.
EDS
The EDS technique was deployed to confirm the elementary composition on the prepared nanopowders. Figure 3 illustrates the spectrum of the host, x = 1.4 and 2.0% Eu3+ samples. For the host samples shown in Figure 3(a), the expected elements Mg, Al and O are observed in the spectrum. For the Eu3+-doped samples shown in Figure 3(b) and (c), the presence of Eu in addition to the host elementary composition is observed. The Eu3+ wt% in Figure 3(b) and (c) also confirmed that the Eu3+ concentration is not the same. In all EDS spectrum, the additional peak of carbon (C) is due to the sample coating during the measurement. No other peaks of impurities were detected suggesting that the prepared nanophosphor materials are impurity free, which agrees very well with the XRD results.
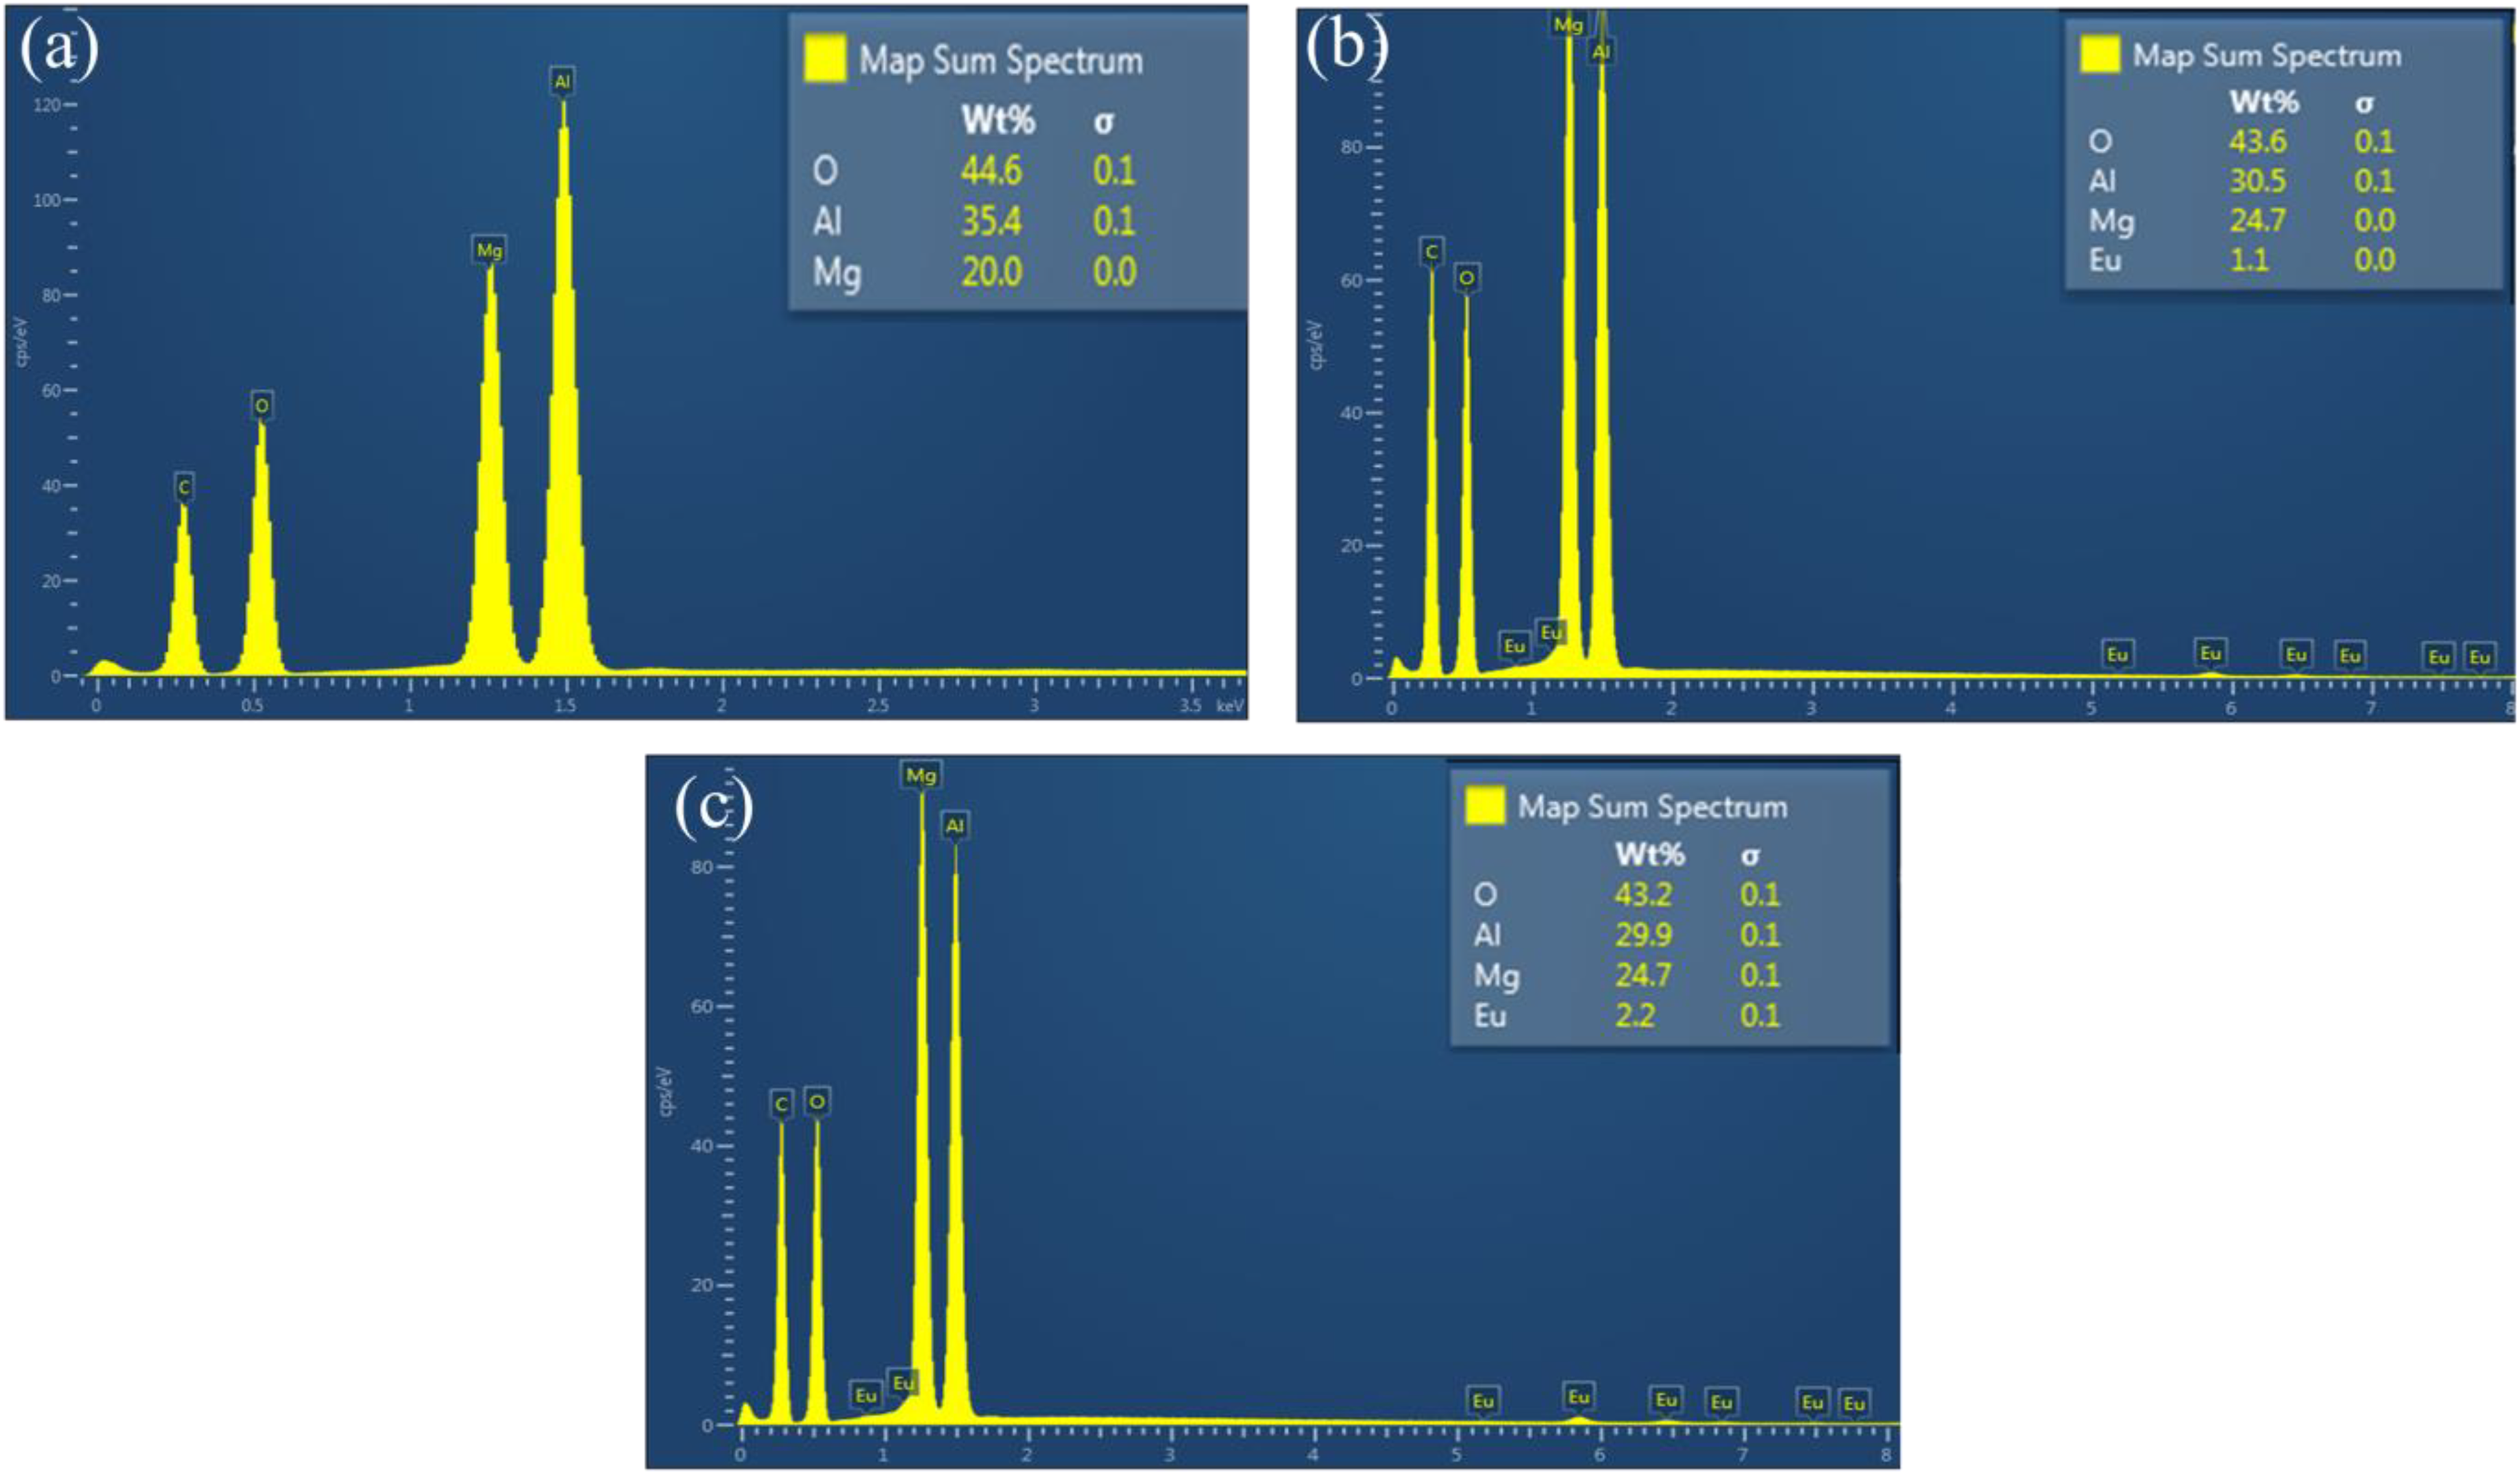
The raw EDS spectrum for Mg1.5Al2O4.5:x% Eu3+ when (a) host, (b) x = 1.4 and (c) 2.0% Eu3+. EDS: energy dispersive X-ray spectroscopy.
The x = 1.4% Eu3+ sample was further studied by measuring the EDS mapping and the images are illustrated in Figure 4. The EDS mapping was used to confirm the elemental distribution in the prepared x = 1.4% Eu3+ nanophosphor material. The images of individual elements are displayed around the layered image. The layered images suggest that the individual elements are homogeneously distributed on the surface of the prepared material.

EDS mapping images for x = 1.4% Eu3+. EDS: energy dispersive X-ray spectroscopy.
FEG-SEM
The morphological aspect of the host, x = 0.1, 1.4 and 2.0% nanophosphor was examined using the FEG-SEM as shown in Figure 5. The host micrograph depicted in Figure 5(a) shows a high degree of small particle agglomeration over the surface. The micrograph of the x = 0.1% Eu3+ samples displayed in Figure 5(b) shows similar morphology as shown in Figure 5(a) with minor evidence of elongated particle. A clear evidence of the elongated particles is clearly observed for the x = 1.4 and 2.0% Eu3+ samples as shown in Figure 5(c) and (d), respectively. The particles elongations shown in Figure 5(d) are large and highly disperse compared to those displayed in Figure 5(c). Thus, the results suggest that the increase in the concentration of Eu3+ influences the morphology of the prepared samples.

FEG-SEM photographs for the (a) host, (b) x = 0.1, (c) 1.4 and (d) 2.0% Eu3+-doped Mg1.5Al2O4.5 nanopowders. EDS: energy dispersive X-ray spectroscopy; FEG-SEM: field emission gun scanning electron microscope.
High-resolution transmission electron microscopy
The host and x = 1.8% Eu3+ samples were further examined by the HR-TEM to confirm the crystallites size and their respective images are presented in Figure 6(a) and (b). It can be seen that the crystallites are agglomerated to each other and the average crystallite size is around 5 nm, which agrees very well with the XRD values presented in Table 1. The lattice fringes can also be observed in both samples. Figure 6(b) also shows the elongated particles as can also be seen on the FEG-SEM images displayed in Figure 5(c) and (d). Thus, these results agree with the results from the XRD and FEG-SEM in terms of the crystallites size, agglomeration and particle elongation with an increase in Eu3+ concentration. It is therefore evident that the citrate sol–gel method produced the nanocrystals.
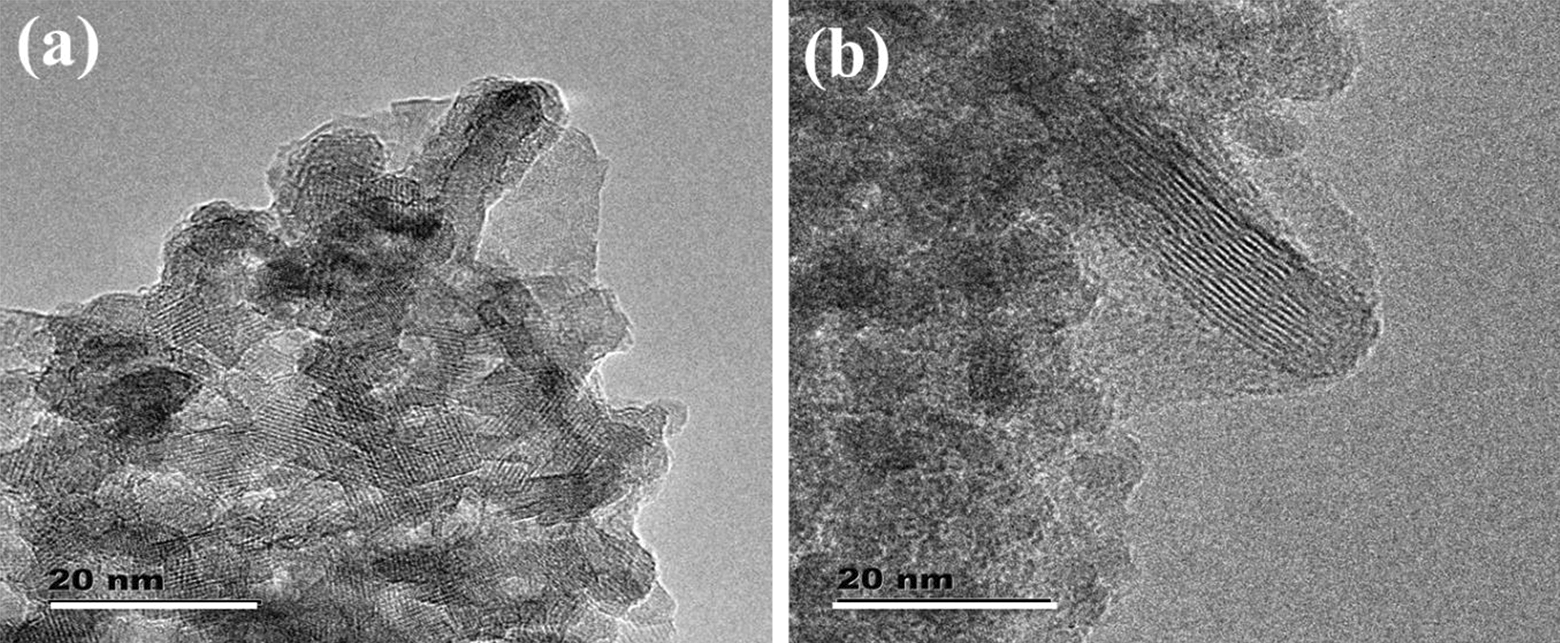
HR-TEM images for the (a) host and (b) x = 1.8% Eu3+ samples. HR-TEM: high-resolution transmission electron microscopy.
UV-Vis
The diffuse reflectance spectroscopy was used to study the absorption characteristics of the Mg1.5Al2O4.5:x% Eu3+ (0 ≤ x ≤ 2) series. Figure 7(a) shows the diffuse reflectance spectra of the Mg1.5Al2O4.5:x% Eu3+ (0 ≤ x ≤ 2) series, which shows three absorption bands located at around 275, 382 and 465 nm. The absorption band around 275 nm is attributed to the neutrally charged oxygen vacancy known as F centre in MgAl2O4. The absorption band located at around 382 nm is ascribed to the defects absorption within the host material. 7 For the doped samples, the small absorption band located at 465 nm is assigned to the electric dipole transition (7F0 → 5D2) within the Eu3+ ion. 5,15 When comparing the host and Mg1.5Al2O4.5:x% Eu3+ samples, it can be clearly seen that the F centre (275 nm) absorption peak is more pronounced when x > 0.1% Eu3+. This behaviour is probably due to the Eu3+ changing the occupational site (replacing the Mg2+ instead of Al3+) in the crystal lattice. At x < 0.1% Eu3+, the absorption at 275 nm seems to be disappearing due to the Eu3+ replacing the Al3+ as it was anticipated from the XRD results. Thus, the XRD and UV-Vis results suggest that varying the Eu3+ concentration regulates the Eu3+ occupational site on the crystal lattice and as a result, the absorption is also affected.

(a) Diffuse reflectance spectra of Mg1.5Al2O4.5:x% Eu3+ (0 ≤ x ≤ 2) series and (b) Tauc plot of (K × hν)2 versus photon energy (hν) to determine the E g of the prepared nanophosphor samples.
Figure 7(b) and the insert illustrate the Tauc plot for absorption measurement (K × hv) n against hv, where K is the Kubelka–Muck for the reflectance measurement (K = (1 − R)2/(2R)) (with n = 2, which is appropriate for a direct band gap material such as MgAl2O4). The optical energy gap (E g) of the Mg1.5Al2O4.5:x% Eu3+ (0 ≤ x ≤ 2) series was determined by extrapolating the graph to (K × hv)2 = 0. The results clearly indicate that the E g depends on the Eu3+ concentration. The E g for the prepared nanophosphor varied from 5.37 to 5.84 eV. Our current results are in consistent with our previous results. 4 The results suggest that the E g can be engineered by varying the Eu3+ concentration.
Photoluminescence
To determine the appropriate or optimum excitation wavelength, the host material was excited in a range of 240–320 nm when monitoring the violet emission and the emission spectra are illustrated in Figure 8(a). The emission spectra showed emission peaks at 382, 401, 550 and 690 nm. The peaks at around 480, 509, 525, 560, 605 and 640 nm are due to the second-order emissions corrosponding to 240, 253, 260, 280, 300 and 320, respectively. The filter was not used as it was suppressing emission at 550 nm. The 382, 401, 550 and 690 nm emission originates from the defect centres (DCs) within the host material. 4,7 The emission intensity as a function of excitation wavelength is shown in Figure 8(b), which reaveled the Gaussian behaviour. The optimum emission intensity that the host must be excited at is 275 nm. It is interesting to observe that the 275 nm observed on the UV-Vis results in Figure 7(a) correlates with the PL excitation. Thus, UV-Vis and PL results support each other.

(a) The emission spectra of the host excited at various excitation wavelength and (b) emission intensity as a function of excitation wavelength.
The room temperature PL excitation and emission spectra of the Mg1.5Al2O4.5:x% Eu3+ (0 ≤ x ≤ 2) series is shown in Figure 9(a). The excitation spectra were taken when monitoring the violet emission at 382 nm while the emission spectra were taken when monitoring the excitation at 275 nm (Figure 8(b)). The host excitation spectra in Figure 9(a) supported by the deconvolution of the excitation spectra shown in Figure 9(b) indicate that there are three absorption band located at 237, 275 and 341 nm. Note that the doped samples did not show any absorption bands when monitoring at 382 nm, which clearly indicates that all of the absorption bands are due to the host material. The absorption band at 237 nm (approximately 5.2 eV) is attributed to the host material band-to-band excitation. 4 The 275 nm absorption bands can be attributed to the presence of neutrally charged oxygen vacancy known as F centre while the 341 nm can be attributed to the positively charged oxygen vacancy known as F+ centre 7 as shown in Figure 10. The emission spectra for the Mg1.5Al2O4.5:x% Eu3+ (0 ≤ x ≤ 2) series showed several emission bands located at 382, 580, 593, 618, 655 and 704 nm. The emission at 382 nm is certainly due to the defects within the host material. It is also interesting to observe that the 382 nm is also correlating with the UV-Vis results. To clearly investigate all of the associated emissions from the prepared samples, the normalized emission spectra are shown in Figure 9(c). It can clearly be seen that there are another two emissions at 550 and 560 nm. The 550 nm emission is attributed to the defect within the host material. The emission around 690 nm is also attributed to be due to the defects level located at the lower energy (1.79 eV) within the host material. All other emissions in Figure 9(c) located at 560, 580, 593, 618, 655 and 704 nm must certainly be coming from the transition within Eu3+ ion. The peak located at 560 nm is attributed to the 5D1 → 7F3 transition within Eu3+. 16–18 This peak seems to be disappearing when x > 0.1% Eu3+, which is attributed to the Eu3+ replacing the Mg2+ ion. Note that the peak at 550 and 560 nm has some contribution from the second order due to the 275 nm excitation wavelength. The emission peak at 580 nm is attributed to the 5D0 → 7F0. 17,18 Another interesting aspect is the fact that this emission peak at 580 nm seems to be disappearing at x > 0.1% Eu3+ (Figure 9(a)) and this is related to the Eu3+ replacing the Mg2+ as it was suggested by the XRD and furthermore confirmed by the UV-Vis results. From the XRD and PL results, it is therefore very clear that this result confirms the fact that the dopant environment or site or location influences the observed emission colour. Similar kind of results have been previously reported by Motloung et al. 19 on the ZnAl2O4:x% Cr3+. The emission peaks at around 593 and 618 nm are, respectively, attributed to the 5D0 → 7F1 and 5D0 → 7F2 hypersensitive transitions in Eu3+. 20 These hypersensitive transitions are normally used to determine the site symmetry of Eu3+. 20,21 Sharma et al. 21 showed that Gd3Ga5O12:Eu3+ (gadolinium gallium garnet) has a symmetric environment of Eu3+ ion where 595 nm emission was higher than the emission at 618 nm, that is because the 595 nm emissions are stronger when Eu3+ is located at a high symmetry with an inversion centre. In this study, the emission at 618 nm is dominating indicating that Eu3+ is located at a low symmetry without an inversion centre. In addition, it is also clear that the host material influences the location symmetry of the Eu3+. The emission peak at 655 and 704 nm are due to the 5D0 → 7F3 and 5D0 → 7F4 transition within Eu3+, respectively. Figure 9(d) shows the Gaussian behaviour of the red (618 nm) emission intensity as a function of Eu3+ concentration. The results show that the x = 1.45% is an optimum Eu3+ concentration in Mg1.5Al2O4.5:x% Eu3+ (0 ≤ x ≤ 2) system. The increase and decrease in the PL emission intensity can be attributed to the luminescence enhancement and quenching, 4,7,15 which is a normal behaviour observed on this kind of investigations. The proposed excitation and emissions channel (for the 275 nm excitation) either from the host or Eu3+ discussed in this article are shown in Figure 10. Note that the energy level location of Eu3+ on Mg1.5Al2O4.5 was predicted by the Dorenbo’s diagram reported by Wen et al. 22 and Shimizu et al. 23

The excitation and emission spectra of (a) Mg1.5Al2O4.5:x% Eu3+ (0 ≤ x ≤ 2) series, (b) deconvolution of the host excitation spectra when monitoring emission at 382 nm, (c) normalized emission of the Mg1.5Al2O4.5:x% Eu3+ (0 ≤ x ≤ 2) series and (d) emission intensity as a function of Eu3+ concentration for an emission at 618 nm.
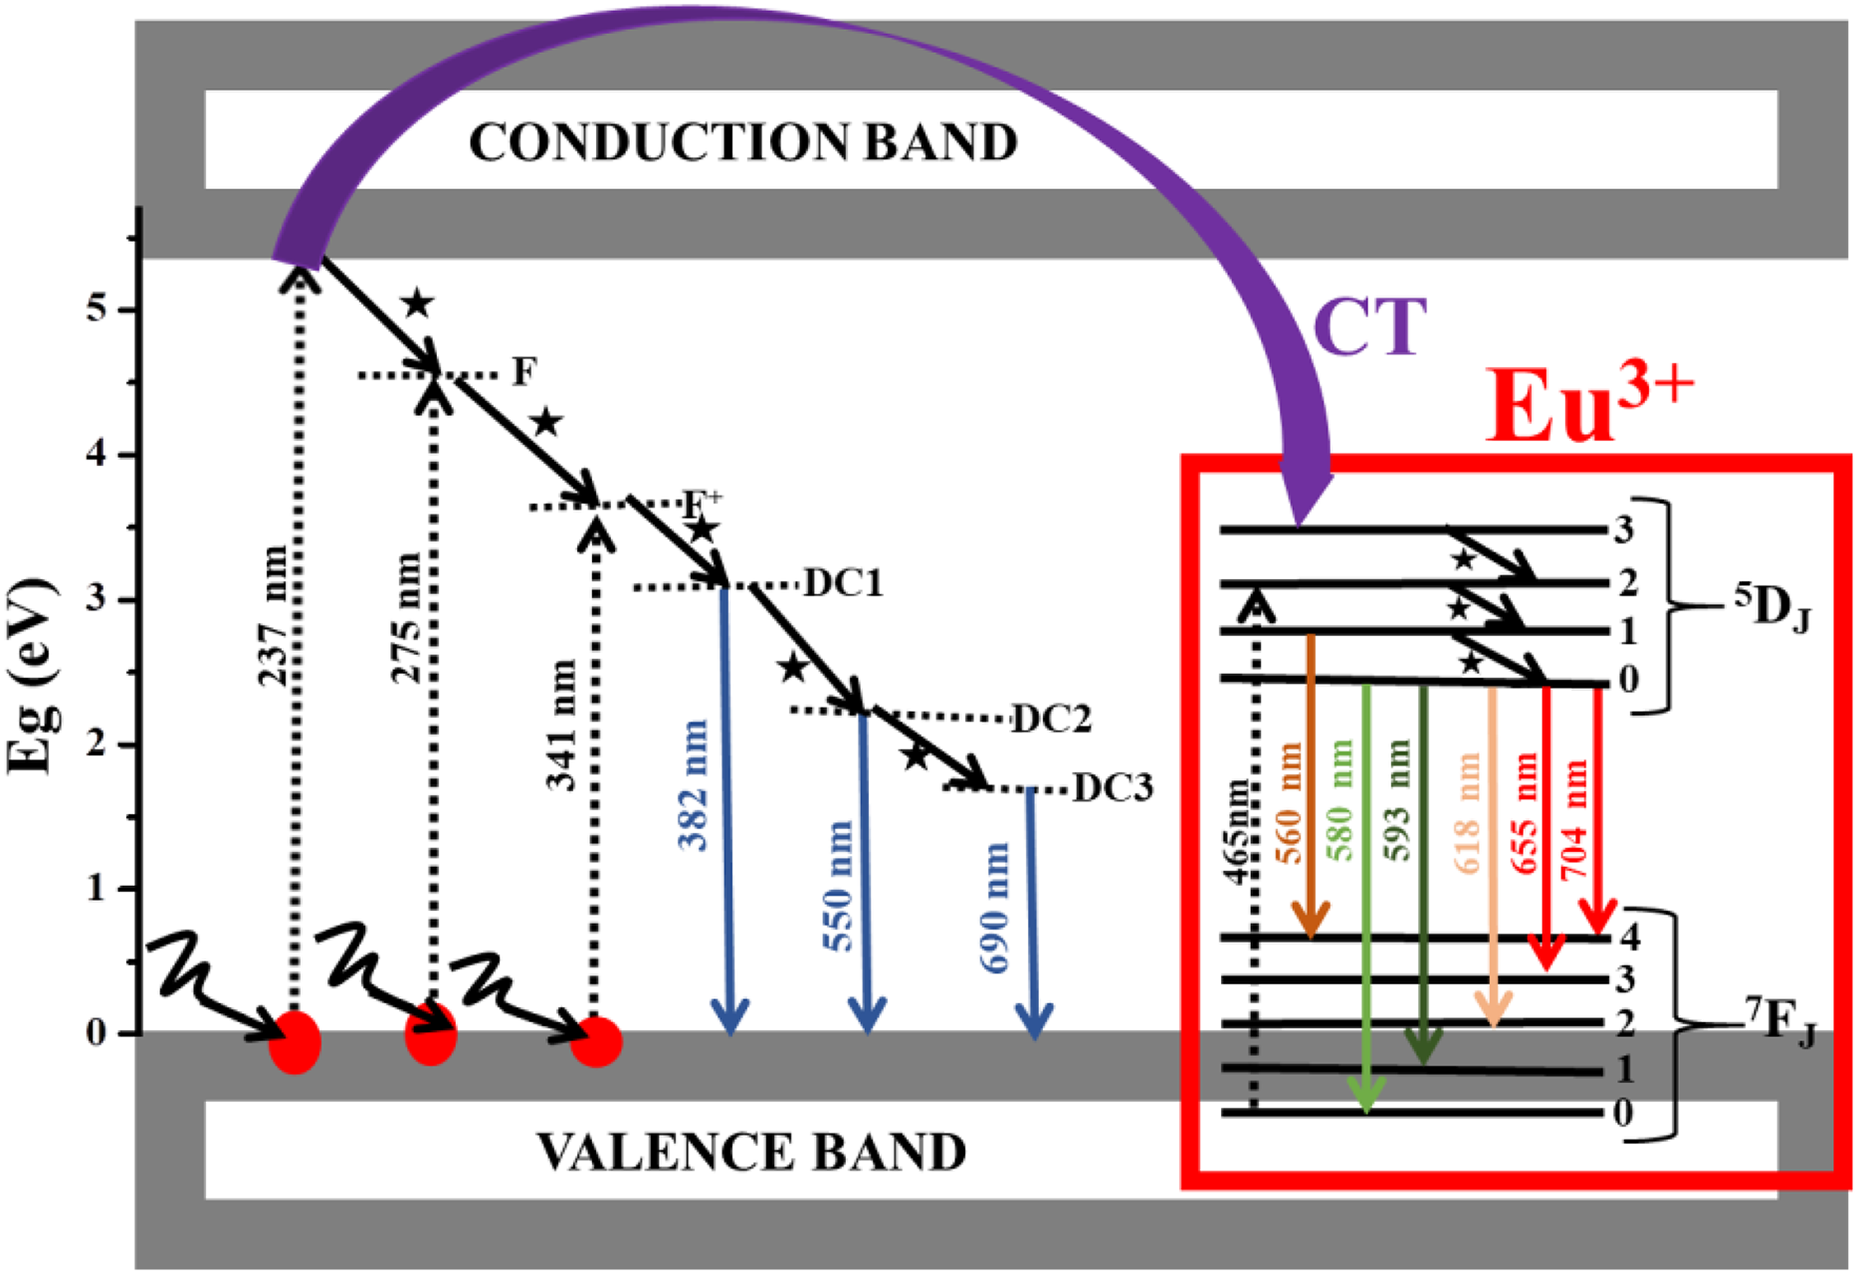
The proposed excitation and emission pathways mechanism for Mg1.5Al2O4.5:x% Eu3+ (0 ≤ x ≤ 2) nanopowder.
Due to the fact that the 275 nm excitation was only valid for the host excitation, we also wanted to trace the valid excitation wavelength for the x = 1.4% Eu3+ and the emission intensity as a function of the excitation wavelength is shown in Figure 11(a). The emission intensity was measured at different excitation wavelengths ranging from 240 to 320 nm. The emission spectrums in this case shows the peaks which are only attributed to the transitions of the Eu3+ ion, 20,21 which suggest that there are no emissions associated to the host material. Figure 11(b) presents the emission intensity versus the excitation wavelength (for the 618 nm emission), which shows the Gaussian fit behaviour. The fit revealed that the optimum excitation is 253 nm wavelength. The 253 nm excitation wavelength was used to excite all prepared samples when monitoring the red emission at 618 nm and their spectrums are illustrated in Figure 12(a). The excitation spectra show an absorption band located at around 253 nm which can be ascribed to the charge transfer transition (CT) which is an electron transfer from O2− (2p6) orbital from the host to the Eu3+ empty 4f6 orbital. 3 Once again, it is quite interesting to see that the 580 nm emission peak still behaves as discussed earlier, which is attributed to the Eu3+ occupying different location in host crystal structure as Eu3+ is varied. The emission intensity as function of the excitation wavelength is shown in Figure 12(b), which shows Gaussian behaviour trend. The bar graph in Figure 12(c) compares the emission intensity of the host and x = 1.4% Eu3+when excited at 253 and 275 nm for the red emission at 618 nm. To obtain the optimum emission intensity from the host and x = 1.4% Eu3+, the graph suggests that they must be, respectively, excited at 275 and 253 nm.
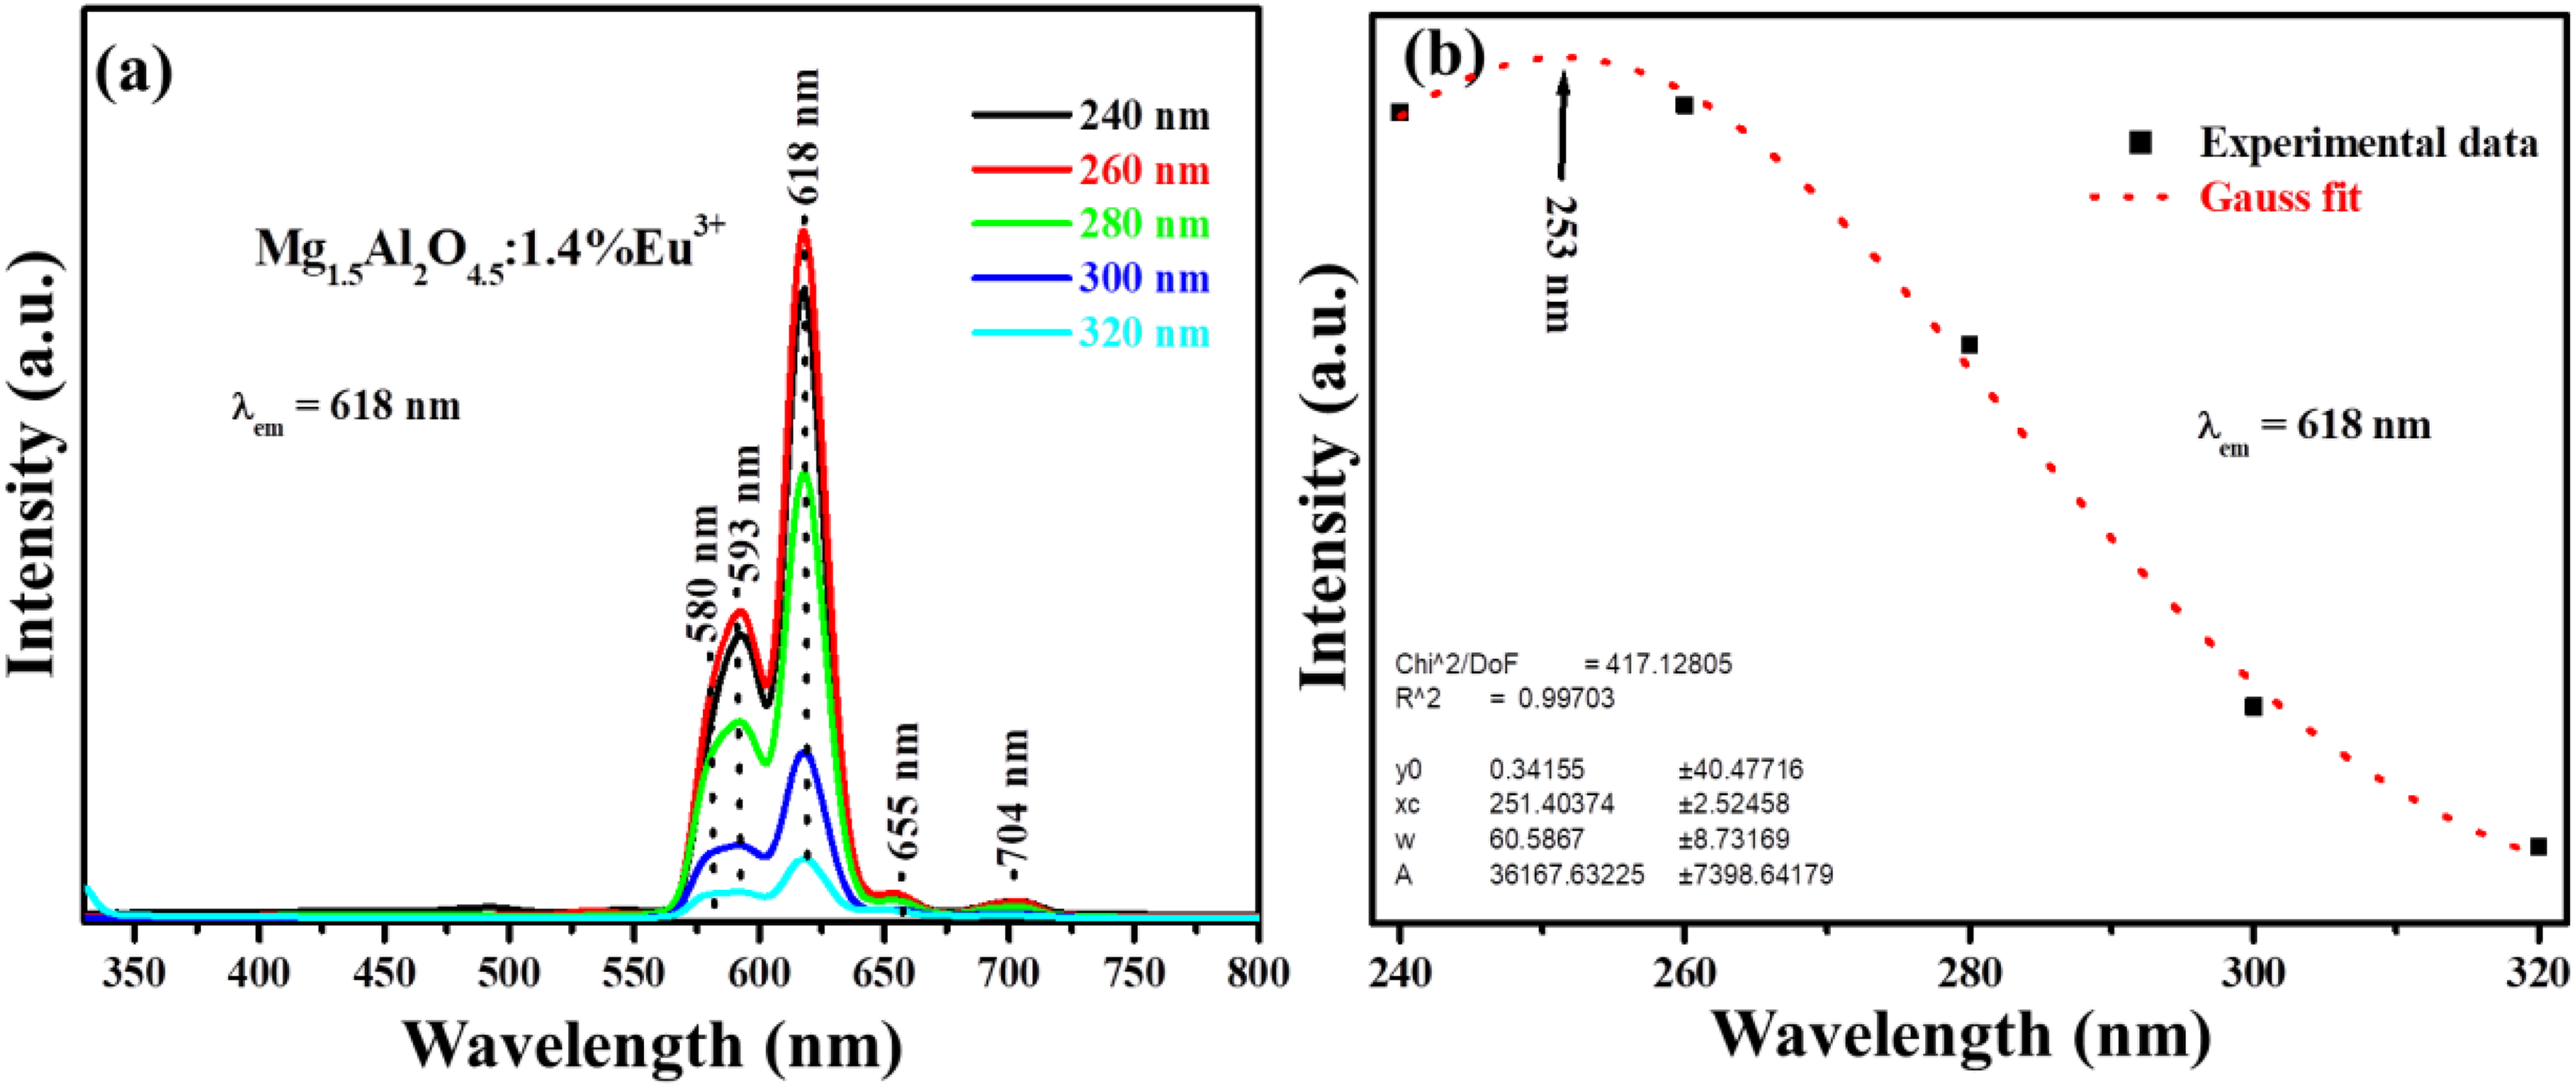
(a) The emission spectra of the x = 1.4% Eu3+ excited at various excitation wavelength and (b) emission intensity as a function of excitation wavelength.

The excitation and emission spectra of the (a) Mg1.5Al2O4.5:x% Eu3+ (0 ≤ x ≤ 2) series excited at 253 nm, (b) emission intensity as a function of Eu3+ concentration and (c) bar graph of the host and x = 1.4% excited at the 253 and 275 nm.
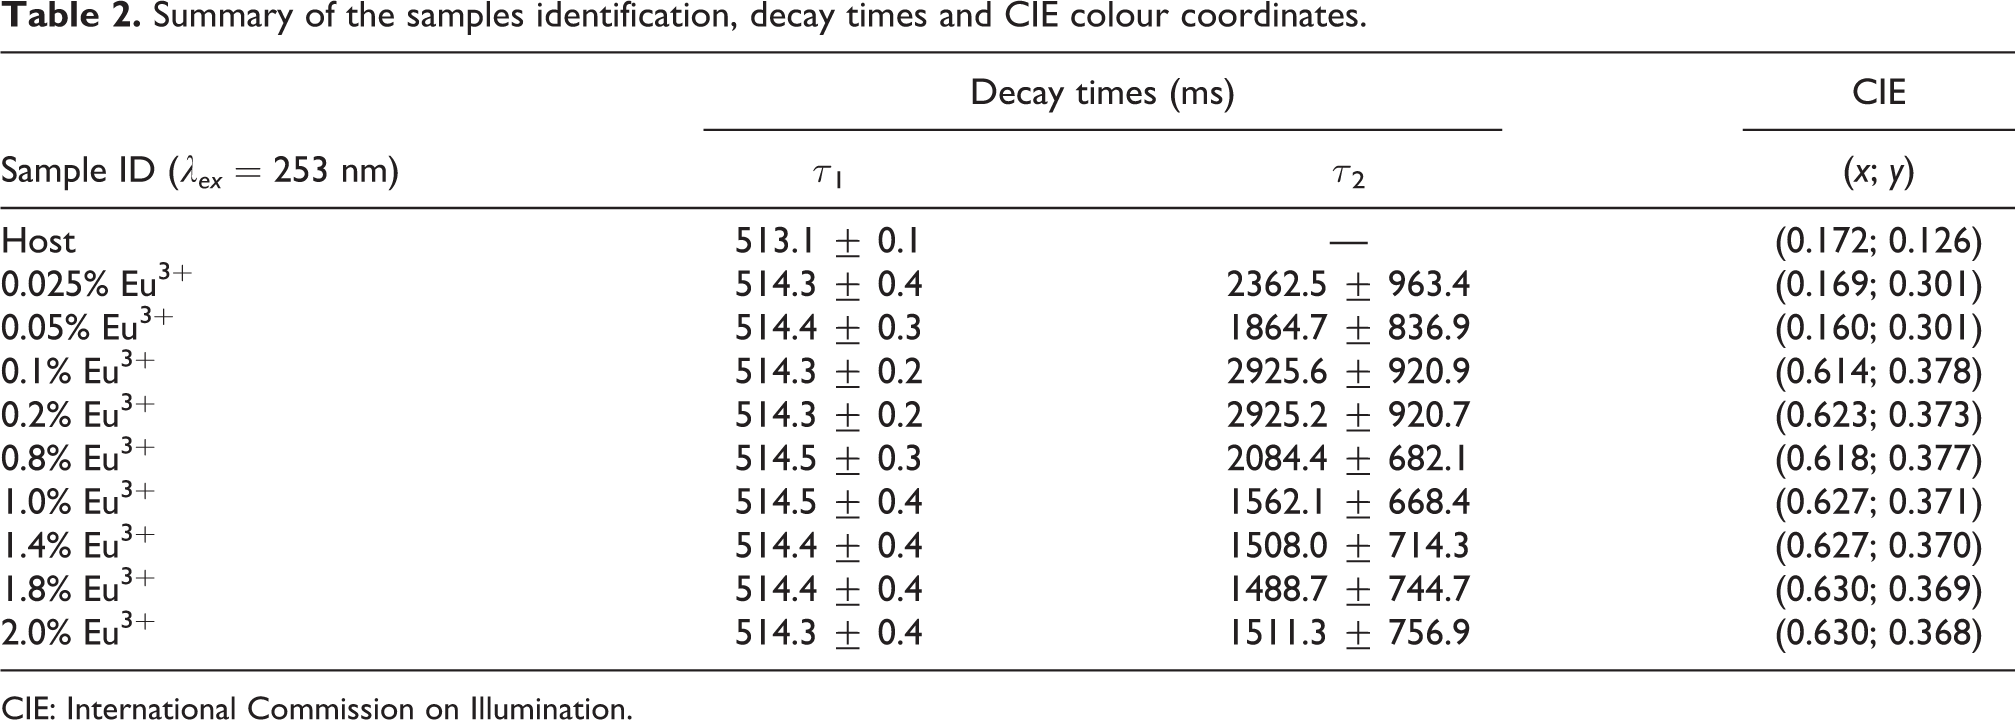
Figure 13 shows the phosphorescence life time for the Mg1.5Al2O4.5:x% Eu3+ series. Figure 13(a) shows the room temperature phosphorescence life time which was taken at 382 nm emission and 275 nm excitation wavelengths. Figure 13(b) shows the room temperature phosphorescence life time which was taken at 618 nm emission and 253 nm excitation wavelengths. The results show that all the prepared nanophosphor samples have the same afterglow mechanism irrespective of the excitation and emission wavelength. All doped samples were fitted using the second-order exponential decay, as shown in equation (3). However, it is very important to mention that the host was fitted using the first-order exponential decay since the emission is coming only from the host or one channel

where I represents the phosphorescent intensity, I 0 is the initial luminescence intensity, A 1 and A 2 are the fitting parameters which contributions to the fast and slow decay component, t is the time of measurement and τ 1 and τ 2 are the fast and slow decay time values, which are presented in Tables 1 and 2.

The decay curve of the Mg1.5Al2O4.5:x% Eu3+ (0 ≤ x ≤ 2) series (a) monitored at 275 nm excitation and 382 nm emission wavelength and (b) monitored at 253 nm excitation and 618 nm emission wavelength.
Summary of the samples identification, decay times and CIE colour coordinates.
CIE: International Commission on Illumination.
The CIE chromaticity diagram with red, green, blue vertex region and the emission colour coordinates of the luminescent material are displayed in Figure 14. The emission colour coordinates of the prepared nanophosphor were calculated using the CIE coordinate calculator software. 24 The colour coordinates for the CIE on Figure 14(a) was calculated from the emission spectra excited at 275 nm and the (x; y) values are presented in Table 1. The colour coordinates for the CIE on Figure 14(b) was calculated from the emission spectra excited at 253 nm and the (x; y) values were presented in Table 2. The CIE colour chromaticity in Figure 14(a) and (b) shows that the colour moved from blue (host) to red (Eu3+-doped samples). The emission colour for the doped nanophosphors shifted from light red to dark red with an increase of Eu3+ concentration. Koao et al. 15 observed similar CIE results for ZnO:x% Eu3+. Figure 14(c) shows the CIE colour chromaticity shows the colour coordinates of x = 1.4% Eu3+ when varying excitation wavelength ranging from 240 to 320 nm. The CIE shows that for all different excitation wavelengths, the emission colour is always red. Thus, the emission colour cannot be tuned by varying the excitation wavelength for the x = 1.4% Eu3+.

CIE colour for Mg1.5Al2O4.5:x% Eu3+ (0 ≤ x ≤ 2) series (a) at 275 nm excitation and 382 nm emission wavelength, (b) at 253 nm excitation and 618 nm emission wavelength and x = 1.4% Eu3+ nanopowders at varying excitation wavelength. CIE: International Commission on Illumination.
Conclusion
Mg1.5Al2O4.5:x% Eu3+ (0 ≤ x ≤ 2) was successfully prepared via sol–gel technique. The XRD patterns showed the possibility of Eu3+ occupying different sites. The XRD and HR-TEM results showed that the prepared powder samples are on the nanoscale. The EDS confirmed the presence of all expected elementary composition (Mg, Al, O and Eu). The FEG-SEM showed that varying the Eu3+ concentration influences the morphology of the prepared samples. The UV-Vis showed that the optical band gap of Mg1.5Al2O4.5:x% Eu3+ highly depends on the concentration of Eu3+ ions. The PL results showed that the emission can either be due to the host or due to Eu3+ and this depends on the excitation wavelength. The PL results also confirmed that the emission from the Eu3+ ion depends on the site substitution. The CIE shows that the Eu3+ doping influences the emission colour.
Footnotes
Acknowledgements
The authors would like to thank Dr James Wesley-Smith (from SMU electron microscopy) for assisting with the FEG-SEM and HR-TEM images.
Declaration of conflicting interests
The author(s) declared no potential conflicts of interest with respect to the research, authorship, and/or publication of this article.
Funding
The author(s) disclosed receipt of the following financial support for the research, authorship, and/or publication of this article: This work was supported by the South African National Research Foundation (NRF) Thuthuka programme (fund number: UID99266) and NRF incentive funding for rated researchers (IPRR) (grant no: 114924).