
Abstract
The development of two novel elastomeric erosion resistant coatings for the protection of wind turbine blades is presented. The coatings are prepared by modifying polyurethane (PU) with (i) hydroxyl functionalised graphene nanoparticles (f-GNP) and (ii) f-GNP and a hydrophobic silica-based sol–gel (SG). Tensile, monotonic and cyclic compression and tearing tests have been conducted on the neat PU and the two newly developed elastomeric PU nanocomposites (PU + GNP and PU + GNP + SG) to allow their properties to be compared. The test results showed that the mechanical properties of PU and the modified PUs have strong dependency on temperature, strain rate and nanoparticles loading and addition of GNP and SG to PU improved the mechanical properties. Compared to PU, Young’s modulus and modulus of toughness of PU + GNP + SG increased 95% and 124%, respectively. The PU + GNP nanocomposite displayed the highest tearing strength and the PU + GNP + SG nanocomposite showed the highest elongation at break. An investigation of the microstructures of the modified PUs by FTIR, field emission scanning electron microscope (FESEM) and energy-dispersive X-ray spectroscopy (EDX) are discussed. Hydrophobicity of the PU and developed PU nanocomposites are reported by measuring their water droplet contact angles and their free surface energies.
Introduction
Leading edge erosion (LEE) of wind turbine blades caused by the impact of rain, dust, salty vapour, hailstones, and insects, reduces the lifetime of the blades. This in turn results in a loss in annual energy production (AEP) by the turbines. Potential AEP losses of between 4.5 and 25% have been reported by Sareen, 1 and losses from 2% to 3.7%, depending on the extent of damage at the leading edge, have been reported by Han et al. 2 Sandia National Laboratories 3 estimated the AEP losses as 5–8%. Kruse et al. 4 simulated the aerodynamic performance of a NACA 633-418 and reported up to 35% reduction in lift and 90% reduction in glide ratio for the specified angle of attacks ranges. Hence, there are major incentives for protecting the leading edge of wind turbine blades.
Elastomeric materials are currently considered to be amongst the best candidates for LEE protection5,6,7,8 and polyurethanes are one of the best choices. Polyurethane (PU) elastomers have a urethane group -NH-CO-O in their structure. PUs are formed by the reaction of isocyanates (R − (N = C = O)n] with polyols. Control of segmentation through stoichiometry and reaction conditions allows the creation of PU elastomers with superior qualities.9,10 In addition, PUs have a high capacity for energy absorption, making them particularly suitable for shock and impact protection. Thus, PUs are good candidates for leading edge protection. In PU, the hard domains are embedded in a rubbery soft segmented matrix. Depending on the hard segment content, the morphology of the hard domains changes from one of isolated domains to one of interconnected domains. At room temperature, soft domains are above their glass transition temperature and responsible for rubber-like behaviour while hard domains are below their glassy or melting transition temperature. The latter are the primary contributors to the hysteresis, permanent deformation, high modulus and tensile strength of the materials. 11 A wide range of mechanical properties can be obtained in PUs by varying the molecular weight and the ratio and chemical composition of the hard and soft segments.
When a rain drop hits the surface coating, it generates three different types of waves: shear, compression and Rayleigh. 12 The shear wave is the cause of surface coating tearing; this failure has two phases, first is a period in which cracks nucleate in the regions that were initially free from observable cracks, followed by a second phase in which cracks grow to the point of failure. For this reason, developing a coating material with high tear resistance is desirable for highly durable rain erosion coatings.
It is evident that the mechanical, thermal and impact properties of polymers can be significantly improved by the addition of nanoparticles. 13 Nanoparticles tend to intercalate and exfoliate in a polymer under appropriate conditions, increasing substantially the area of interface with the polymer. 13 The strength of the interface and the dispersion of nanoparticles are central to the mechanical enhancement of nanoparticle modified polymers.14,15 The strength of interface can be improved by functionalisation of nanoparticles to facilitate chemical bonding with the matrix. Surface functional groups such as hydroxyl, carboxyl, or amine groups on the nanofillers can potentially form chemical bonds with the polymer matrices, resulting in stronger interfaces between the fillers and the matrix. In addition, the nanoparticles (in this case graphene) and polymeric matrices interact by mechanical interlocking through the wrinkled surface of thin graphene sheets. As an example, Chung et al. 16 modified graphite (MG) powder with particle size < 20 μm and covalently linked them to a PU backbone. The hydroxyl content (−OH) of the MG is an important factor for linking graphite to the PU. The ultimate tensile stress increased 436%, and the maximum strain increased by 1744% compared to unmodified PU.
In the past, several researchers have reported how the mechanical properties and erosion resistance of PU elastomers can be improved by addition of various nanoparticles. Malaki et al. 17 reported a 29% improvement in the erosion resistance of PU coatings with the addition of 6 wt% of fumed nanosilica. Petrović et al. 18 made PU nanocomposite with nanosilica filler concentration ranging from 0 to 50 wt%. They showed the coefficient of thermal expansion decreased with increasing nanosilica content. At 40 wt% nanosilica concentration, the tensile strength was increased 300%. Elongation at break continuously increased with increasing nanosilica content, reaching an increase of 600% at 50 wt%. Chung et al. 19 prepared hybrid PU/silica composites using a sol–gel reaction between tetraethyl orthosilicate (TEOS) and triethoxysilyl groups (TESPI) grafted onto PU. The ultimate tensile strength (UTS) sharply increased from the cross-linking of the grafted silica at low TEOS concentrations but decreased with the increase in TEOS content as the excess silica inhibited cross-linking: The UTS of PU without TEOS and TESPI (15.2 MPa) increased to 59.6 MPa at 12.5 mmol of TEOS and 2.5 mmol of TESPI (290% increase). Syamsundar et al. 20 studied erosion wear resistance of PU coatings modified with boron carbide (B4C) or silicon carbide (SiC) nanoparticles. They found the optimum nanoparticle loading with B4C was 20 wt% and 10 wt% for SiC, beyond these loadings the performance deteriorated. Mills et al. 21 modified PU coatings with 5 and 10 wt% of nanosilica and found that with a 5 wt% loading, ionic resistance was significantly increased due to the polymer network reinforcement and water absorption was reduced. Kotnarowska et al. 22 reported that the type of nanofiller and its size significantly affected the erosion resistance of PU coatings. The greatest erosion resistance was obtained for PU modified with silica having the smallest filler grain. Pokharel et al. 23 manufactured PU nanocomposites by in-situ polymerisation using pristine graphene nanoplatelets (GNPs), graphene oxide (GO) and functionalized graphene sheets (FGSs). The PU nanocomposites with a 2 wt% loading of GO or FGS showed significantly higher Young’s modulus than the one modified with GNPs. Tarasov et al. 24 analysed the effect of fullerene, GO and their mixture (15/85 ratio) on cross-linked PU urea elastomer for filler loading of 0.01 wt% to 0.1 wt%. Addition of fullerene resulted in a 10% decrease in Young’s modulus at 0.1 wt% filler loading, while GO increased Young’s modulus by 10% relative to the neat PU. The use of fullerene/GO additive demonstrated a pronounced positive synergetic effect and resulted in a 20% increase in Young’s modulus for 0.01 wt% loading and a 30% increase at 0.1 wt% loading; however, a weak negative synergetic effect on tensile strength was observed. Xia and Song 25 studied PU–carbon nanotubes (single- and multi-walled) composites prepared by in-situ polymerisation with 0.5, 1 and 2 wt% CNT. The highest tensile strength of 9.11 MPa was achieved at 2 wt% loading of single-walled CNT. Tayfun et al. 26 prepared 0.5, 1, 1.5 and 2 wt% CNT reinforced thermoplastic polyurethane (TPU) composites by melt-mixing. The highest improvement of 41% in UTS was obtained for 0.5 wt% nitric acid-treated CNT and the highest increase of 150% in Young’s modulus was achieved at 1 wt% of CNT loading. Guo et al. 27 used multi-walled CNTs (MWCNTs) for reinforcement of PU by the combination of in-situ polymerisation and solution-casting approach. Incorporation of 1.0 wt% loading of MWCNTs into a PU matrix significantly improved Young’s modulus, stress-at-break and the elongation at break by 90%, 500%, and 75%, respectively. Kumar et al. 28 synthesised PU with 1–10 wt% MWCNTs in a two-step solution mixing and compression moulding process for producing PU thin films. The results of quasi-static nanoindentation tests showed elastic modulus and hardness were continuously improved by increasing the MWCNT loading; they increased 124% and 53%, respectively, for 10 wt% MWCNT loading and the fracture resistance improved by 52% for 7 wt% MWCNTs loading. Li et al. 29 used various loadings of acid-treated MWCNTs for reinforcement of polyisobutylene (PIB)/polyethylene glycol (PEG)-based polyurethane nanocomposites (PIGNTs). A 126% improvement of UTS was achieved at low loading of 0.3 wt% MWCNT. Additionally, the PIB/PEG-based PU and PIGNTs exhibit excellent damping properties (tan δ > 0.3) in a wide range of temperature from −60°C to 35°C. Eivazi Zadeh et al. 30 prepared PPU/CNT composites containing 0.05%, 0.1%, 0.5%, and 1% wt% CNTs by electrospinning. The highest increase in toughness (4.5 times) and stiffness (3.5 times) was achieved with 0.5 wt% CNT. In addition, although the existence of CNTs did not affect the contact angle significantly, it increased the hydrophilicity of PU to a maximum at 0.1 wt% CNTs loading. Moghim et al. 31 studied TPU reinforced with 0.05–5 wt% loading of MWCNT, prepared using a solution-casting method. Tensile strength of PU was enhanced about 122% with 1 wt% CNTs loading. Alberto et al. 32 tested PU resin films reinforced with few-layered graphene (FLG) nanoparticles and observed an improvement of over 100% in the abrasion resistance, a 25% increase in the coefficient of static friction and a 200% increase in the coefficient of dynamic friction. Qiao et al. 33 developed hydrophobic polydimethylsiloxane-based PUs (Si-PUx) with hydroxypropyl polydimethylsiloxane (H-PDMS). They showed that the cavitation erosion resistance of Si-PUx coatings improved with an increase in the H-PDMS content. The cumulative mass loss of Si-PUx with 12.5 wt% H-PDMS was 2.96 mg without any visible holes and cracks on the surface after 80 h testing. Rihayat et al. 34 used a polyether polyol in the production of a PU by reaction with an isocyanate. The clay was treated with cetyltrimethyl ammonium bromide (CTAB) and octadodecylamine (ODA) and the resulting organoclay was intercalated in the PU. The largest increase of 166% in tensile strength and 600% in elongation at break achieved with 5 wt% loading of ODA modified clay.
In our previous work, 35 erosion tests with rubber ball impact have been conducted on specimens made from glass fibre reinforced polymer (GFRP) composite substrates coated with neat PU, PU + GNP and PU + GNP + SG materials. The results showed PU coatings modified with 0.5 wt% GNP and 1 wt% SG had up to 13 times longer life than unmodified PU 35 In the work reported here, the optimised processing stages of making these PU nanocomposites are discussed. The enhancement in the mechanical properties and energy absorption capacity of the PU nanocomposite coatings are explored by tensile, monotonic and cyclic compression, and tearing tests. The characterisation of modified PUs by FTIR, field emission scanning electron microscope (FESEM), and energy-dispersive X-ray spectroscopy (EDX) together with the results of water droplet contact angle and the free surface energy of the developed PU nanocomposites are presented.
Materials and methods
Materials
The two components PU system BAYTEC® 9005 60A MF polyol with viscosity of 800–1600 mPa.s and specific gravity of 1.01–1.04 and the DESMODUR® B9 M10 polyisocyanates crosslinkers with viscosity of 120–200 mPa.s and specific gravity of 1.21–1.23 were supplied by Covestro. PUs were produced by reacting polyisocyanates with polyols at room temperature with the mixing ratio by weight of polyol to polyisocyanates of 100:37.
The as-received functionalised graphene nanoplatelets HDPlas™ f-GNP, containing surface carboxyl groups created by a ‘split plasma’ treatment in oxygen were supplied by Haydale Ltd, UK. The plasma functionalisation is a low temperature, low energy, dry process, with no effluent disposal, and is benign to the structure of the raw material. The functional groups are only attached to the edges, dislocation sites and defects. The lateral dimension of the f-GNP (hereafter, it is called GNP for brevity) is between 0.3 and 5 μm with typical individual GNP thickness of about 0.34–0.5 nm, bulk density of 215 kg/m3 and specific surface area of ∼25 m2/g. The graphene sheets have an aspect ratio of ∼85.
Hydrophobic silica-based sol–gel P029™ was supplied by Sol-Gel Materials & Applications (SGAM), Gillingham, UK, and it contains 15 wt% Si.
PU and its nanomodified nanocomposites are used in this work to make the LE protection coating. The three coating materials are neat PU, graphene modified PU (PU + GNP) and graphene + sol–gel modified PU (PU + GNP + SG).
Preparation of polyurethane material
BAYTEC® 9005 60A MF polyol was mixed with DESMODUR® B9 M10 polyisocyanates with mass ratio of 100:37 at room temperature (25°C) for 3 min using a homogeniser at 8000 rpm. The mixture was then placed into a degassing chamber for 5 min, and after that, it was used for moulding various test coupons.
Preparation of PU + GNP material
PU + GNP composites were prepared by in-situ polymerisation approaches. The in-situ polymerisation of PU + GNPs was carried out by directly mixing GNP (0.5 wt%) with polyol at room temperature (25°C) using a homogeniser. The GNP and PU mixing procedure was optimised at three different speeds and duration time. It was found that mixing at 8000 rpm for 18 min gave the most homogenous mixture with little damage to the structure of graphene nanoparticles. Subsequently DESMODUR® B9 M10 polyisocyanates was added to the mixture and stirred for 1 min. The functionalised graphenes act as chemical crosslinkers in PUs. The mixture was ready for moulding various test coupons.
Preparation of PU + GNP + SG material
The in-situ polymerisation of PU + GNP + SG was carried out by directly mixing hydrophobic silica-based solution SG (1 wt%) with the DESMODUR® B9 M10 polyisocyanates and then the mixture was added to a mixture of polyol + GNP (same preparation method as above), stirred for 1 min using a homogeniser at 8000 rpm before being used for moulding various test coupons.
Testing methods
Tensile tests
Tensile tests were carried out at room and elevated temperatures with different strain rates. A mould for casting uniaxial tensile test coupons was manufactured from aluminium. The dogbone specimen dimensions accord to BS EN ISO 527-2:2012 (Type 1BA geometry) for elastomers, Figure 1(a). After the degassing process, the PU mixtures were gently poured into the mould and left until polymerisation was completed at room temperature. The tests were carried out 24 h after casting the specimens. (a) Dimensions of dogbone specimen based on BS EN ISO 527-2:2012 (Type 1BA geometry) and (b) casting of neat PU specimens for tensile testing.
The tensile tests were carried out using a Zwick/Roell universal testing machine fitted with a 50 kN load cell. The crosshead speed was set at 21, 105 and 210 mm/min (equivalent to strain rate of 0.01, 0.05 and 0.1 s−1) and at each strain rate, tensile tests were performed at three different temperatures 25 (RT), 50 and 70°C using an in-situ heating chamber. For each case, six specimens were tested. Young’s modulus (E), ultimate tensile strength (UTS), elongation at break EL (%) and modulus of toughness (T) were evaluated at each temperature and strain rate.
Compression tests
For these tests, cylindrical samples with a diameter of 12 mm and thickness of 3 mm were manufactured. First, a sheet of material, 3 mm in thickness, was manufactured by casting the PU or modified PU into a machined aluminium mould. The PU sheet was removed from the mould and then a die cutter with a hydraulic press machine was used to cut the specimens with the required shape and dimensions.
The compression tests were carried out using Zwick/Roell universal testing machine fitted with a 50 kN load cell. An extensometer was used to record the compression of the specimens. The extensometer was connected to the machine with a specially designed fixture. In the compression tests, the crosshead speed was set at 21, 105 and 210 mm/min (equivalent to strain rate of 0.01, 0.05 and 0.1 s−1) and at each strain rate, the tests were performed at three different temperatures 25°C (RT), 50°C and 70°C using an in-situ heating chamber during compression. For each case, three specimens were tested.
Tearing tests
Angle tear strength test specimens with a nick were made according to the ISO 34-1:2015 tearing test standard.
36
The tests were performed at standard laboratory temperature (23 °
The measured tear strength indicates the resistance to the propagation of a defect, such as a nick in the specimen. In the angle tear test, the force required to tear a specified test piece along the nick already made in the test piece is measured. For calculating the tearing strength Process of mould manufacturing for preparation of tearing test specimens by CNC machining of resin tooling board.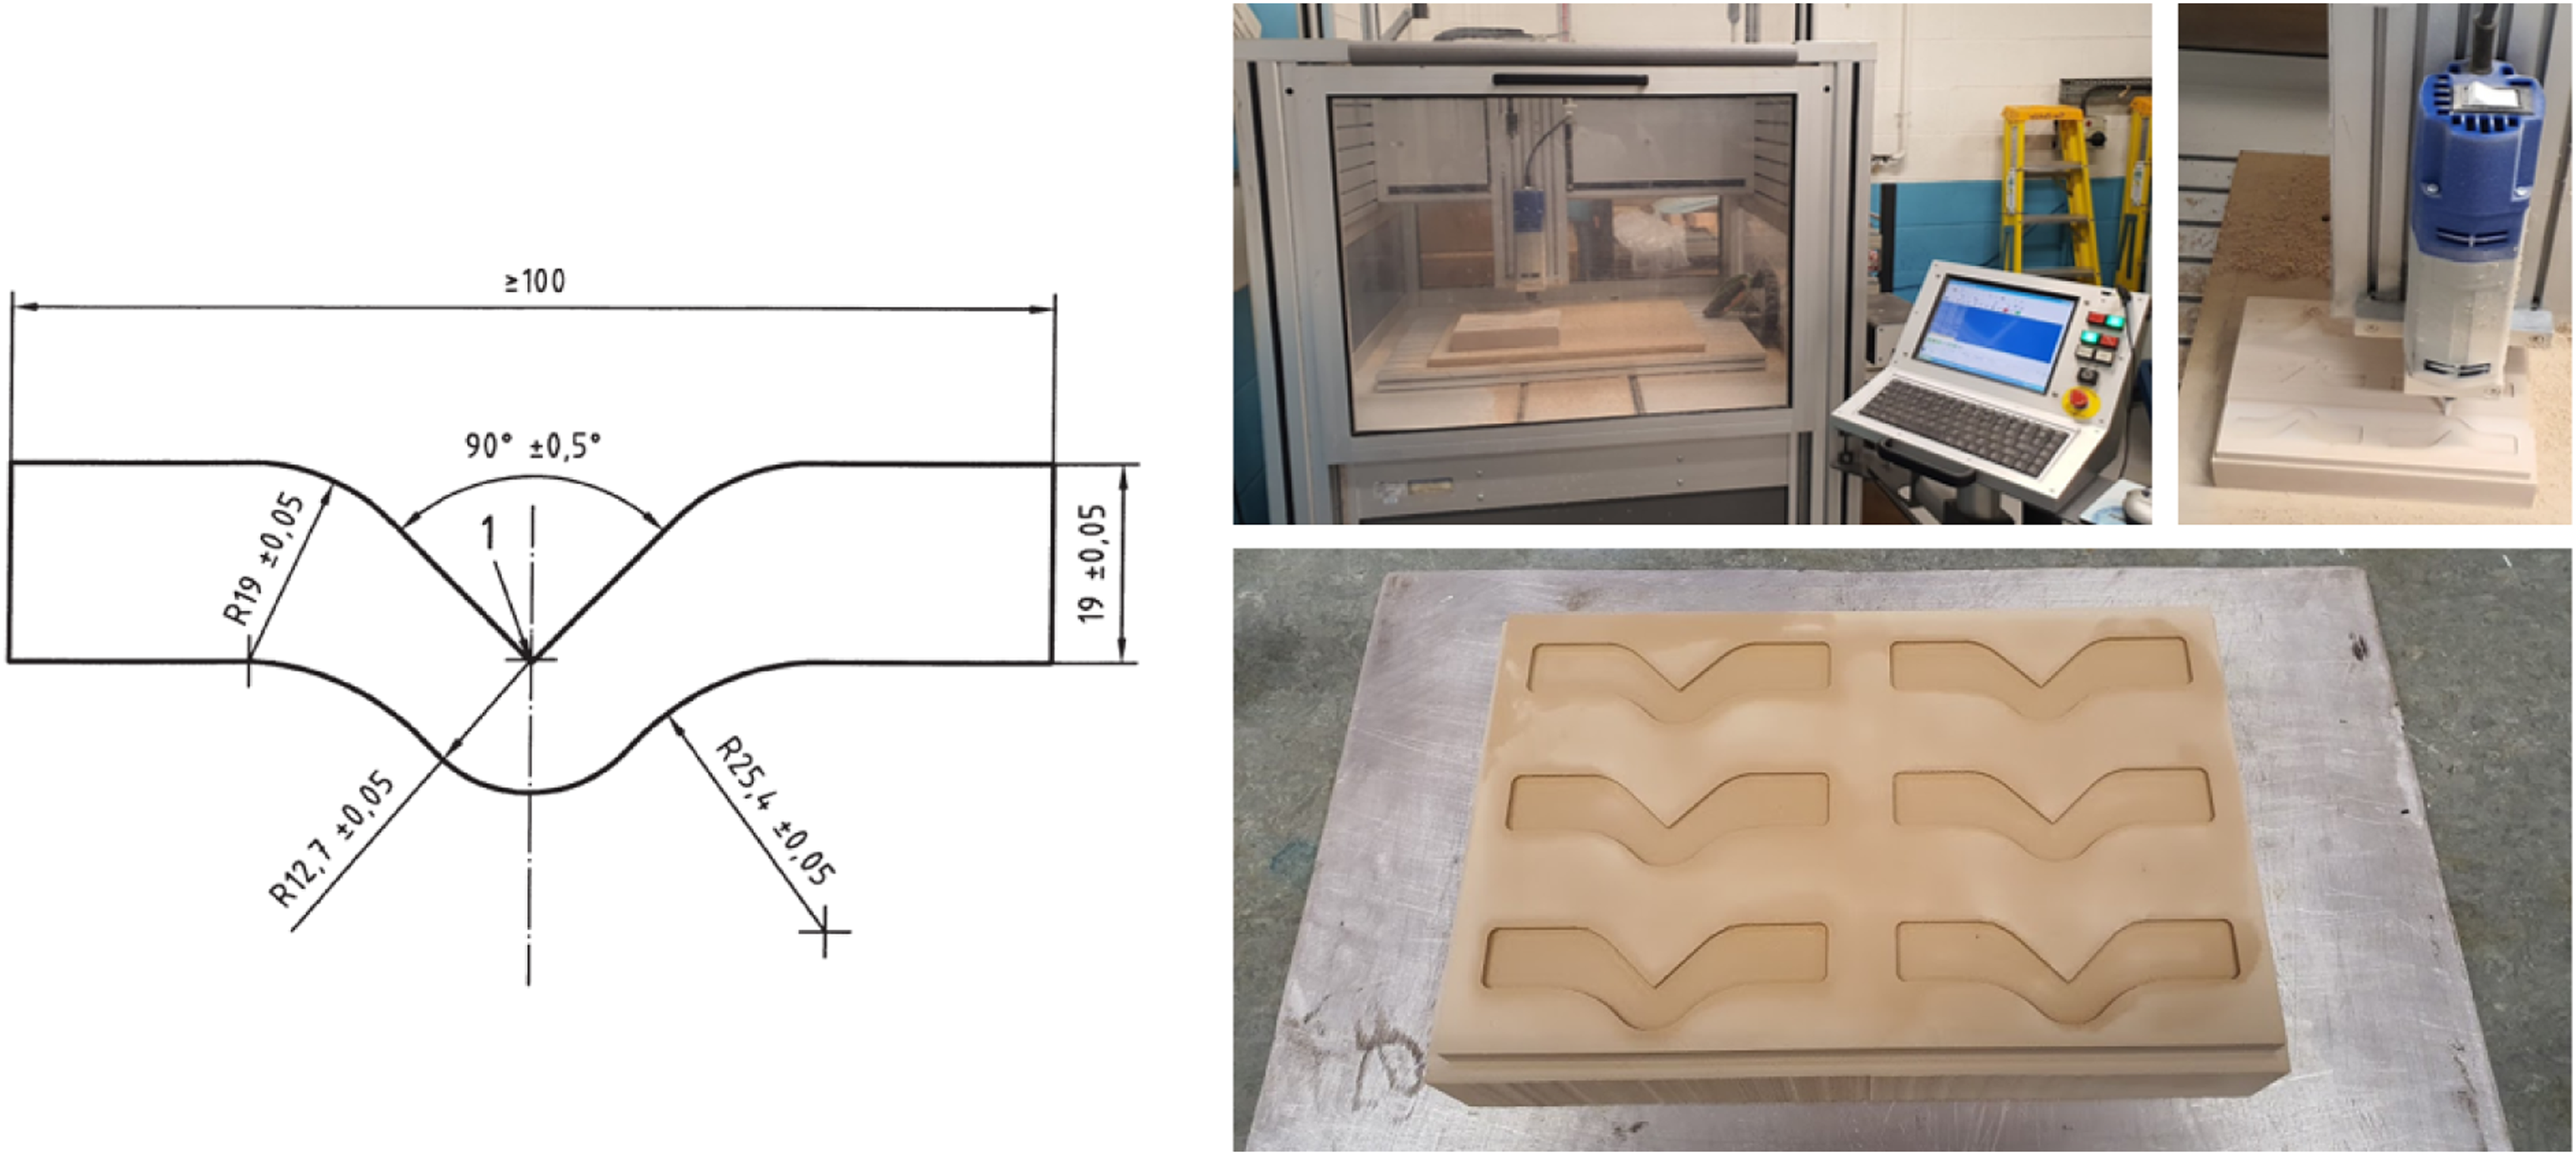

Scanning electron microscopy and infrared spectroscopy
The PU and the modified PU nanocomposites surface morphology was examined using field emission scanning electron microscopy (FESEM), with Quanta-FEG-250 model. All samples were cleaned with pressurised air followed by ethanol washing to remove any adsorbed particles. The samples were coated with 10–15 nm of platinum to inhibit charging and improve the secondary electron signal, allowing for better imaging of the samples. All FESEM samples were mounted on SEM stubs using carbon tape with adhesive sides and the images were taken at 75 to 5000 magnification at 5 kV. Energy-dispersive X-ray spectrometrt (EDX) with acceleration voltage (10–15 kV) was used to study the elemental composition of neat PU and their nanocomposites.
Fourier-transform infrared (FTIR) spectra were obtained using a PerkinElmer Spectrum Two spectrometer and the data were analysed with PerkinElmer Spectrum Version 10.03.09 software.
Contact angle and surface energy measurement
The static deionised (DI) water contact angles (CA) for PU, PU + GNP and PU + GNP + SG coatings were measured for 6000 ms after application of the water droplet (Sessile drop method) with a Krüss GmbH′ Drop Shape Analyzer (DSA) machine using 5 μL DI water droplets ejected from a micro-syringe in order to study the changes in the surface water amphiphobicity.
The surface free energy (−ΔGSL) was calculated using the Young–Dupre equation
37
equation (2)

Results and discussion
Tensile tests results
The tensile properties of the neat PU and its modified nanocomposites were investigated at different temperatures: 25°C (RT), 50°C and 75°C and at different strain rate: 0.01 s−1, 0.05 s−1 and 1 s−1.
Tensile properties of the neat PU
A sample of true stress–strain diagram of neat PU at strain rate of 0.01 s−1 and temperatures of 25°C, 50°C and 70°C is shown in Figure 3. Young’s modulus, elongation at break, UTS and modulus of toughness were extracted from true strain–stress diagrams and the results are summarised in Table 1. True stress–strain diagram of neat PU at strain rate of 0.01 s−1 and temperatures of 25°C, 50°C and 70°C. Summary of tensile properties of neat PU at three different temperatures and three different strain rates.

The results show that by increasing the strain rate, Young’s modulus increased for all three temperatures. At 25°C (RT), by increasing the strain rate from 0.01 s−1 to 0.05 s−1, initial Young’s modulus increased 14.7%, but no further increase was seen by increasing the strain rate to 0.1 s−1.
The elongation at break values increased with increasing the strain rate for all three temperatures. However, at the same strain rate, increasing the temperature decreases elongation at break. For example, at the strain rate of 0.01 s−1, by increasing the temperature from 25°C to 70°C, the elongation at break decreased by 308% and at the strain rates of 0.05 s−1 and 0.1 s−1, EL decreased by 118% and 134%, respectively.
As expected, the UTS increased by increasing the strain rate, for example, by increasing the strain rate from 0.01 s−1 to 0.1 s−1 at 70°C, the UTS increased by 52%, it increased 20% at 50°C and 226% at 70°C. However, at the same strain rate, the UTS decreased with increasing temperature.
The modulus of toughness is calculated by measuring the area under the true strain–stress curve. Generally, the modulus of toughness increased with increasing strain rate for all temperatures; the largest increase occurred at room temperature. At a constant strain rate, the modulus of toughness decreased with increasing temperature. The maximum modulus of toughness 13,302 kJ/m3 was observed at room temperature and a strain rate of 0.1 s−1 and the lowest value of 1255 kJ/m3 were seen at strain rate of 0.01 s−1 at 70°C.
Tensile properties of the PU + GNP
The PU was modified with 0.1, 0.2, 0.3, 0.5 and 1 wt% loading of GNP. Tensile tests were carried out at room temperature (25°C) and 0.05 s−1 strain rate to determine the optimum loading of the graphene. The engineering strain Engineering strain–stress of graphene modified PU at various GNP loading at RT and strain rate of 0.05 s−1.
True strain 

Tensile properties of PU and PU modified with 0.1, 0.2, 0.3, 0.5 and 1 wt% loading of functionalised graphene (f-GNP) at room temperature (25°C) and 0.05 s−1 strain rate.

Tensile properties of the PU + GNP + SG
In order to investigate the impact on the mechanical properties of PU materials by adding hydrophobic silica, the following samples were prepared and tested at room temperature.
Figure 5(a) shows the variation in Young’s modulus for neat PU and various PU nanocomposites. Highest Young’s modulus was obtained from the PU modified with 1 wt% SG and the next highest was for the PU modified with 0.5 wt% GNP + 1 wt% SG. Increasing the loading of SG from 1% to 2.5% adversely affected Young’s modulus of PU+GNP+SG nanocomposite. (a) Young’s modulus, (b) elongation at break, (c) ultimate tensile strength and (d) modulus of toughness of neat PU, PU + SG and PU + GNP + SG at 25°C.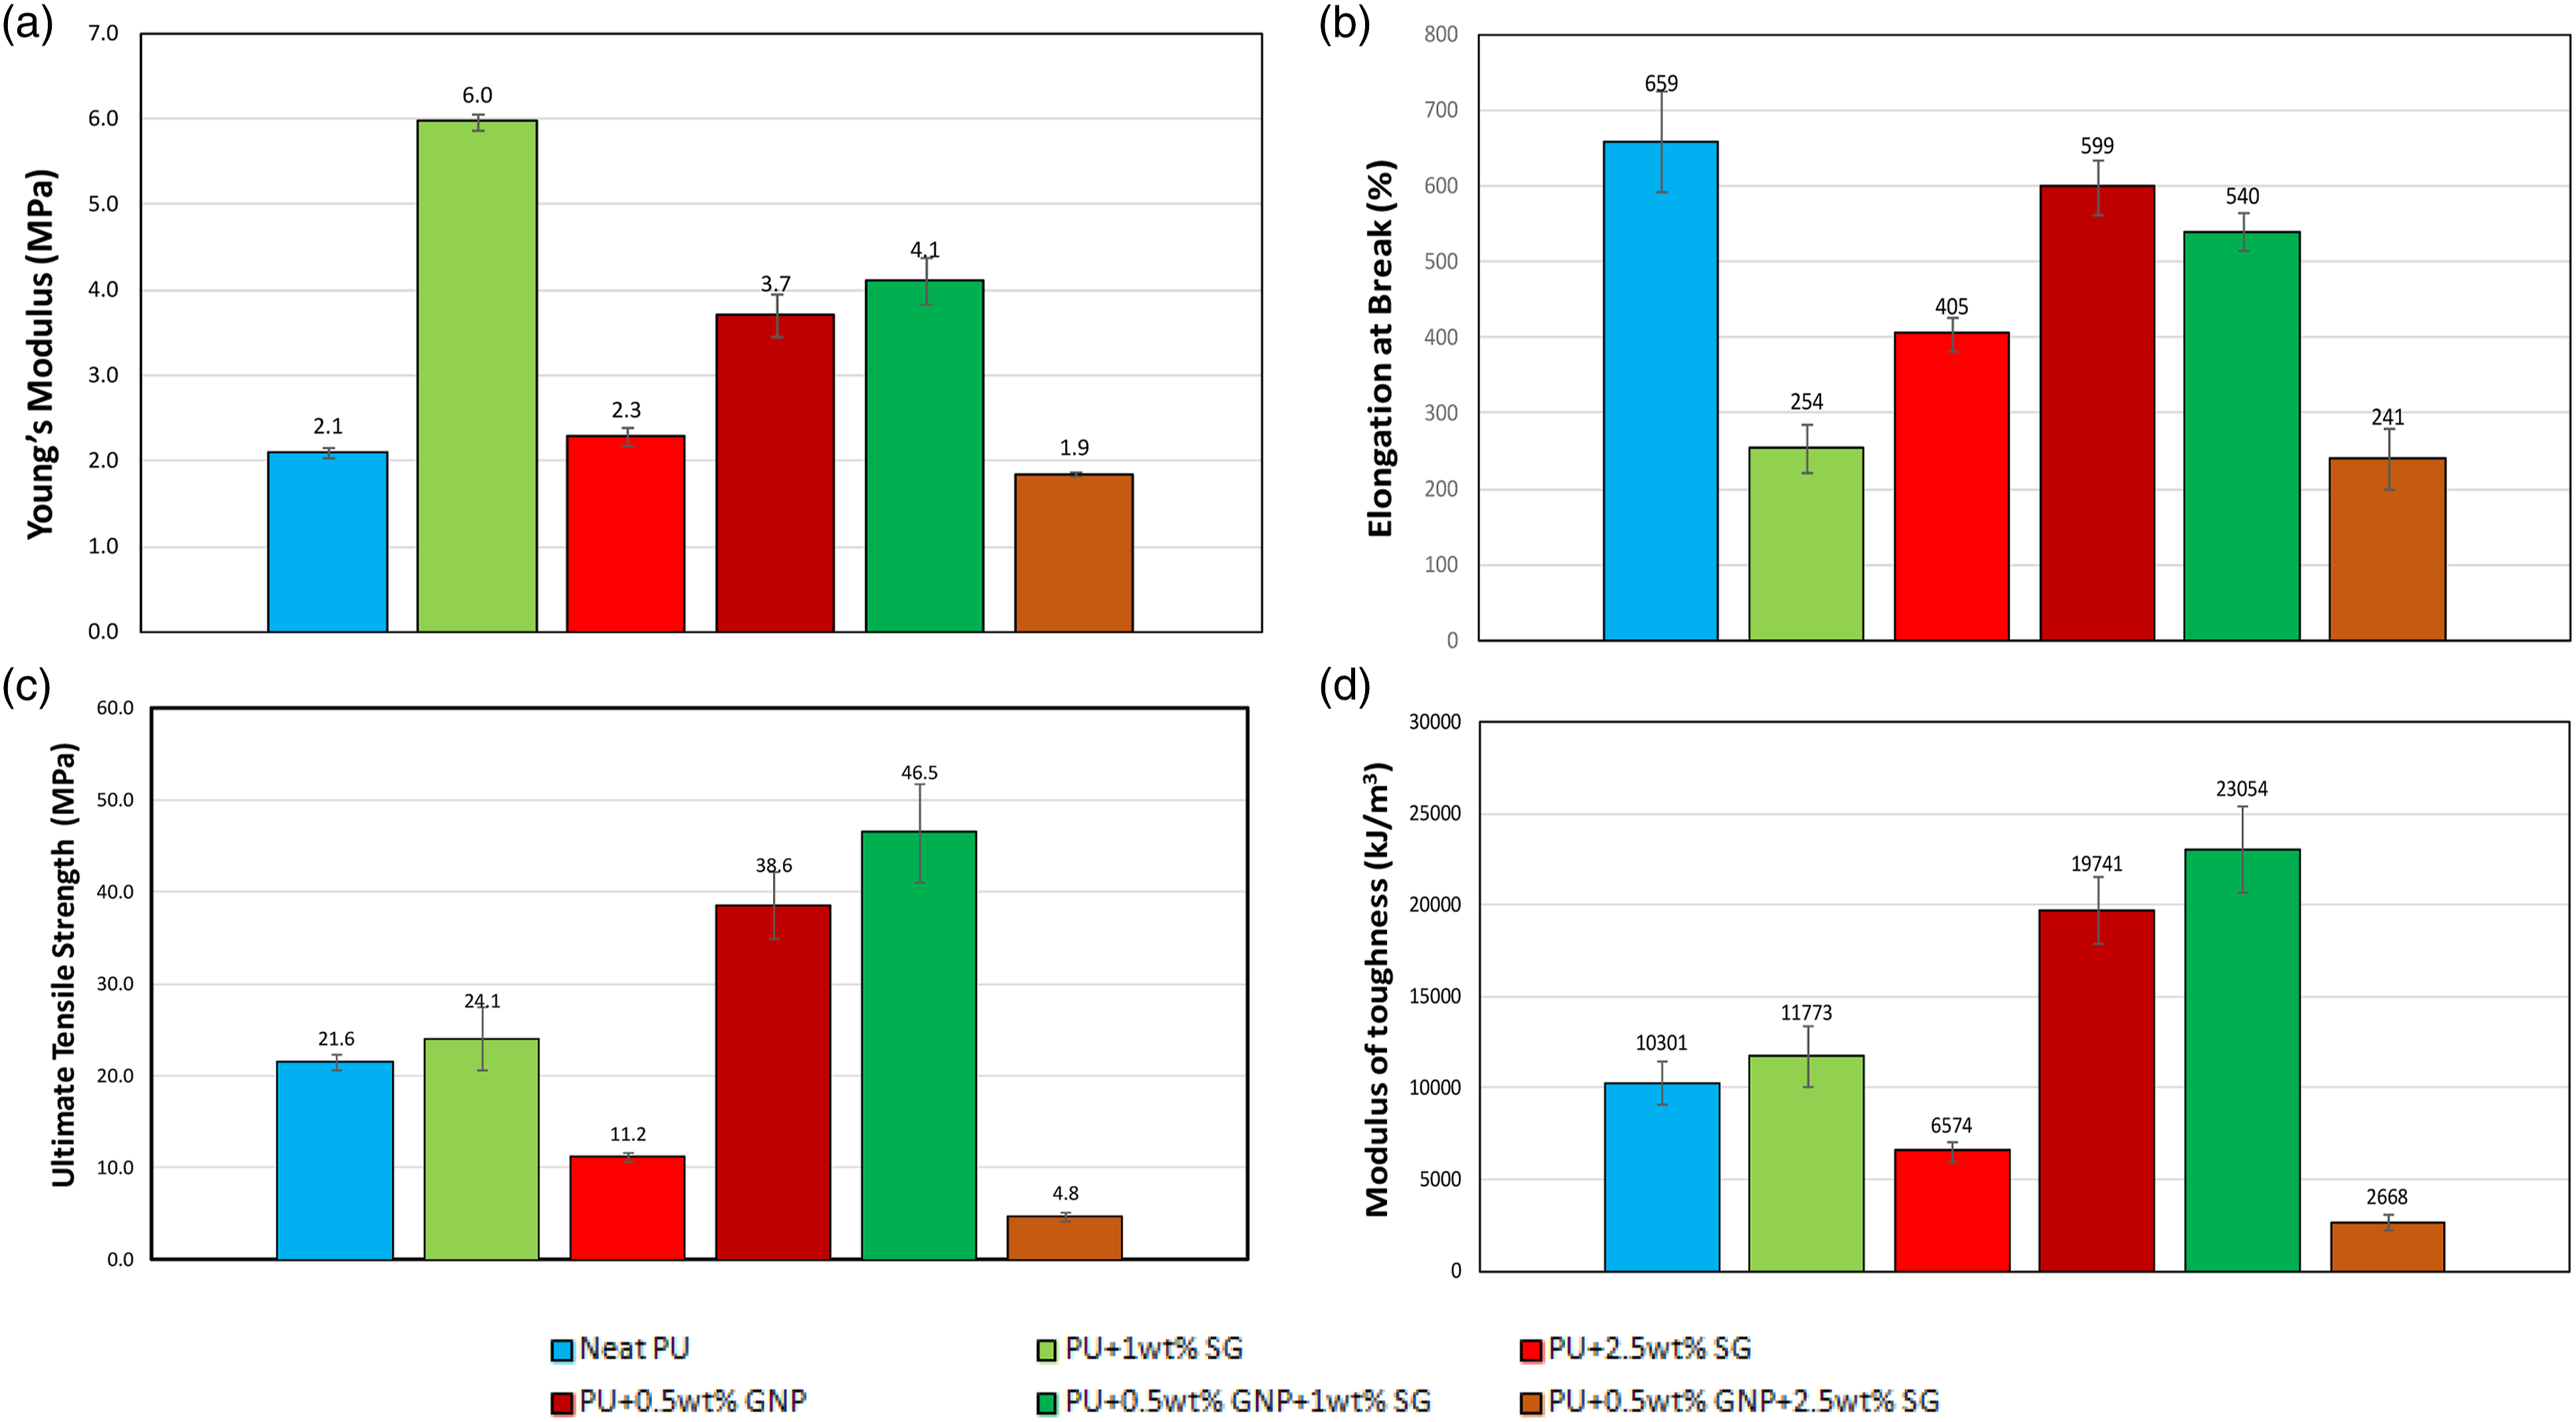
The effect of sol–gel loading on the elongation at break of neat PU and modified PU + GNP is shown in Figure 5(b). Adding SG to the neat PU decreases the elongation at break substantially; however, for PU + GNP, the reduction is small. The greatest elongation at break value is obtained for neat PU and the lowest one is for the PU + 0.5 wt% GNP + 2.5 wt% SG.
The effect of SG loading on the UTS of neat PU and modified PU + GNP is shown in Figure 5(c). A 1 wt% SG loading to the neat PU and modified PU + GNP, resulted in an increase in the UTS; but further increasing the SG loading to 2.5 wt% resulted in a decrease in the UTS value for both neat PU and PU + GNP.
The effect of SG loading on the modulus of toughness is shown in Figure 5(d). At 1 wt% SG loading, the modulus of toughness increased for both the neat PU and the PU + GNP nanocomposite. However, at a higher SG loading of 2.5 wt%, the modulus of toughness decreased for neat PU and PU + GNP.
Tensile properties of the neat PU, 0.5 wt% f-GNP modified PU and 0.5 wt% GNP + 1wt% SG modified PU at 25°C.

Compression tests of neat PU, PU + GNP and PU + GNP + SG
Monotonic compression tests were performed on neat PU, PU + GNP and PU + GNP + SG nanocomposites at room temperature and 25, 50 and 75°C for three different strain rates.
Uniaxial compression tests result for PU at 25°C and for three strain rates are shown in Figure 6(a). The results indicate that neat PU has minimal strain rate dependency at room temperature, and the mechanical properties are only slightly affected by changing the strain rate. However, at higher temperature, the compressive behaviour of neat PU was affected as shown in Figure 6(b). True strain–stress at strain rate of 0.01, 0.05 and 0.01 s−1 at temperature of 25°C, and at strain rate of 0.05 s−1 at 25°C, 50°C and 70°C for (a, b) neat PU, (c, d) PU + GNP and (e, f) PU + GNP + SG, respectively.
Uniaxial compression test results for the PU + GNP at 25°C and three strain rates are shown in Figure 6(c). The results indicate that neat PU has a slight strain rate dependency at room temperature. However, at higher temperature, the compressive behaviour of neat PU + GNP was substantially affected as shown in Figure 6(d).
Uniaxial compression test results for PU + GNP + SG at 25°C and three strain rates are shown in Figure 6(e). The results indicate that similar to PU + GNP, PU + GNP + SG has a slight strain rate dependency at room temperature. However, the compressive behaviour of PU + GNP + SG is strongly affected by increasing the temperature as shown in Figure 6(f).
The effects of temperature and strain rate on the values of residual strain (εr), compressive strength and energy absorption of neat PU, PU + GNP and PU + GNP + SG in monotonic compressive loading are extracted from Figure 6 are shown in Figure 7. At a fixed strain rate, an increase in the temperature caused a significant increase in the residual strain for PU. However, the effect of strain rate at the higher temperature of 70°C was less. The change in the compressive strength with increasing strain rate is small and it decreases with increasing temperature. Finally, energy absorption was calculated by measuring the area under the stress–strain curve in the compression test, and as shown in Figure 7(c) at higher temperature the energy absorption of neat PU decreases. For PU + GNP material, increasing the temperature at a fixed strain rate resulted in an increase in residual strain and decreases in the compressive strength and energy absorption. PU + GNP + SG material shows a similar pattern to those seen for PU + GNP material. Residual strain, compressive strength and energy absorption of the neat PU (top row), PU + GNP (middle row) and PU + GNP + SG (bottom row) versus strain rate at three different temperatures.
Cyclic compression tests
In this section, the result of true stress–true strain behaviour during cyclic compression loading–unloading tests for maximum strain εmax = 0.3 and εmax = 0.5 and at strain rate of
The compressive true stress–true strain behaviour of neat PU with εmax = 0.5 and True stress–strain results of cyclic compression loading–unloading at = 0.1 s−1 for (a) neat PU at εmax = 0.5, (b) PU + GNP at εmax = 0.5, (c) PU + GNP + SG at εmax = 0.5 and (d) PU + GNP + SG at εmax = 0.3, respectively at RT.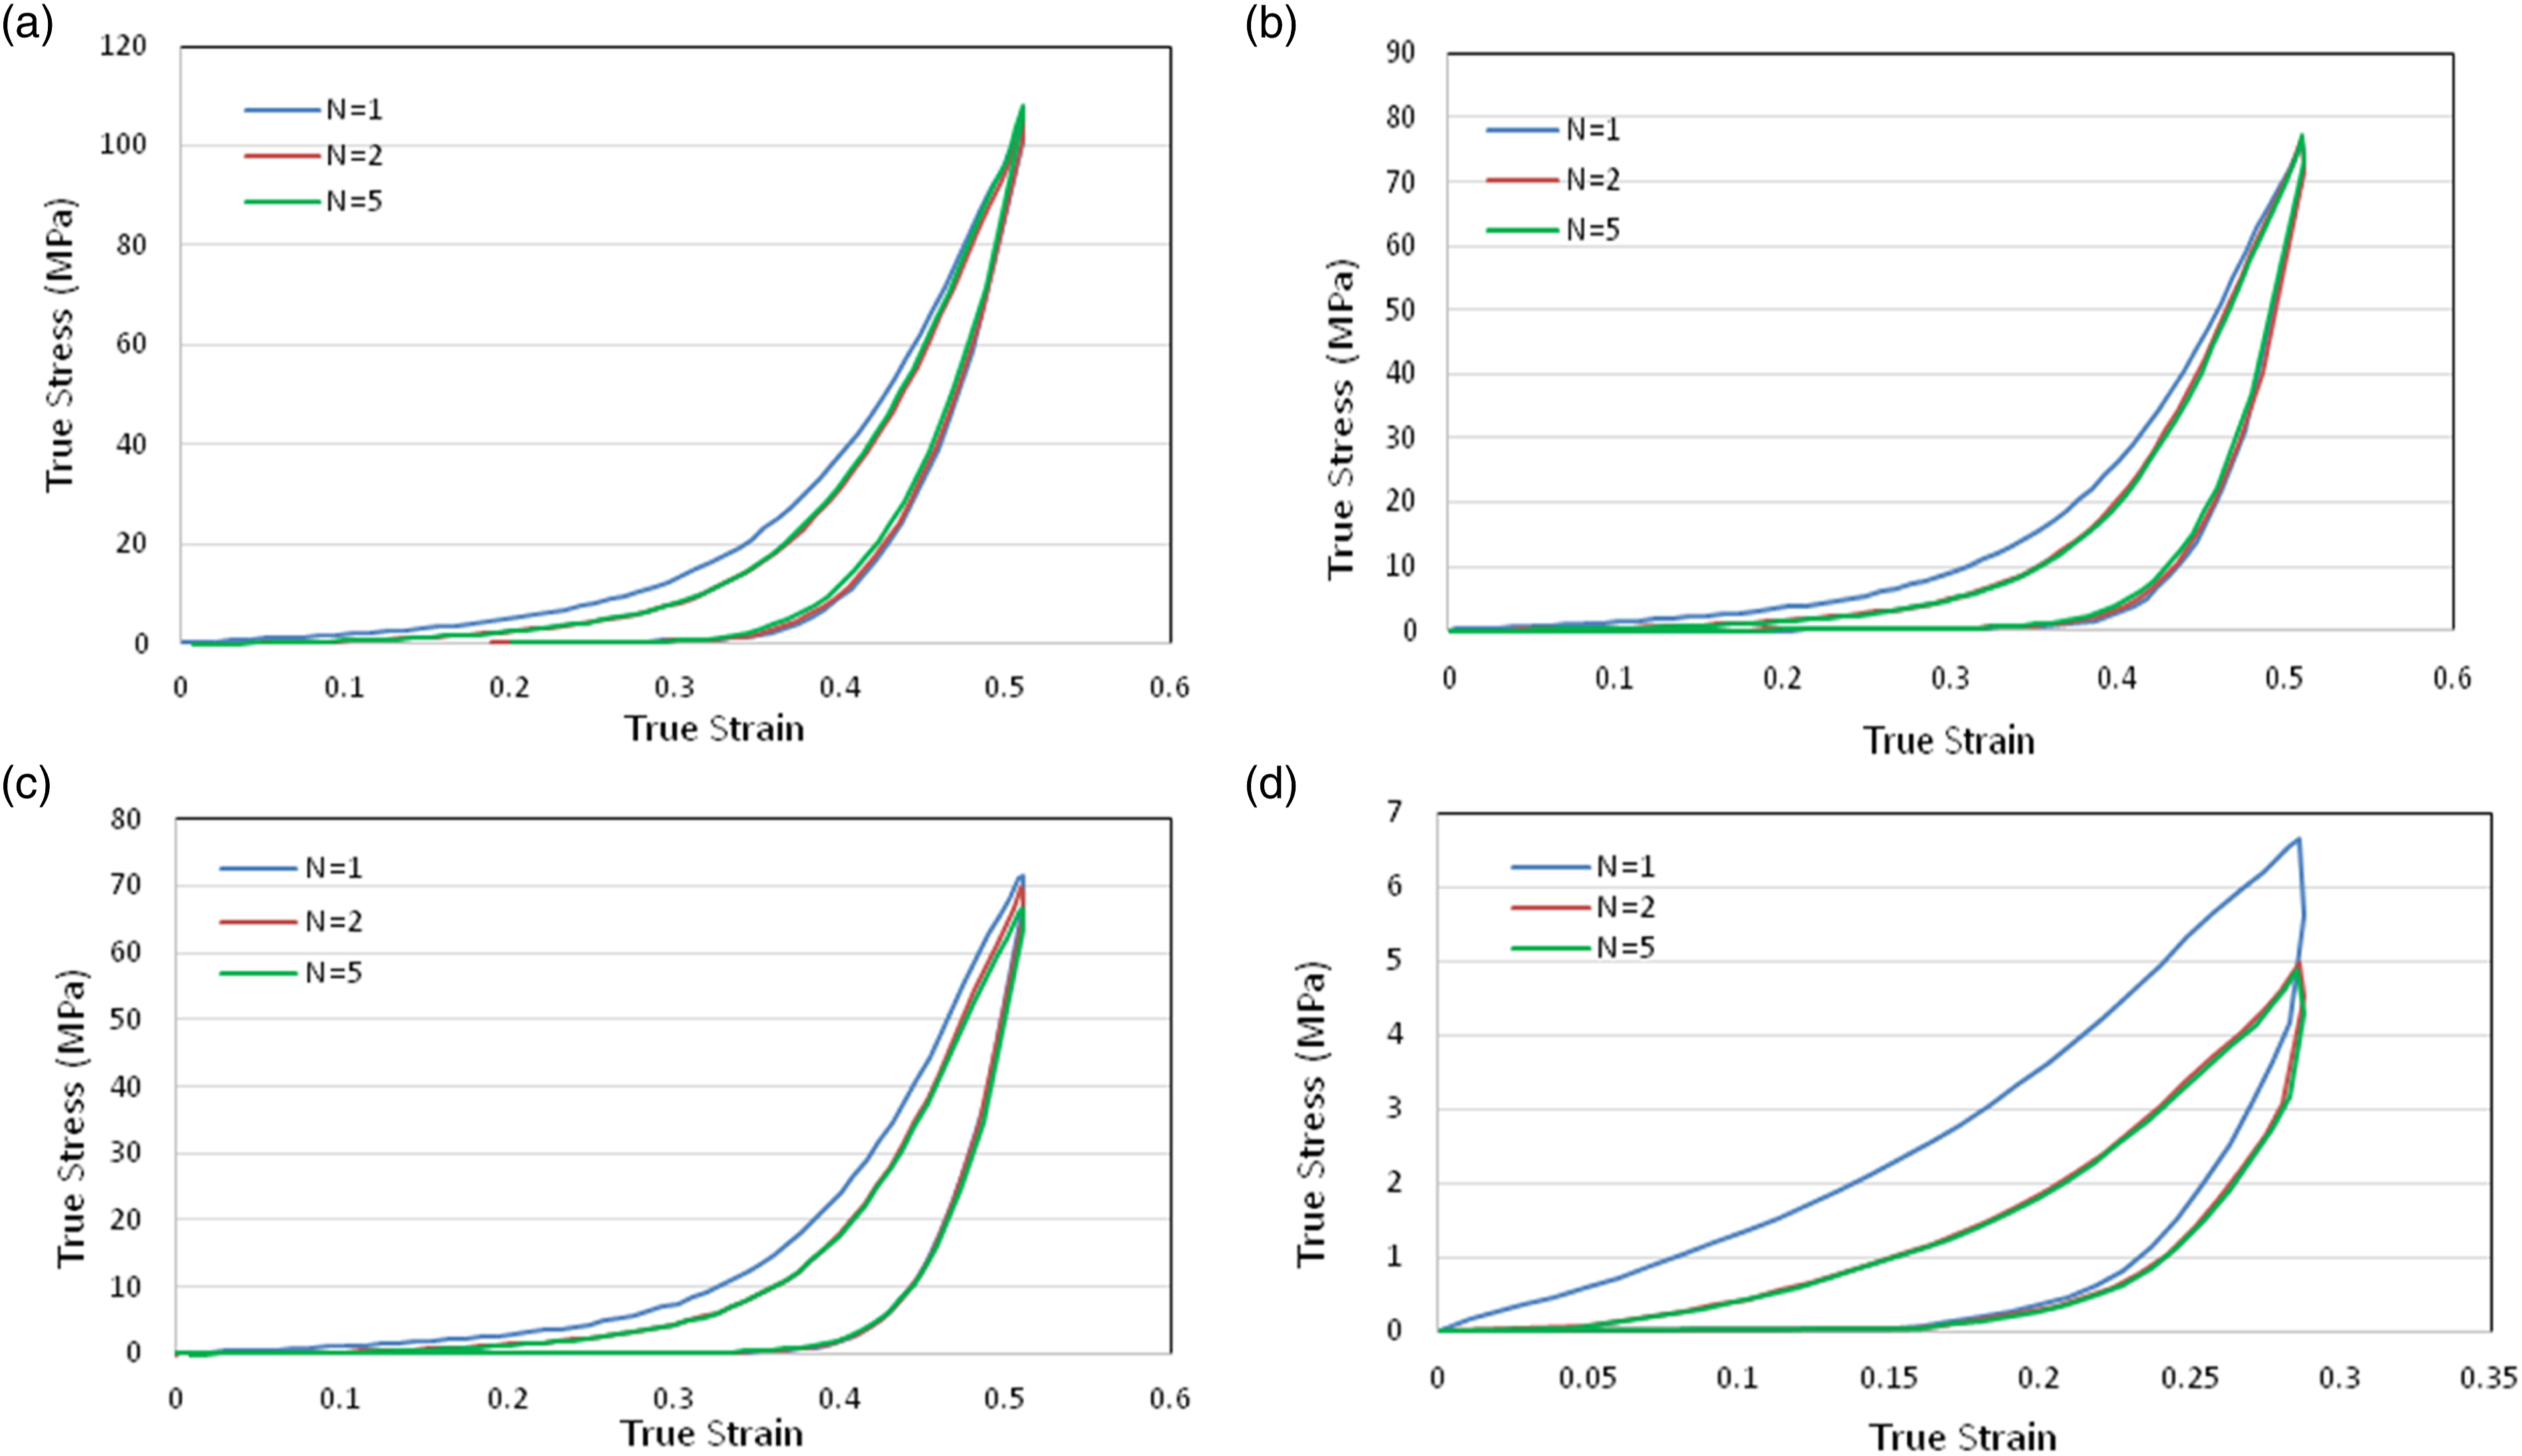
Results of the cyclic compression test on neat PU, PU + GNP and PU + GNP + SG at strain rate = 0.1 s−1.

The compressive cyclic loading tests show that the stress–strain curve in the second cycle is far more compliant than that observed in the first cycle, which explains the softening behaviour of all three coating materials after cyclic loading. In addition, the stress–strain behaviours for all three coatings are stabilised after the first cycle. At a maximum strain of 0.5, the stress magnitude reaches a maximum in the first cycle. The unloading paths after a given strain are the same for all coatings and follow the same curve independent of the cycle number.
Finally, as shown in Figure 9, the energy absorption of neat PU is greater than PU + GNP and PU + GNP + SG for all cycles. It is noticeable that at the maximum strain while the maximum stress attained for PU is 107.9 MPa, for PU + GNP, it is 77.4 MPa and for PU + GNP + SG, it is 71.5 MPa; hence, PU + GNP + SG experiences the least stresses during cyclic compressive loading. In our previous work, the erosion performance of these three coating under repeated rubber ball impact were investigated and the superiority of PU + GNP + SG was demonstrated.
35
Comparison of energy absorption of PU, PU + GNP and PU + GNP + SG at εmax = 0.5 and ε = 0.1 s−1.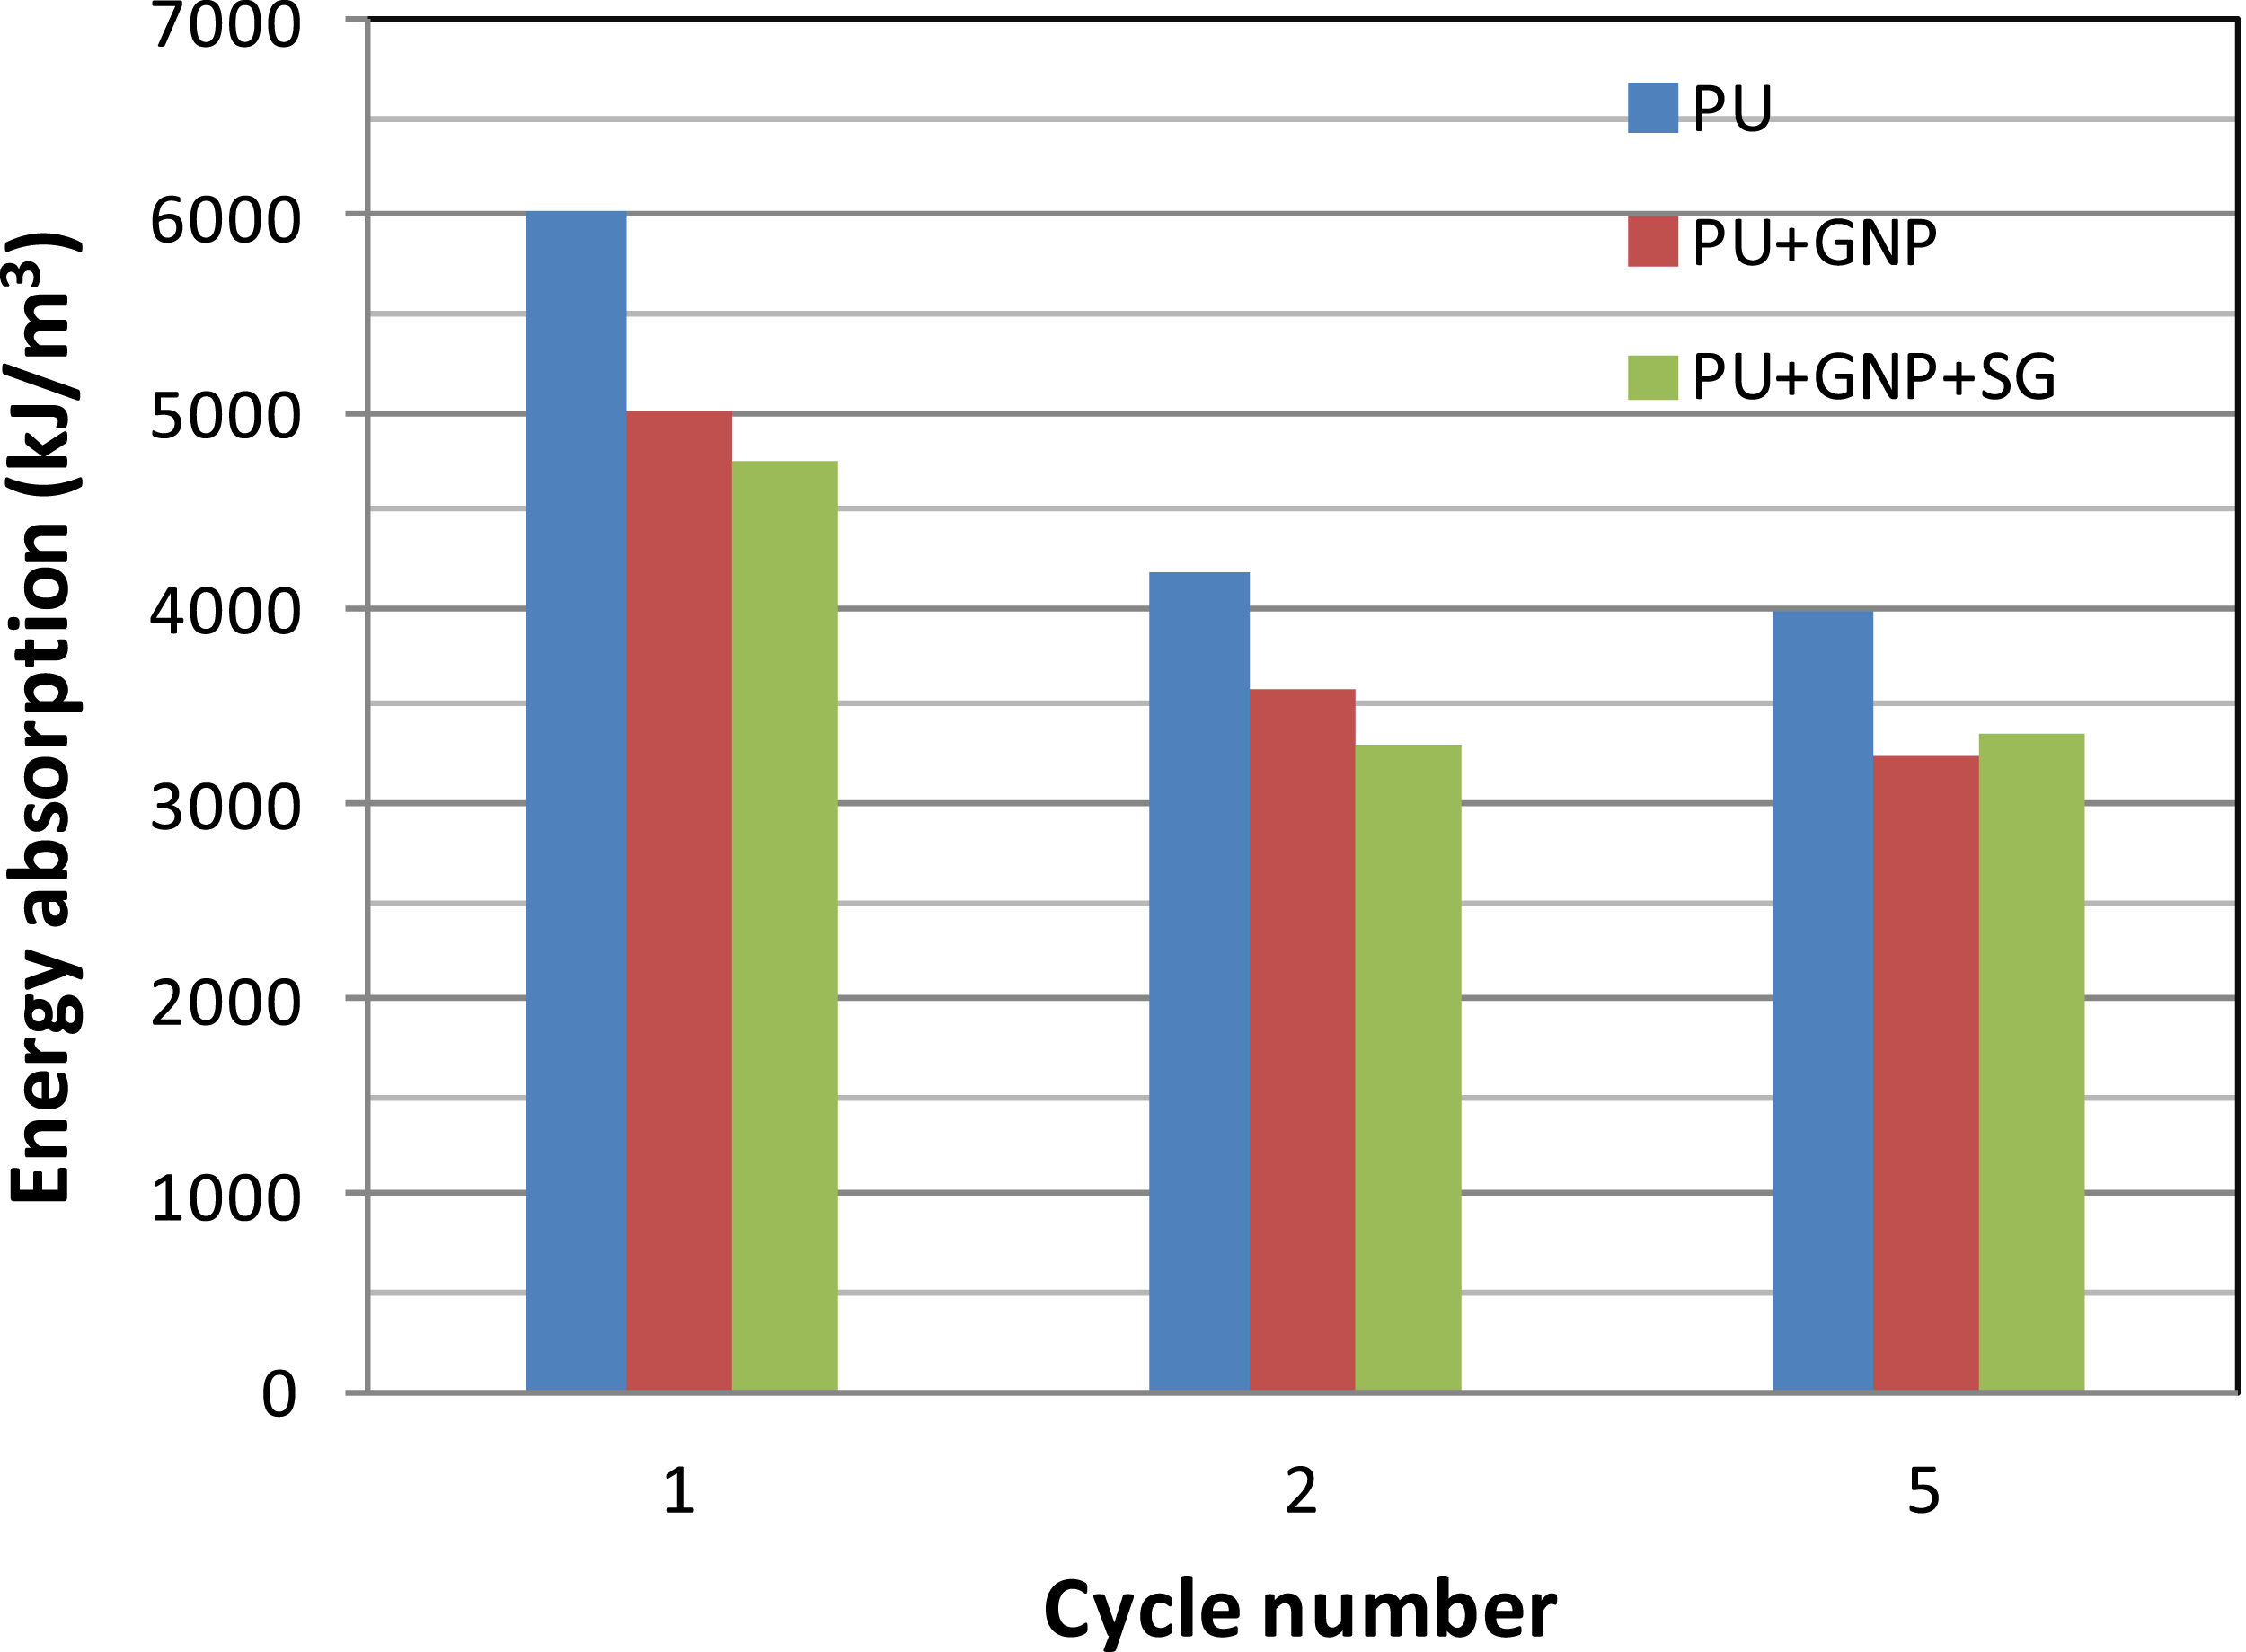
Tearing test results
The results of the tearing tests on neat PU are shown in Figure 10(a). All three specimens show similar behaviour during the test. For all three specimens in the first 35 mm of elongation, the force was monotonically increased until the start of tearing, then crack growth occurred and the force decreased until the specimens completely tore into two pieces. Between displacements of 35 and 45 mm, when crack growth occurred, there are slight differences in the behaviour of the specimens due to difference in the crack paths. The cracks tend to follow different preferred crack directions and they find the lowest resistance path for crack propagation.
38
There were small fluctuations in the force during tearing tests. These variations are not noises from the instrument but rather caused by the stick–slip behaviour observed during fracture in the PU as can be seen in the inset of Figure 10(a). During stick–slip, the minimum force occurs when the crack extends, and the maximum represents crack arrest. The interval of these fluctuations relates to the morphology and micro mechanism of the polymer material, such as the polymer chain alignment, arrangement and distribution of crystalline.
38
Tearing tests results of (a) three neat PU specimens (inset showing stick–slip) and (b) the PU, PU + GNP and PU + GNP + SG materials.
Results of tearing test of neat PU, and PU + GNP and PU + GNP + SG nanocomposites.

Microstructural analysis
Figure 11 shows the infrared spectra of PU, PU + GNP, and PU + GNP + SG. All three FTIR spectra displayed characteristic peaks due to the key functional groups of polyurethane: N-H stretch at 3250 cm−1, C-H stretches in 2950–2800 cm−1 region and a carbonyl group stretch at 1700 cm−1. In the fingerprint region (1500–500 cm−1), the only significant difference observed between PU and the modified PU is an additional peak around 800 cm−1 in the spectrum of PU + GNP + SG. This may be attributed to the symmetric stretching vibration of a Si-O-Si.
39
FTIR spectra of PU, PU + GNP and PU + GNP + SG at wavenumber range of (a) 4000−500 cm−1 and (b) 1800–700 cm−1.
The general scheme for the preparation of PU nanocomposites and their interaction with the GNP is presented in Figure 12. Carboxyl functionalised GNP create hydrogen bonding with the PU backbone chain, and hence stronger interface of GNP and PU backbone chain, resulting in improvement in mechanical properties of PU. This was supported by the field emission scanning electron microscope (FESEM) studies. FESEM images of the PU and its composites are presented in Figure 13 together with energy-dispersive X-ray spectroscopy (EDX) and elemental mapping of the samples. The SEM images of PU and PU + GNP clearly indicate that the incorporation of f-GNP into the PU polymer did not significantly alter the surface morphology and there were no appreciable evidences of graphene sheets appearing on the surface, suggesting the homogeneous dispersion of f-GNP in the PU matrix. This could be due to the strong interaction of f-GNP carboxylic groups with the urethane functional groups in PU via hydrogen bonding as shown in Figure 12. The strong hydrogen bonding leads to the uniform dispersion of f-GNP and can avoid leaching of graphene sheets out of the PU matrix over time. General scheme for the preparation of PU and its GNP composites. The FESEM of top surface of (a, d) PU, (b, e) PU + GNP and (c, f) PU + GNP + SG, at different magnification. Insight image on (a) to (c) shows the corresponding EDX mapping and the bottom columns correspond to the respective elemental mapping.

Interestingly, PU + GNP + SG displayed a smoother surface than PU and PU + GNP. This could be due to the in-situ polymerisation technique adopted in the preparation of PU + GNP + SG. The silica particles are initially well dispersed in the polyisocynates and are then transferred to the f-GNP-polyol mixture to initiate the polymerisation; thus, the polymerisation initiates around the silica and f-GNP nanoparticles, which facilitates the strong interactions between the nanoparticles and polymer chains. This in turn prevents the aggregation of nanoparticles and helps the homogeneous dispersion of nanomaterials within the PU matrix. Moreover, research has shown that grafting hydrophobic moieties onto the silica surface can enhance the silica’s miscibility with polymer components due to its reduced hydrophilicity and enhanced interfacial interaction with the PU matrix.40,41 Furthermore, the presence of carboxylic groups on f-GNP can improve the dispersibility via hydrogen bonding. The uniform and continuous dispersion of silica nanoparticles in the PU matrix was further confirmed in the EDX and elemental mapping, as shown in Figure 13.
Water droplet contact angle and surface energy of the coatings
The variation of water contact angle (CA) with respect to time for PU and its nanocomposites are presented in Figure 14. The results show that the water CA of PU is between 56 and 57. This indicates the slightly hydrophobic property of the neat PU. The low hydrophobicity of PU is due to the presence of a large number of surface polar urethane functional groups which can interact with polar water molecules. However, addition of f-GNP nanoparticles to the PU increased hydrophobicity (CA between 70 and 80). The two-dimensional f-GNP nanoparticles possess a high surface area, and are highly hydrophobic due to grapheme’s non-polar nature and only a small concentration of carboxylic groups at the edges. The small addition of 0.5 wt% of f-GNP covers a large surface area within PU matrix and improves the overall hydrophobicity. Further, the addition of hydrophobic silica along with f-GNP significantly contributes to the increase in the overall hydrophobicity of the coating. The CA of PU increased from 56 to around 110 with the addition of 0.5 wt% f-GNP and 1 wt% hydrophobic silica. The hydrophobic functionalized silica improves the compatibility as well dispersibility in the PU matrix. The silica nanoparticles are easily adsorbed on the graphene surface which further improves their dispersibility as observed in the elemental mapping shown in Figure 13. The addition of hydrophobic nanoparticles (0.5 wt% GNP + 1 wt% sol–gel) and their homogeneous dispersion enhance the hydrophobicity of the PU matrix. The comparison of static DI water contact angle (CA) of the GFRP surfaces coated with PU, PU + GNP and PU + GNP + SG at different interval of time.
Moreover, the surface free energy, which was determined from the initial static DI CA values, followed an opposite trend when compared to the static DI CA. The calculated surface free energy of pure PU was around 114.55 mJ·m−2; however, with the addition of the f-GNP into the PU, the surface energy decreased to 73.36 mJ·m−2. Furthermore, the addition of hydrophobic silica significantly reduced the surface free energy to 50.06 mJ·m−2 in the PU + GNP + SG material. The decrease in surface free energy suggests the superior water repellency of the PU modified coatings which could improve the weather resistant property.
Conclusions
Polyurethanes have low elastic modulus and tensile strength, capable of large deformation. The mechanical properties of PU have been improved by incorporating functionalised graphene nanoplatelets (f-GNP) and silica-based sol–gel in PU matrices.
Tensile, monotonic and cyclic compressive and tearing tests have been conducted. The results showed that the mechanical response of PU and its modified ones depend strongly on temperature, strain rate and nanoparticles loading. The PU + GNP + SG nanocomposite with 0.5 wt% GNP and 1 wt% SG loadings has the highest elongation at break, UTS, modulus of toughness and second highest Young’s modulus in tensile tests.
The cyclic compression tests revealed that the maximum stress at maximum strain of 0.5 for PU is 107.9 MPa, for PU + GNP is 77.4 MPa and for PU + GNP + SG is 71.5 MPa. This indicates PU + GNP + SG experiences the least stresses during cyclic compressive loading, beneficial to repeated compressive impact by rain droplets as observed in our previous work. 35
Tearing test results showed that the PU + GNP nanocomposite has the highest tearing strength and PU + GNP + SG has the highest elongation at break. The PU + GNP + SG nanocomposite has much higher value for Young’s modulus (95%), tensile strength (115%), modulus of toughness (124%) and elongation at break (102%) relative to the neat PU at room temperature. In addition, the tearing energy for both modified PU nanocomposites was higher than the neat PU (137% increase for PU + GNP and 148% increase for PU + GNP + SG).
The developed PU coatings were primarily intended for leading edge erosion protection of wind turbine blades. The erosion tests of the developed coatings have been performed with rubber balls; water-jet erosion tests will be carried out in the near future. In addition, these coatings have properties that might be exploited for many other applications such as for roof coatings in anticorrosive/erosion resistance and for line-marking paints. In addition, hydrophobicity of the developed coatings enables surfaces to clean themselves by the rolling of water droplets on the surfaces.
Footnotes
Acknowledgements
The authors HH and AD are grateful to Dr Fanya Ismail from SGMA (Sol-Gel Materials & Applications Ltd) Company, UK, for in-kind supply of sol–gel material and assistance from mechanical testing technician Dean Wells at Kingston University. The authors LM and NFJJ gratefully acknowledge the financial support of the Innovation Foundation of Denmark in the framework of the Grand Solutions project DURALEDGE, Durable leading edges for high tip speed wind turbine blades, File nr.: 8055-00012A.
Declaration of conflicting interests
The author(s) declared no potential conflicts of interest with respect to the research, authorship, and/or publication of this article.
Funding
The author(s) disclosed receipt of the following financial support for the research, authorship, and/or publication of this article: This work was supported by the Innovation Foundation of Denmark, File nr.: 8055-00012A.