
Abstract
Calcium carbonate (CaCO3) nanoparticles in polymer matrix cause to improvement in polymer performance, including thermal stability and mechanical properties. The main goal of this article is to investigate the effect of different weight percentage of nanoparticles of CaCO3 on thermal stability and mechanical properties of polyethylene (PE) nanocomposites. The morphological structure of CaCO3 nanoparticles and nanocomposites was investigated by transmission electron microscopy and scanning electron microscopy. The thermal stability of PE and its nanocomposites was also determined by differential scanning calorimetry (DSC), thermogravimetric analysis (TGA), and thermomechanical analysis. Nonisothermal crystallization experiments by DSC test showed that the incorporation of nanoparticles increased the crystallinity, glass transition temperature, and the effective energy barrier for crystallization process. Besides, degradation behavior was evaluated by TGA. The onset mass loss temperature shifted to higher value in the presence of nanoparticles.
Introduction
In recent years, an interesting field for researchers is to investigate the properties of nanocomposites. Among the nanofillers, nanoparticles cause to improvement in mechanical and thermal properties of polymer nanocomposites. Calcium carbonate (CaCO3) is one of the most useful and abundant materials which was used in polymer composites. It has three crystal morphologies, calcite, aragonite, and vaterite. The structure of calcite finds in nature easily, and it is more stable than other polymorphs of CaCO3 at ambient temperature and atmosphere pressure. CaCO3 with a few weight percentages loading in the thermoplastic polymer nanocomposites strongly effects on properties of polymers. 1 –7 The effects of addition of precipitated CaCO3 (PCC) to thermoplastic polymers have been investigated by many researchers. The results showed that the significant improvements have been shown in thermal and mechanical properties, such as higher heat distortion temperatures, an enhancement in flame resistance, increase in modulus, stiffness, better barrier properties, enhancements of viscosity, and dimensional stability. 1 –7
Among the thermoplastic polymers, polyethylene (PE) is one of the most widely used polymers, which possess relatively low costs but poor thermal and mechanical properties. In order to improve the weakness points of PE, nanosized CaCO3 has been incorporated in PE. 1 –9
Wang et al. investigated the effect of CaCO3 on mechanical properties of low-density PE nanocomposites. They showed that the tensile property and flexural modulus of nanocomposite evidently increased by the addition of CaCO3 as higher crystallinity index of nanocomposite compared to pure polymers. 1
Tanniru and Misra demonstrated that the CaCO3 nanoparticles in high density polyethylene (HDPE) matrix increased the bulk crystallinity and modulus, while the nucleating effect decreased the spherulite size. 8 The addition of CaCO3 to PE increased impact strength at temperature range of −40 to +70°C. 8 The reinforcement of HDPE with nanosized CaCO3 retains adequately high strength in the temperature range of −40 to +20°C. 9 High impact strength was accompanied by increase in modulus. The reinforcement of neat HDPE with nanosized CaCO3 altered the deformation micro mechanism from crazing–tearing in HDPE to fibrillated fracture in polymer nanocomposite. 9
In the present study, CaCO3/PE nanocomposites have been synthesized. The fracture surface of nanocomposite was confirmed by scanning electron microscopy (SEM). Furthermore, thermal degradation, crystallization kinetics, and mechanical properties of the CaCO3/PE nanocomposites are also investigated.
Experimental
Materials
PE with the density (0.937 g cm−3), vicat softening point (117°C), and melting flow index (MFI) at 190°C with 2.16 kg mass is measured 4.2 g/10 min which was supplied by Tabriz Petrochemical Complex, Iran. The CaCO3 nanoparticles (Socal® PCC) were obtained from Solvay Advanced Functional Materials, Salin Degiraud, France. CaCO3 have a rhombohedra structure which related to the calcite phase. Figure 1 shows the transmission electron microscopic (TEM) micrographs of nanosized CaCO3. As seen, nanoparticle has an irregular morphology and an average size of about 60 nm was measured using particle size analyzer (PSA), which is shown in Figure 2.

TEM micrograph of CaCO3 nanoparticles.

Size distribution of CaCO3 nanoparticles using PSA.
Sample preparation
To evaluate the role of nanosized CaCO3 on mechanical and crystallization behavior of PE, a series of PE/CaCO3 nanocomposite were fabricated. For this purpose, nanosized CaCO3 and PE were first mechanically mixed in different weight ratios to achieve the desired powder composites which was done to decrease agglomeration size of nanoparticles and have good dispersion of nanoparticles in PE powders. The premixed nanocomposites powder was suspended in methanol as a media. In order to avoid agglomeration of nanoparticles and improve the dispersion of nanosized CaCO3 in matrix, the solution was placed in an ultrasonic bath for 45 min and was dried at 60–70°C. The nanocomposite powders were compressed under 20–30 kPa at 170–180°C for 5 min, followed by cooling to room temperature. Table 1 shows the sample notations of used materials.
The notations of samples.

CaCO3: calcium carbonate; PE: polyethylene.
Figure 3 presents the SEM micrograph obtained from the fracture surface of NP5. Good dispersion of nanoparticles in polymer matrix provides evidence for adequate sample fabrication.
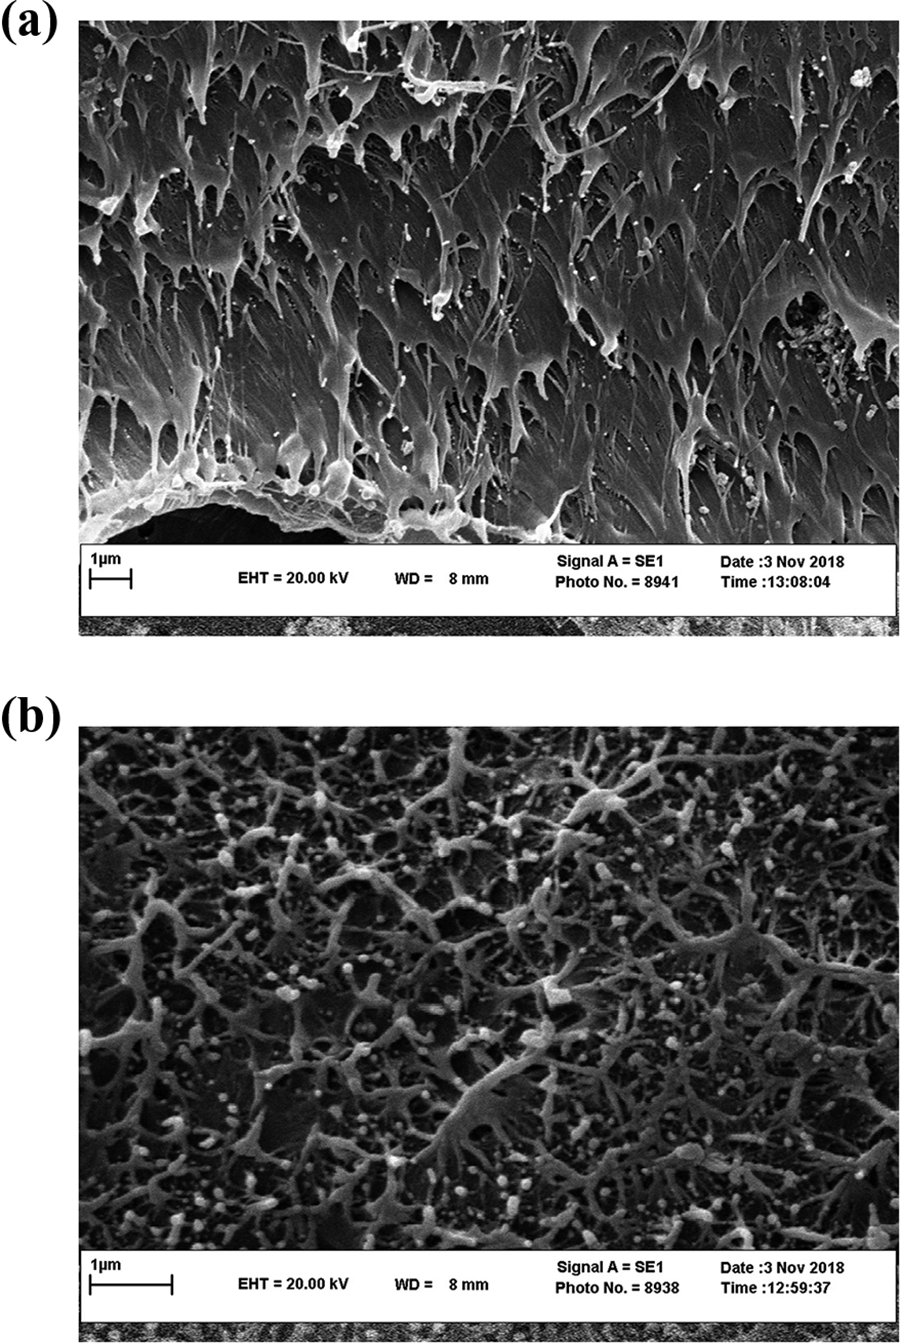
(a) SEM micrographs of fracture surface of NP10 at magnification (×20,000). (b) SEM micrographs of fracture surface of NP10 at magnification (×40,000).
Differential scanning calorimetry
The nonisothermal crystallization of PE and PE/CaCO3 nanocomposites was carried out by DSC60 (Shimadzu, Japan). Temperature calibration was carried out using an indium standard (Tm = 156.6°C and ΔHf = 28.5 J g−1). In order to evaluate the nonisothermal crystallization kinetics, about 2 mg of PE and its nanocomposites were encapsulated into aluminum pans and were initially heated from room temperature up to 200°C at heating rate of 10°C min−1, at this temperature sample was held for 10 min to eliminate the thermal history of the samples. Then, the samples were cooled down to room temperature at four cooling rates of 1, 5, 10, and 15°C min−1. After that, the samples were reheated from room temperature to 200°C at a heating rate of 10°C min−1 to observe the melting behavior of PE and PE/CaCO3 nanocomposites.
Thermogravimetric analysis
The thermogravimetric analysis (TGA) was studied using a thermal analysis system (TGA50, Shimadzu) in air atmosphere. Nonisothermal experiments were performed in the temperature range 25−1000°C at heating rates 10°C min−1. The mass of the samples for each test was about 4 mg.
Transmission electron microscopy
TEM was done by a LEO 912 AB microscope. The nanoparticles of CaCO3 were dispersed in ethanol by using sonication for 30 min, after that dropped onto a copper grid.
Scanning electron microscopy
The fracture surface of nanocomposite was observed by SEM (LEO 1450) at an accelerating voltage of 10 kV. In order to reduce the plastic deformation of PE, breaking the sample in liquid nitrogen was done.
Particle size analyzer
Measurement of the particle size and size distribution of nanosized CaCO3 was taken using a PSA (SALD 2101, Shimadzu).
Results and discussion
Relative crystallinity, X(t), can be determined by using power used data at any crystallization temperature, as follows 9

where X(t), T0 and T∞ are the relative crystallinity index, the onset and endset crystallization temperature, respectively, and
Many models were suggested to evaluate the nonisothermal crystallization of polymers. The crystallization kinetics of polymers can be analyzed by using the Avrami equation which is the most common approach 10 –12

where X(t) is the relative crystallinity at time t, the Zt value is the crystallization rate constant (min−1), and n value is the Avrami exponent. n value depends on the nucleation type and growth process parameters. The Avrami equation is based on the isothermal crystallization system. To study the characterization of nonisothermal process, Jeziorny 13 suggested that the crystallization rate constant was corrected by cooling rate φ

Thus, the Avrami equation can be used to analyze the nonisothermal system.
Also, Ozawa 14 extended the Avrami theory from isothermal crystallization to the nonisothermal case by considering that crystallization occurs at a constant cooling rate. According to Ozawa’s theory, the relative crystallinity Xt at temperature T can be calculated as following equation

where K(T), m, and φ are the function of cooling rate, Ozawa exponent similar to Avrami exponent, the cooling rate, respectively. Finally, a linear graph of
Mo’s group evaluated the crystallization behavior. 15 The nonisothermal crystallization was investigated by combining Avrami and Ozawa equations. In order to determine the relation between t and φ, they suggested that these two equations were connected together, as follows

where

The physical meaning of the rate parameter F(T) refers to the cooling rate to reach a defined degree of crystallization at specific time. According to equation (5), at a given degree of crystallinity, the linear graph of log φ versus log t was plotted to determine slope, a, and intercept, F(T).
Figure 4 shows the nonisothermal crystallization differential scanning calorimetry (DSC) curves of PE, NP5, and NP10 at cooling rates of 10, 20, and 30°C min−1. As seen in these figures, a single crystallization peak could be observed at each cooling rate. Besides, the exothermic peak becomes wider and shifts toward a lower temperature when the weight percentage of CaCO3 nanoparticles in composite and cooling rate increased. Some useful parameters can be read from these curves directly. They are the peak temperature, Tp, the starting crystallization temperature, To, crystallization enthalpy, ΔΗC, also glass transition temperature, Tg, which are listed in Table 2. Tp, Te, To values shift to lower temperature when the cooling rates increase for PE and its nanocomposites. Besides, at each cooling rate, Tp slightly increases with an augmenting the weight percent of CaCO3 nanoparticles. It is implying that the presence of nanoparticles increases the crystallization rate. Moreover, Tg values for HDPE and its nanocomposites have similar trend by increasing the weight percent of nanoparticles. This effect can be related to the interaction of PE chains and nanoparticles and increase in HDPE chains rigidity. 16 When the amount of nanosized CaCO3 in HDPE matrix increases, inter-particle distance decreases, so larger inter-particle distance of NP5 respect to NP10 causes to a weak network. Therefore, NP10 has minimum Tg value compared to NP5 and NP0.
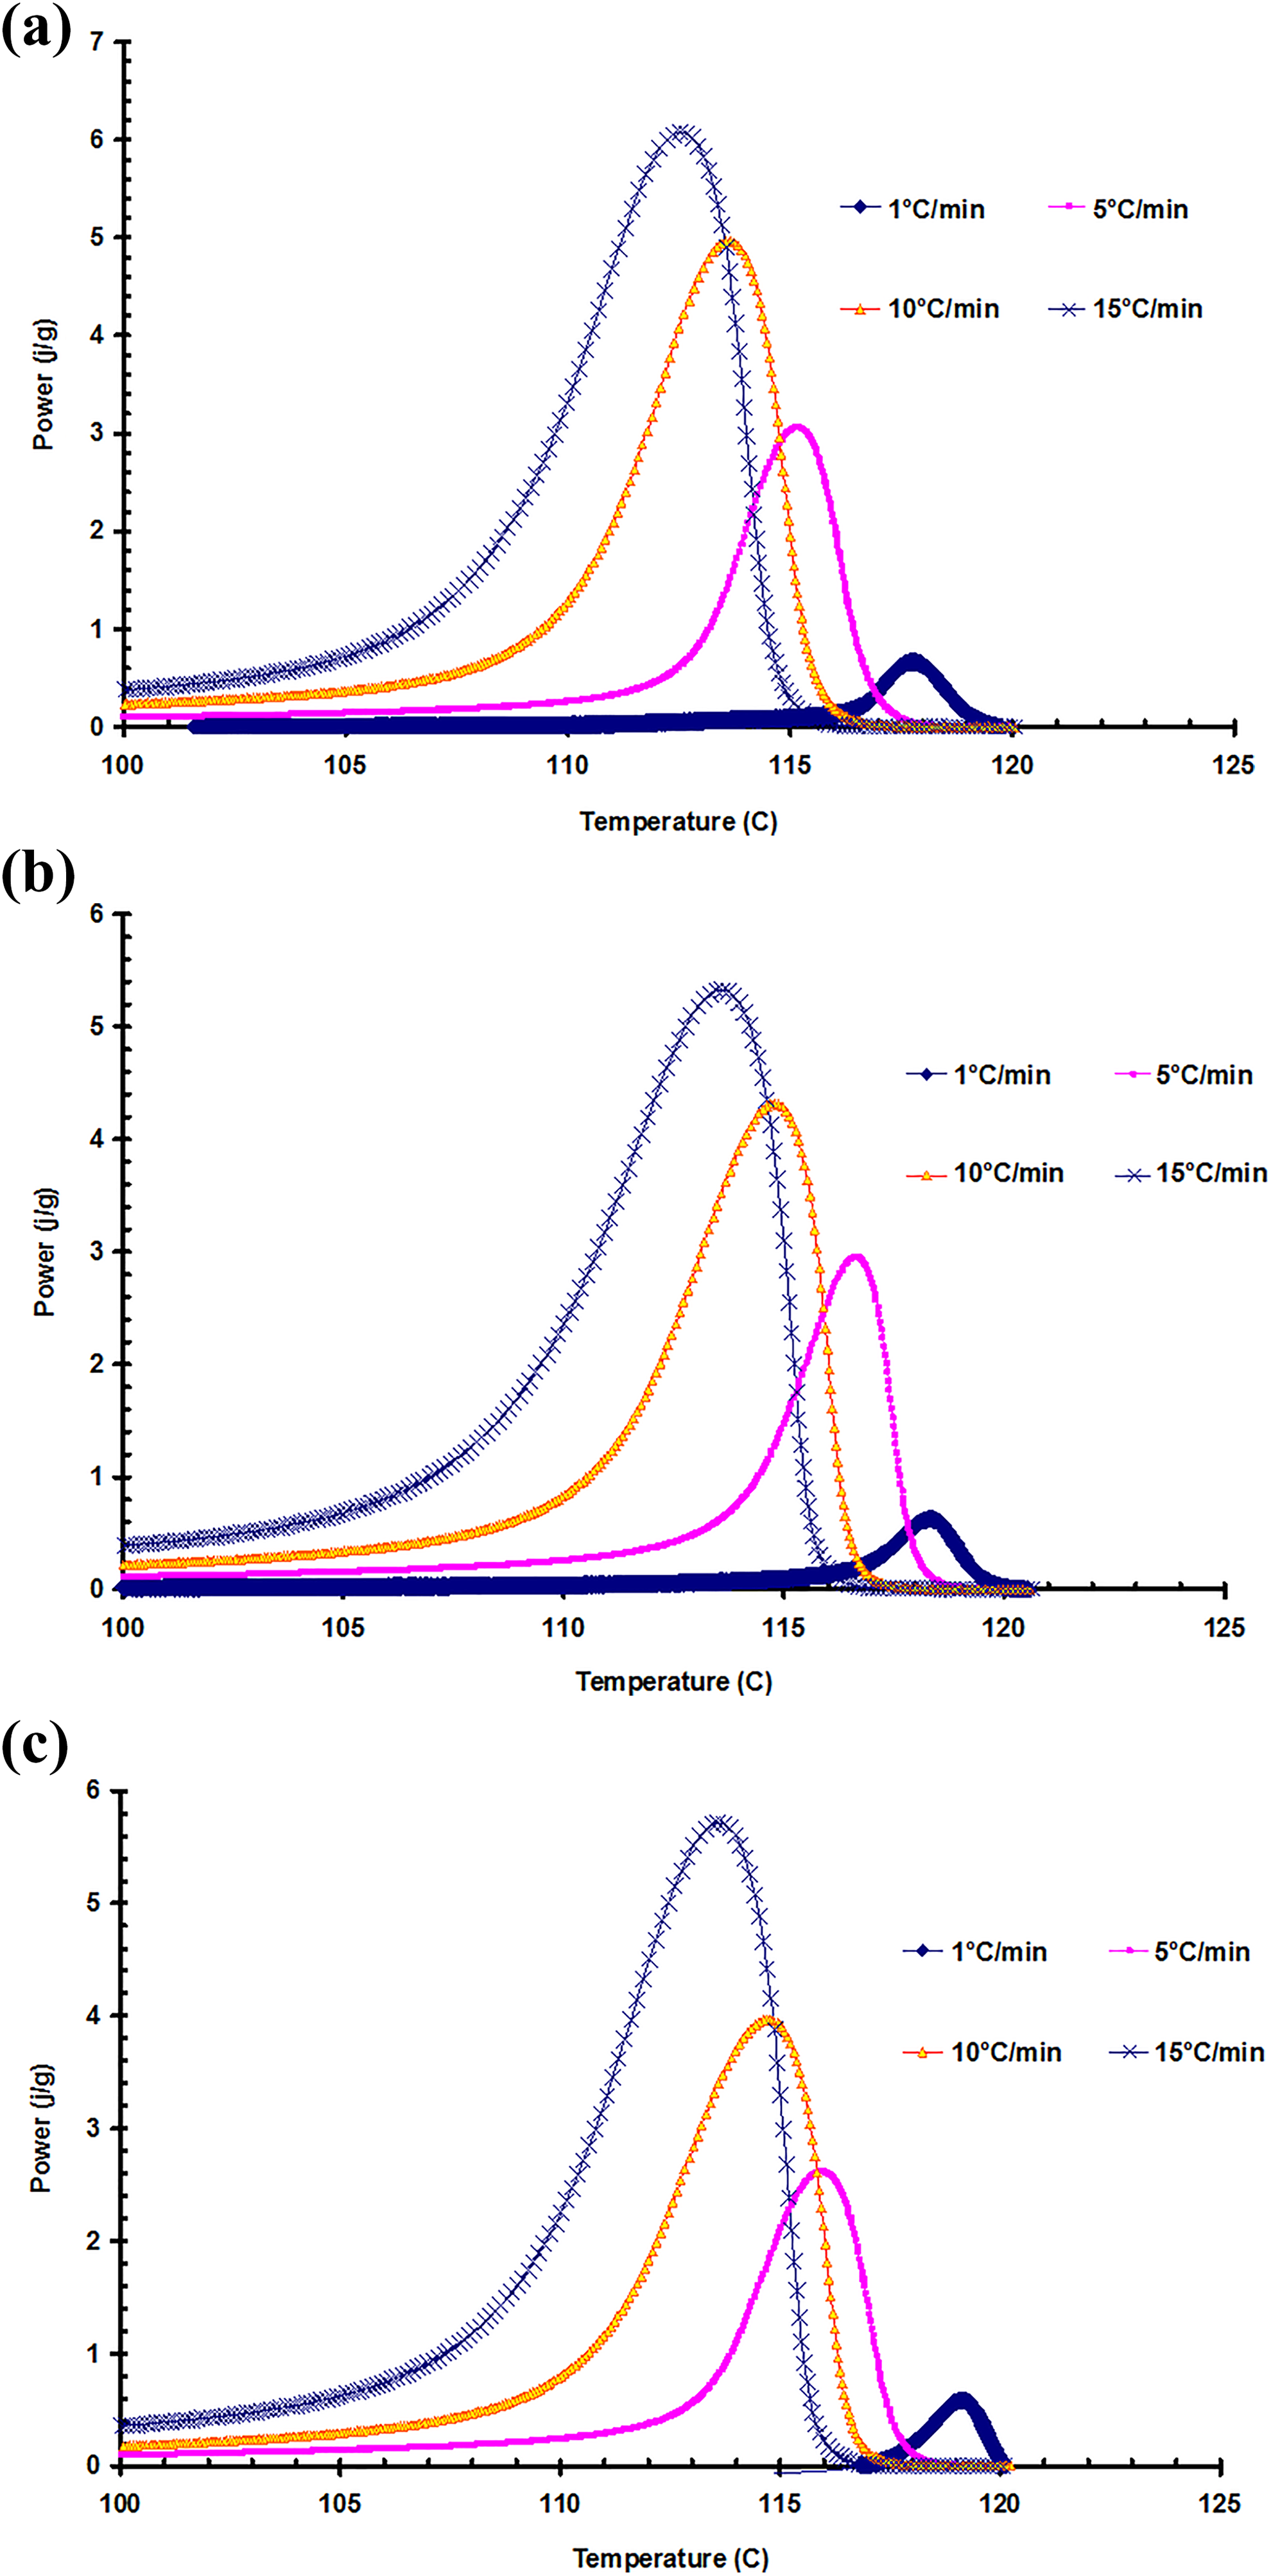
(a) DSC thermograms of nonisothermal crystallization of NP0 at different cooling rate. (b) DSC thermograms of nonisothermal crystallization of NP5 at different cooling rate. (c) DSC thermograms of nonisothermal crystallization of NP10 at different cooling rate.
Values of ΔΗC, To, Te, Tg, and Tm at various cooling rates.
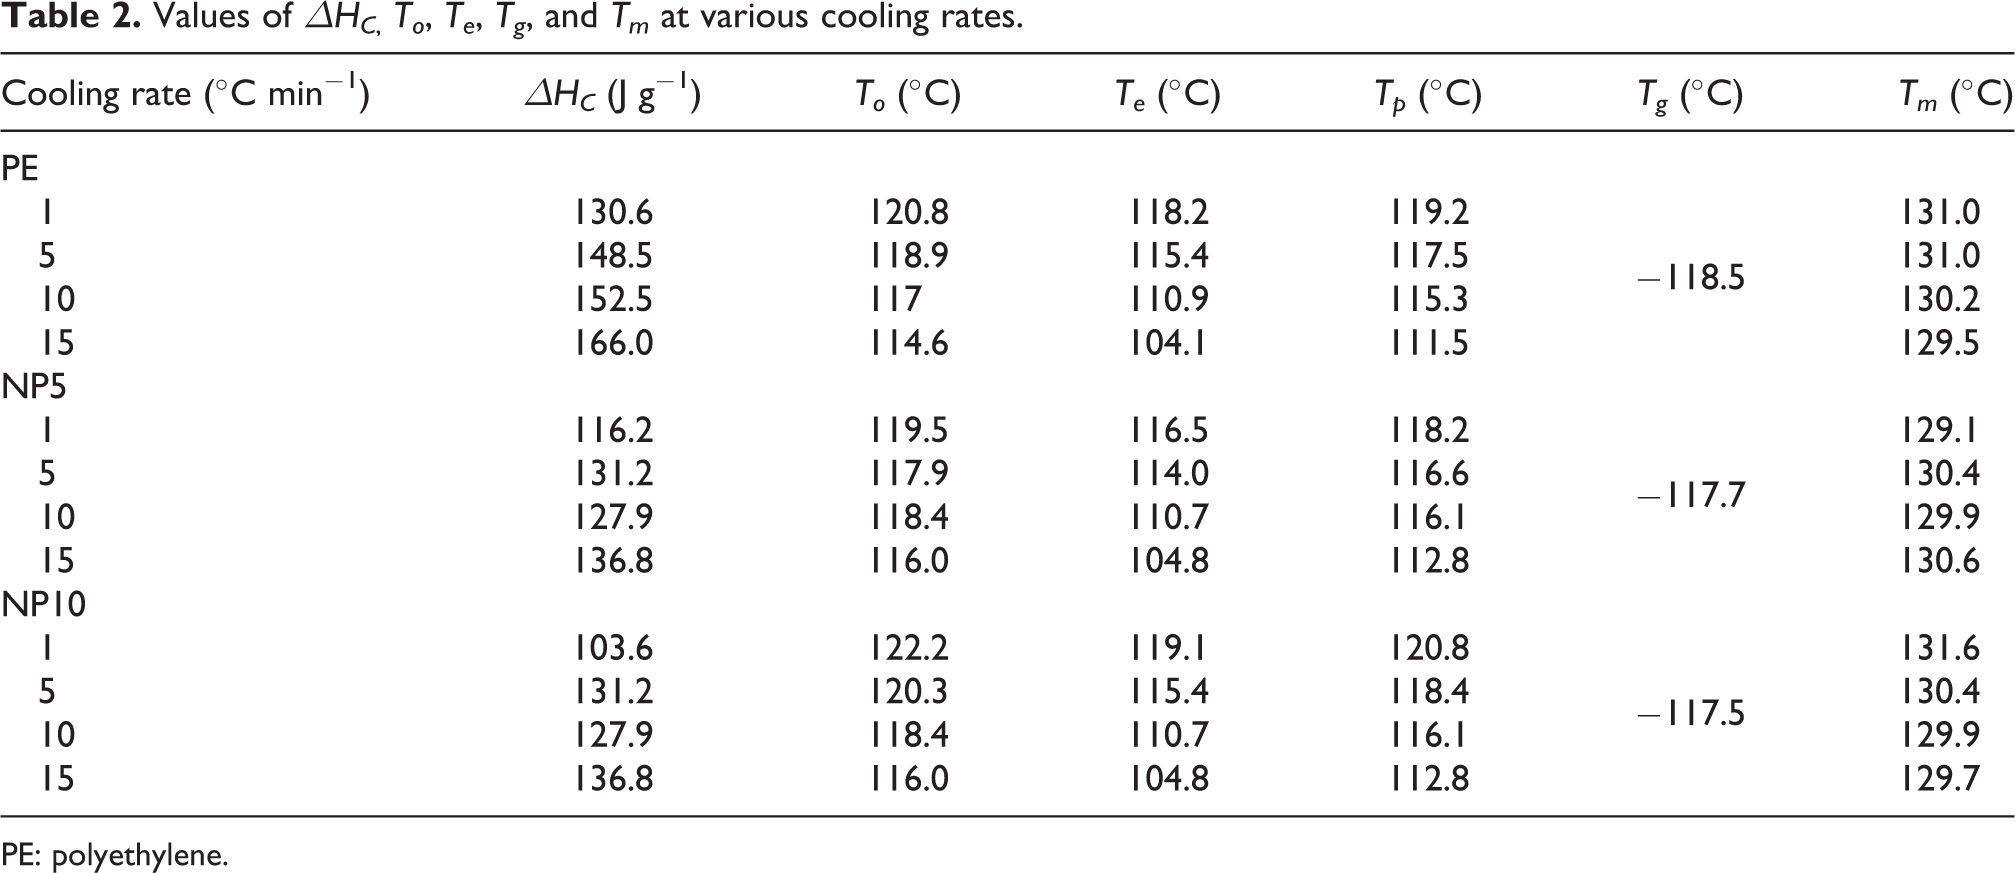
PE: polyethylene.
The ΔΗC shifts to higher values when the cooling rate increases. Also, the percentage of CaCO3 loading in nanocomposites causes to decrease in ΔΗC values. This effect can be related to the imperfect crystallization of nanocomposite compared to pure PE. Therefore, lower energy is needed to complete the crystallization process compared to pure PE.
Figures 5 represents the relative crystallinity of PE and its nanocomposites as a function of temperature at various cooling rates. As it can be seen, the plots of X(t) versus T for PE are similar to its nanocomposites as the sigmoid shape, it is implying that only the lag effect of the cooling rate on crystallization is observed. At the same crystallinity, there is incremental trend for crystallization temperature when the cooling rate increases. The reason for this effect is related to good fluidity and diffusibility of molecular chains at lower cooling rates, so increase in crystallinity at higher temperatures with respect to lower cooling rate is shown. Also, nanosized CaCO3 in PE matrix causes to increase in the crystallinity under higher temperatures with respect to pure PE.

(a) Relative crystallinity index as a function of temperature for NP0 at different cooling rates. (b) Relative crystallinity index as a function of temperature for NP5 at different cooling rates. (c) Relative crystallinity index as a function of temperature for NP10 at different cooling rates.
The relative crystallinity versus time at different cooling rates for PE, NP5, and NP10 are shown in Figures 6. It can be observed, the duration of the crystallization process decreases when the cooling rate increases. NP5 and NP10 exhibit a similar behavior to pure PE.
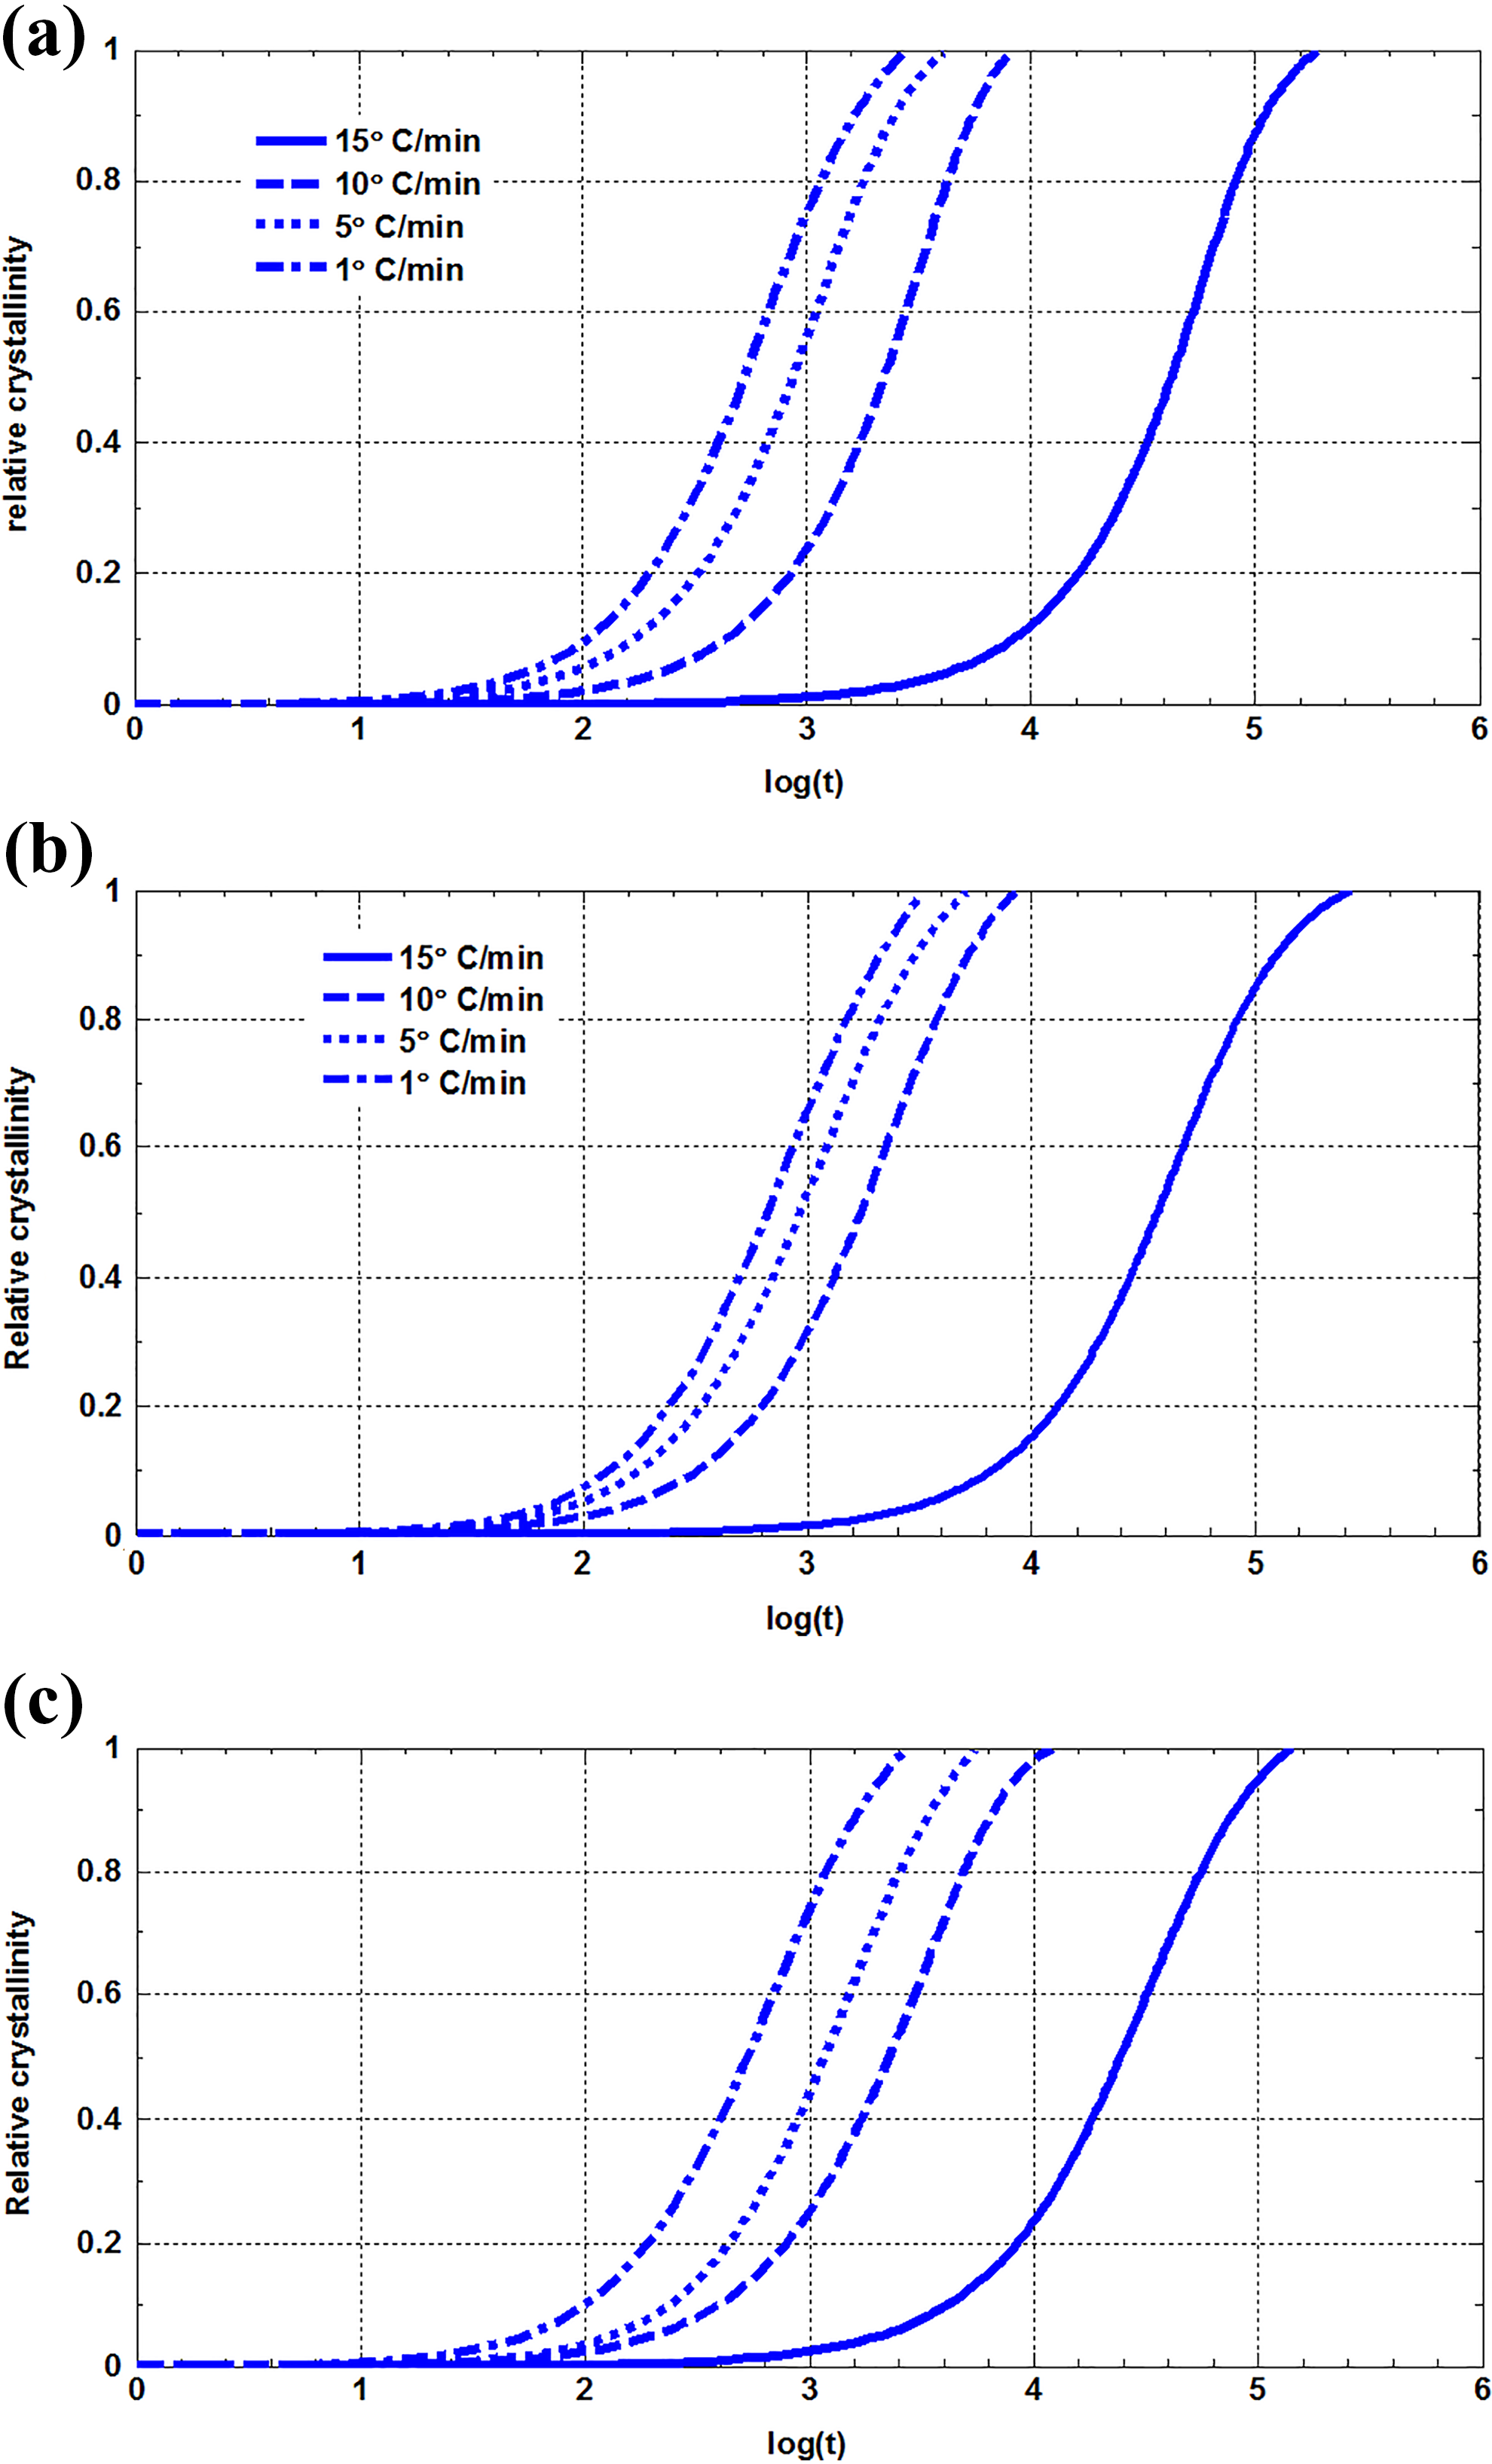
(a) Relative crystallinity as a function of time for NP0 crystallized nonisothermally at different cooling rate. (b) Relative crystallinity as a function of time for NP5 crystallized nonisothermally at different cooling rate. (c) Relative crystallinity as a function of time for NP10 crystallized nonisothermally at different cooling rate.
Based on Avrami equation, the plots of ln(−ln(1 − X)) as a function of ln(t) are shown in Figure 7. Zc value and Avrami exponent, n, are obtained from the intercept and slope of a straight line, which are fitted in the Avrami plot. The values of Zc, n, and r2 parameters signify the quality of the fitting which are listed in Table 3. It is shown that all n values are in a limited range of 2.6–2.8. So, the crystallization mode of PE does not change with increasing the nanoparticles. Also, it is indicated that crystallization occurs at the three-dimensional growth for all samples. Based on the values of the r2 parameter, the Avrami model is suitable model to describe the nonisothermal crystallization of PE and its nanocomposites.
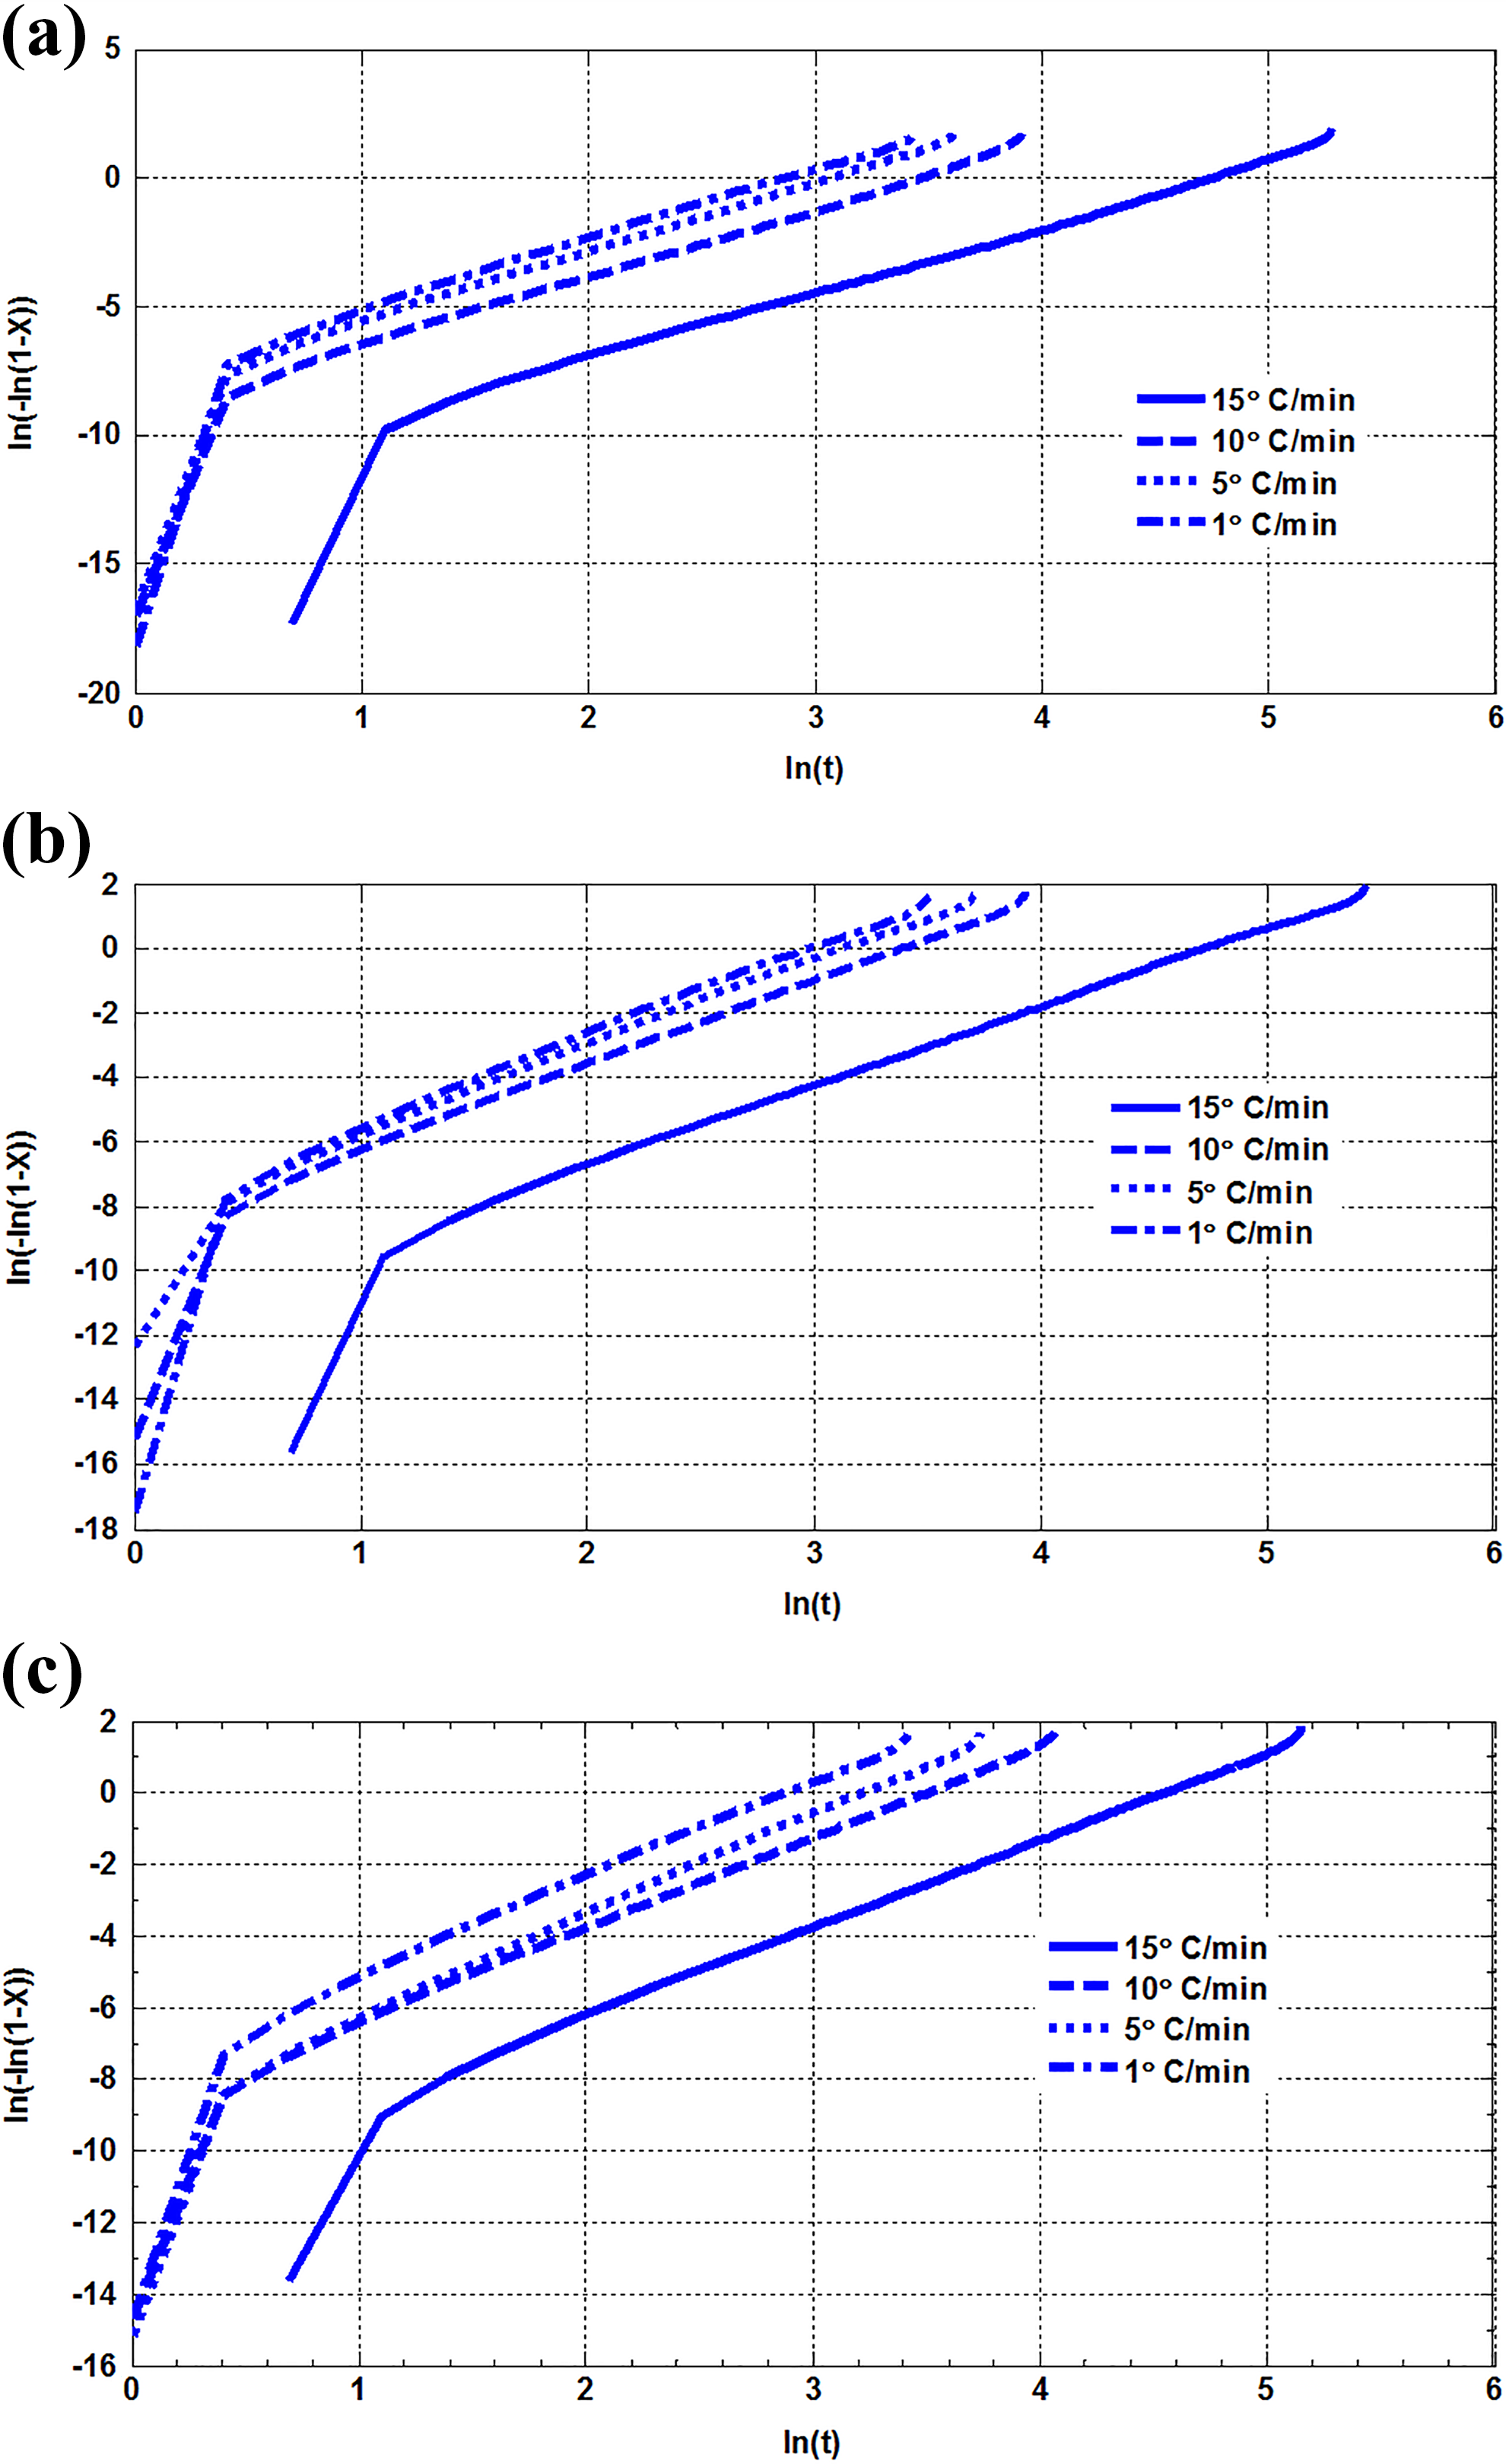
(a) ln(−ln(1 − Xt)) versus ln(t) for NP0 at various cooling rate. (b) ln(−ln(1 − Xt)) versus ln(t) for NP5 at various cooling rate. (c) ln(−ln(1 − Xt)) versus ln(t) for NP10 at various cooling rate.
Values of ln(Zt), Zc, n, and activation energy of crystallization at various cooling rate for PE and its nanocomposites.

PE: polyethylene.
The Ozawa equation is also frequently used to evaluate nonisothermal crystallization kinetics. According to fail to fit a linear plot when ln(ln(1 − X)) is plotted against ln(ϕ), so the Ozawa equation is not suitable to describe nonisothermal crystallization of PE, NP5, and NP10.
In order to determine the crystallization kinetic of polymers, Mo suggested that the double logarithm plot of cooling rate versus crystallization time at different relative crystallinity, X, was drawn. Then, F(T) and a could be determined from the slope and intercept of linear plots. Figure 8 presents the plots of ln(ϕ) versus ln(t) for PE and its nanocomposites. The values of F(T) and a are listed in Table 4 for PE, NP5, and NP10. Based on Figure 8, all plots gives a straight line. So, this approach is applicable to evaluate the crystallization behavior of PE and its nanocomposites. At a certain relative crystallinity, a high value of F(T) means a high cooling rate is needed to reach this Xt in a unit time, which attributes there is difficulty for crystallization of PE. It is found that the F(T) value increases slightly with reinforcement of nanoparticles in matrix. This means that the crystallization of PE chains becomes difficult in the presence of nanoparticles. The values of a for all samples are constant at different crystallinity degrees.

Plots of ln(ϕ) versus ln(t) for NP0, NP5, and NP10 samples.
Values of F(T) and a for NP0, NP5, and NP10.

PE: polyethylene.
Kissinger proposed a method to calculate activation energy in nonisothermal crystallization 17

where R is the universal gas constant and the ΔE is the activation energy required for the transportation molecules from a molten state to growth of crystal surfaces. Figure 9 shows that the plots of
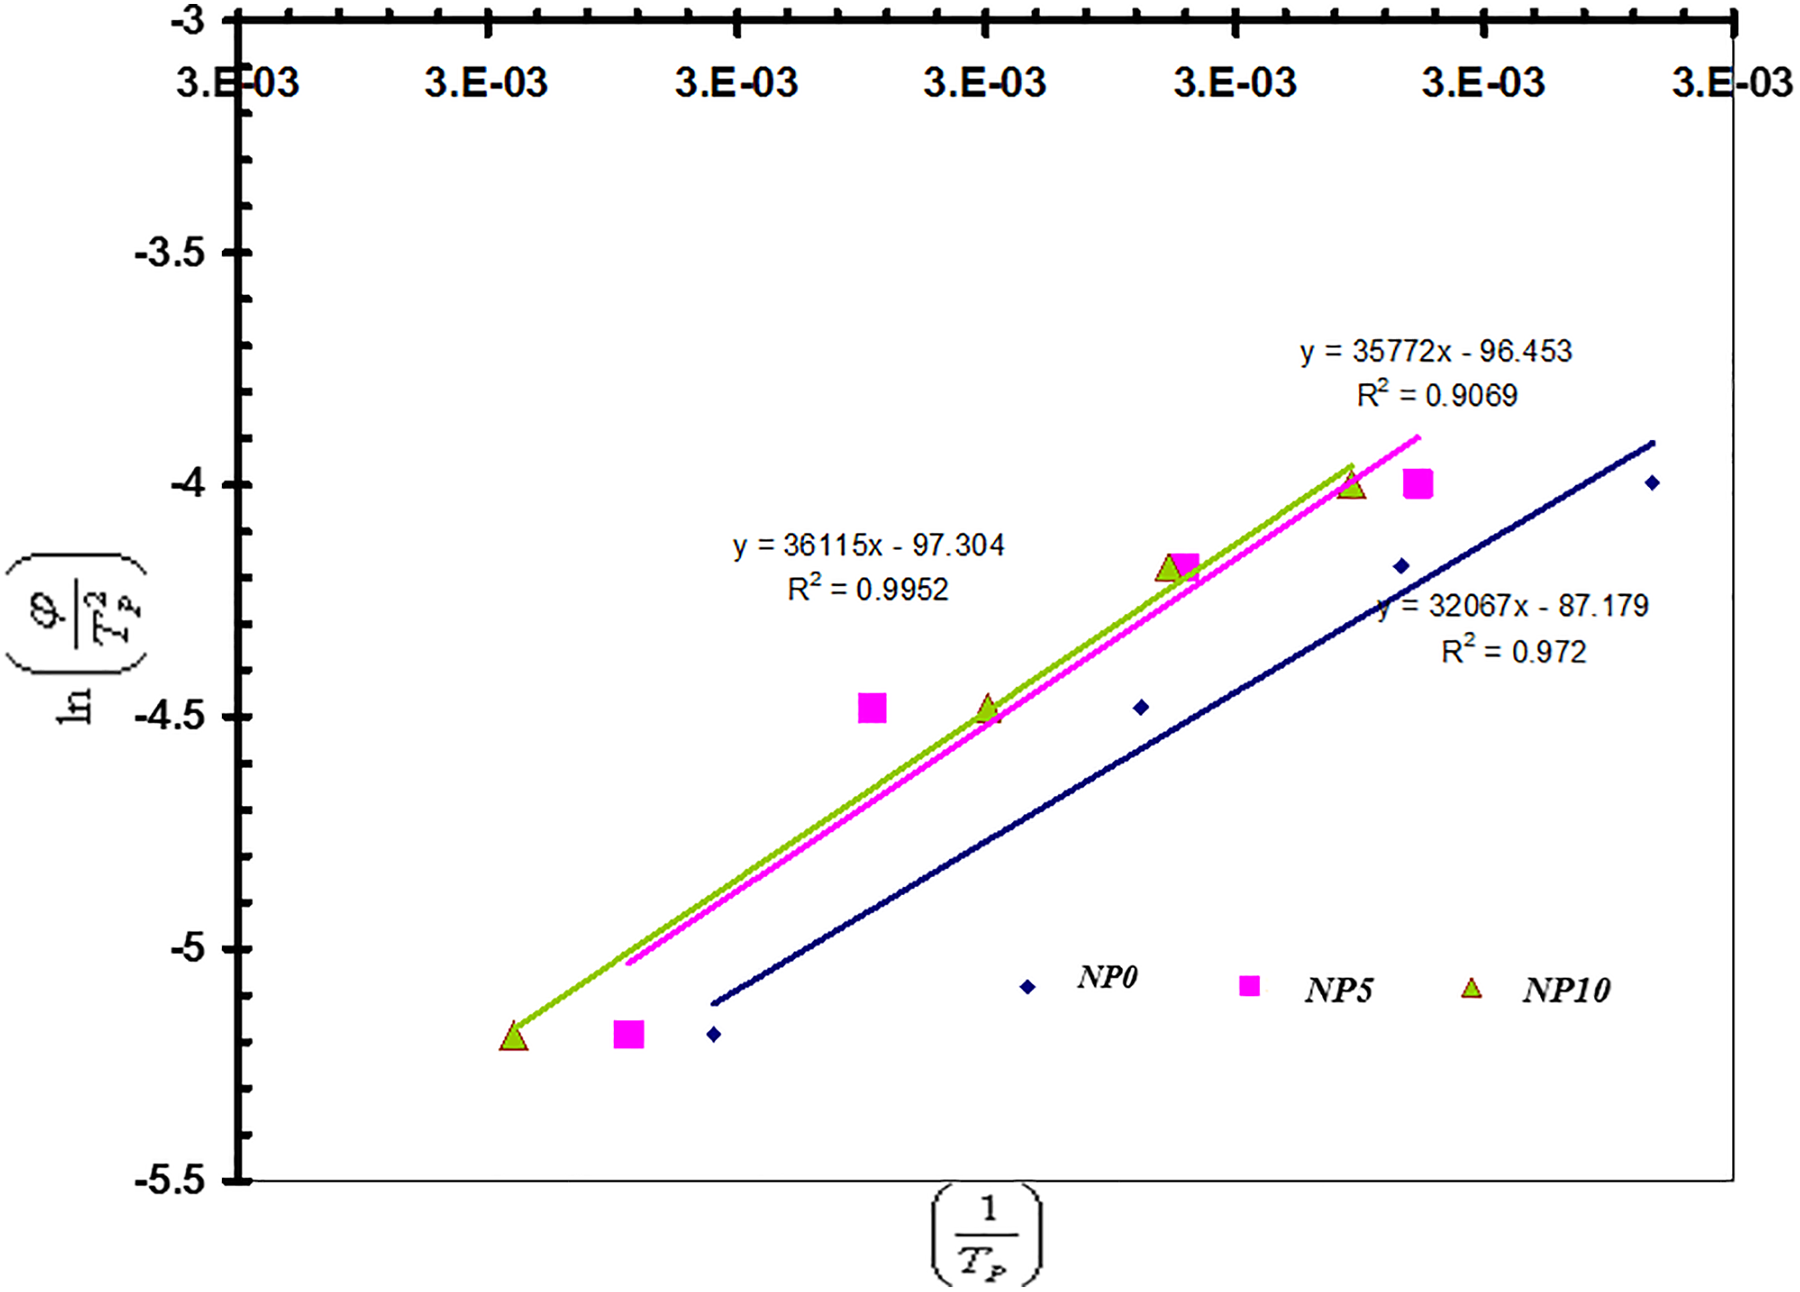
Plots of
The effect of CaCO3 nanoparticles on the thermal stability of nanocomposites is studied by means of TGA in air atmosphere. The weight loss (TG) and the derivative thermogravimetric profiles (DTG) for PE and its nanocomposites are shown in Figure 10. The incremental trend of decomposition temperature for PE is seen when the weight percentage of CaCO3 added to PE matrix, indicating that the restriction flexibility of PE chains in the presence of CaCO3 nanoparticles, and strong polymer network improved the thermal stability of PE. According to DTG profiles of all samples, two peaks are observed in the DTG curves at heating rate of 10°C min−1. The presence of CaCO3 nanoparticles causes to increase the amount of degradation during the second stage.

Weight loss and DTG curves of PE and its nanocomposites at heating rate of 10°C min−1.
The values of onset decomposition temperature (To), peak decomposition temperature at the maximum weight loss rate from DTG curves (Tp), endset decomposition temperature (Te), and residual mass at 600°C (Re) for PE and its nanocomposites are summarized in Table 5. It can be seen, CaCO3 nanoparticles decreases the flexibility of PE matrix, it is concluded that high temperature needed to overcome the interaction between polymer chains and nanoparticle due to strong network, so the thermal stability of PE matrix increases with increase in weight percentage of nanoparticles.
Parameters of the TGA and DTG curves of pure PE and its nanocomposites.

TGA: thermogravimetric analysis; DTG: differential thermogravimetry; PE: polyethylene.
The tensile properties of PE and its nanocomposites are measured at different temperatures, that is, 30°C, 60°C and 90°C, and summarized in Figures 11 and 12. It is found that the elastic modulus and yield stress of all samples reduce when the temperature increases. It is related to increase in mobility of PE chains and decrease in interaction force between PE chains. Therefore, yield stress and elastic modulus of all samples reduce when the temperature increases.
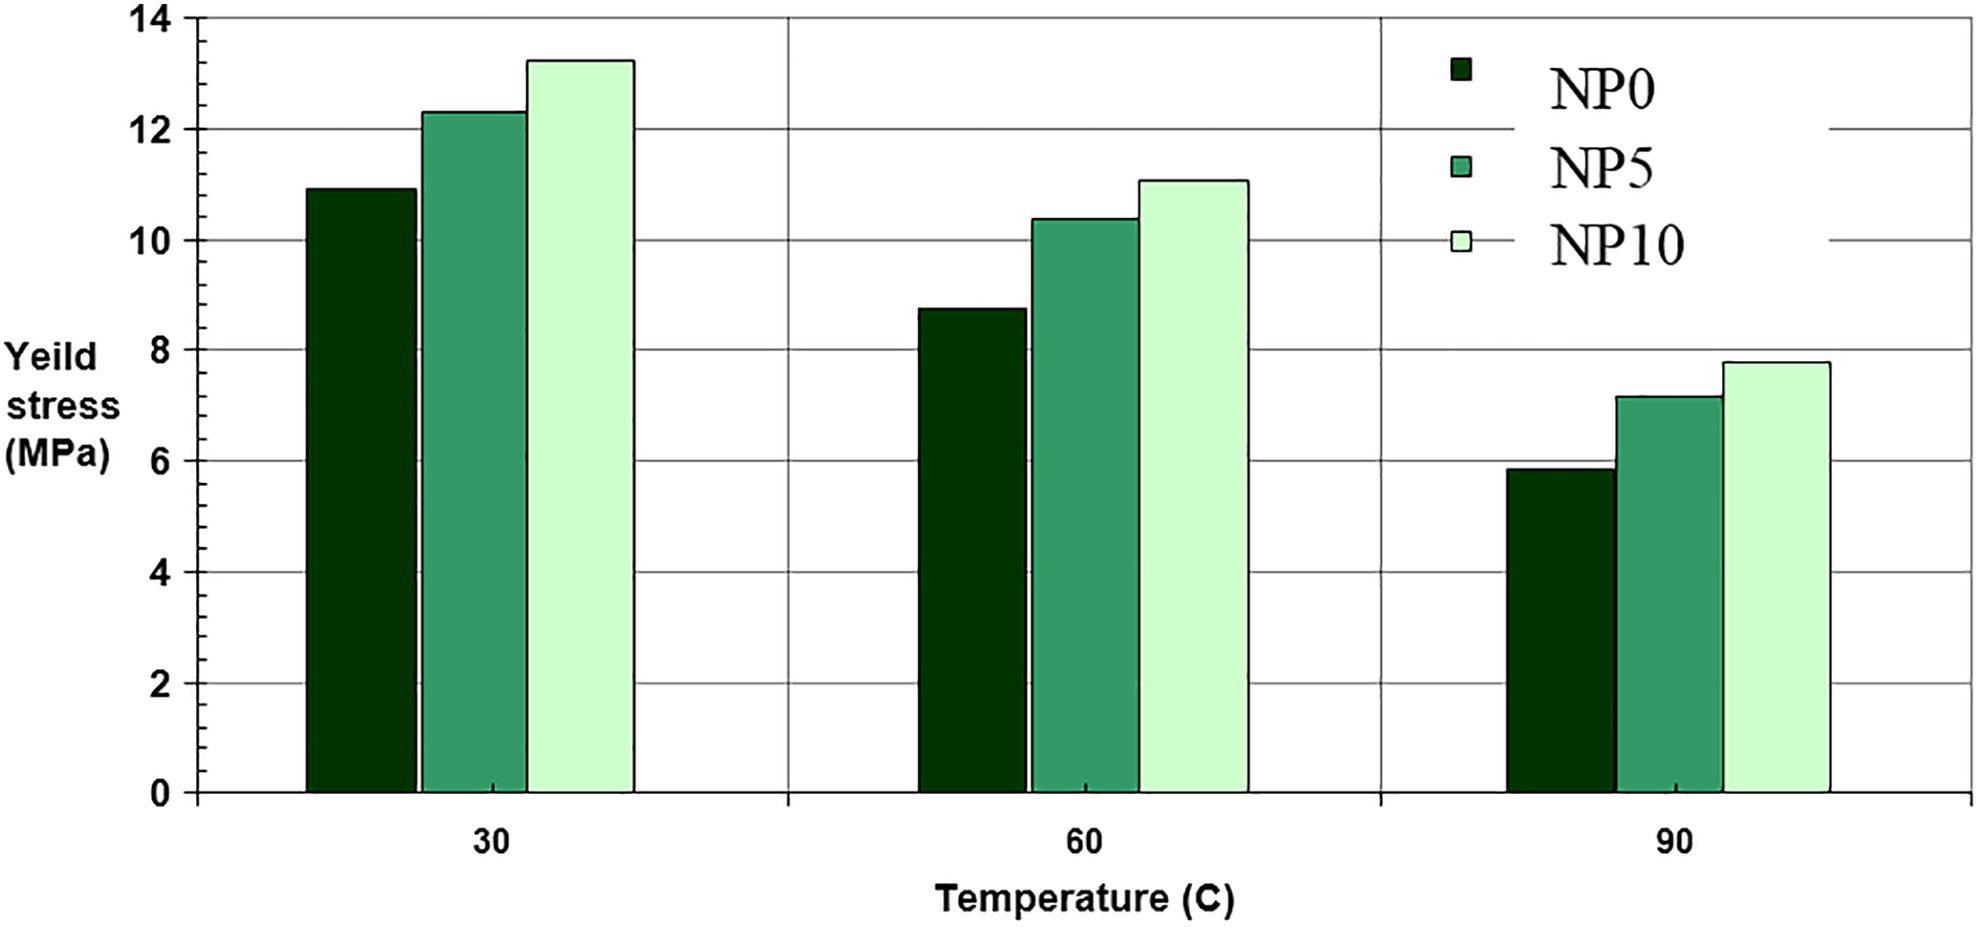
Yield stress of PE and its nanocomposites as a function of temperature.

Variation of elastic modulus at different temperature versus weight percentage of CaCO3 nanoparticles.
Moreover, with augmenting nanoparticles in matrix, elastic modulus and yield stress of composite increase compared to pure PE at all temperatures. This behavior could be explained by the immobility of PE chains, stiff network of polymer and nanoparticles. Clearly, the yield stress increases with increasing CaCO3 nanoparticles content. It is probably due to the good interfacial adhesion between CaCO3 nanoparticles and PE matrix.
Conclusions
Thermal stability of PE in the presence of CaCO3 nanoparticles is studied by using DSC, TGA, and thermomechanical analysis. Also, the structure of CaCO3/PE nanocomposites is investigated by using SEM. The results of DSC showed that the incorporation of nanoparticles to PE matrix caused to increase in the crystallization temperature as nucleation site of nanoparticles. Besides, the glass transition temperature enhances when the weight percentage of nanosized CaCO3 increases. This effect can be related to the reduction mobility of PE chains. The Avrami and Mo models are found to describe the nonisothermal crystallization data of PE and its nanocomposites. The Ozawa equation failed to provide suitable description of the crystallization kinetics of PE, NP5, and NP10. The crystallization activation energy increases when the loading of nanosized CaCO3 in PE matrix increases. TGA data reveal that CaCO3 nanoparticles cause to delay the PE decomposition during thermal oxidation. PE has minimum value of yield stress and young modulus respect to NP5 and NP10 at different temperatures.
Footnotes
Declaration of conflicting interests
The author(s) declared no potential conflicts of interest with respect to the research, authorship, and/or publication of this article.
Funding
The author(s) received no financial support for the research, authorship, and/or publication of this article.