
Abstract
Considering aeronautics requirements, academies and industries are developing matrixes and reinforcements with higher mechanical performance. The same occurs with the process where new studies focus on obtaining composites with suitable matrix/reinforcement interface. The use of epoxy resin and carbon fiber with high mechanical performance does not guarantee a composite with high mechanical properties, considering imperfections and void formation along the laminate in case of inappropriate processing parameters. The aim of this article was to analyze and quantify the mechanical behavior of polymer composite reinforced with continuous fibers using finite element methodology and postprocessing software simulation. In addition, the classical laminate theory and finite elements were used to simulate flexural and tensile tests of composite specimens. Simulation results were compared with experimental test results using a carbon fiber noncrimp fabric quadriaxial/epoxy resin composite processed by resin transfer molding. Although void volume fraction for structural materials presenting results under aeronautics requirements regarding of 2%, imperfections like lack of resin and impregnation discontinuity showed an influence in tensile and flexural experimental results. Experimental mechanical behavior decreased 10% of strength, in comparison with simulation results due to imperfection on impregnation measured by C-Scan map. Improvement in processing procedures could able to provide greater impregnation continuity, reducing defect formation and ensuring better matrix/reinforcement interface. As a final conclusion, the process plays a role as important as the characteristics of reinforcement and matrix and, consequently, the mechanical properties.
Introduction
To produce quadriaxial laminate, laying up unidirectional fibers in different orientation is a waste of time and can make errors when fibers are stacked in distinct angles. In order to optimize the stacked fiber direction and save time in laying up process getting higher characteristics of composite reinforcement, a stitched fabric has been introduced in resin transfer molding (RTM) manufacturing process. This type of fabric is known as noncrimp fabric (NCF). 1 –5
In composite, matrix is responsible for the reinforcement union as well as the distribution of applied tension through the interface. Epoxy resin has great prominence for aeronautics application due to its higher elasticity modulus and tensile strength compared with several polymeric matrices. It has yet the ability to get low viscosity with an increase in temperature, which is an advantage for process in the RTM, for example. 3 –10
In aerospace industry, RTM is one among many new processing developments, but at the same time, it is one of the most promising. The cost advantage can enable the aircraft industries to use some specific features of advanced composites such as weight saving potential, corrosion resistance, and high fatigue strength. The technique is based on resin injection which has shown a significant increase to produce light and efficient structures with a very high level of mechanical performance and safety in aeronautical field. 2,8,11,12
The preform complete impregnation must be guaranteed by the process. Inappropriate impregnation of fibers can produce, as a consequence, dry spot areas with missing fiber/matrix adhesion between layers. The imperfections like dry spots make the surface rough and irregular and decrease the mechanical resistance. 13 –15
Low fraction of voids and defects that eventually are formed in polymer composites during the process are important factors to obtain a material with high performance. Porosity occurs during processing, which is a consequence of entrapping bubbles, humidity, or inappropriate parameter processing, such as high viscosity, cure temperature, and cure time out of adjustment. This fact evidences the importance of an adjusted processing to obtain a composite with a high quality of interaction between reinforcement and matrix without defects. Figure 1 shows a superficial porosity present in a carbon fiber composite. 13,16 –18

Porosity in carbon fiber composites.
Together with experimental tests, mechanical and thermal behavior studies by numerical modeling are an ally to extend the experimental comprehension of the materials. A three-dimensional simulation can predict material properties, allowing for the composite processing evaluation and the necessity of improvement modifications, for product suitability. For a composite simulation close to reality, an accurate representation of the reinforcement and matrix structure is required; only then, it will be possible to represent the complexity behavior of these materials. To contribute to the use of complex three-dimensional simulations, industry and researchers have been using software in base of finite element methodology (FEM). 19 –21
FEM is a numerical procedure determined to troubleshooters, subdivided geometrically into small portions in order to evaluate the outline and to represent the continued dominance of the problem. 22,23 The use of the FEM and postprocessing (FEMAP™) software became feasible to simulate polymer composites reinforced with fibrous material, since it contemplates the classical laminate theory (CLT) used for geometry formulation and representation, which simplifies the implementation of outline calculations. 22 –24
Even using high-quality materials, problems occurring during the process can damage the composite mechanical properties, which prevents its uses in structural application. In composites with defects like voids, dry, wide, and twisted fibers act as stress concentrators. Therefore, if partial impregnation occurs in the vicinity of a connecting zone among elements, it can cause a discontinuity in integration with a consequent strength loss. 15,25 –27
The objective of this article was to quantify the absolute mechanical behavior of a composite (NCF carbon fiber/epoxy resin) using the CLT and FEMAP software to simulate flexural and tensile tests. In addition, simulation results were compared with experimental flexural and tensile test results of the composite processed by RTM. To verify its processing effectiveness, porosity and impregnation measurements were taken along the composites’ specimen.
Materials and methods
CLT
The CLT was used to evaluate the elastic behavior of the quadriaxial orthotropic carbon NCF in order to describe the mechanical behavior of each single layer, using the following parameters: Ef1, Ef2, Gf12, ν12, Em, Gm, ν m , and t, which is the total thickness of the used laminate. The Hooke’s law defines the stress/strain relation that is given by Equation (1) 28

whereby [ϭ] is the stress tensor, and [Qr] and [Sr] are reduced stiffness matrixes (equation (2))

Equation (3) is a matrix or an equation of transformation that connects the stress in the coordinate system of material with the strain in a particular coordinate system that matches with the direction of the load, and Θ is the angle that determines the layer’s orientation relative to the main coordinate (equation (4)) 29 –31


Process via RTM
The laminate was processed using eight layers of carbon NCF (IM7-12 k) stitched by polyester yarn in the following symmetrical sequence: [90°/−45°/0°/45°] with a total thickness of 3 mm. The approximate fiber fraction volume used was 61% to produce a material for structural application.
Epoxy resin PRISM® EP2400 from Cytec (Wrexham, UK) was used, injected at 120 m°C for a suitable viscosity of resin (90 mPa·s). The pressure of 2.5 bar (0.25 MPa) and vacuum of 500 mbar (0.05 MPa) were applied. The cure process was performed at 180°C for 120 min; after cooling process, the laminate was extracted from the mold. The epoxy resin and NCF data, presented in Table 1, were important to use in the laminate theory calculation. 32
Mechanical properties of the reinforcement and the matrix.
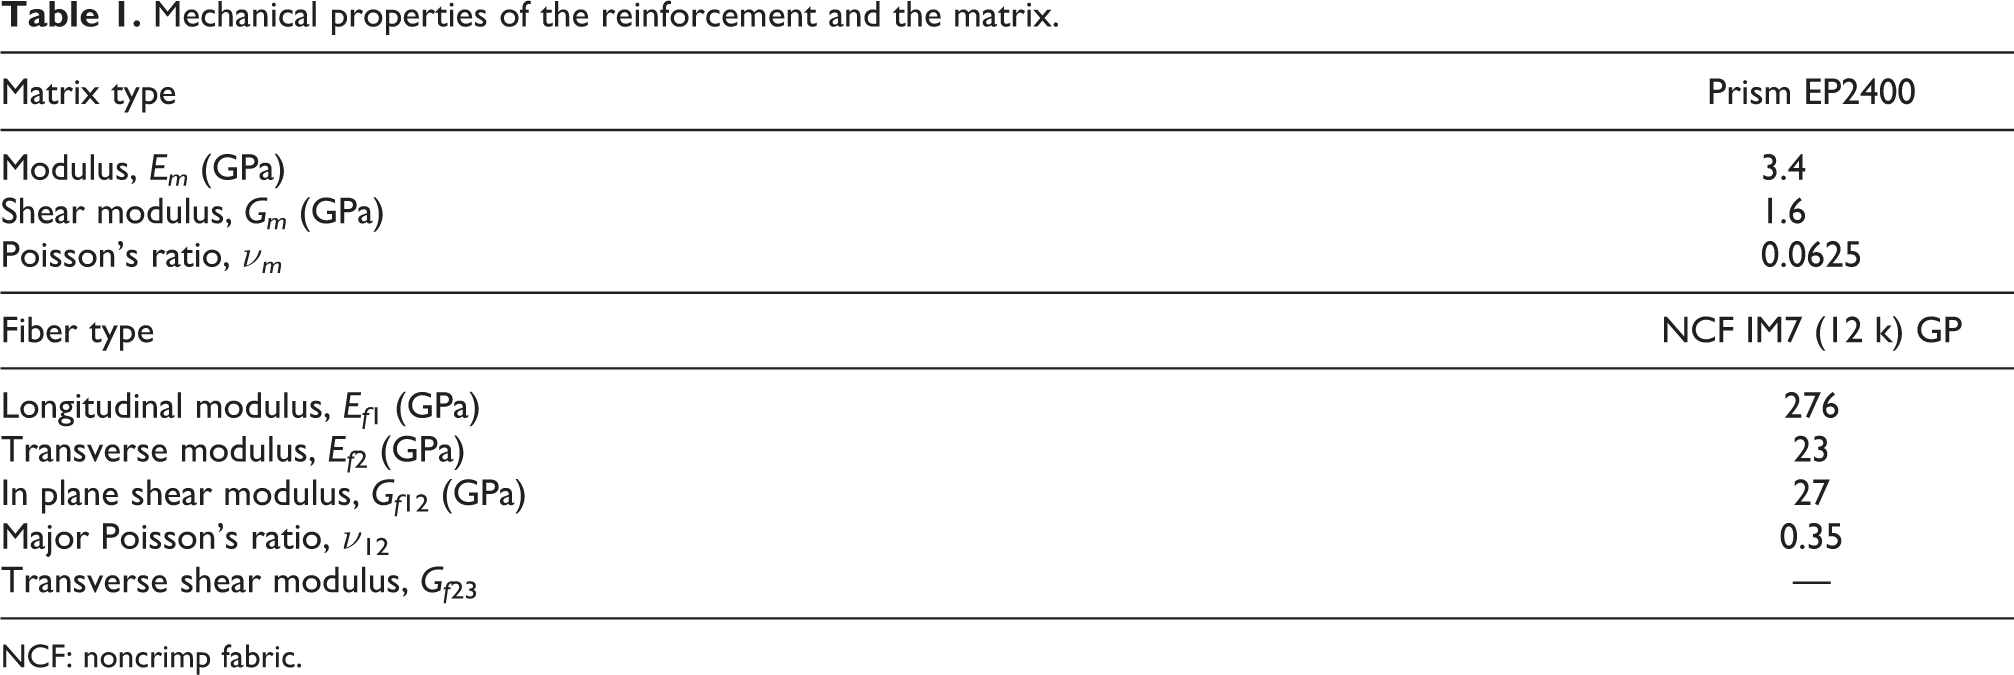
NCF: noncrimp fabric.
Programming via FEMAP
In FEMAP software, a three-dimensional structure was designed to simulate a plate shape of composite in each single test dimension, illustrated in Figure 2. The distance between interaction points was 1 mm for the three directions. The load applied, load direction, and support points were submitted according to each test and each American Society for Testing and Materials (ASTM) standard. CLT results were uploaded to the software, in particular, the young’s modulus E1 and E2, shear modulus G12, and the major Poisson’s ratio ν12, calculated for this specific composite. The final step was to insert the load and simulate the flexural and tensile tests. 32
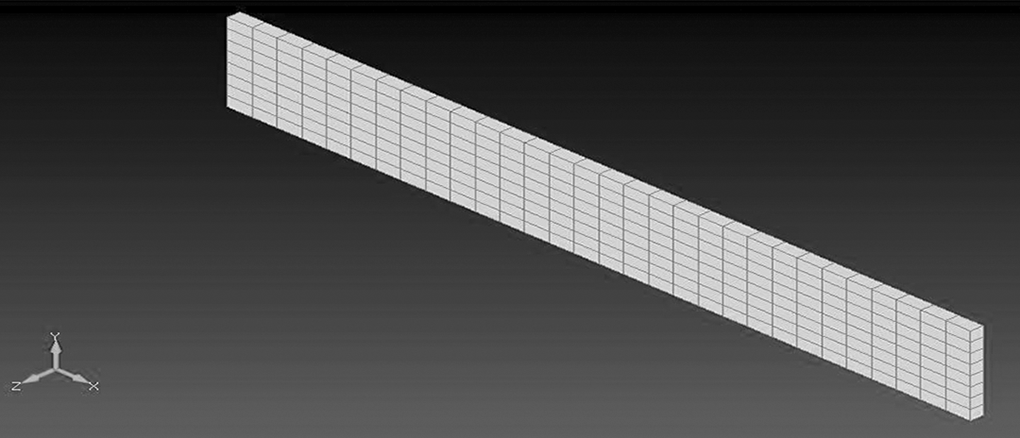
Composite (NCF/epoxy resin) designed by FEMAP. NCF: noncrimp fabric; FEMAP: finite element methodology and postprocessing.
The steering coordinates indicate the following arrangement: x – sample length; y – sample width; and z – sample thickness, which in this case was 3 mm.
Ultrasonic inspection microscopy
Scanning acoustic microscopy (SAM) test for NCF composite was used to evaluate impregnation and to measure imperfections along the experimental specimen, generated by composite processing. The test was performed using the ultrasonic wave pulse-echo mode by SAM system, model PSS-600, from MATEC® obtaining an A-Scan graphic and C-Scan map. A concave transducer with a frequency of 10 MHz was used, and the data were analyzed by using I-View software, developed by MATEC®. Ultrasonic inspection resulted in a two-dimensional image of wave return, C-Scan map. Each image was interpolated in an interactive three-dimensional surface construction, by using ImageJ software, for impregnation discontinuity analysis along the laminate.
Void fraction analysis
To determine void volume fraction, matrix was digested by sulfuric acid, according to ASTM 3171 (Proceed B). 33 Resulted fibers from the digestion process were removed from the acid solution using hydrogen peroxide and, finally, washed with distilled water. For this test, it was possible to know the resin and fibers volume fraction, through Equation (5). Void volume fraction was obtained by the difference between the fiber and resin fraction.

where, Vv, void volume fraction (%); mf, final mass of the fiber (g); mi, initial composite mass (g); ρc, composite specific mass (g cm−3); ρr, reinforcement specific mass (g cm−3); and ρm, matrix specific mass (g cm−3).
Tensile and flexural tests
Specimen for tensile test was prepared according to ASTM D 3039/D 3039M 34 (Figure 3). The same dimension and specifications of standard were used for the FEMAP tensile simulation. The tests were performed at Shimadzu AG-X, with a load of 10 kN.

Specimen dimensions for the tensile test.
The three-point bending model was prepared according to the specification from ASTM D790, 35 with a length of 48 mm (using the reason 16:1 between the length and the thickness). The test forward speed was 1.30 mm min−1.
Results and discussion
The CLT results, presented in Table 2, were important to upload the reinforcement and matrix data in FEMAP software to simulate the composite with real mechanical properties. FEMAP software uses unit in MPa for input and output data; therefore, all units used were in MPa.
Laminate theory results.

A three-dimensional model designed in FEMAP was used to upload the composite behavior. Both composite design specimens were done according to the ASTM. Figure 4 shows the tensile test in which the specimens were fixed on one side and the load was applied on the other side, simulating the real test. The ultimate tensile strength was equal to 859 MPa, detected in the net area of specimen according to the scale presented in Figure 4(b).

Tensile simulation in FEMAP: (a) specimen; (b) stress level scale along the specimen (MPa). FEMAP: finite element methodology and postprocessing.
Figure 5 shows flexural strength simulation resulted from FEMAP software, test based on ASTM D790. The strength value of 842 MPa was indicated by the specimen net area of fracture. Figure 5(b) represents the stress level scale along the specimen, revealing the stress behavior, where maximum stress was found in net area. In specimen edges, it was observed a negative value of the applied load, which is associated with the opposite load applied in the net area due to the three-point flexural test configuration.
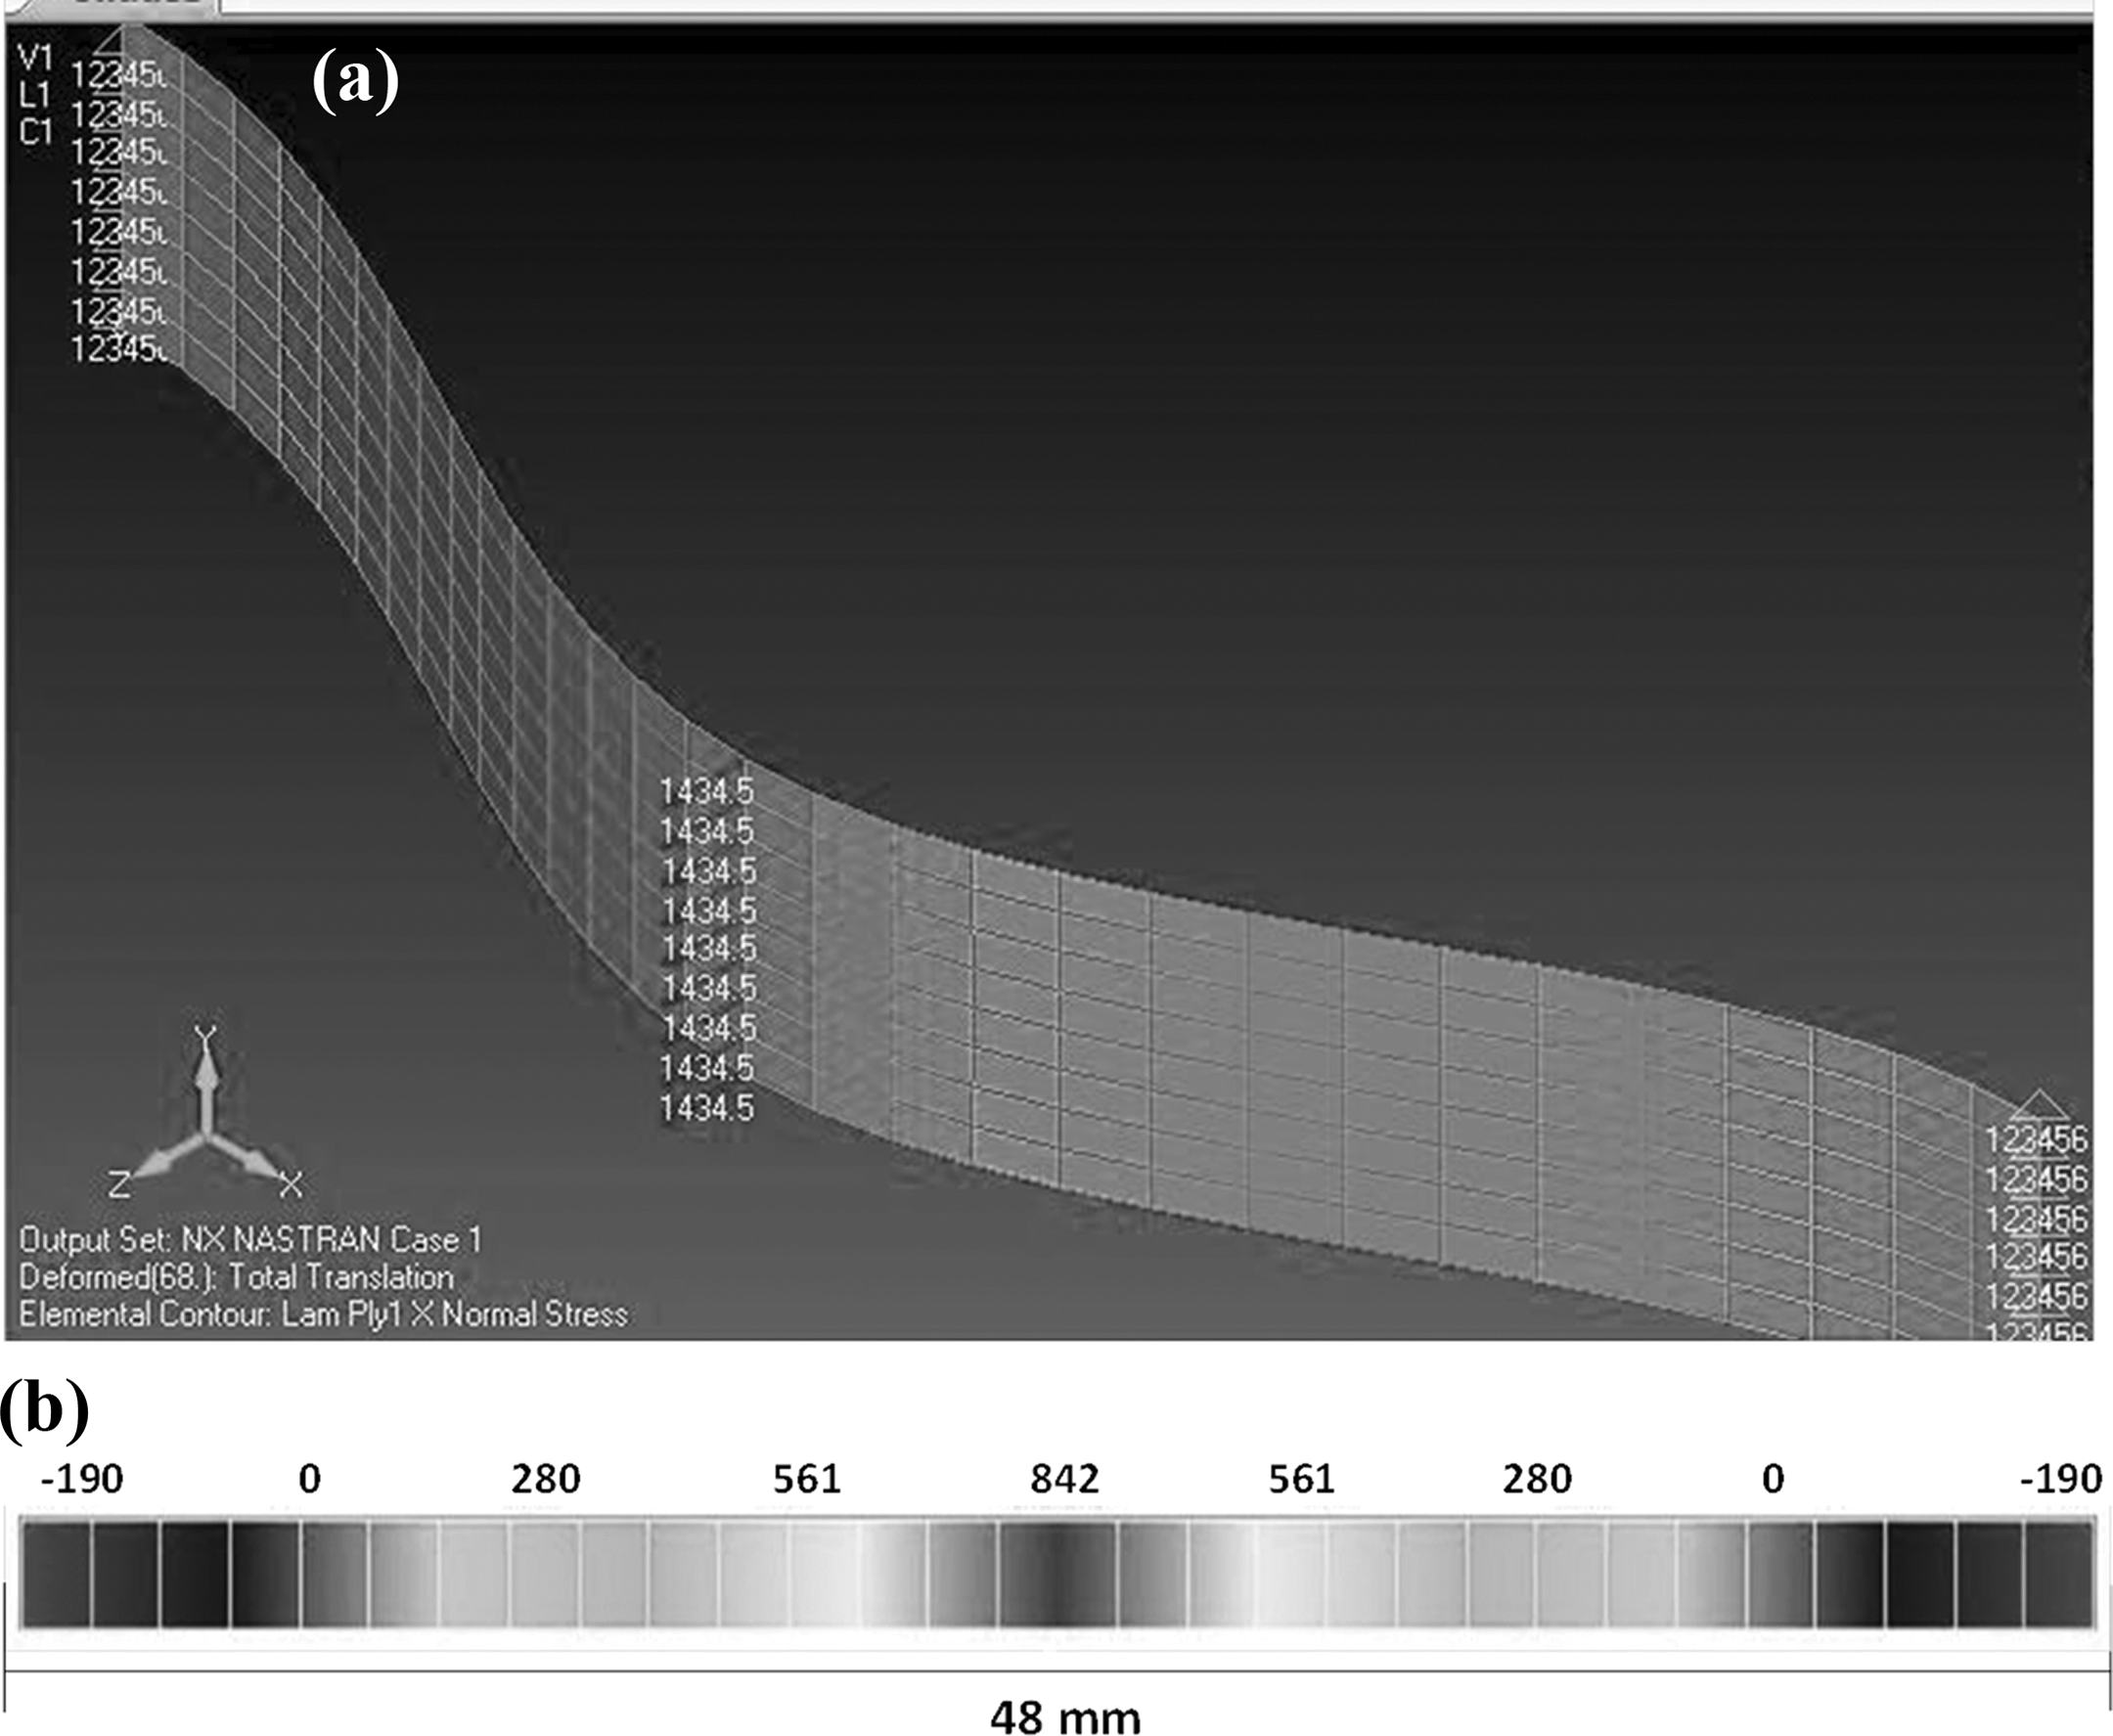
Three-point bending simulated in FEMAP: (a) specimen; (b) stress level scale along the specimen (MPa). FEMAP: finite element methodology and postprocessing.
Ultrasonic inspection resulted in an attenuation image, called C-Scan map. The resulting image of ultrasonic inspection indicates the variation in attenuation levels over the material, as a consequence of processing procedures.
From the C-Scan map, it was possible to assemble an interactive 3D surface image for better visual evaluation of attenuation, shown in Figure 6. Black arrow indicates resin injection direction (Figure 6). It was detected discontinuities referring to small difference during resin impregnation along the laminate. Higher return of wave generated bright colors and represents better impregnation continuity. In contrast, lower wave return, represented by dark color, is the result of voids or other defects.

C-Scan surface map.
According to Shiino et al. 36 and Pelivanov et al., 37 resin has faster wave return than fiber; consequently, the white coloration indicates resin accumulation. Resin-rich zone was found at composite injection region, which is related to lower attenuation. On the other hand, higher attenuation was observed from the middle of the laminate, where it was harder to resin impregnate the reinforcement.
For a precise evaluation of experimental tests, it was highlighted ultrasonic results for each specimen, presented in Figures 7 and 8. The subscript T represents specimens for tensile tests, and F represents specimens for flexural tests. Visually, it was difficult to observe variation in wave attenuation of specimens T1, T2, and T3, due to dispersion between image results.

C-Scan result for tensile specimens.
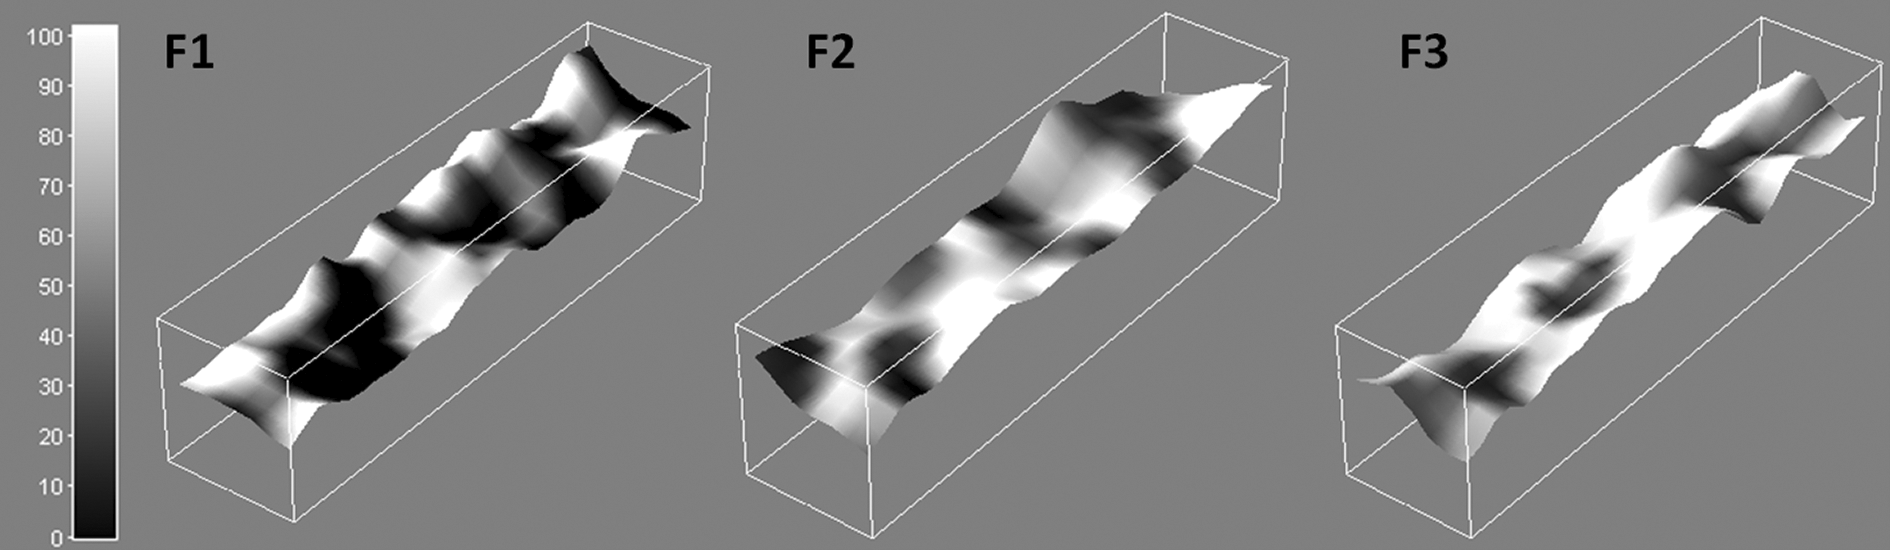
C-Scan result for flexural specimens.
Meanwhile, specimen F1 showed the greater visual discontinuity than other specimens for flexural specimens. This discontinuity could influence directly the material mechanical properties, the result of an inadequate fiber/matrix interface. If discontinuity presented in specimen F1 presents sections with lack of resin, it would result in a stress concentration, decreasing it mechanical strength.
C-Scan results showed a variation between specimen attenuation, observed by visual difference in wave return. Numerical result of ultrasonic inspection provided the average of wave return (%) and standard deviation (SD) for each specimen, as shown in Table 3.
Average and standard deviation of acoustic inspection signal return.
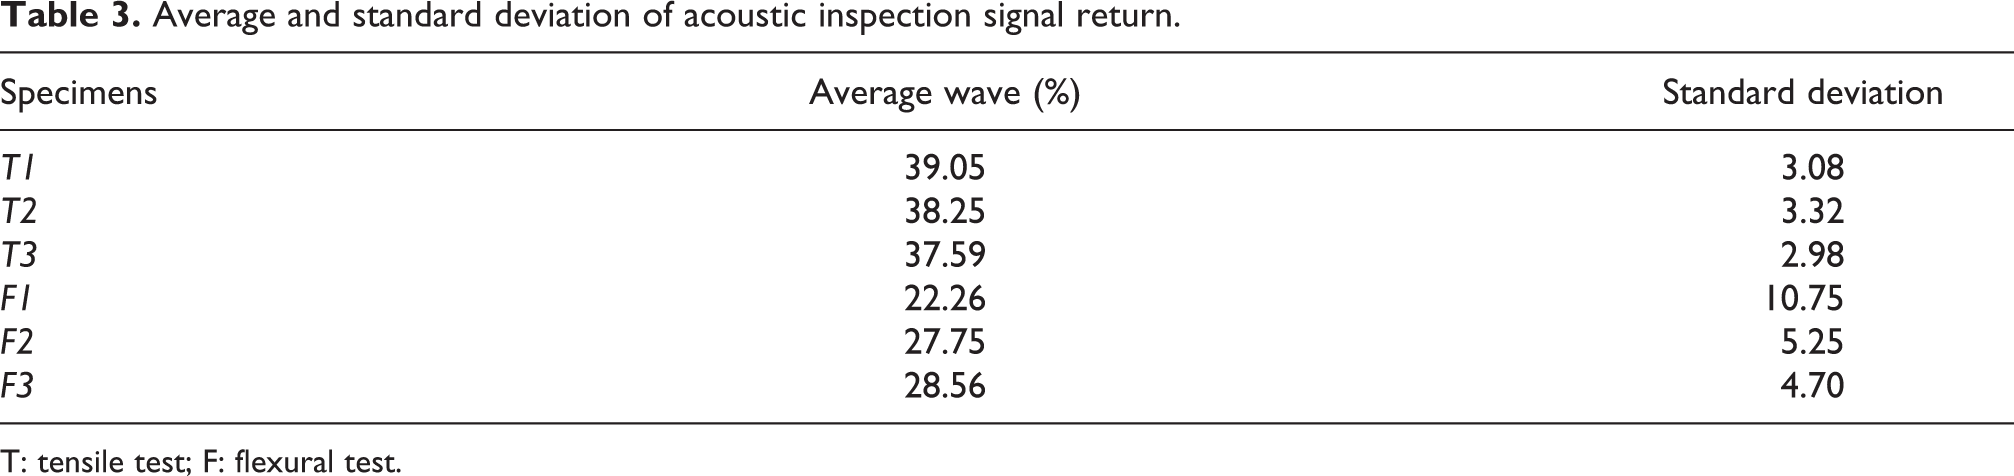
T: tensile test; F: flexural test.
Values of wave return normally found in literature have high disparity, between 20% and 50%, due to the intrinsic anisotropy of this material. 36 –39 SD is associated with materials’ homogeneity. In other words, high SD values mean heterogeneity in impregnation. T1, T2, and T3 values presented a considerably low SD and average wave return close to each other, confirming visual analysis.
Wave return values for F specimens were lower, and there was a high discrepancy between SDs, especially for specimen F1, which presented higher deviation. With this statement, it is possible to conclude that F1 presented higher discontinuity in impregnation compared with other specimens and also certify previous visual analysis.
One concern for composites with structural application is to have less than 2% of void volume fraction. Table 4 shows porosity fraction result of the laminate. Void volume fraction results were very close to each other. Even with the discontinuity found in ultrasonic inspection result, it can be considered that this composite is within aeronautical requirements.
Void fraction volume of the composite.

Experimental test results, with average value and SD, were represented in Tables 5 and 6, for tensile and flexural tests, respectively.
Tensile test results.

Flexural test results.

SD values exhibited in mechanical test results were a consequence of the discontinuity in resin impregnation during processing. Figure 9 shows the relation between the discontinuity degree and mechanical properties, evidencing the influence of impregnation discontinuity on the material mechanical properties.

Comparative relation between mechanical behavior and discontinuity degree.
Divergence between the results of experimental tensile test was only 1%, evidencing the same mechanical characteristic between specimens. The proximity between wave return values guaranteed greater continuity and homogeneity in the tensile specimens’ impregnation. These factors promoted the low divergence found in the tensile test results. In contrast, the discrepancy between wave return SD for flexural specimens increased the divergence between experimental results for 4%. Divergence was evidenced by F1 specimen, which had higher heterogeneity and lower flexural strength.
In FEMAP simulation, there was no variation in results, for being a material without any discontinuity or defects. Experimental results for tensile and flexural tests decreased 10% (approximately 100 MPa) of strength than those provided by simulation, which are associated with imperfections occurred during the processing for experimental tests.
Another important point to be considered is the influence of defects on mechanical behavior, as void volume fraction and impregnation discontinuity had same influence on tensile and flexural behaviors. As a result of heterogeneity in impregnation, experimental mechanical strength results decreased in comparison with simulation values.
Conclusions
The use of FEMAP software allows the composite mechanical behavior simulation with a high performance, considering that simulation results presented mechanical behavior very similar to experimental results. Uploading the CLT results, it was feasible to set comparison parameters with experimental results, in which it was possible to quantify the absolute tensile and flexural strength. In addition, the simulation of mechanical behavior allowed the visual analysis of the stress along the specimens, evidencing the FEMAP simulation advantage. As a matter of fact, it is possible to simulate the mechanical behavior for different composites prior to the material process.
The RTM process is feasible for aeronautic requirements with a good cost benefit. At the same time, even with void fraction less than 2%, as aeronautic request for dry fabrics, the tensile and the flexural strength decreased 10% (100 MPa), due to residual stress caused by impregnation defects exhibited in C-Scan analysis. Therefore, even a composite with appropriate materials for structural application, problems in the process may result in a weak fiber/matrix adhesion. Processing improvement is able to provide greater impregnation continuity, reducing defect formation and avoiding loss of mechanical properties. As a conclusion, process plays a role as important as the characteristics of reinforcement and matrix and, consequently, the composite properties.
Footnotes
Acknowledgments
The authors acknowledge the financial support from the Fundação de Amparo à Pesquisa do Estado de São Paulo (process numbers: 2015/19967-4 and 2016/07245-7), Coordenação de Aperfeiçoamento de Pessoal de Nível Superior – Brasil, and International Association for the Exchange of Students.
Declaration of conflicting interests
The author(s) declared no potential conflicts of interest with respect to the research, authorship, and/or publication of this article.
Funding
The author(s) disclosed receipt of the following financial support for the research, authorship, and/or publication of this article: The author(s) received financial support for the research from FAPESP (process numbers: 2015/19967-4 and 2016/07245-7), CAPES – Brasil, and International Association for the Exchange of Students.