
Abstract
The effects of gripper location and blank geometry on the thermoforming of a pre-consolidated carbon-fiber woven-fabric/polyphenylene sulfide (PPS) thermoplastic composite sheet (deformed into a U-beam geometry) are investigated both experimentally and numerically. The thermoforming experiments and simulations are performed at constant tool (160oC) and sheet (315oC) temperatures by using four thermoplastic composite blanks, which are different in geometry and inserted into the blank holder using gripping springs. Thermocouples are inserted on the composite sheet and forming molds in order to monitor the temperature variations during thermoforming. Thermoforming process is simulated in Ls-Dyna; the composite sheet is modeled using the Anisotropic Hyperelastic Material Model (MAT_249). An optimum punch speed and a spring constant are initially determined through numerical simulations. Afterward, the numerical thermoforming processes of four different blanks are implemented separately. Results reveal that the simulations show good agreements with the experiments in terms of defects formation and the maximum shear angles between the fiber directions on the final thermoformed U-beam geometry. When the blank is attached with eight springs from the lugs to the blank holder, the deformation and distortion of the net edge of the sheet are avoided, resulting in significant reductions in the extent of defect formation.
Keywords
Introduction
The use of carbon fiber reinforced thermoplastic composites has been increasing, particularly in oil and gas, medical, transportation, and aerospace industries.1,2 The advantages of carbon fiber reinforced thermoplastic composites over the thermoset composites may include recyclability, unlimited prepreg storage life, easy fabrication with shorter production times, higher corrosion and moisture resistance, low toxicity, and enhanced impact toughness.1,3 Thermoplastic composites provide considerable weight and cost reductions; hence, they have potentials for the replacement of the metallic parts of high temperature-performance applications.2,4 Since thermoforming (thermo-stamping) has comparatively lower process cycles and the capability of processing complex-geometry parts, it is generally considered the most suitable method for the mass production of small and medium-size woven fabric reinforced thermoplastic composite parts. 5 Thermoforming composes of three main steps; first step, pre-heating of a composite sheet, then transportation step to stamp in which a woven fabric (pre-consolidated sheet or prepreg) is formed under a pressure inside a forming mold at a temperature near the melting temperature of thermoplastic matrix and a consolidation step where occurs during the cooling of molten resin inside the mold. During the stamping, defects occur particularly at the curved sections of complex geometry parts, including wrinkling, fiber/yarn slippage, porosity, and fiber fracture.5,6 The defects are retained after cooling and may lead to unpredictable reductions in the mechanical properties, as well as in the product shelf life. The defect formation and the quality of final product are closely related to the thermoforming parameters, such as stamping temperature and pressure. 7 The defects appearing during and after the forming process in a mass production line can be predicted by implementing the simulations of thermoforming process, which can help to avoid the rejection of components.
Previously, a hyperelastic constitutive model was developed with an aim of specifying the macroscopic properties of a textile reinforcement at large strains. 8 The model was based on potential energies, an in-plane shear and two tensile potentials, which defined the mechanical behavior of reinforcement. The results of the model showed good correlations with the results of punch tests on the textile reinforcement. The shear response of a thermoformed pre-consolidated thermoplastic composite sheet with 0o/90o fiber orientation was also investigated. 9 The thermoforming was performed by using a tool having a double dome benchmark geometry. A blank designed for the double dome geometry was clamped to a frame by means of springs rather than a friction-based blank holder. By this way, the extent of wrinkling was reduced. Furthermore, a multi-scale energy model was developed in order to predict the shear behavior of thermoformed composite sheets. The dominant deformation mechanism was shown trellis shear, while inter-ply slip was shown to play a negligible role. The simulation shear angles measured on the thermoformed sheets generally agreed well with the measured ones. Note that, the accuracy of thermoforming models is ultimately related with the used fabric model. In a previous study, the shear responses of punched loose plain weave fabrics were simulated in Ls-Dyna in order to evaluate the prediction capabilities of the fabric models including Viscoelastic Loose Fabric (MAT_234), Micromechanics Dry Fabric Model (MAT_235), and Anisotropic Hyperelastic Model (MAT_249). 10 Among above, the Anisotropic Hyperelastic Model agreed the most with the experiments when the outer contour and shear angle distribution of punched fabrics were considered. In another study, a fully automated forming process of continuous fiber reinforced thermoplastics was simulated in Ls-Dyna under various scenarios in order to prevent wrinkling and fracture. 11 The simulation results showed that the fiber fracture caused by the crimping of wrinkles could be avoided by inducing local fiber shear and yarn straightening (to withdraw the surplus material out of the wrinkling zone) and by using a 45o/45° fiber orientation instead of a 0/90° orientation (to avoid fibers orthogonal to the wrinkle). A pre-draping process was also shown to be useful to avoid fiber fracture in the same study. In addition, delamination may arise in the cooling phase of thermoforming process due to the anisotropic behavior of the fabric and residual stresses may develop as a result of the difference between the thermal expansion coefficients of the composite and forming molds. 12 Other numerical studies on the thermoforming process of thermoplastic composites can be found in refs.13-17
In present study, the thermoforming of a carbon-fiber woven-fabric/Polyphenylene sulfide (PPS) thermoplastic composite sheet into a U-beam geometry was investigated experimentally and numerically for an aim of minimizing the defect formation. The thermoforming of thermoplastic sheet was simulated in Ls-Dyna using the Anisotropic Hyperelastic Model (MAT_249). The thermoforming experiments were performed using thermocouples and the temperatures of tools and composite sheet were monitored during all process steps. The surface defects of thermoformed composite were investigated by using different composite sheet blanks and clamping configurations. The simulations of the validated thermoforming experiments were also performed and showed good agreements with the experiments of all blank types.
Experimental
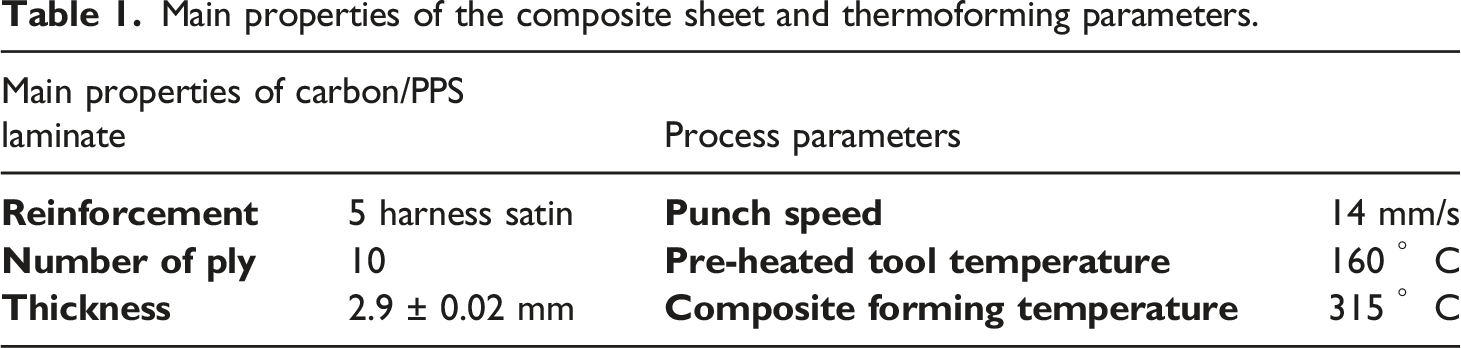
In the thermoforming process of thermoplastic composites, the initial step is to cut a pre-consolidated composite sheet into a desired geometry and then clamp it into a blank holder by means of springs. Next, the clamped sheet is preheated to a temperature (315 °C) above the melting point (285 °C) of matrix material18,19 and then quickly transferred between the heated molds inside a press, where it is consolidated under a pressure. 20 After cooling the thermoformed composite part inside the press, it is finally demounted from the molds for finishing operations. The forming capabilities of composite sheets depend mainly on the ductility of the matrix material of composite sheet and the geometrical features of finished part, such as the radius of curvature, the depth of draw, and surface friction. 21 The delamination between layers is an important issue when the duration of forming force is not enough for a full adhesion of plies. The thermoforming process parameters such as composite sheet clamping location, heating time, temperature distribution, tool temperature, forming rate, and cooling period also affect the final quality of thermoformed composite parts. 22
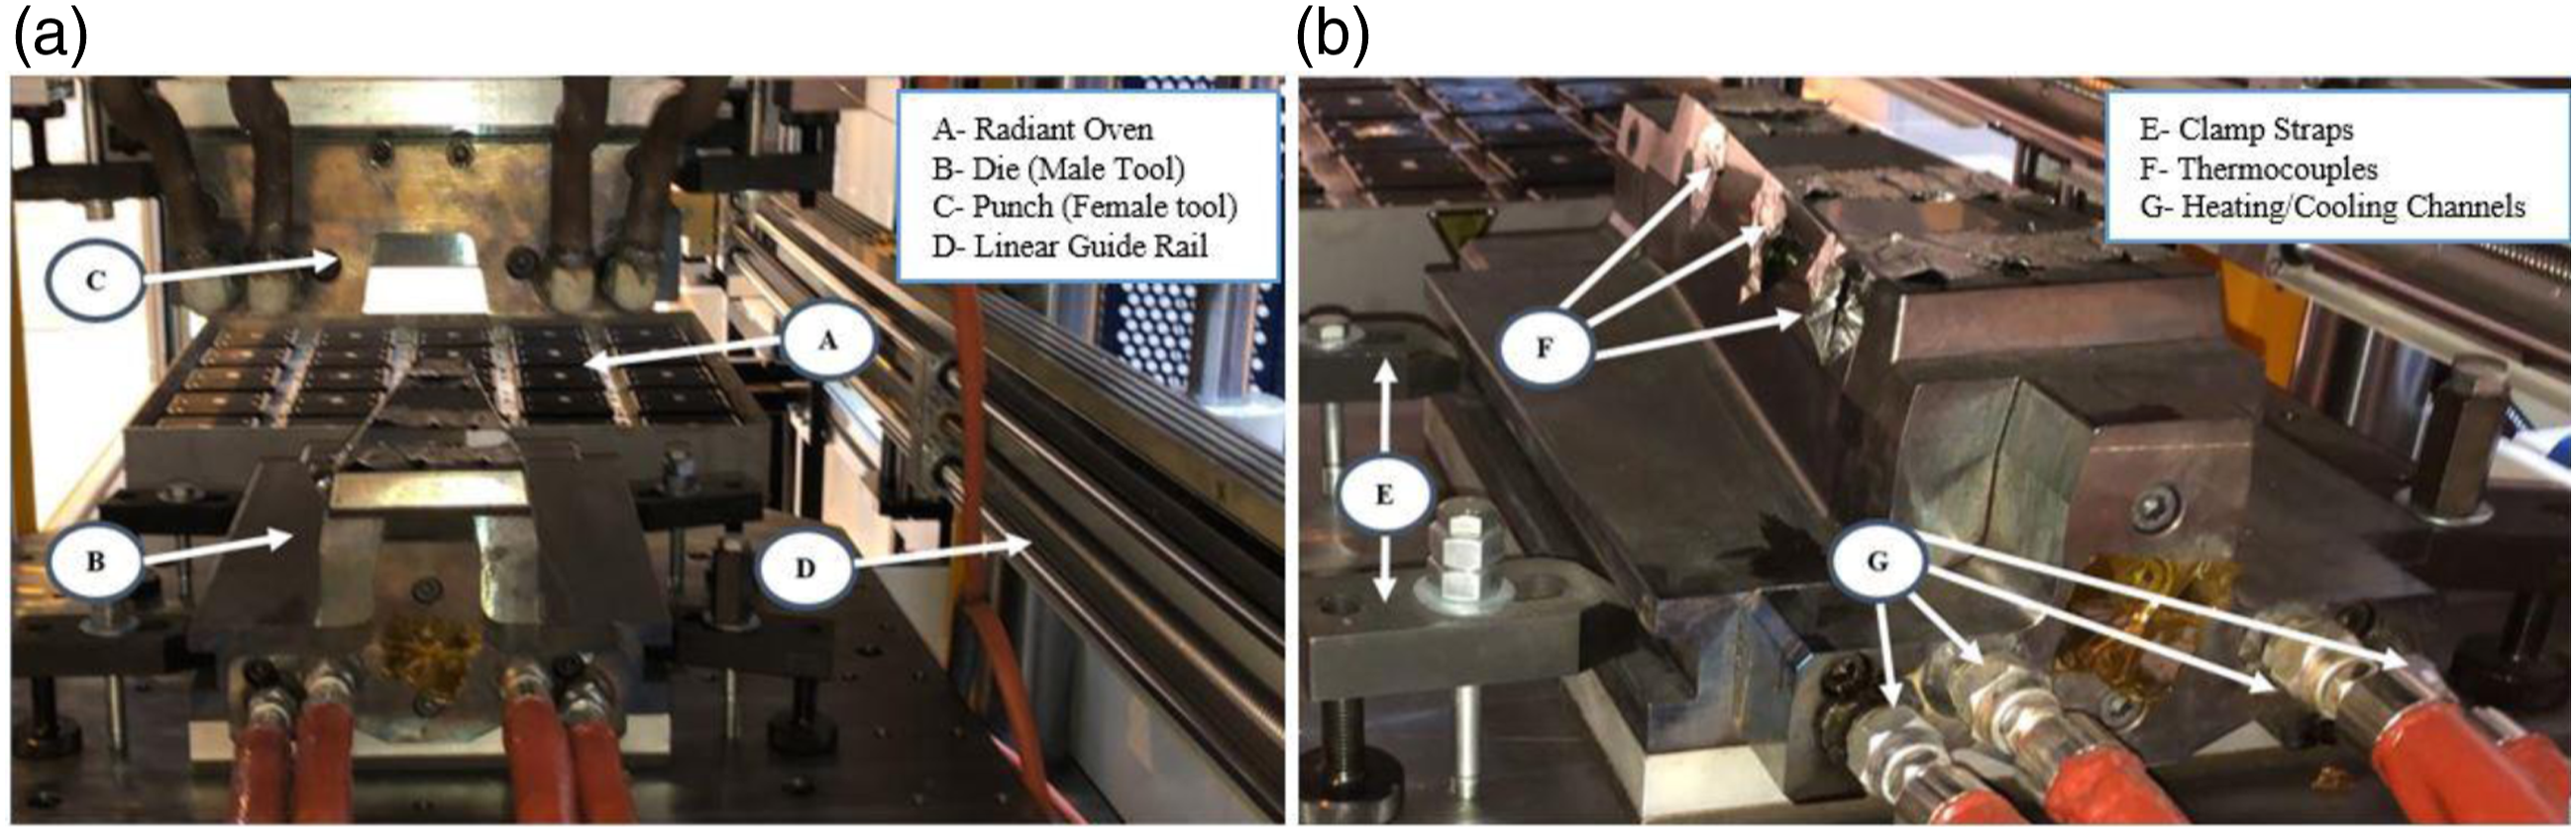
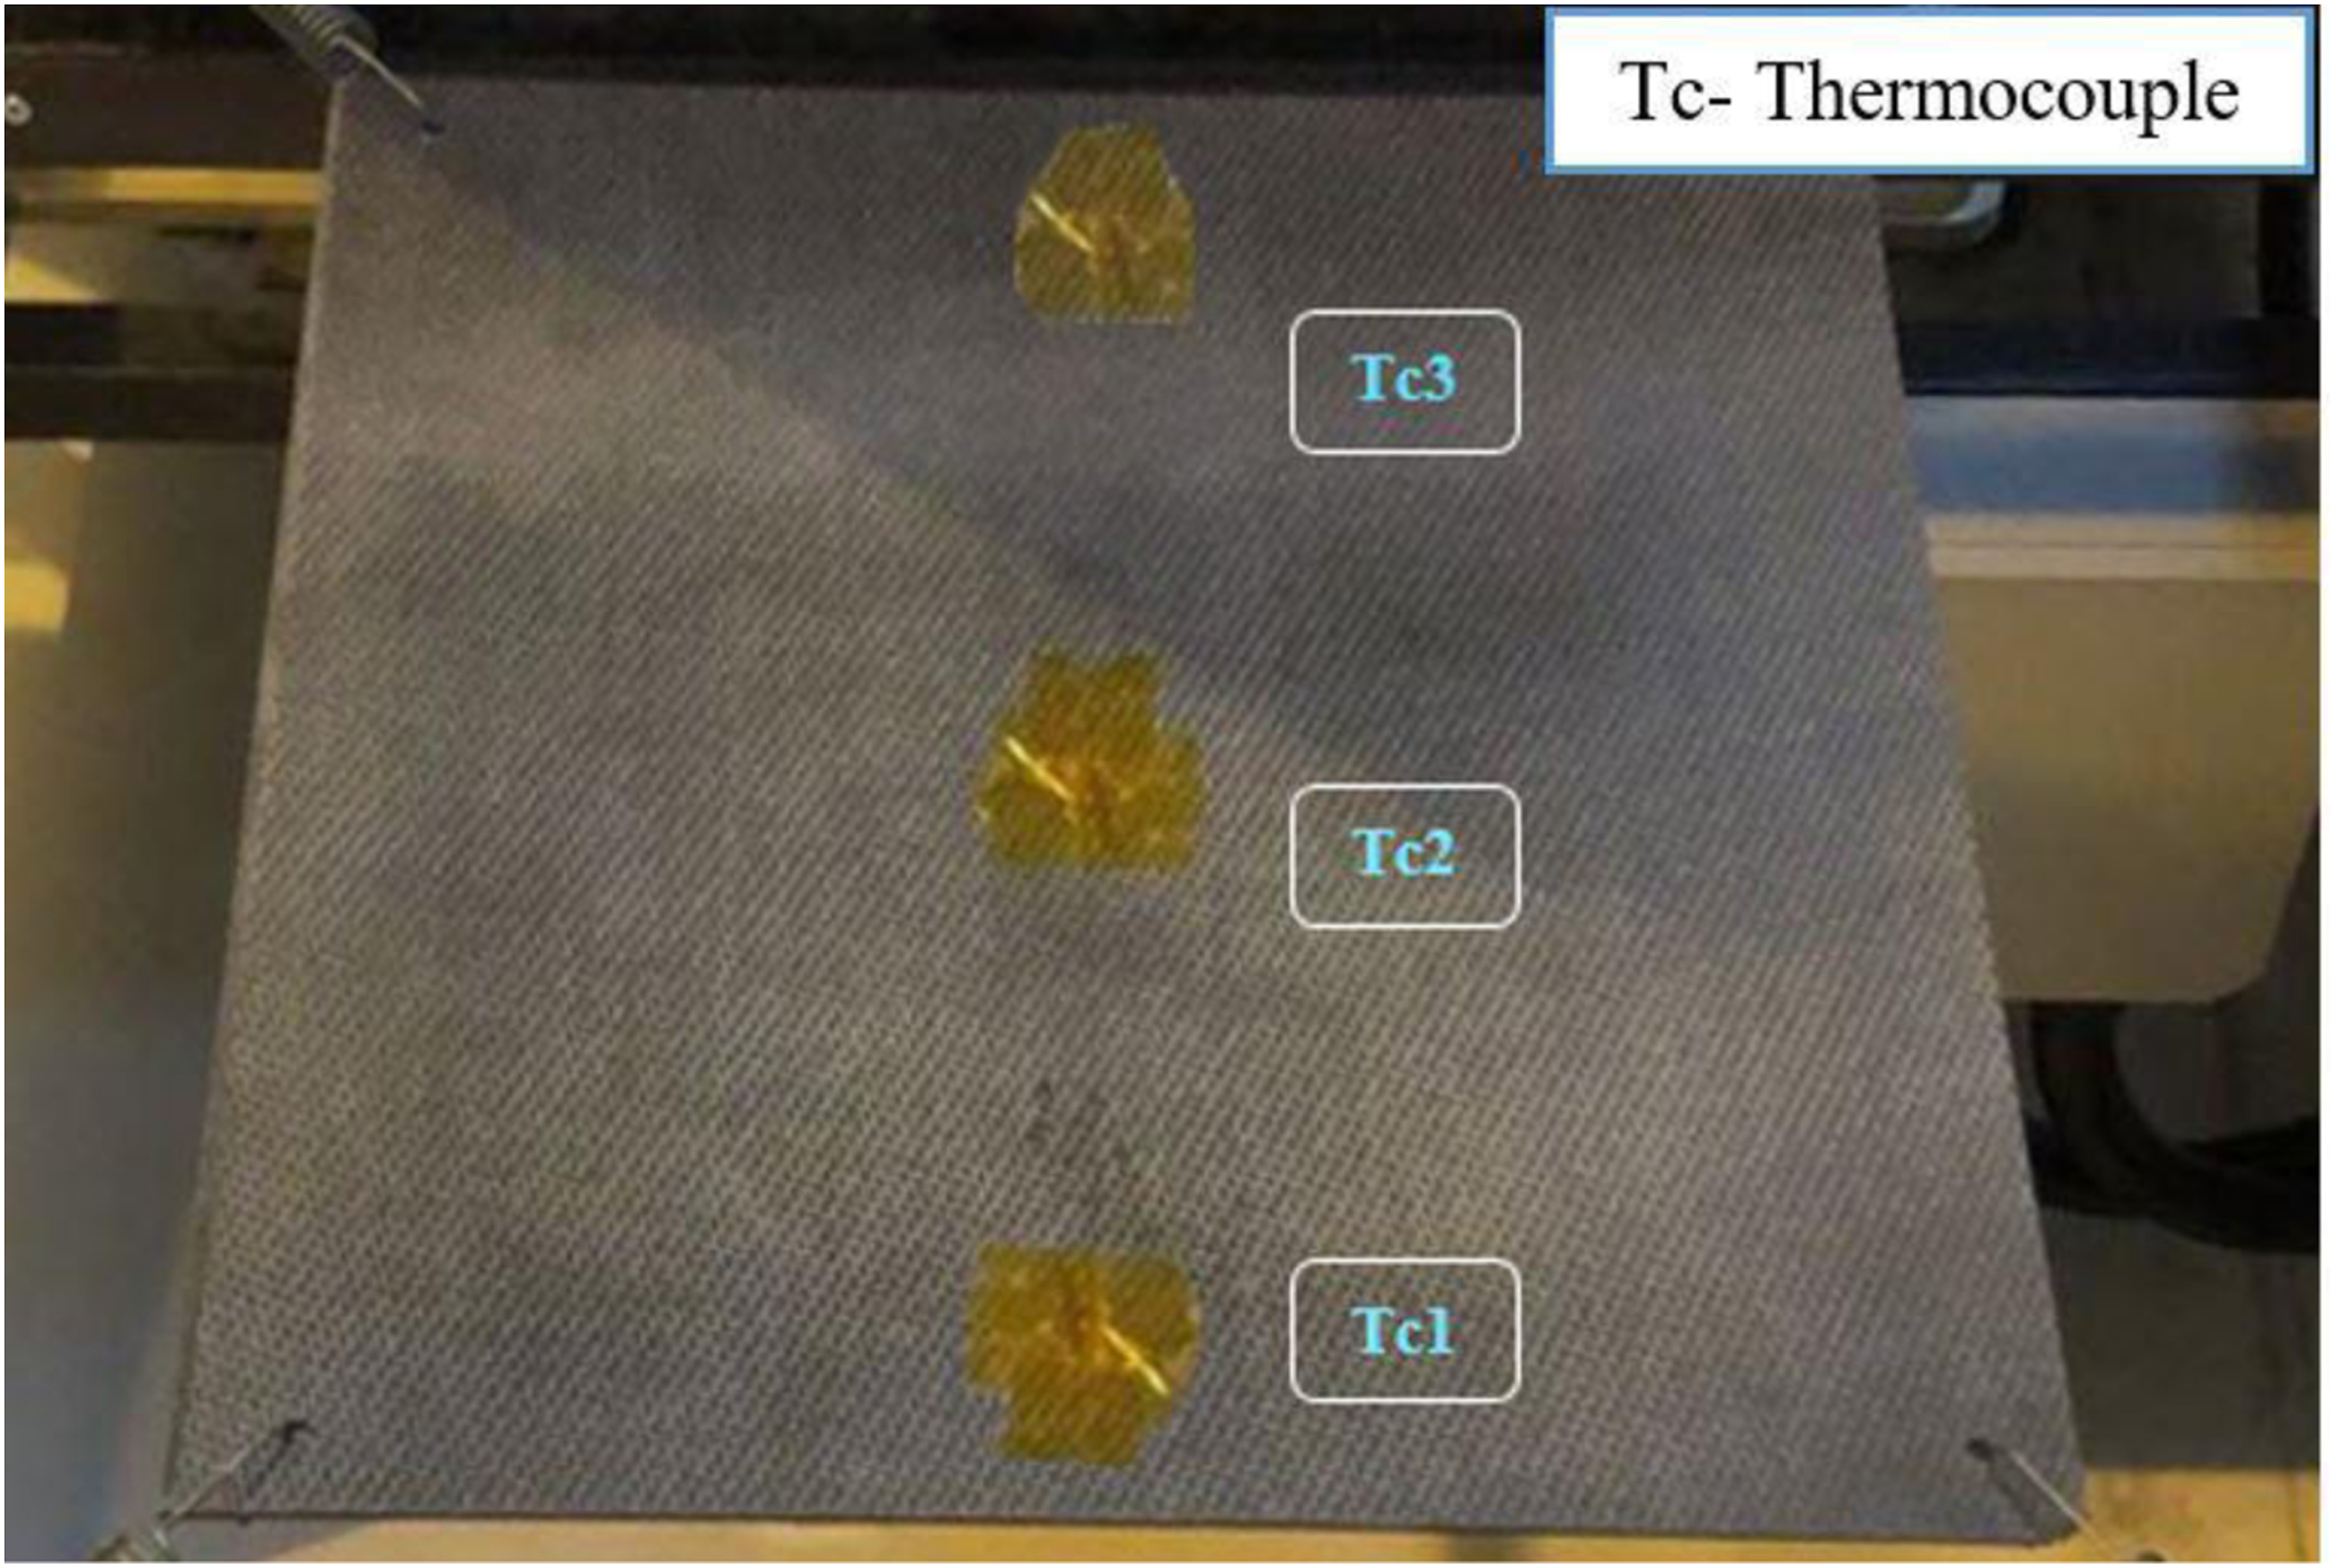
The schematic of the used experimental thermoforming process set-up (or line) is shown in Figure 1a and consisted of a transportation unit, radiant ovens, guide rails, and a forming station. The composite sheet was placed into a frame by means of four springs and the position of the sheet was adjusted by changing the locations of gripping springs on the frame in the transportation unit, Figure 1b. The transfer unit was moved laterally to different stations by means of linear guide rails, and the transfer times between the stations, and the waiting times at each station were controlled by using a fully automated system. In the used set-up, the composite sheet was heated at the bottom and at the top by using radiant ovens, each consisted of 25 infrared heaters as shown in Figure 1c. The forming station consisted of a hydraulic press with a capacity of 1127 kN and forming tools including die and punch (see Figure 2a and (b)). The die and punch were heated by radiant ovens and cooled by circulating boron oil through heating/cooling channels. The die and punch were poisoned in the hydraulic press by clamp straps. Thermocouples were placed at the die and punch surfaces in order to monitor the tool temperature variations during forming. The die and punch were pre-heated to160°C in the experiments and, the die (male tool) was fixed, while the punch (female tool) was moved down with a constant speed in order to form the composite sheet. During experiments, three thermocouples were placed at three different locations of the composite sheet, depicted in Figure 3, to monitor the temperature of the sheet at each step. (a) Schematic representation of thermoforming line, (b) composite plate attached to the transportation unit, and (c) radiant ovens. (a) Main units and (b) tooling of hydraulic press at the forming station. The composite sheet with thermocouples.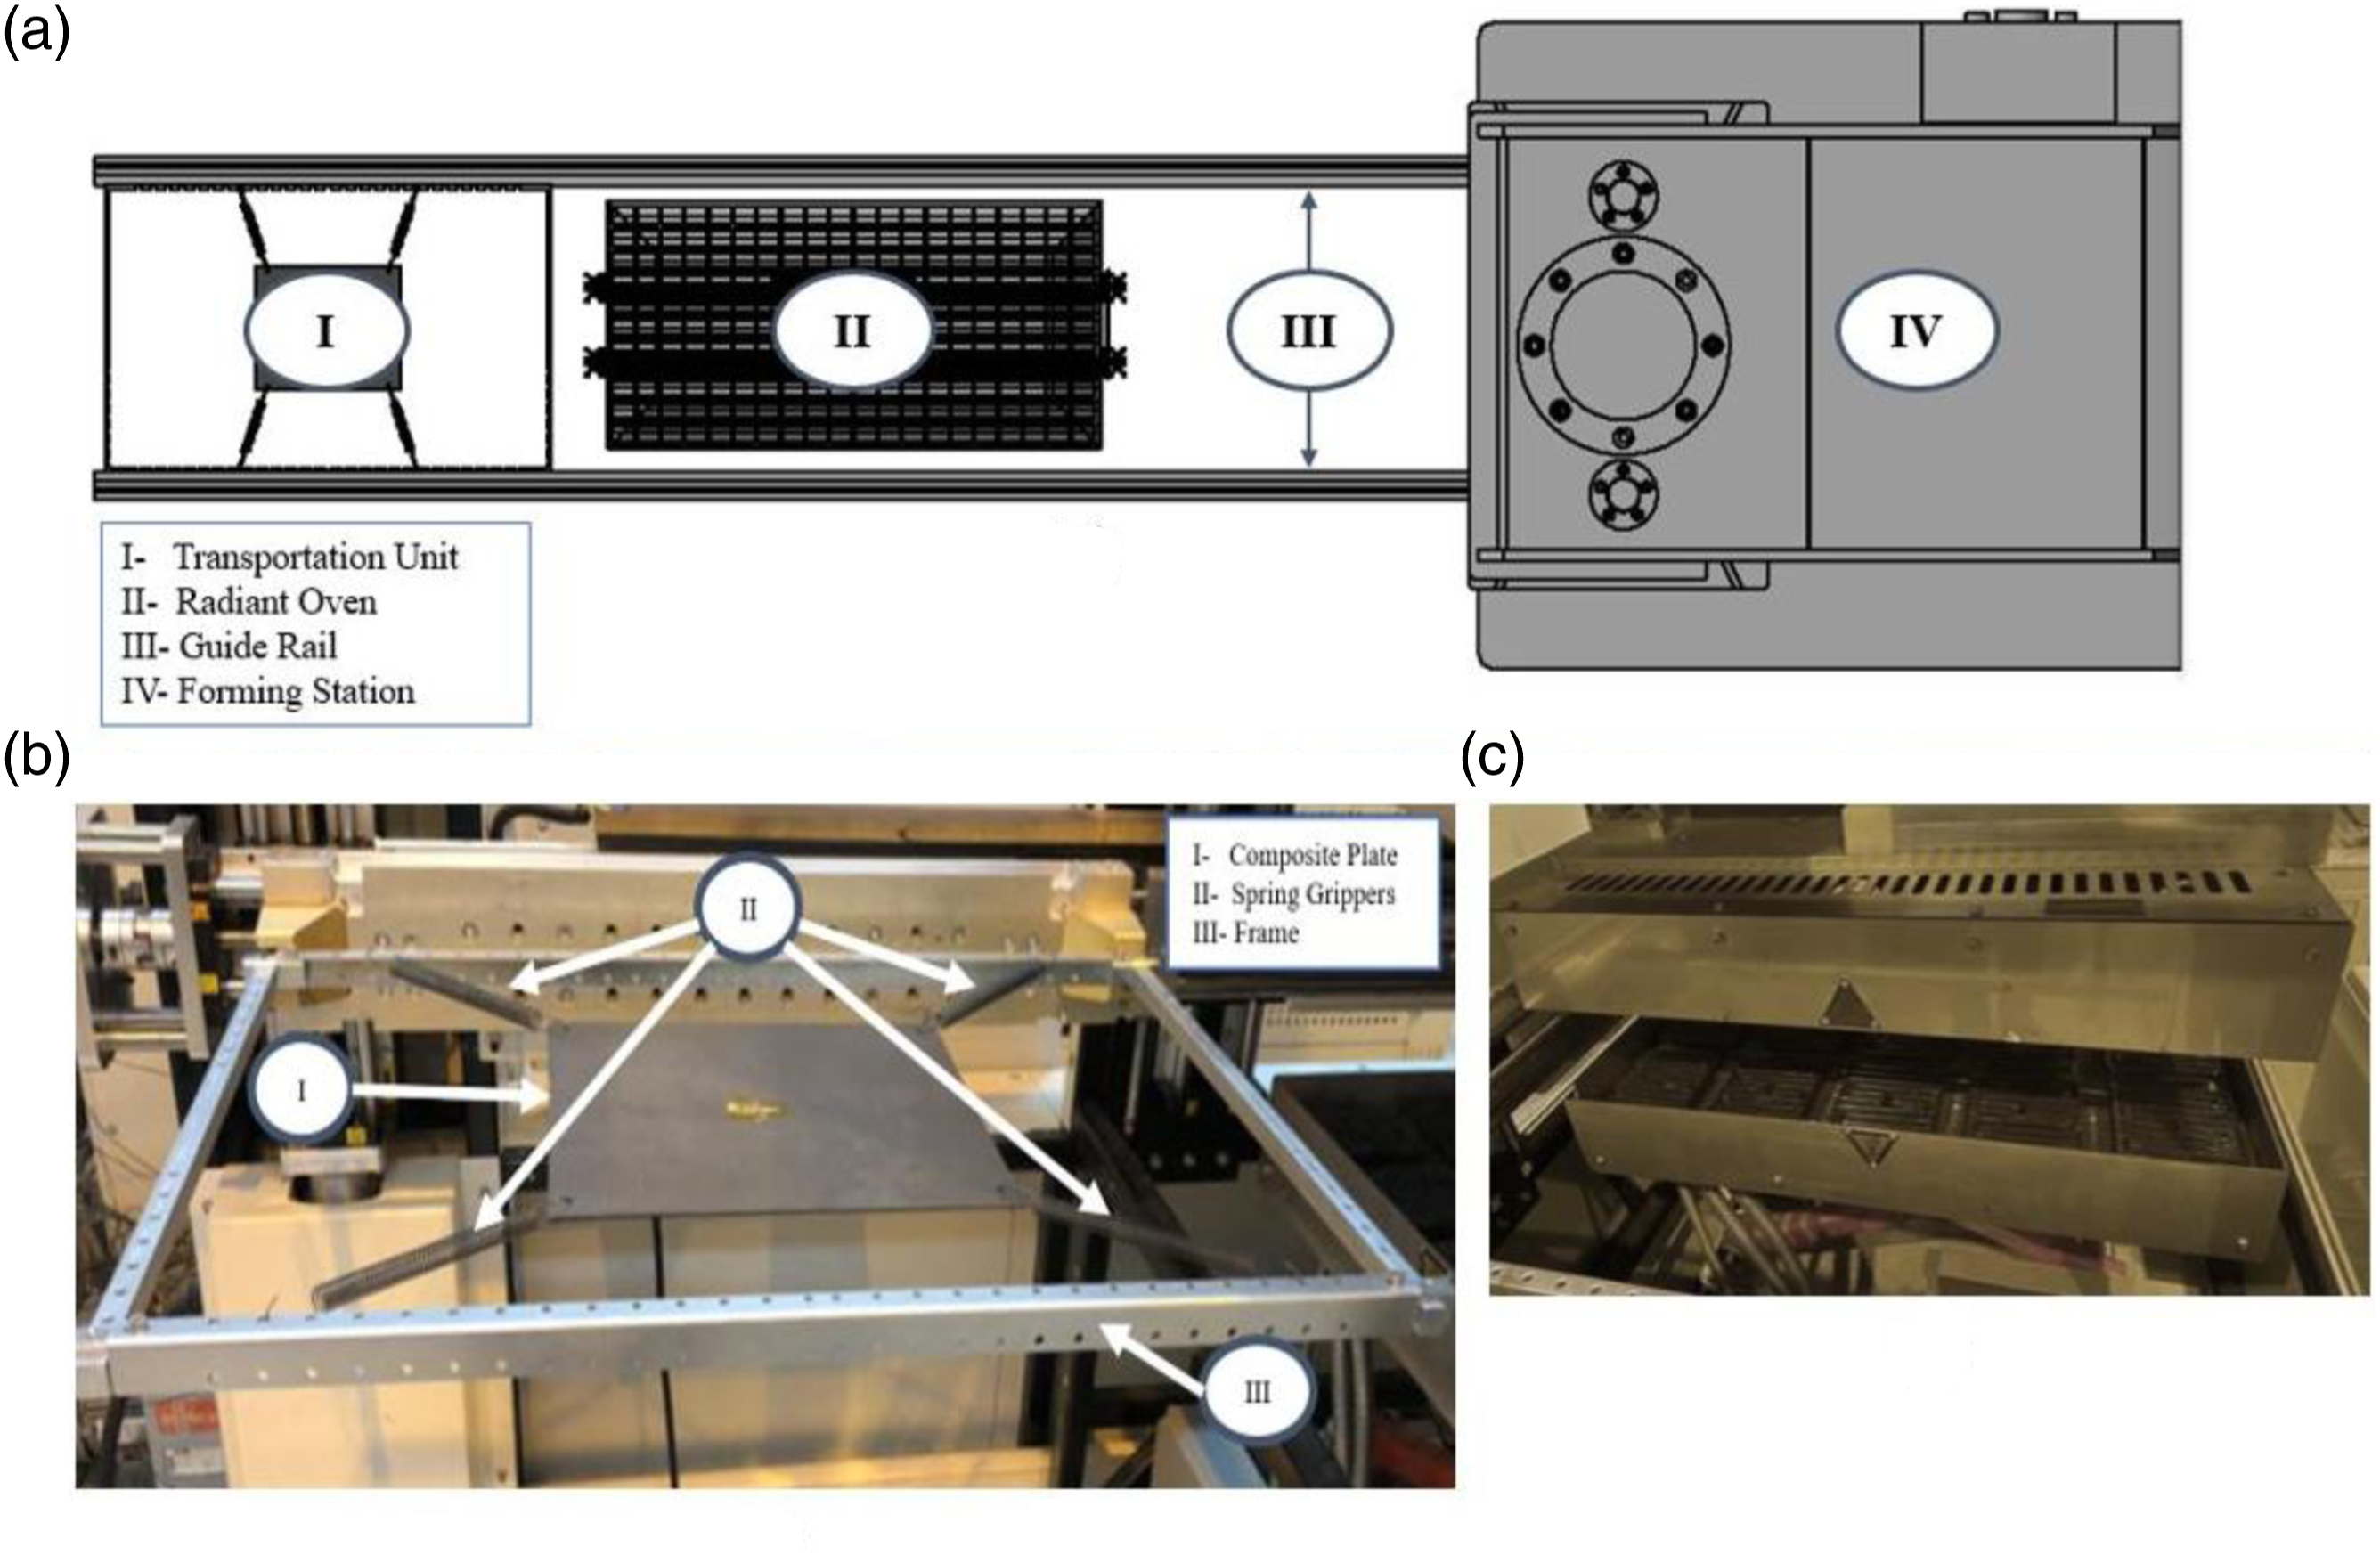
Main properties of the composite sheet and thermoforming parameters.
Numerical Simulations
The used numerical model is schematically shown in Figure 4. The model basically consisted of five main parts: these are punch, die, frame, composite sheet, and spring grippers. Springs were used to induce in-plane tension in the composite sheet with an intent of minimizing wrinkles.5-17 The punch, die, and frame were assumed rigid and modeled using MAT-RIGID (MAT-20) material model. Since the assigned rigid material elements were not taken into account in the program algorithm and hence have no stored historical data, it is cost-effective.
27
The springs were modeled by the S01 SPRING-ELASTIC card. Main elements of thermoplastic-rib simulation geometry.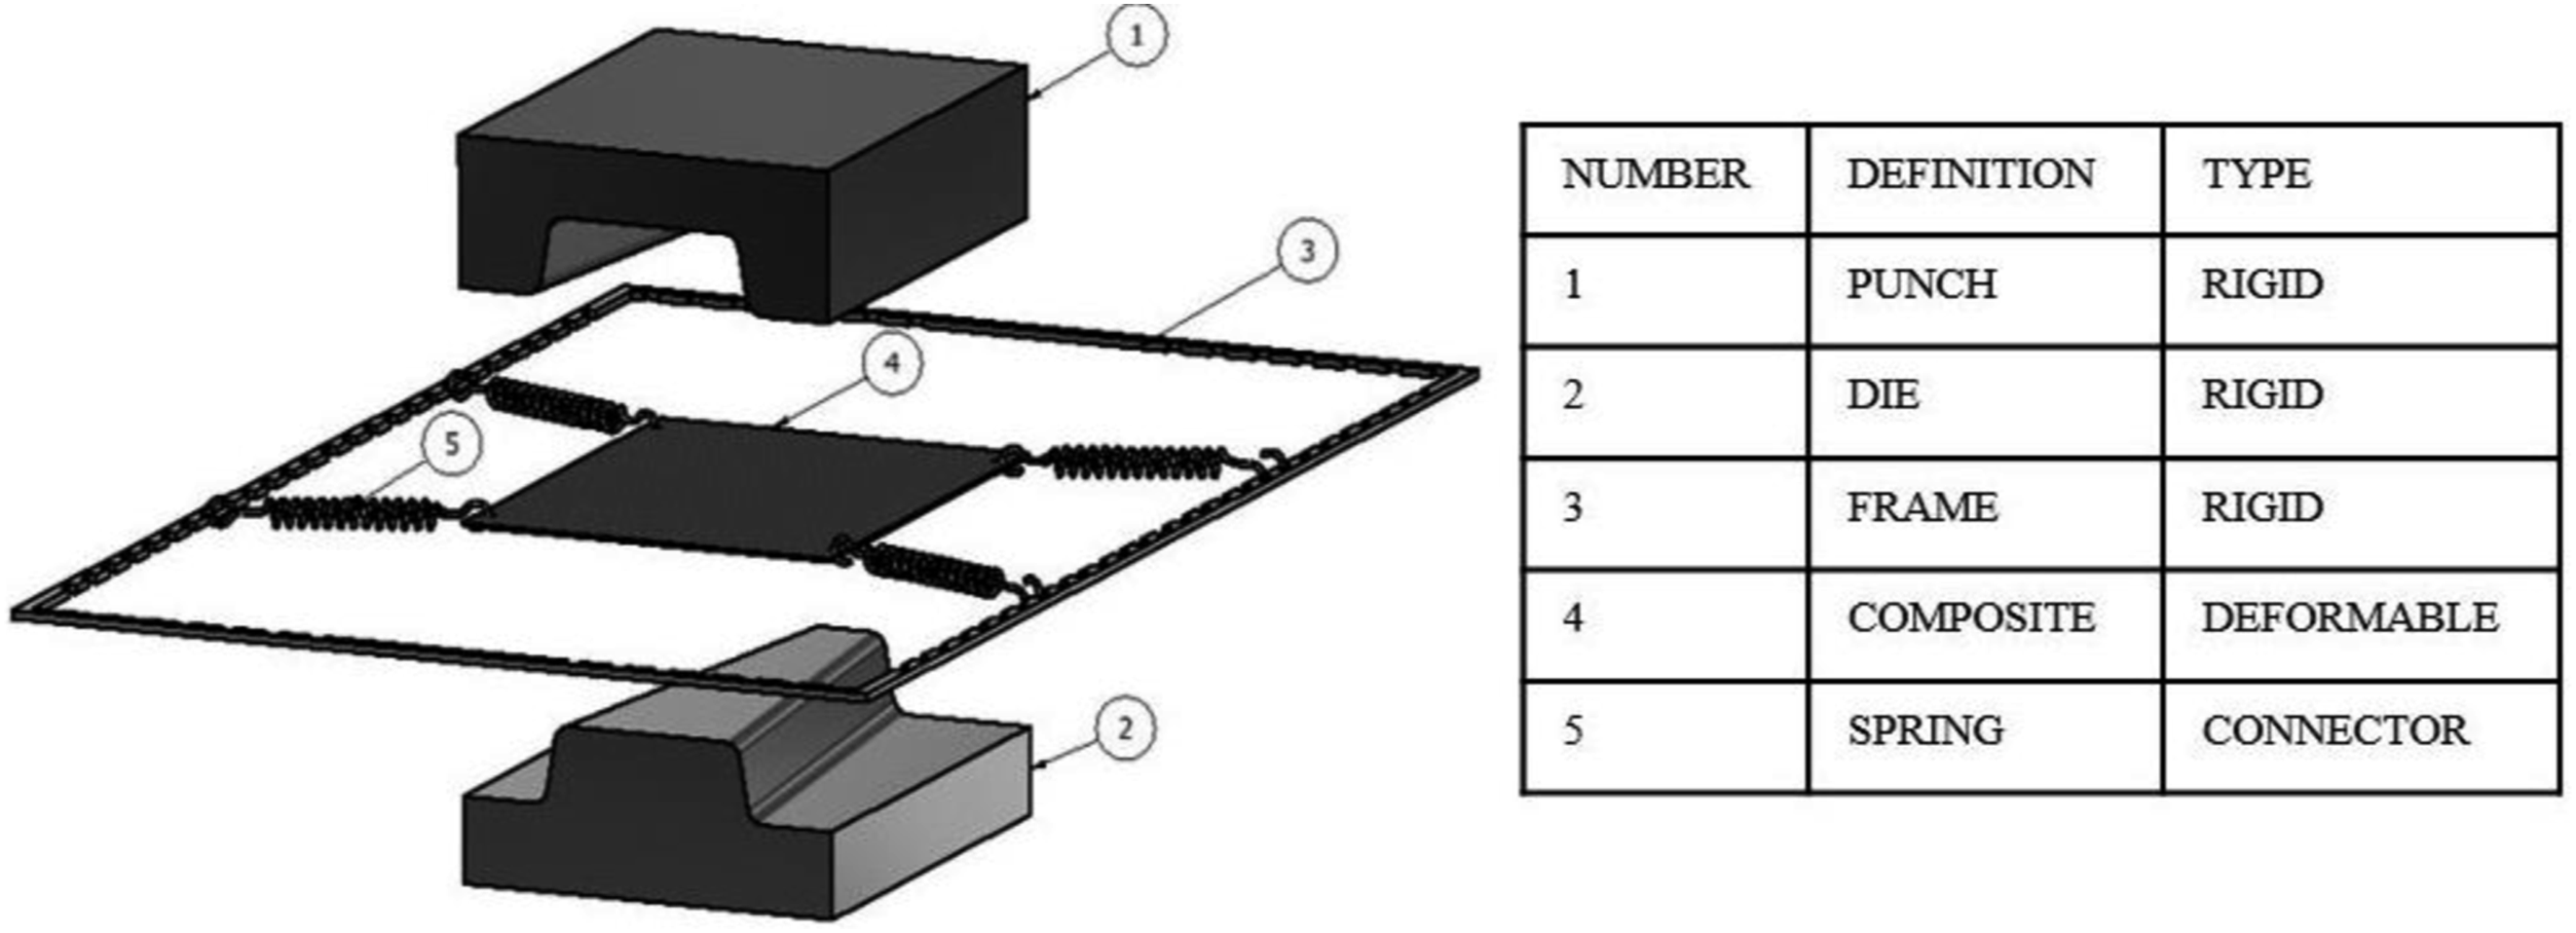
The numerical simulation of thermoplastic fabric was performed using REINFORCED-THERMOPLASTIC MAT_249.
28
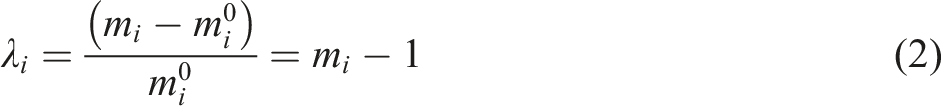
In this model, each ply is modeled individually by a single layer of shell elements. The fiber directions and deformations in the model (shell elements) are schematically shown, before and after deformation, in Figures. 5(a) and (b), respectively. As the fibers are continuously distributed throughout the material, continuum theory is applied. Depending on the fiber directions, the tension, compression, and shear response of fabric can be determined separately.
12
For Representation of fiber directions: (a) before and (b) after deformation.
The tensile elastic stress of fiber 

The shear stress of fiber 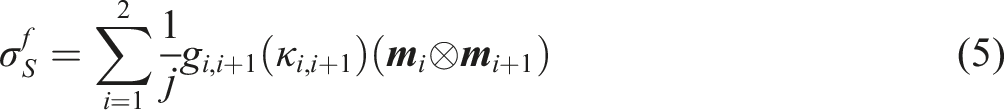
The thermoplastic matrix in the model was defined by a thermo-elasto-plastic material formulation.
29
In this model, when temperature reaches high values, thermoplastic matrix behaves like a viscous liquid, while reduction in temperature causes a significant increase in the elastic modulus and yield stress. Temperature dependent elastic properties of matrix were defined by means of the stress-strain curves. The von-Mises yield criterion (Φ) was applied to matrix as
The model was constructed by using 5 mm size quadrilateral shell elements (total 2000 elements) with a fully integrated shell formulation (four integration points, ELFORM 16) which eliminated the hourglass problem.
28
The used element size was determined after applying a mesh sensitive analysis, in which the accuracy and the cost of simulations were compromised. The standard penalty-based formulation was selected as the contact algorithm. Several simulations were carried out using various blanks (composite sheet was larger in size than the part geometry, dotted lines) with different gripping locations of the blank as shown in Figure 6 (a–d). Blank type 1 had a rectangular shape connected to the frame by using four spring grippers located at the corners. Blank types 2 and 4 were attached to the frame by using four springs located in the net edge of the part (EOP). Blank type 3 was attached to the frame by using eight springs which were out of net EOP. Connections of the blank to the frame (a) type 1, (b) type 2, (c) type 3, and (d) type 4.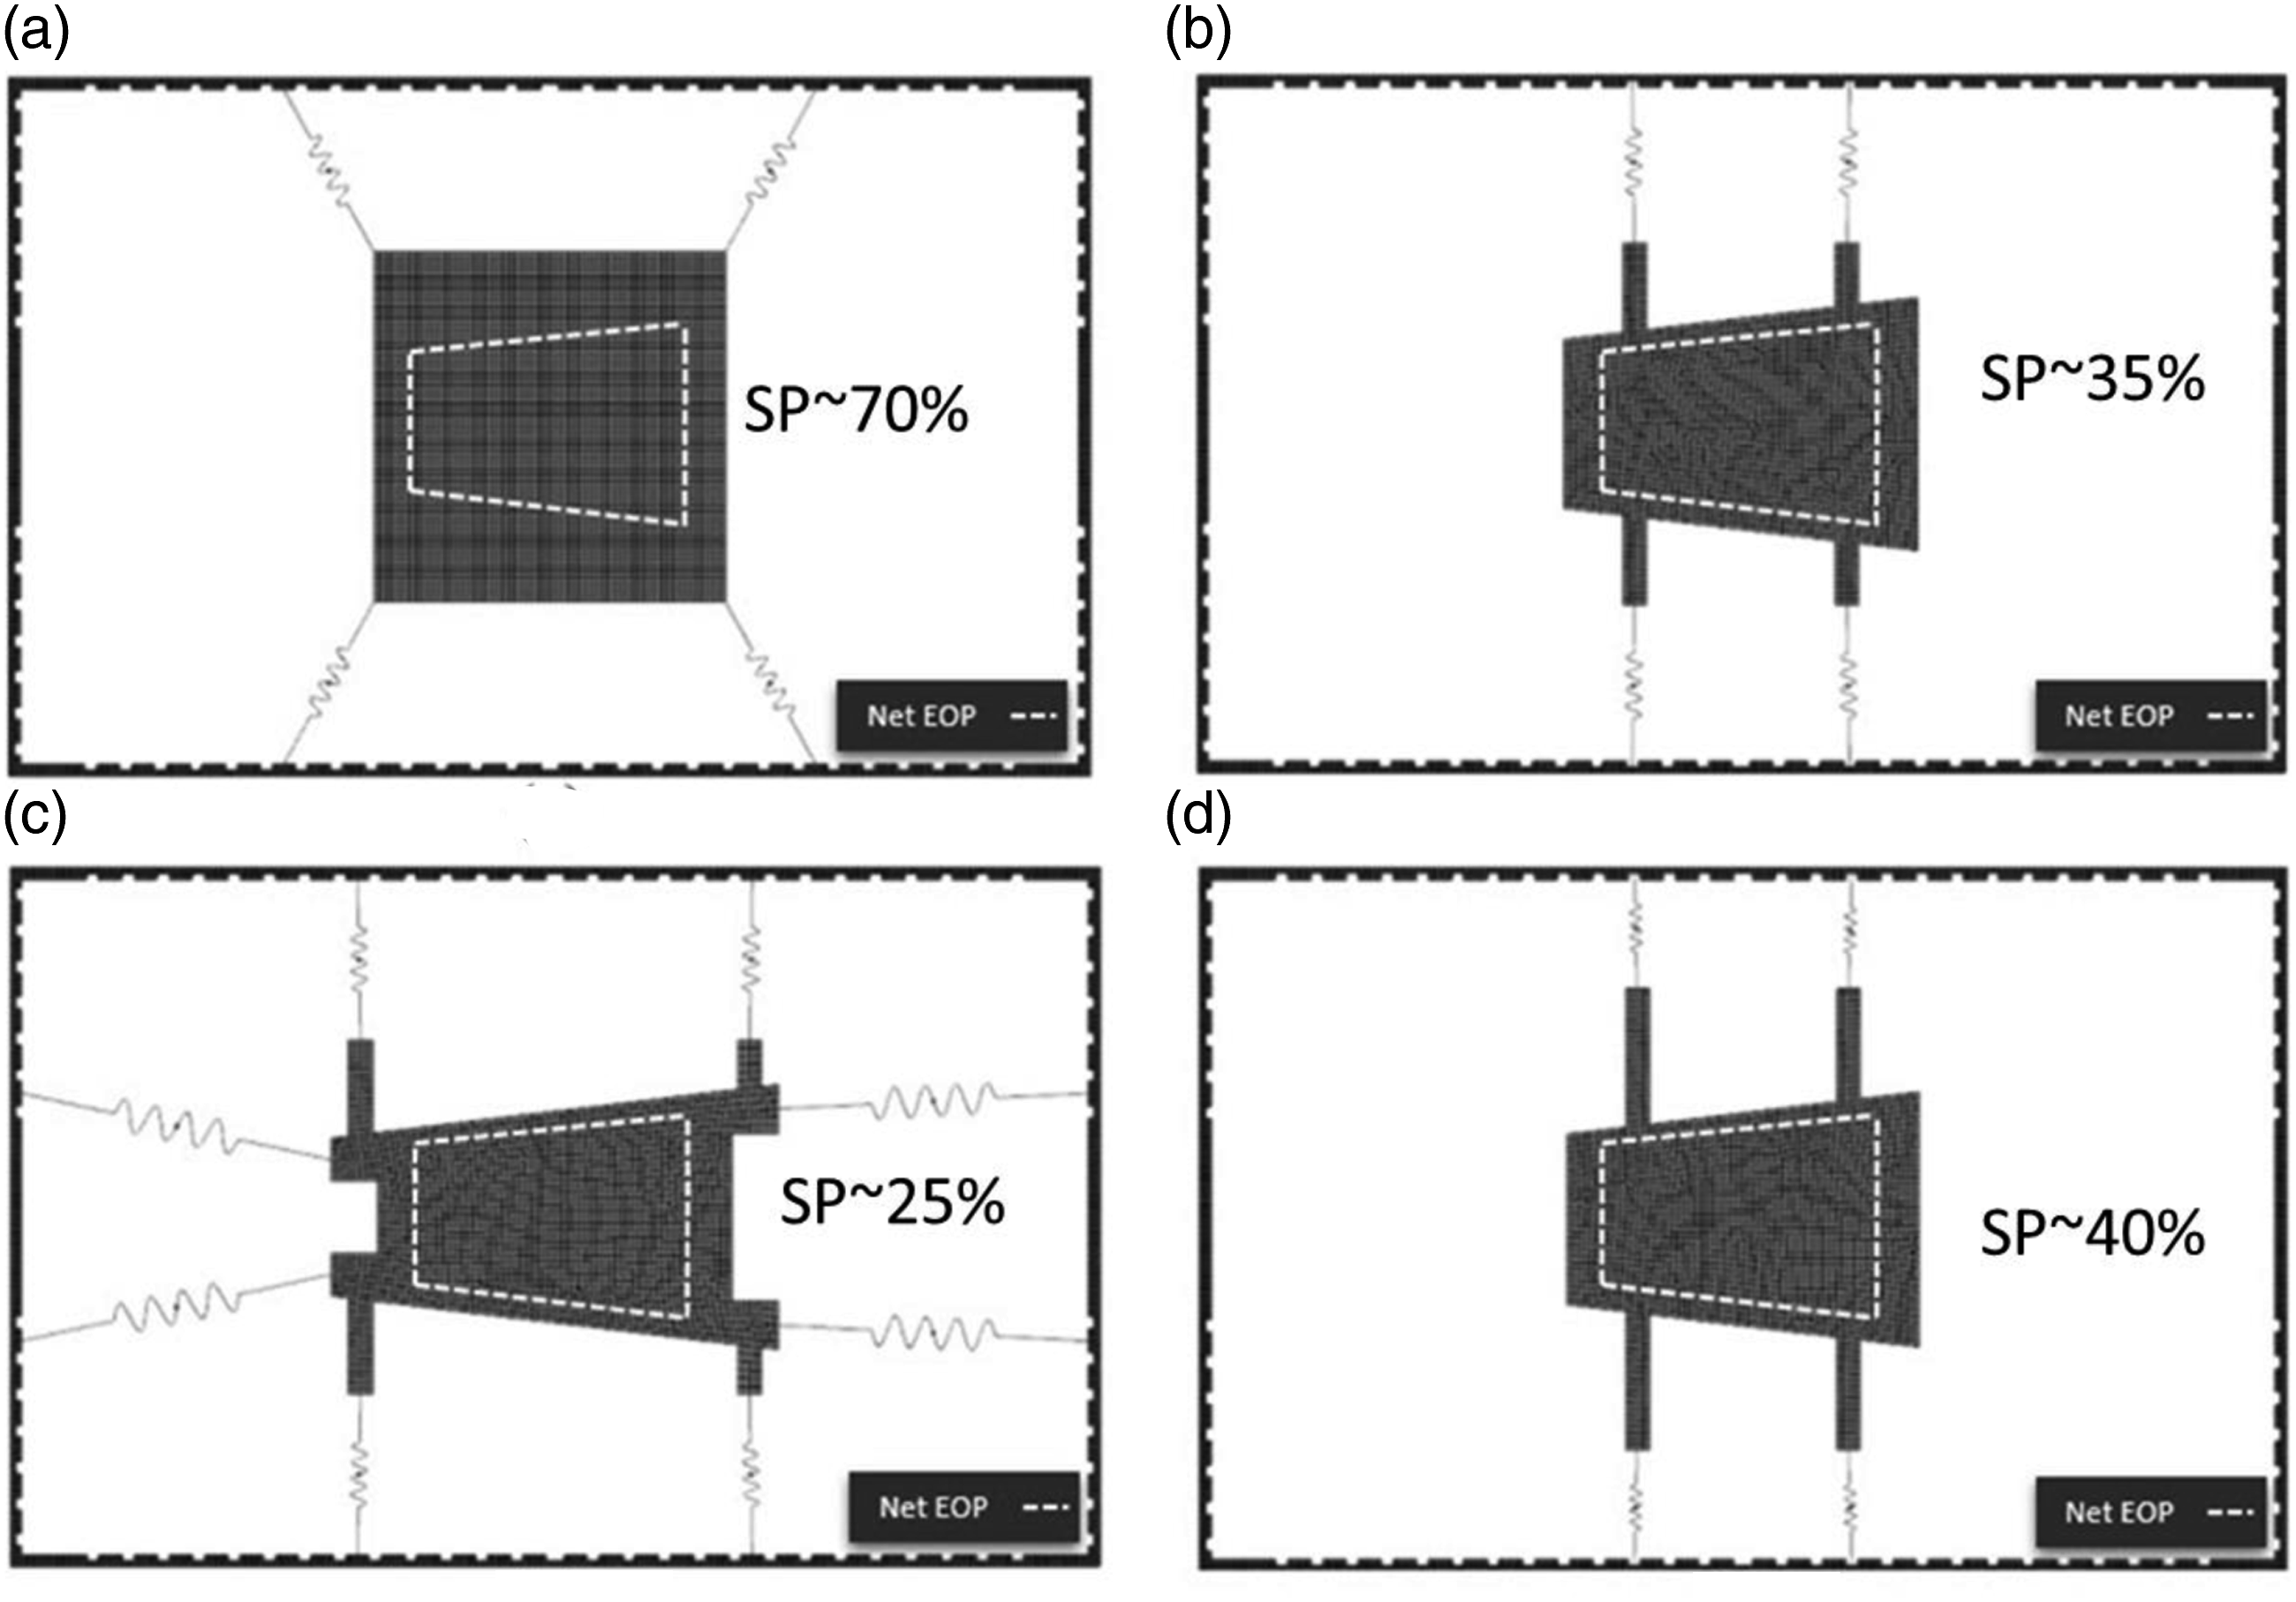
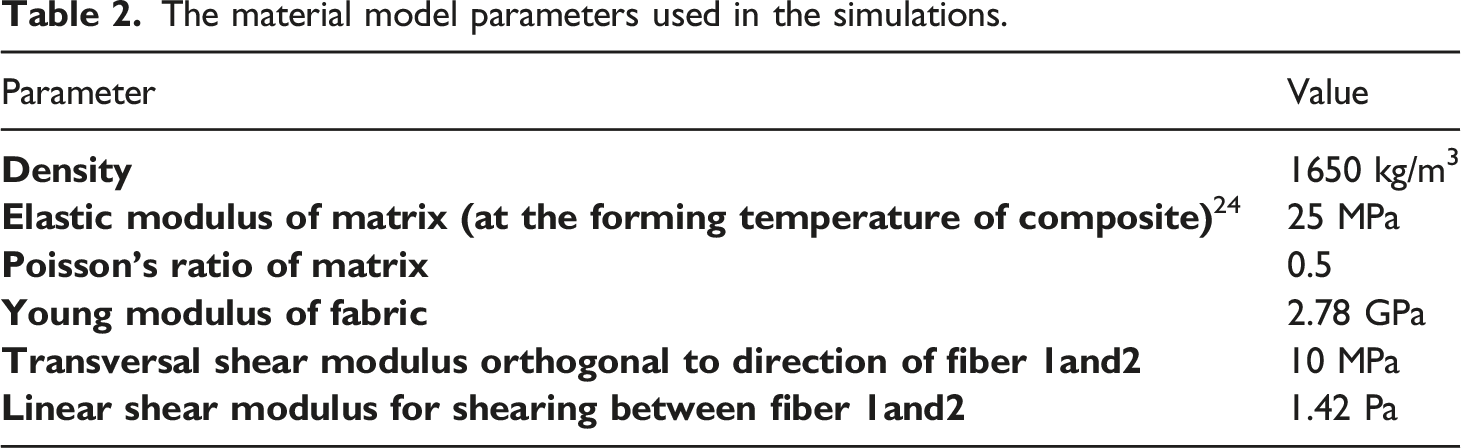
The material model parameters used in the simulations.
Results and Discussion
The force-stroke curve of a bias-extension test is shown in Figure 7a. The dimensions of the fabric test specimen are also shown in the same figure. The details of the calculation of shear modulus in a bias-extension test is given elsewhere.
23
An average shear modulus of 1.42 MPa (1.1–1.8 MPa) was determined from 10 tests on the used fabric. A typical uniaxial tensile stress-strain curve of the same fabric is shown in Figure 7b. An average elastic modulus of 2.75 MPa (2.71–2.84 GPa) was determined out of 12 tests. (a) Force-stroke curve of a bias-extension test and (b) stress-strain curve of a tensile test of the fabric.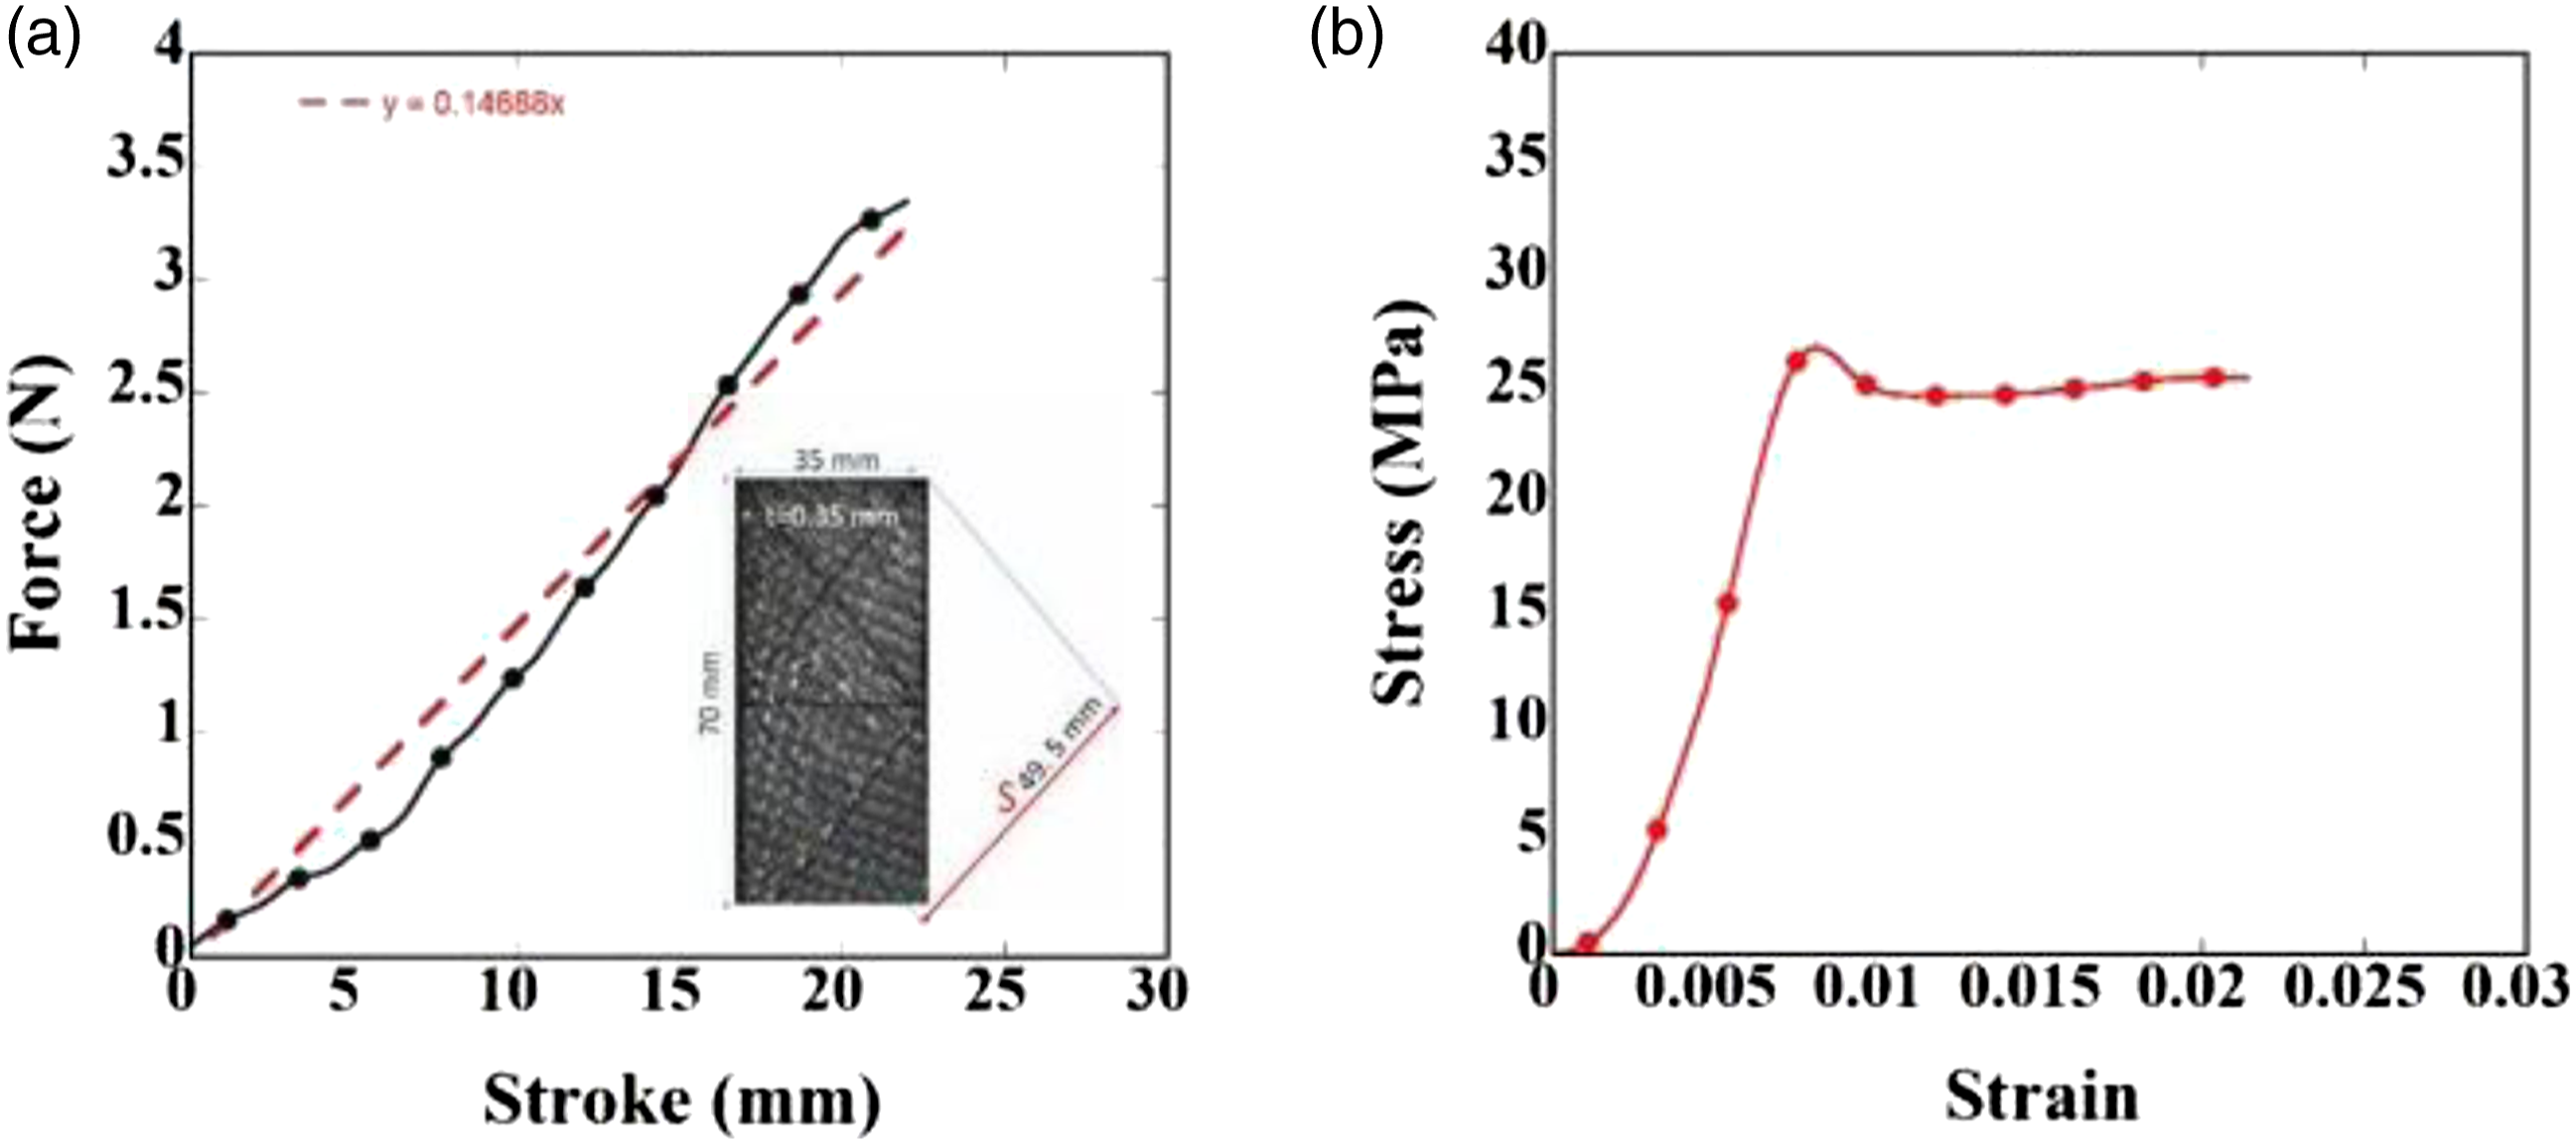
An initial experimental study was performed using blank type 1, which had a basic rectangular structure attached by four spring grippers to the frame. The corresponding regional temperature distributions for the tools according to the heating and cooling conditions were determined by means of thermocouples. A relatively homogeneous temperature distribution (±2°C) is observed in the U-shaped region of the tools (die and punch) as seen in Figure 8, whereas the flat regions showed a much higher temperature difference due to insufficient heating/cooling in these areas. After the thermoforming, the followings were concluded. The contact of excess material with the flat areas engendered sudden temperature changes in the composite sheet. This resulted in fast crystallization, which triggered a rough surface quality. Material jam in the second radius areas (see the inset of Figure 8) prevented the required pressure from being applied on the composite sheet. This induced insufficient re-consolidation in some regions. And finally, a considerable amount of composite material, with a very high cost, was wasted by using blank type 1. Time dependent composite temperature during the thermoforming process.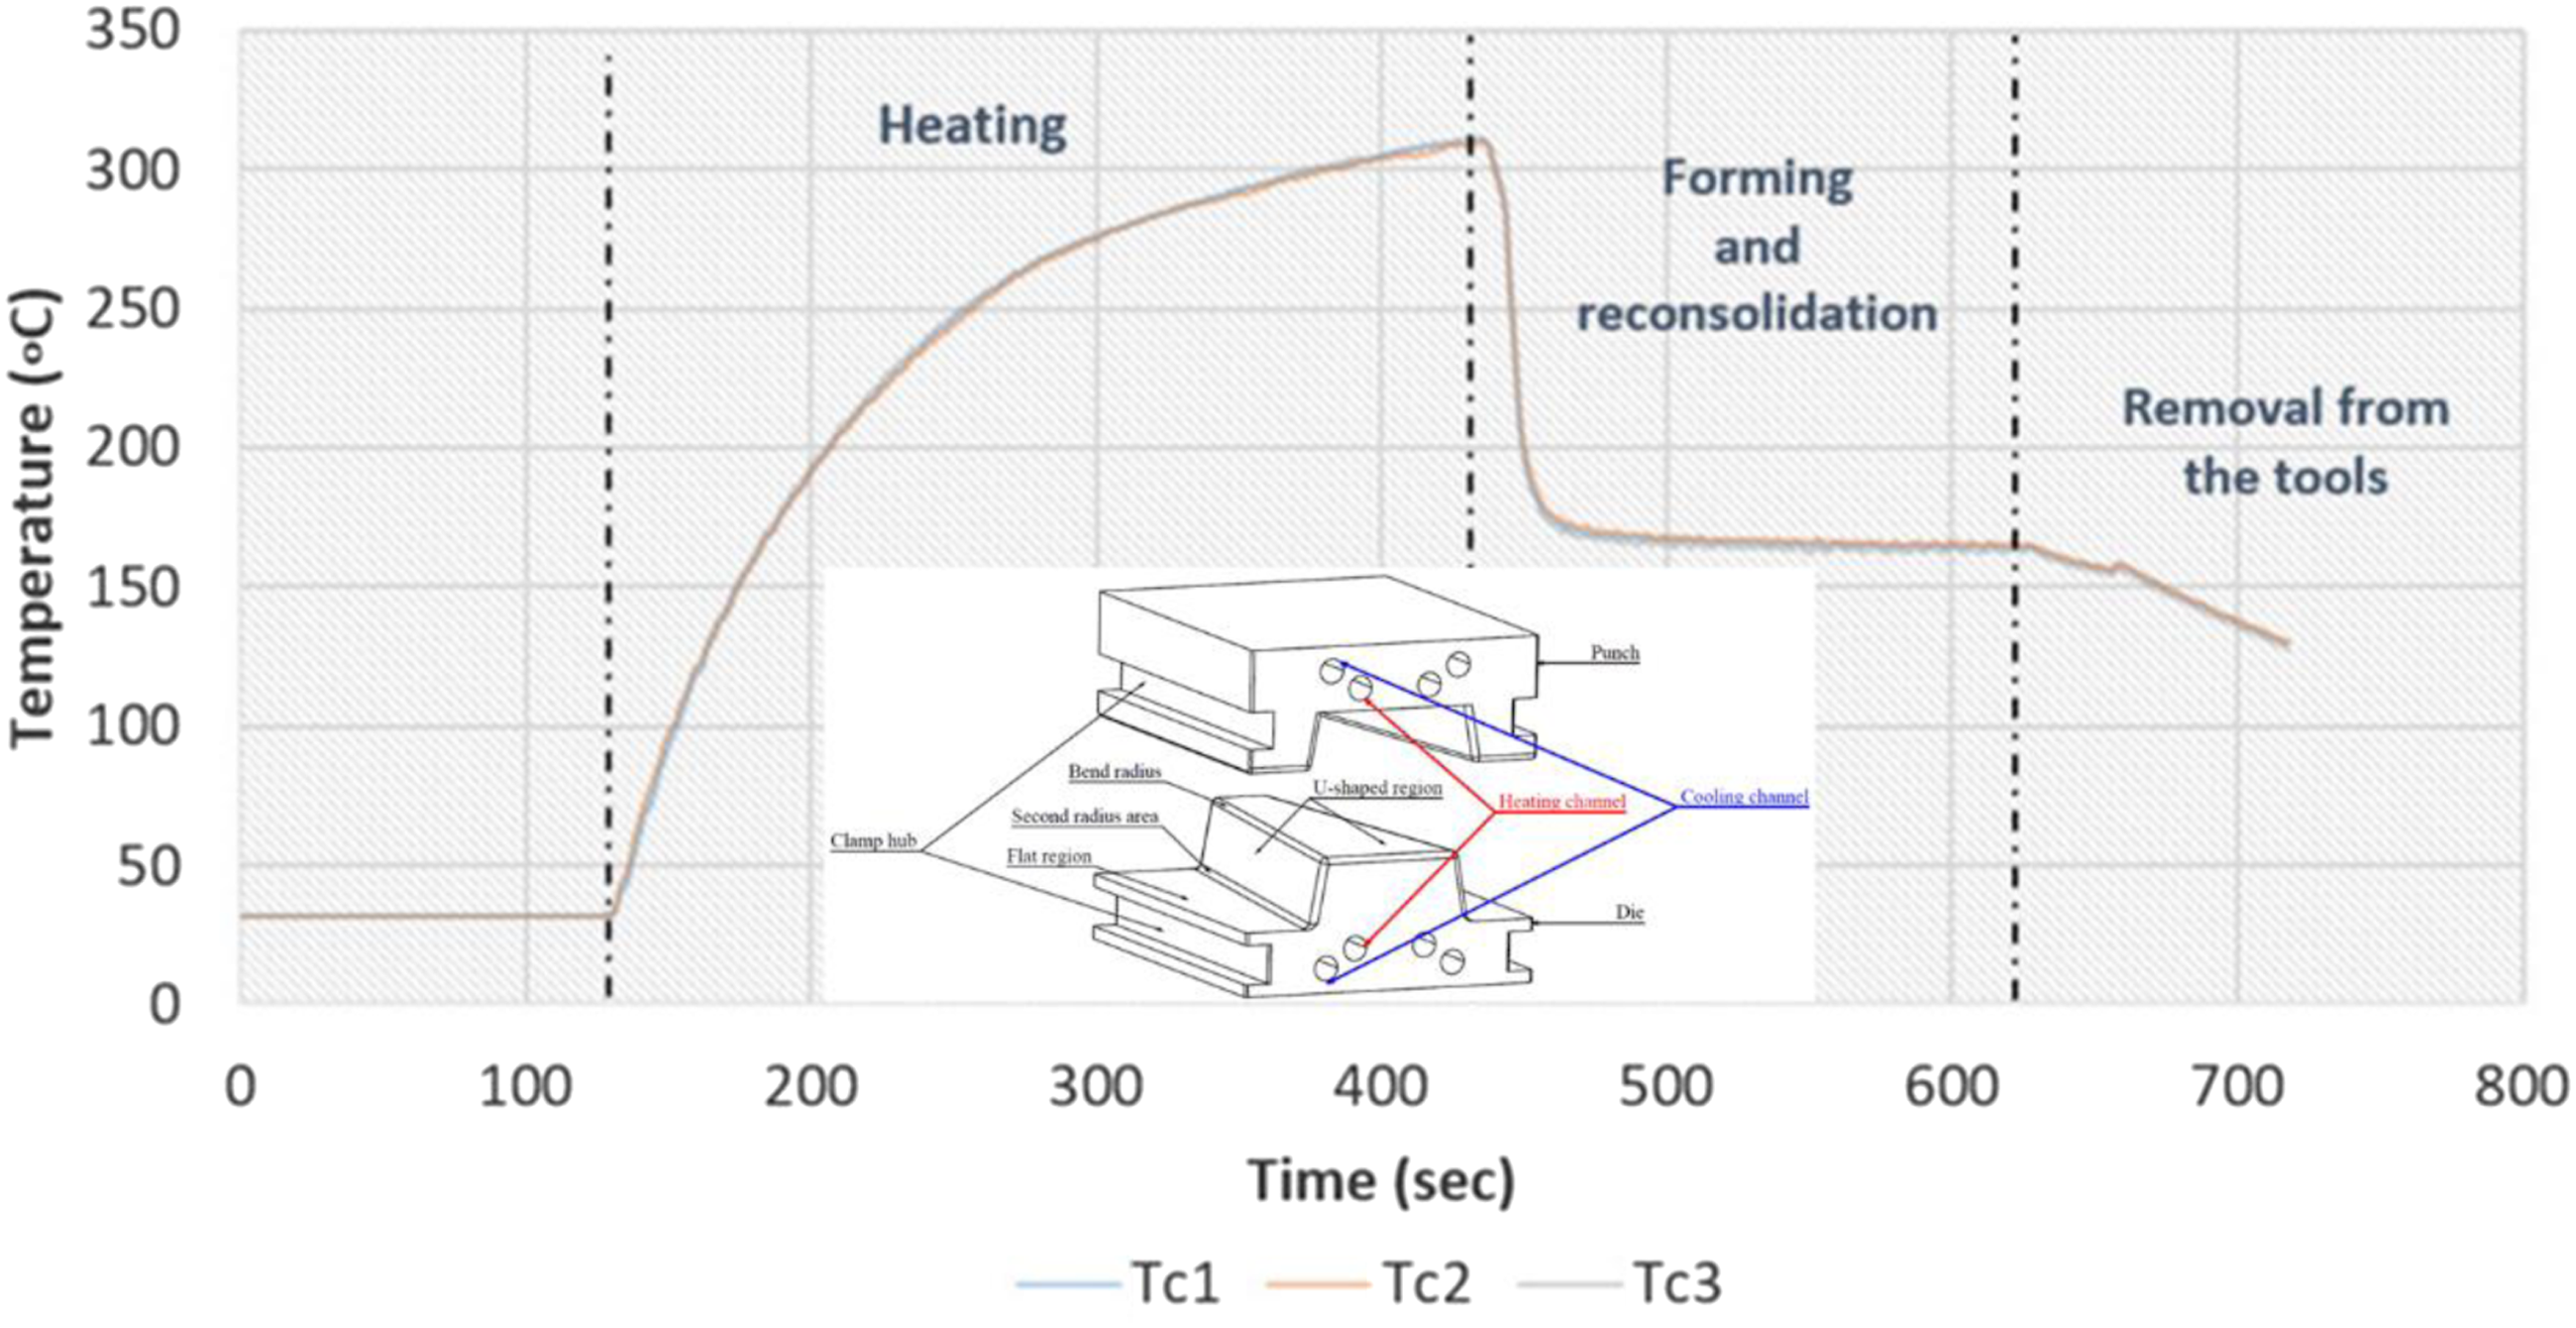
It was important to ensure that when the tool was completely closed, the edges of the composite sheet remained within the U-shaped region, which had a relatively homogeneous temperature distribution. In this way, the contact of the composite with the flat regions that could not be heated homogeneously was prevented. Material jamming, which was another important problem, was eliminated by designing the blank in such a way that excess material did not reach the second radius where a jam would occur when the punch was fully closed. These significantly reduced the amount of material (scrap) that needed to be trimmed after the process. The approximate scrap percentages (SPs) of the investigated type 1, type 2, type 3, and type 4 blanks are shown in Figures 6(a) to (d), respectively. Blank type 1 has the highest SP (70%) and blank type 3 has the lowest SP (25%). Blank types 2 and type 4 have 35 and 40% SPs, respectively.
A previous study has shown that the punch speed affected the thermoforming process.
31
Initial thermoforming simulations were performed with the punch speed ranging 1–20 mm/s at a constant tool temperature (160°C) and a constant composite sheet temperature (315°C). The effect of the punch speed on the cooling of PPS sheet is shown in Figure 9a. As the punch speed increases, the cooling of the sheet during forming decreases. The effects of the punch speed on the von Mises stress of four blank types are shown in Figure 9b. As is seen, the von Misses stresses of blank types 1, 2, and 4 are constant and very much similar to each other until about 14 mm/s. After this punch speed, the stress increases rapidly in blank type 1 and type 4. The lower punch speed is expected to culminate better draping since the decrease in the forming speed also reduces the viscous forces acting on the composite. On the other hand, the temperature of the composite sheet should not be fall below the melting point of the thermoplastic matrix. By considering both cooling and the stress on the sheet, a punch speed of 14 mm/s was selected in present study for the thermoforming simulations. The effects of spring coefficient on the von Misses stresses of the blanks investigated at constant tool temperature (160°C), sheet temperature (315°C) and punch speed (14 mm/s) are shown in Figure 9c. The von Misses stresses shown in the same figure are lowest between 0.2–0.3 N/mm spring constants. Lower and higher spring constants result in increase in the stress as noted in Figure 9c. The optimum spring coefficient was determined 0.25 N/mm as an average for all blank configurations. The effect of punch speed on the (a) cooling of composite sheet and (b) von Mises stress and the effect of spring coefficient on von Mises stress.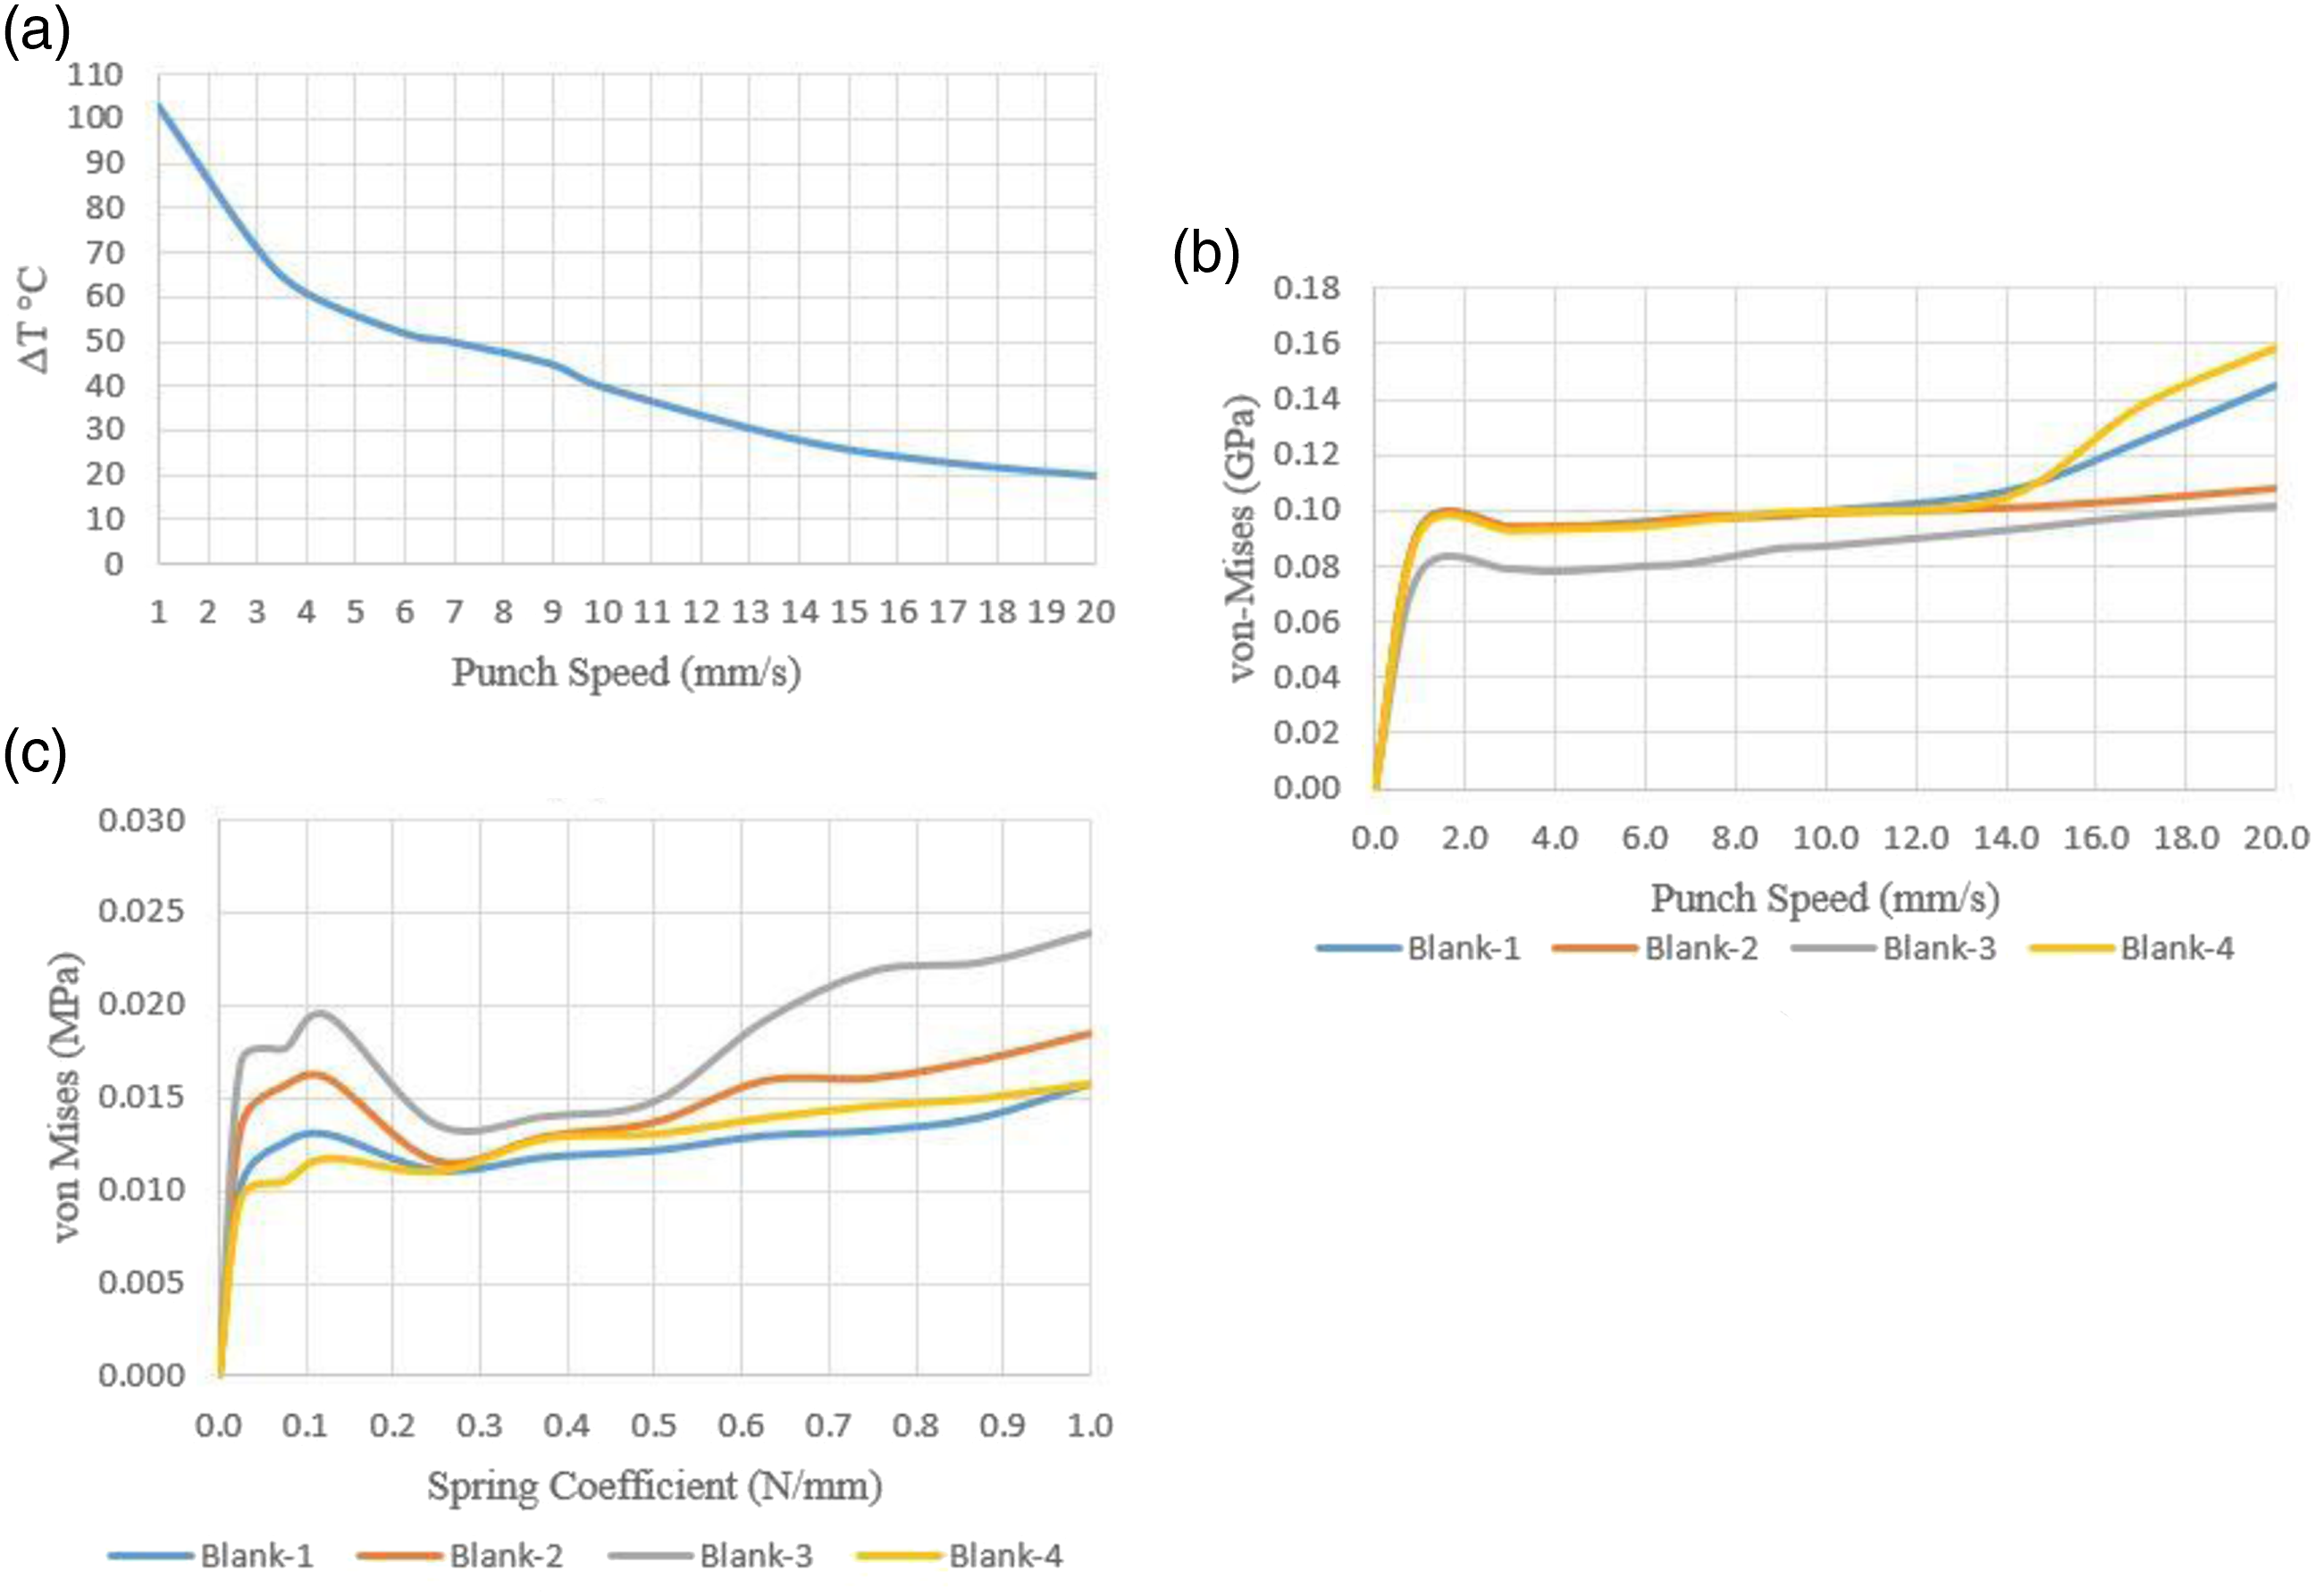
The validation of forming analysis is important regarding the reliability of the used material model. In order to compare the results of simulations, experiments were conducted using the optimized process parameters (see Table 1). Figures 10a and (b) show the numerically formed geometry with the net EOP and trimmed final geometry, respectively. The weft and warp directions in the formed geometry in Figure 10a are represented by 1 and 2, respectively. (a) Numerically formed geometry with net EOP and (b) trimmed final geometry.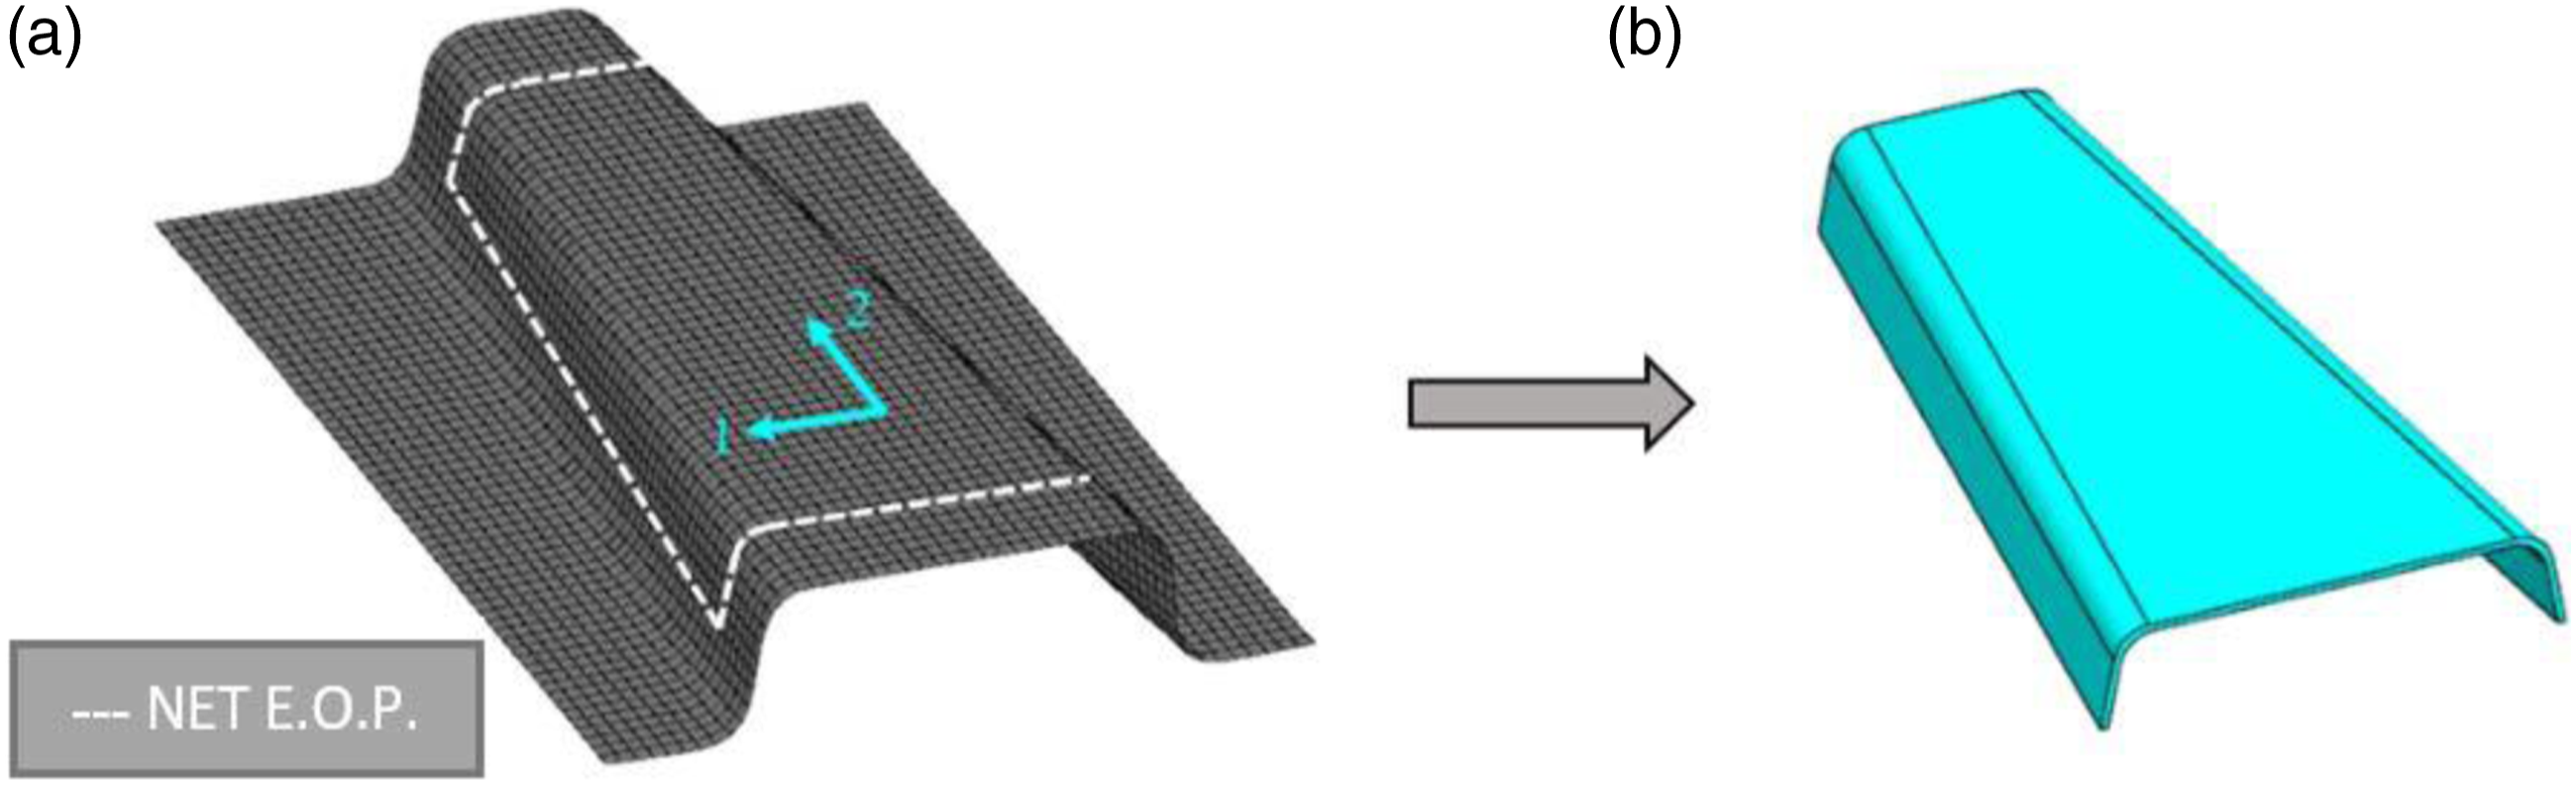
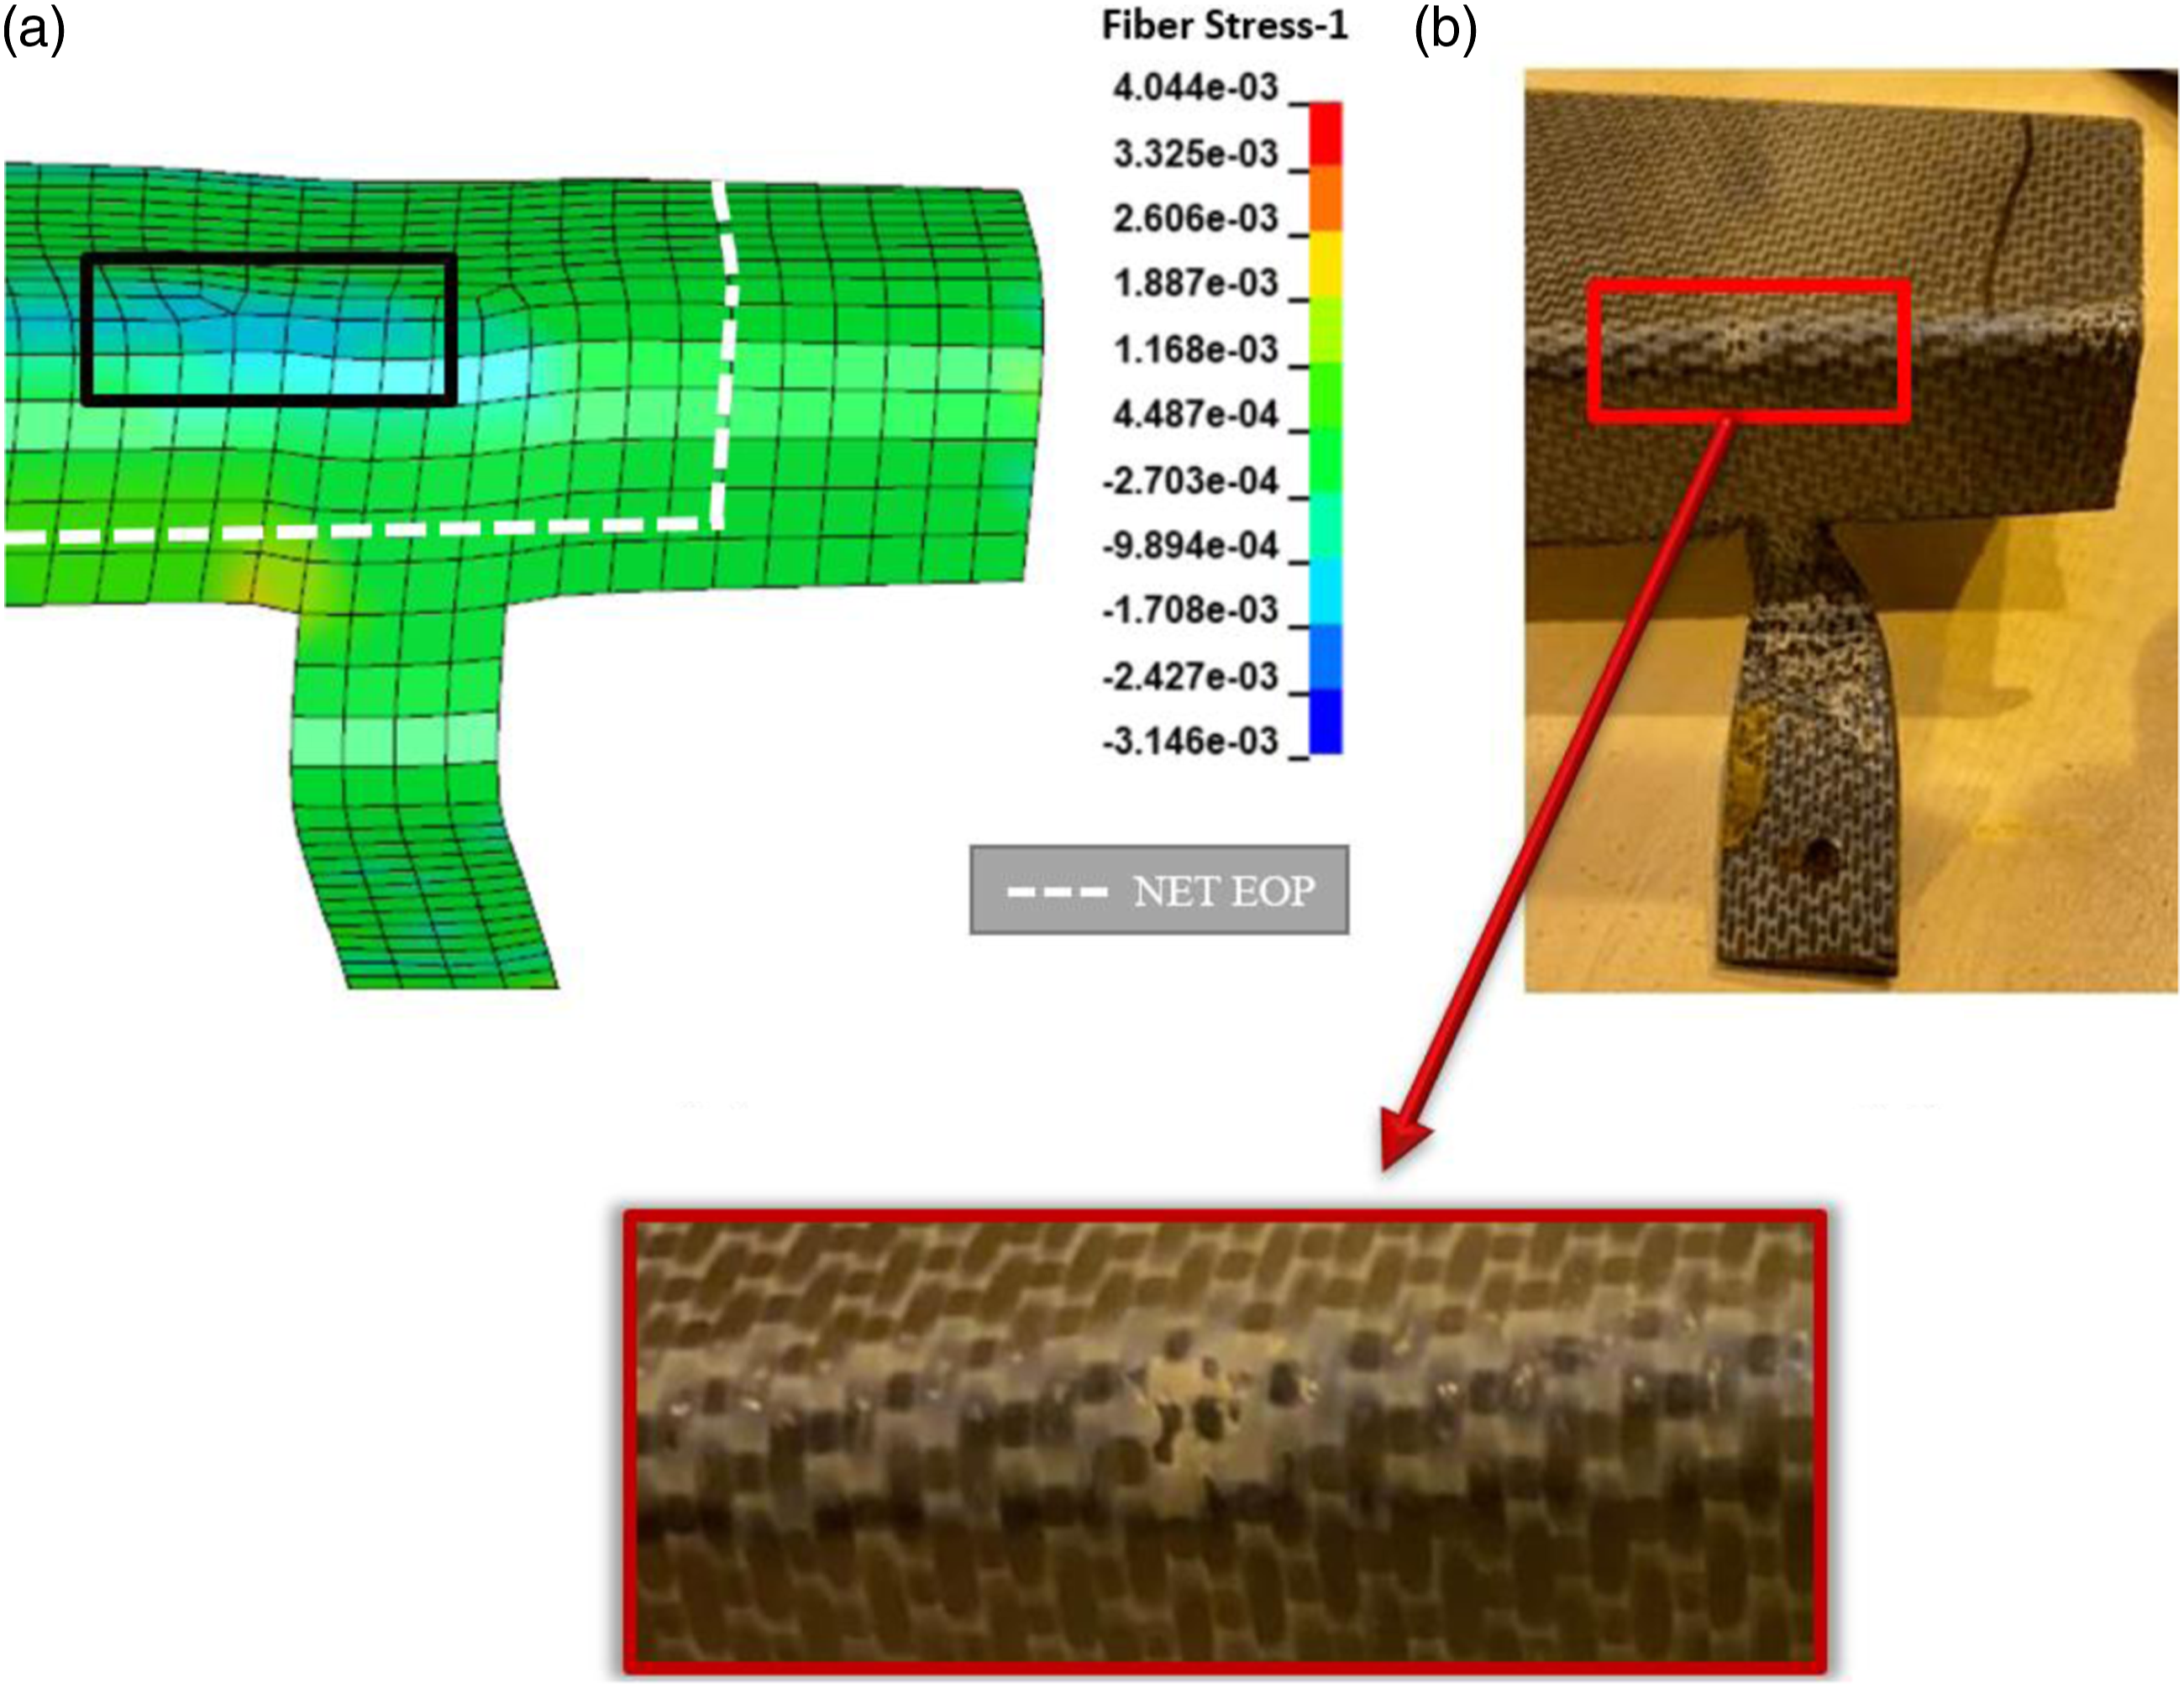
Figures 11a and (b) show the numerically and experimentally formed geometries of blank type 1, respectively. A balance stress distribution on the numerically formed part is clearly seen in Figure 11a. However, highly rough and low-quality surfaces were obtained experimentally (Figure 11b). Figures 12a and (b) show the numerically and experimentally formed geometries of blank type 2 (four opposing springs in the fiber direction 1), respectively. The experimentally produced part has resin squeeze-out defects on certain section of the bend radius area as shown in Figure 12b, marked with a red rectangle. The resin squeeze-out regions are also detected in the numerically deformed geometry, as marked by a rectangle in Figure 12b. As seen in the same figure, a compressive stress develops in the squeeze-out regions. Resin squeeze-out form in the regions of high fiber stress regions such as rounded edges and may lead to fiber breakage.
32
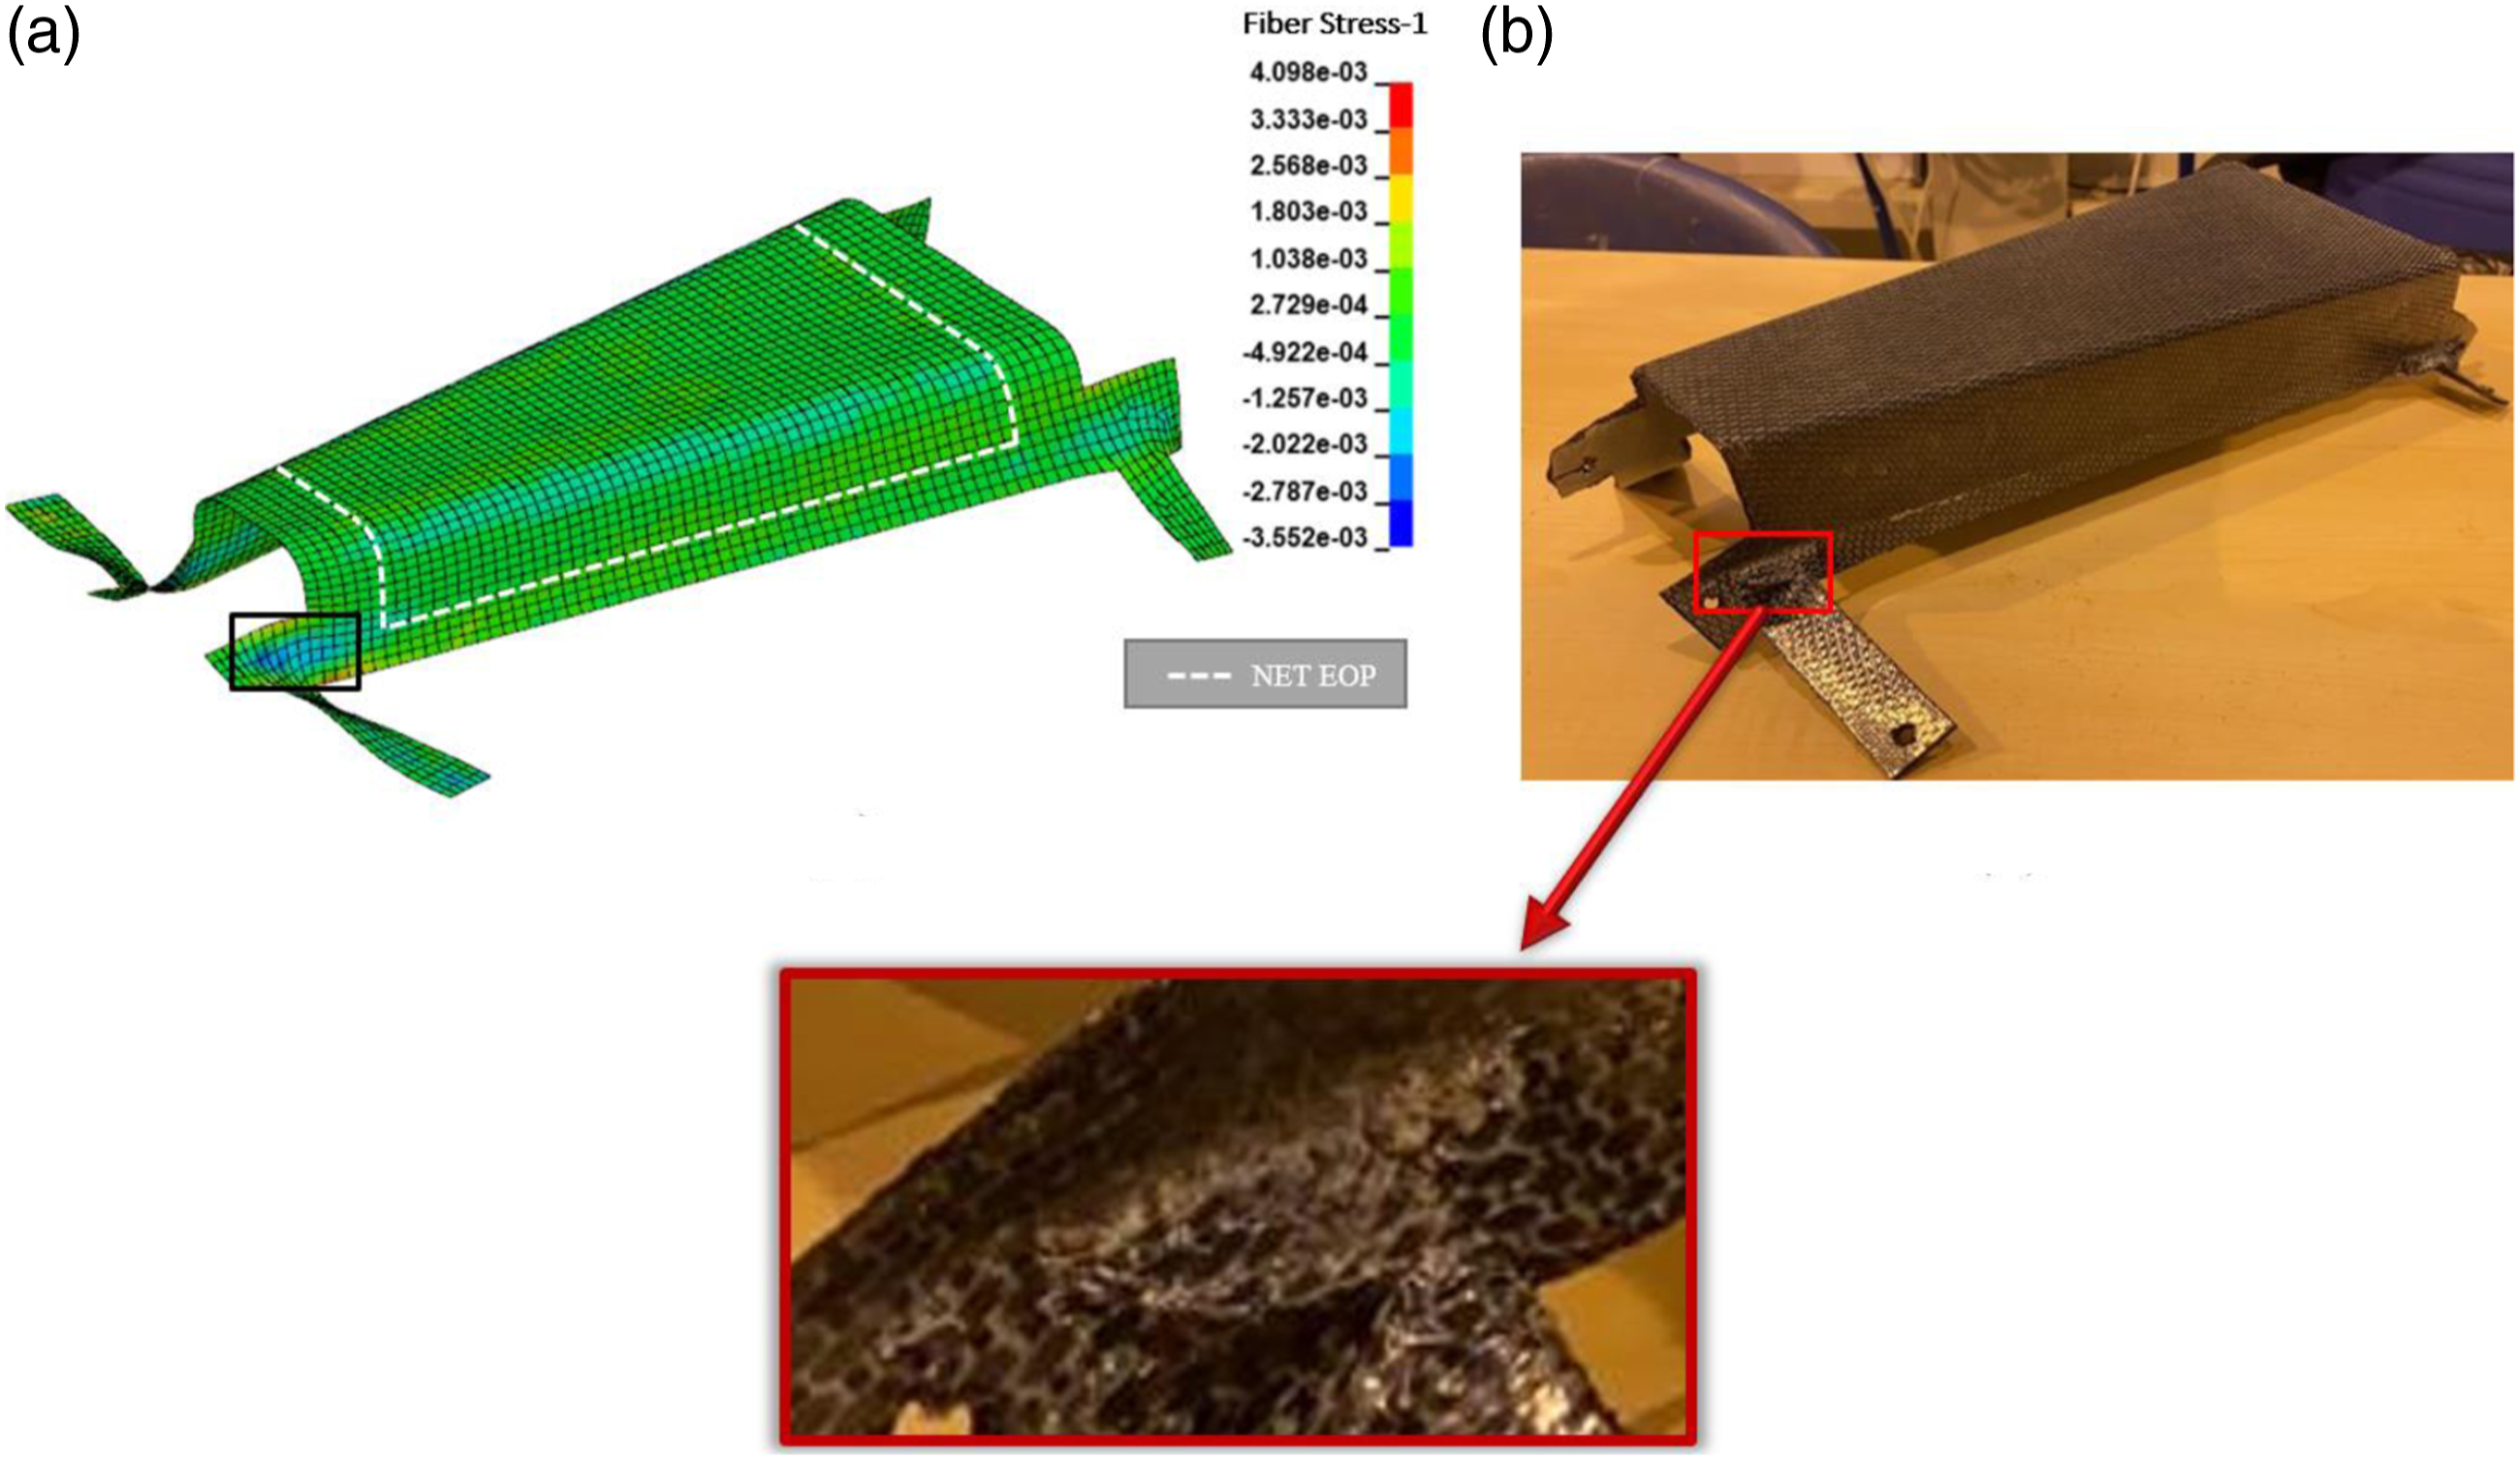
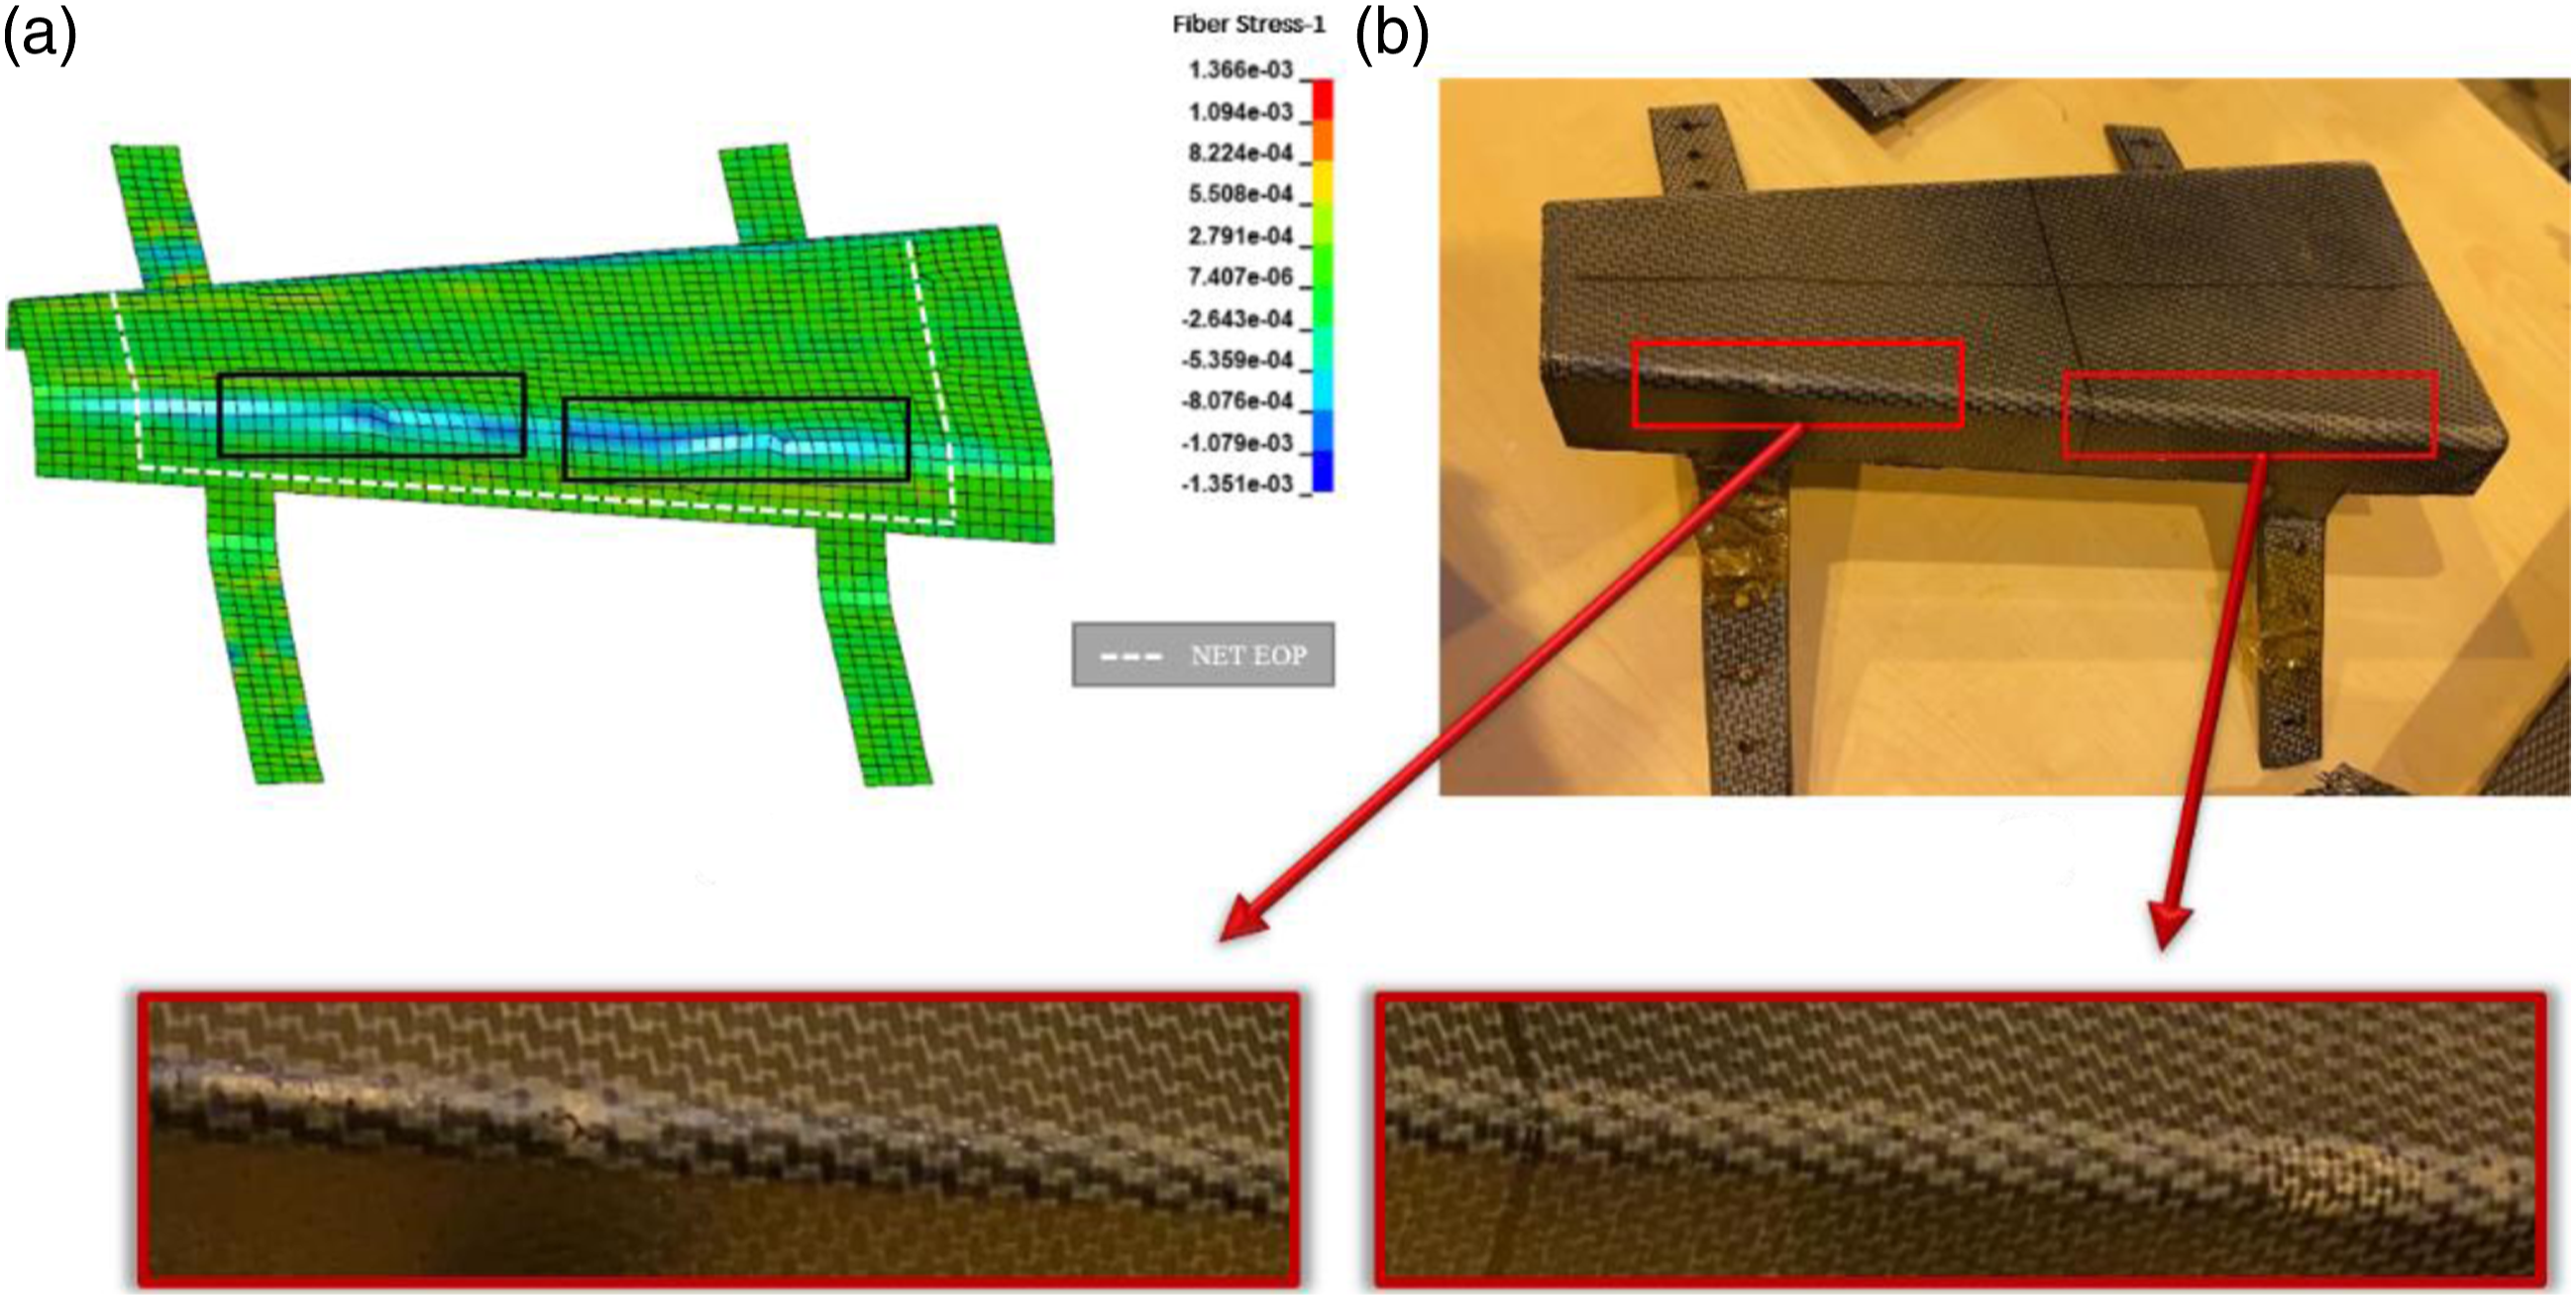
In blank type 3, in which the blank attached with eight springs both fiber directions, a balanced stress distribution is seen numerically in the net EOP, Figure 13a. As is expected, the maximum stress occurs in the lug regions. As with the numerical model, the experimental maximum stress also occurs in the lug regions, Figure 13b. The numerically and experimentally formed shapes of blank type 3 are found to be very similar to each other. Blank type 4 had a similar geometry with blank type 2 and the blank was attached by four spring grippers located in the lugs. Similar to blank type 2, blank type 4 exhibits both numerically and experimentally high stress concentration regions on the bend radius, leading to resin squeeze-out as depicted in Figures 14a and (b), respectively. The pictures of shaped geometries of blank type 1: (a) simulation and (b) experiment. The pictures of shaped geometries of blank type 2: (a) simulation and (b) experiment. The pictures of shaped geometries of blank type 3: (a) simulation and (b) experiment. The pictures of shaped geometries of blank type 4: (a) simulation and (b) experiment.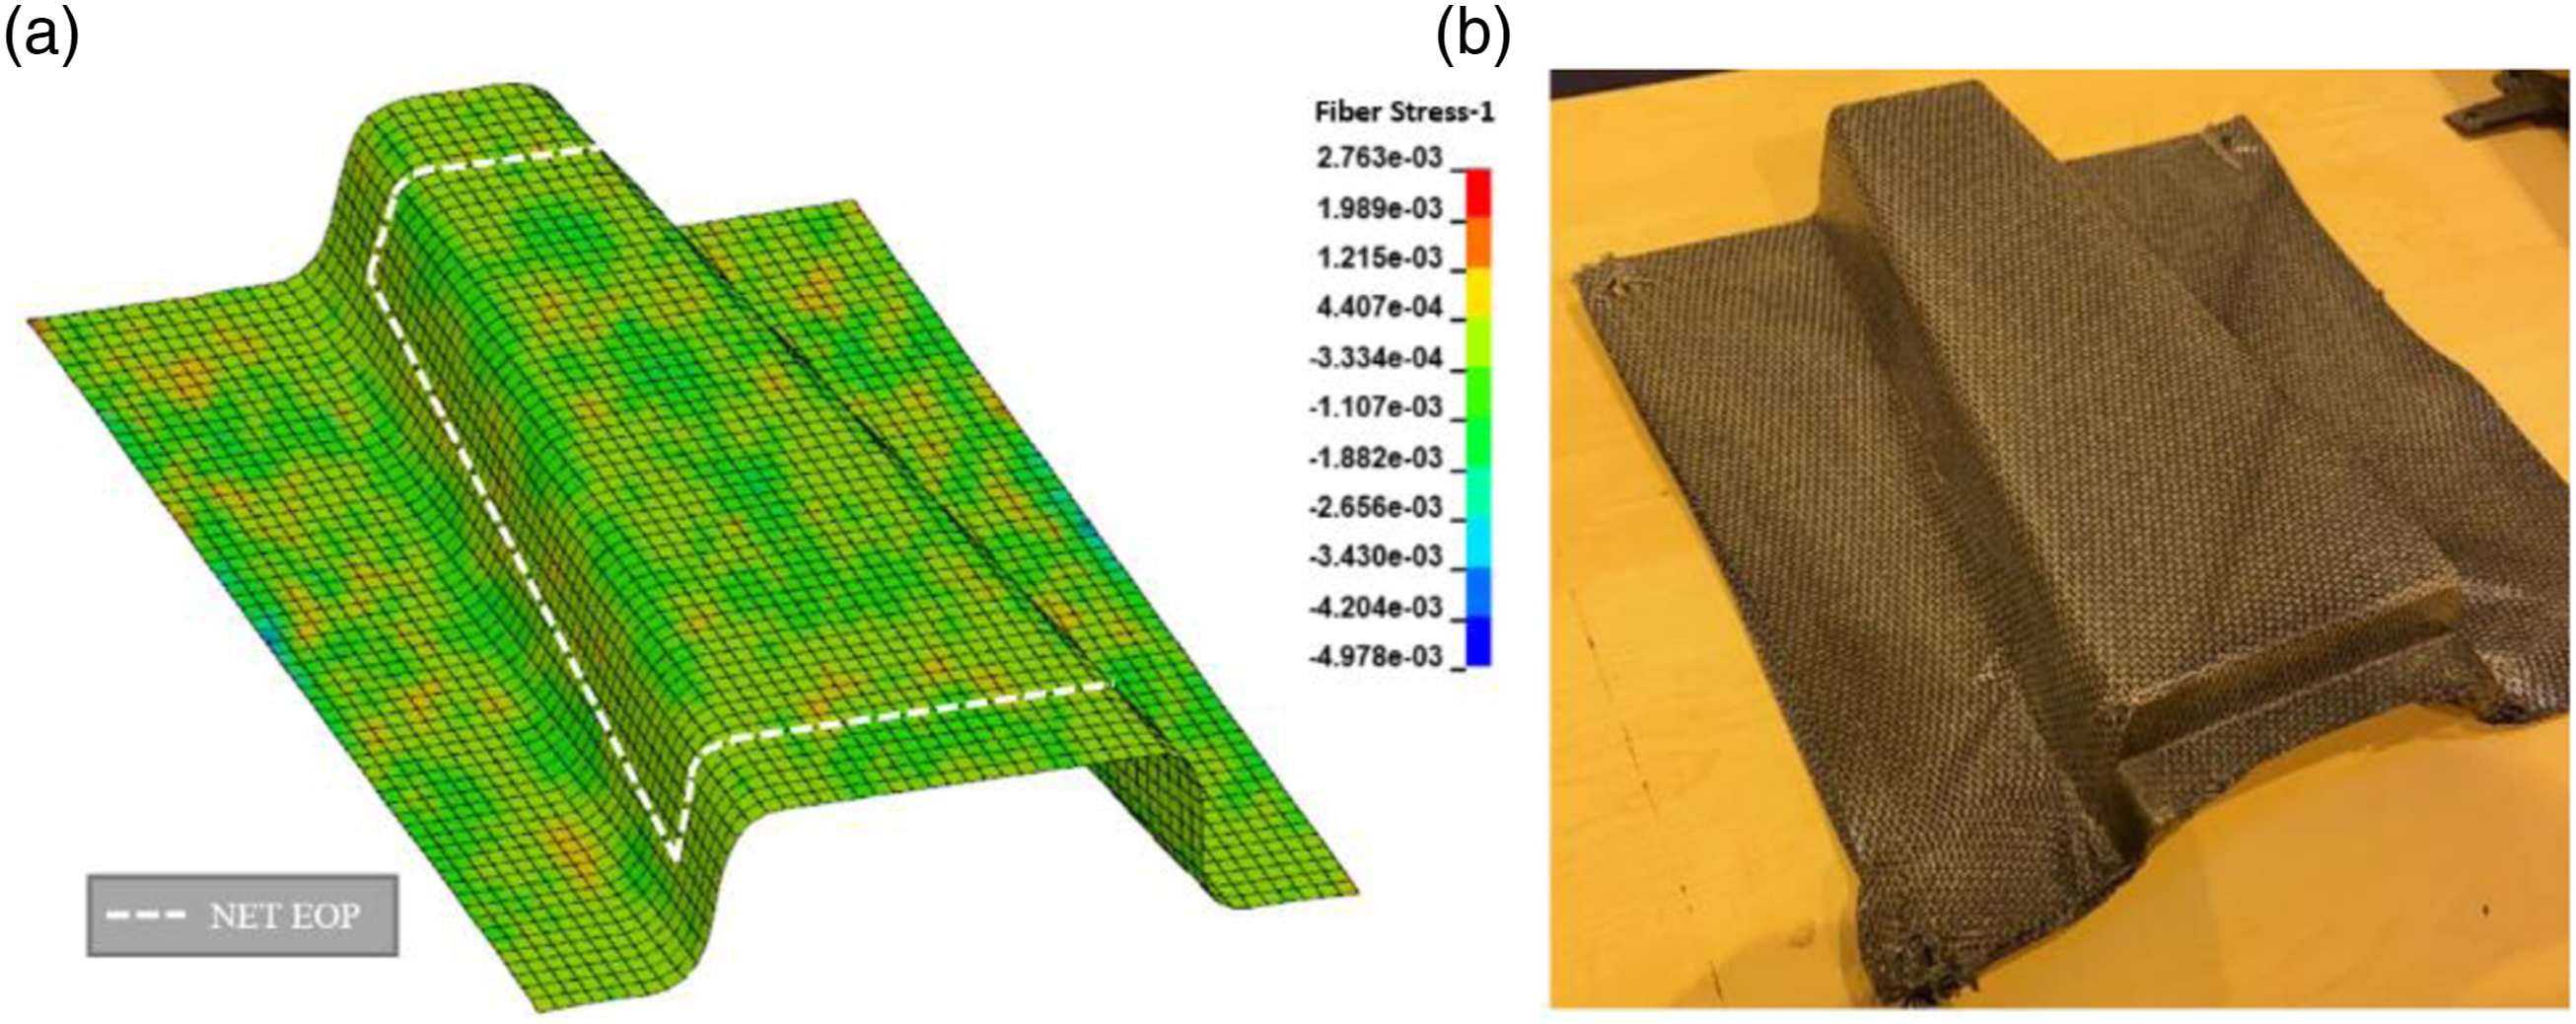
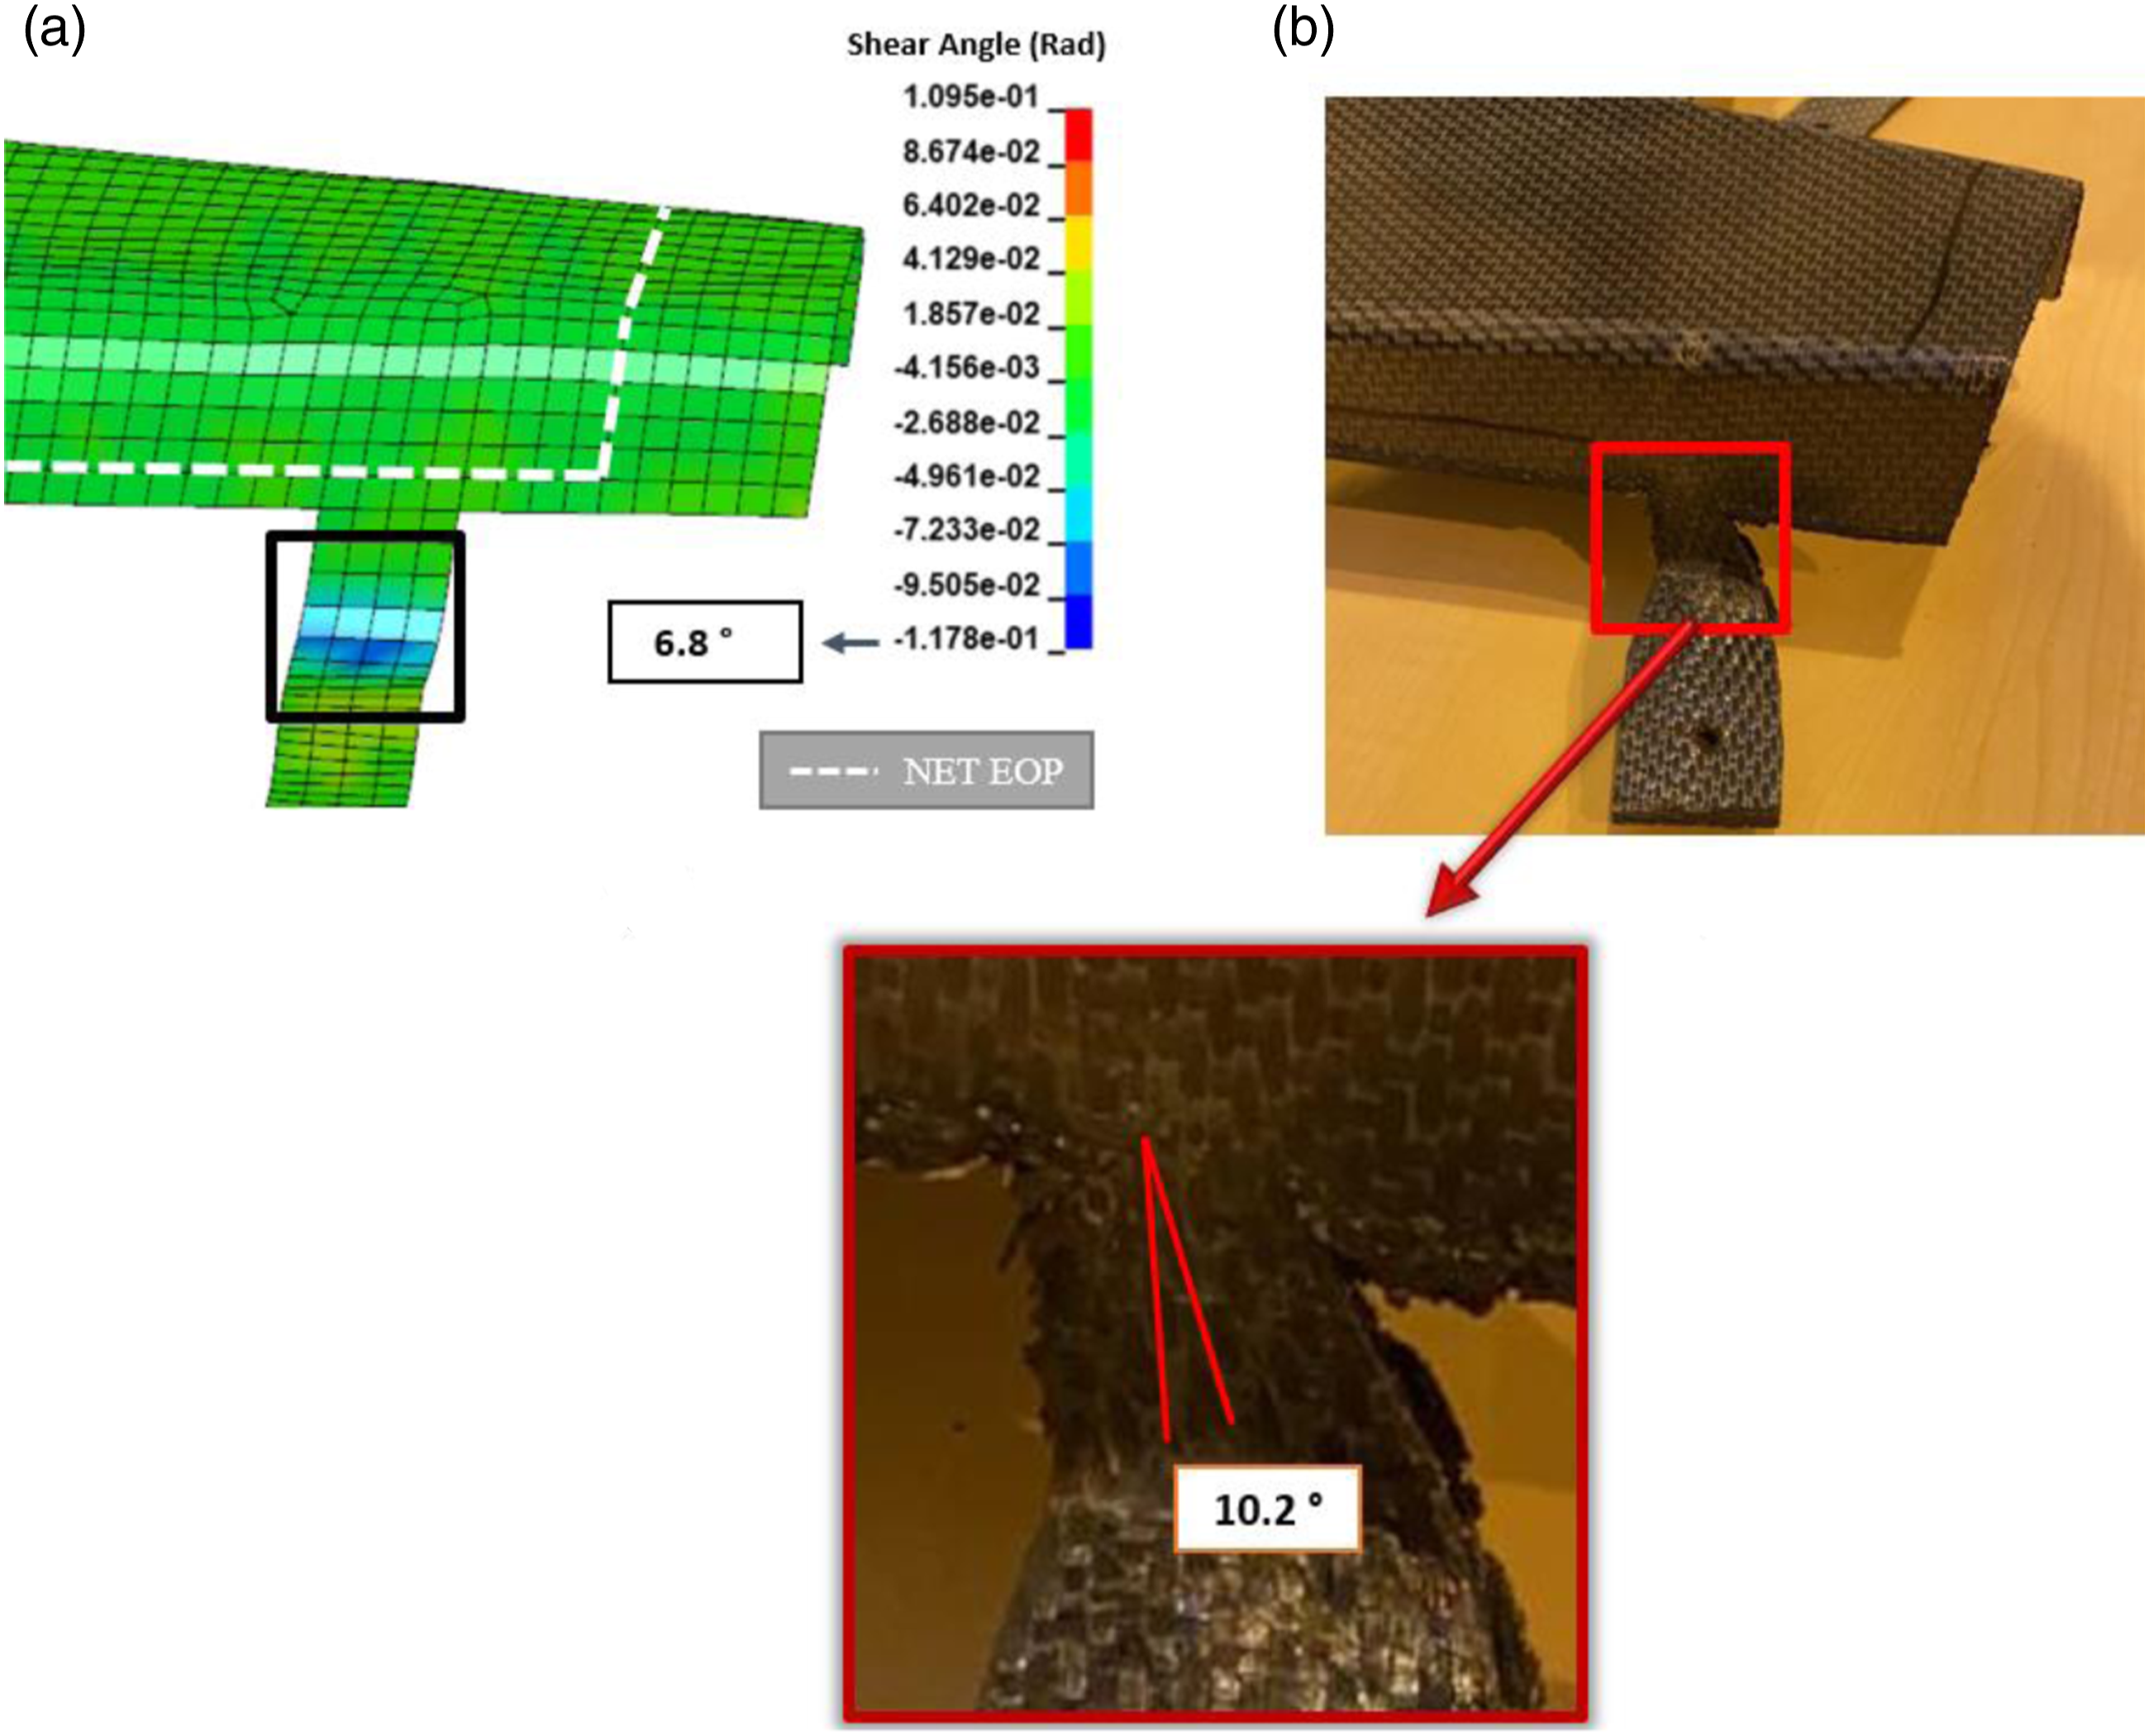
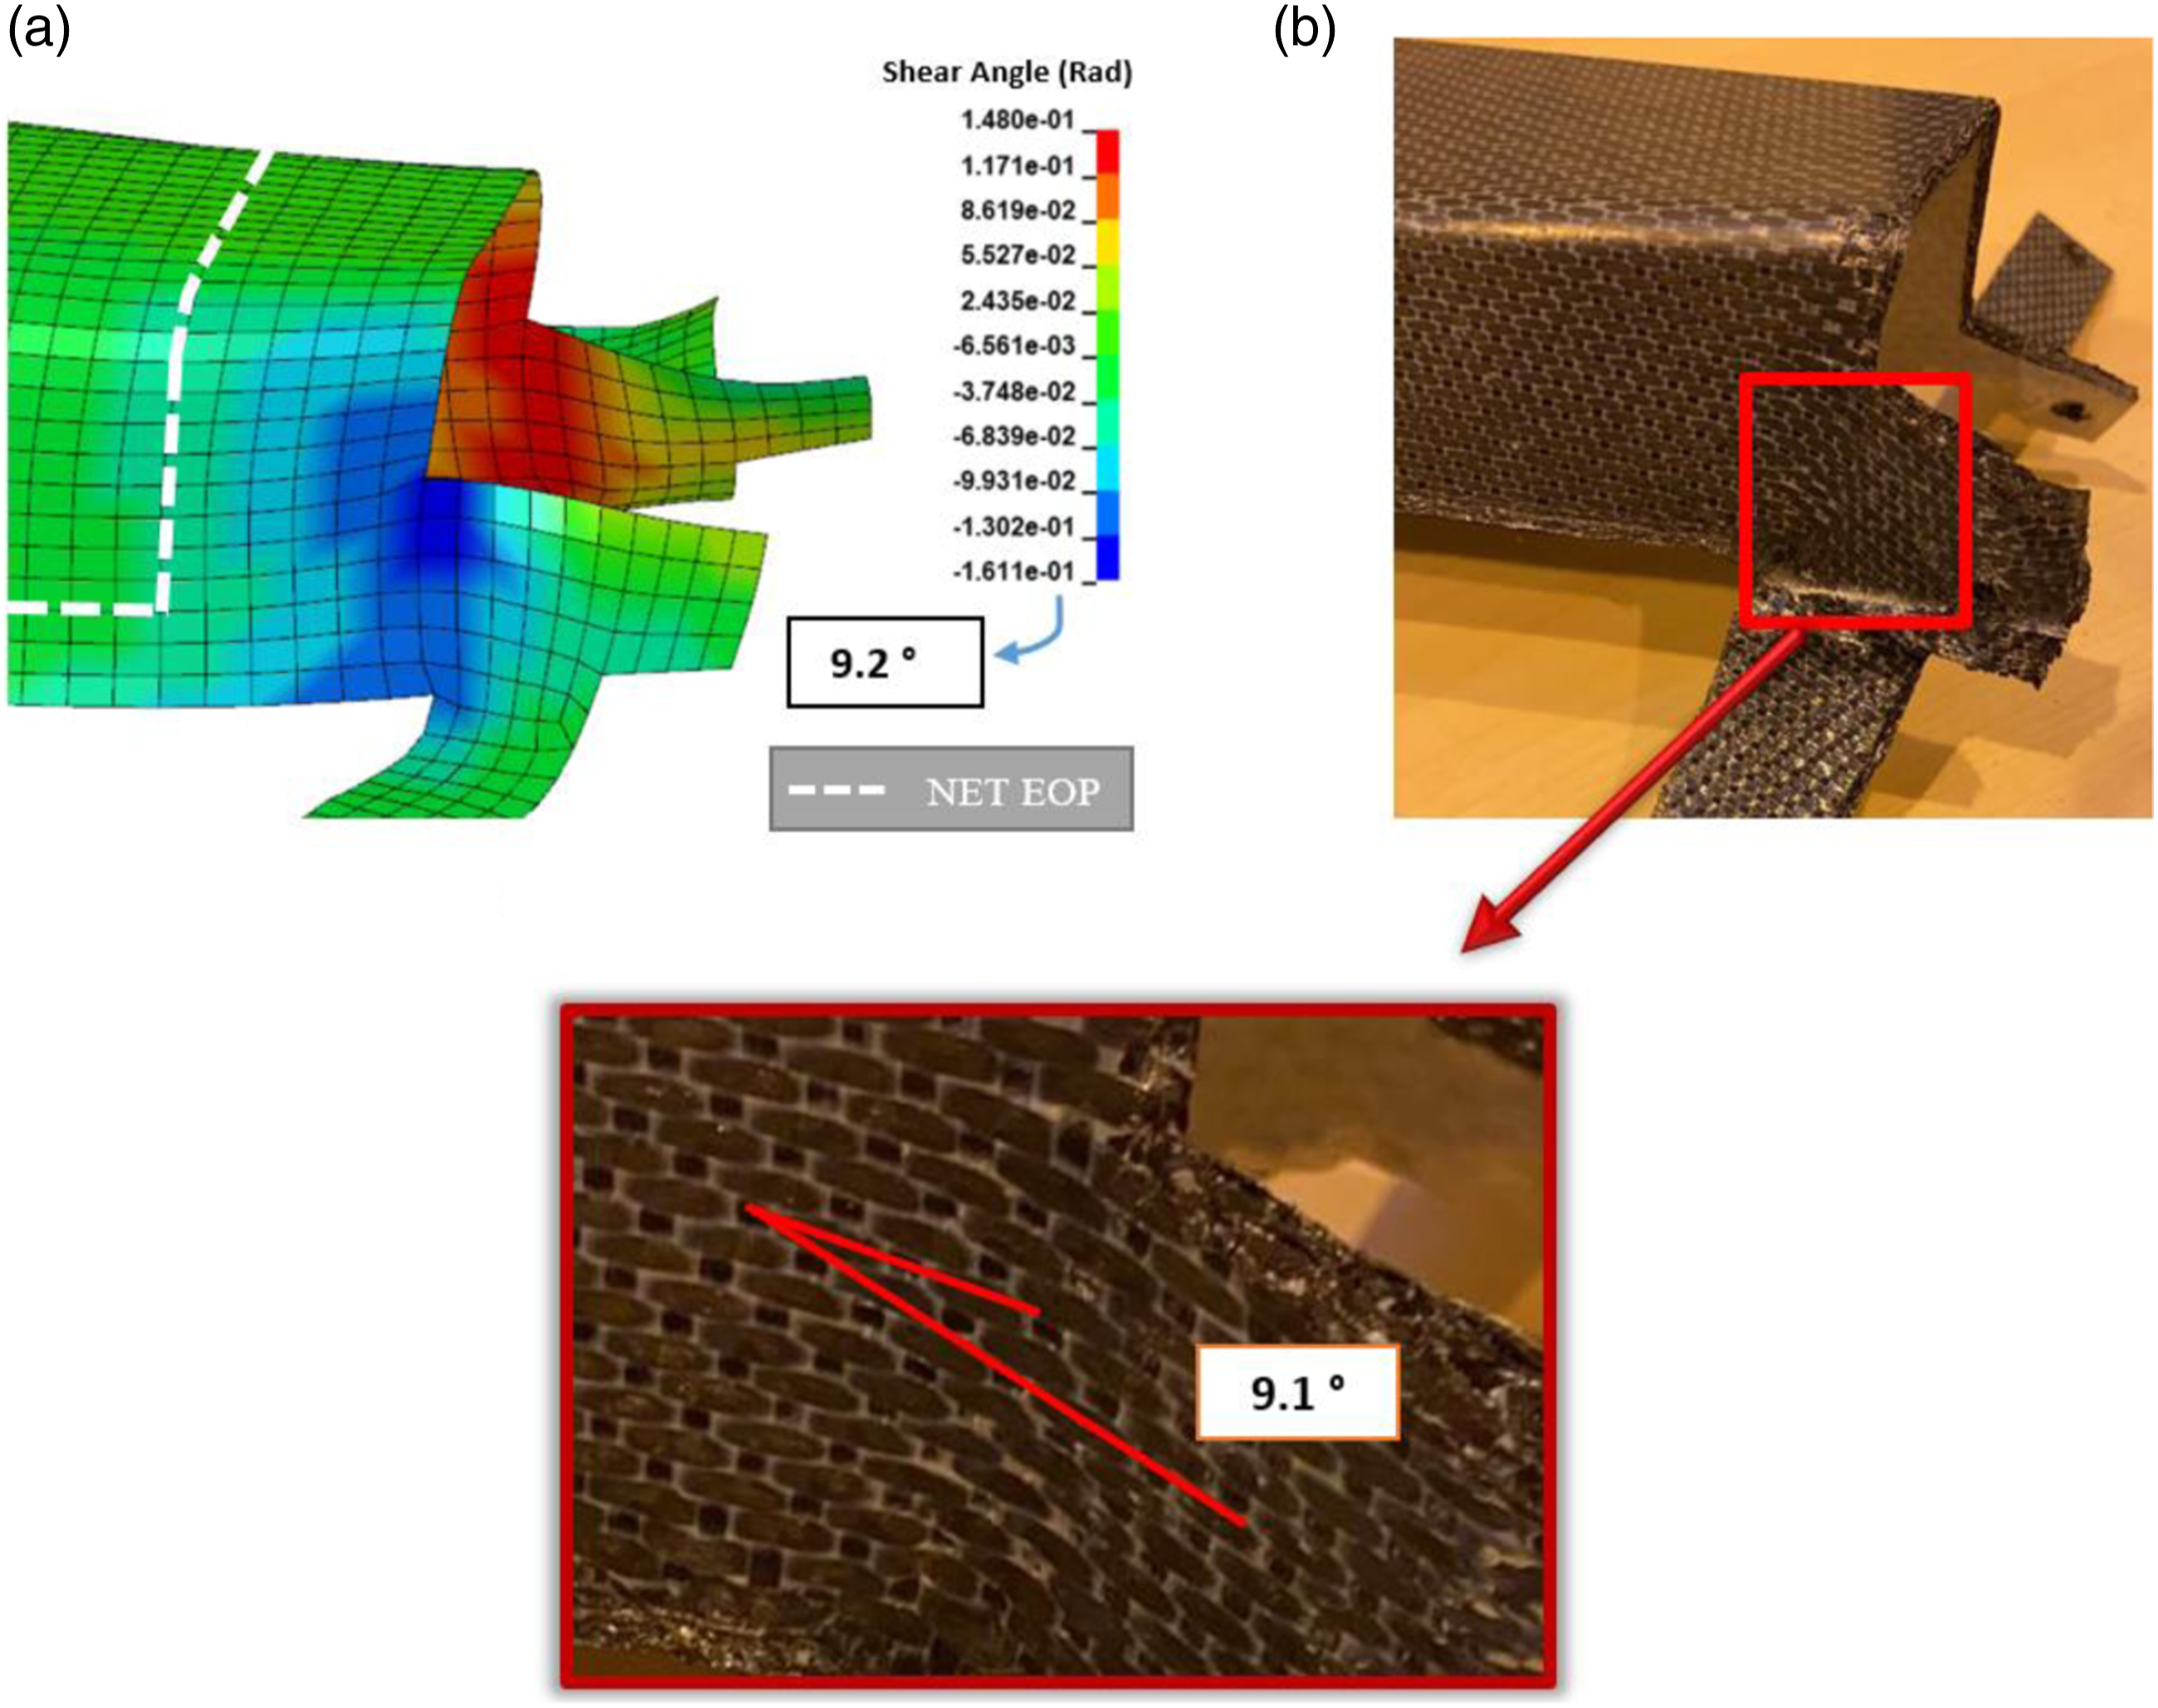
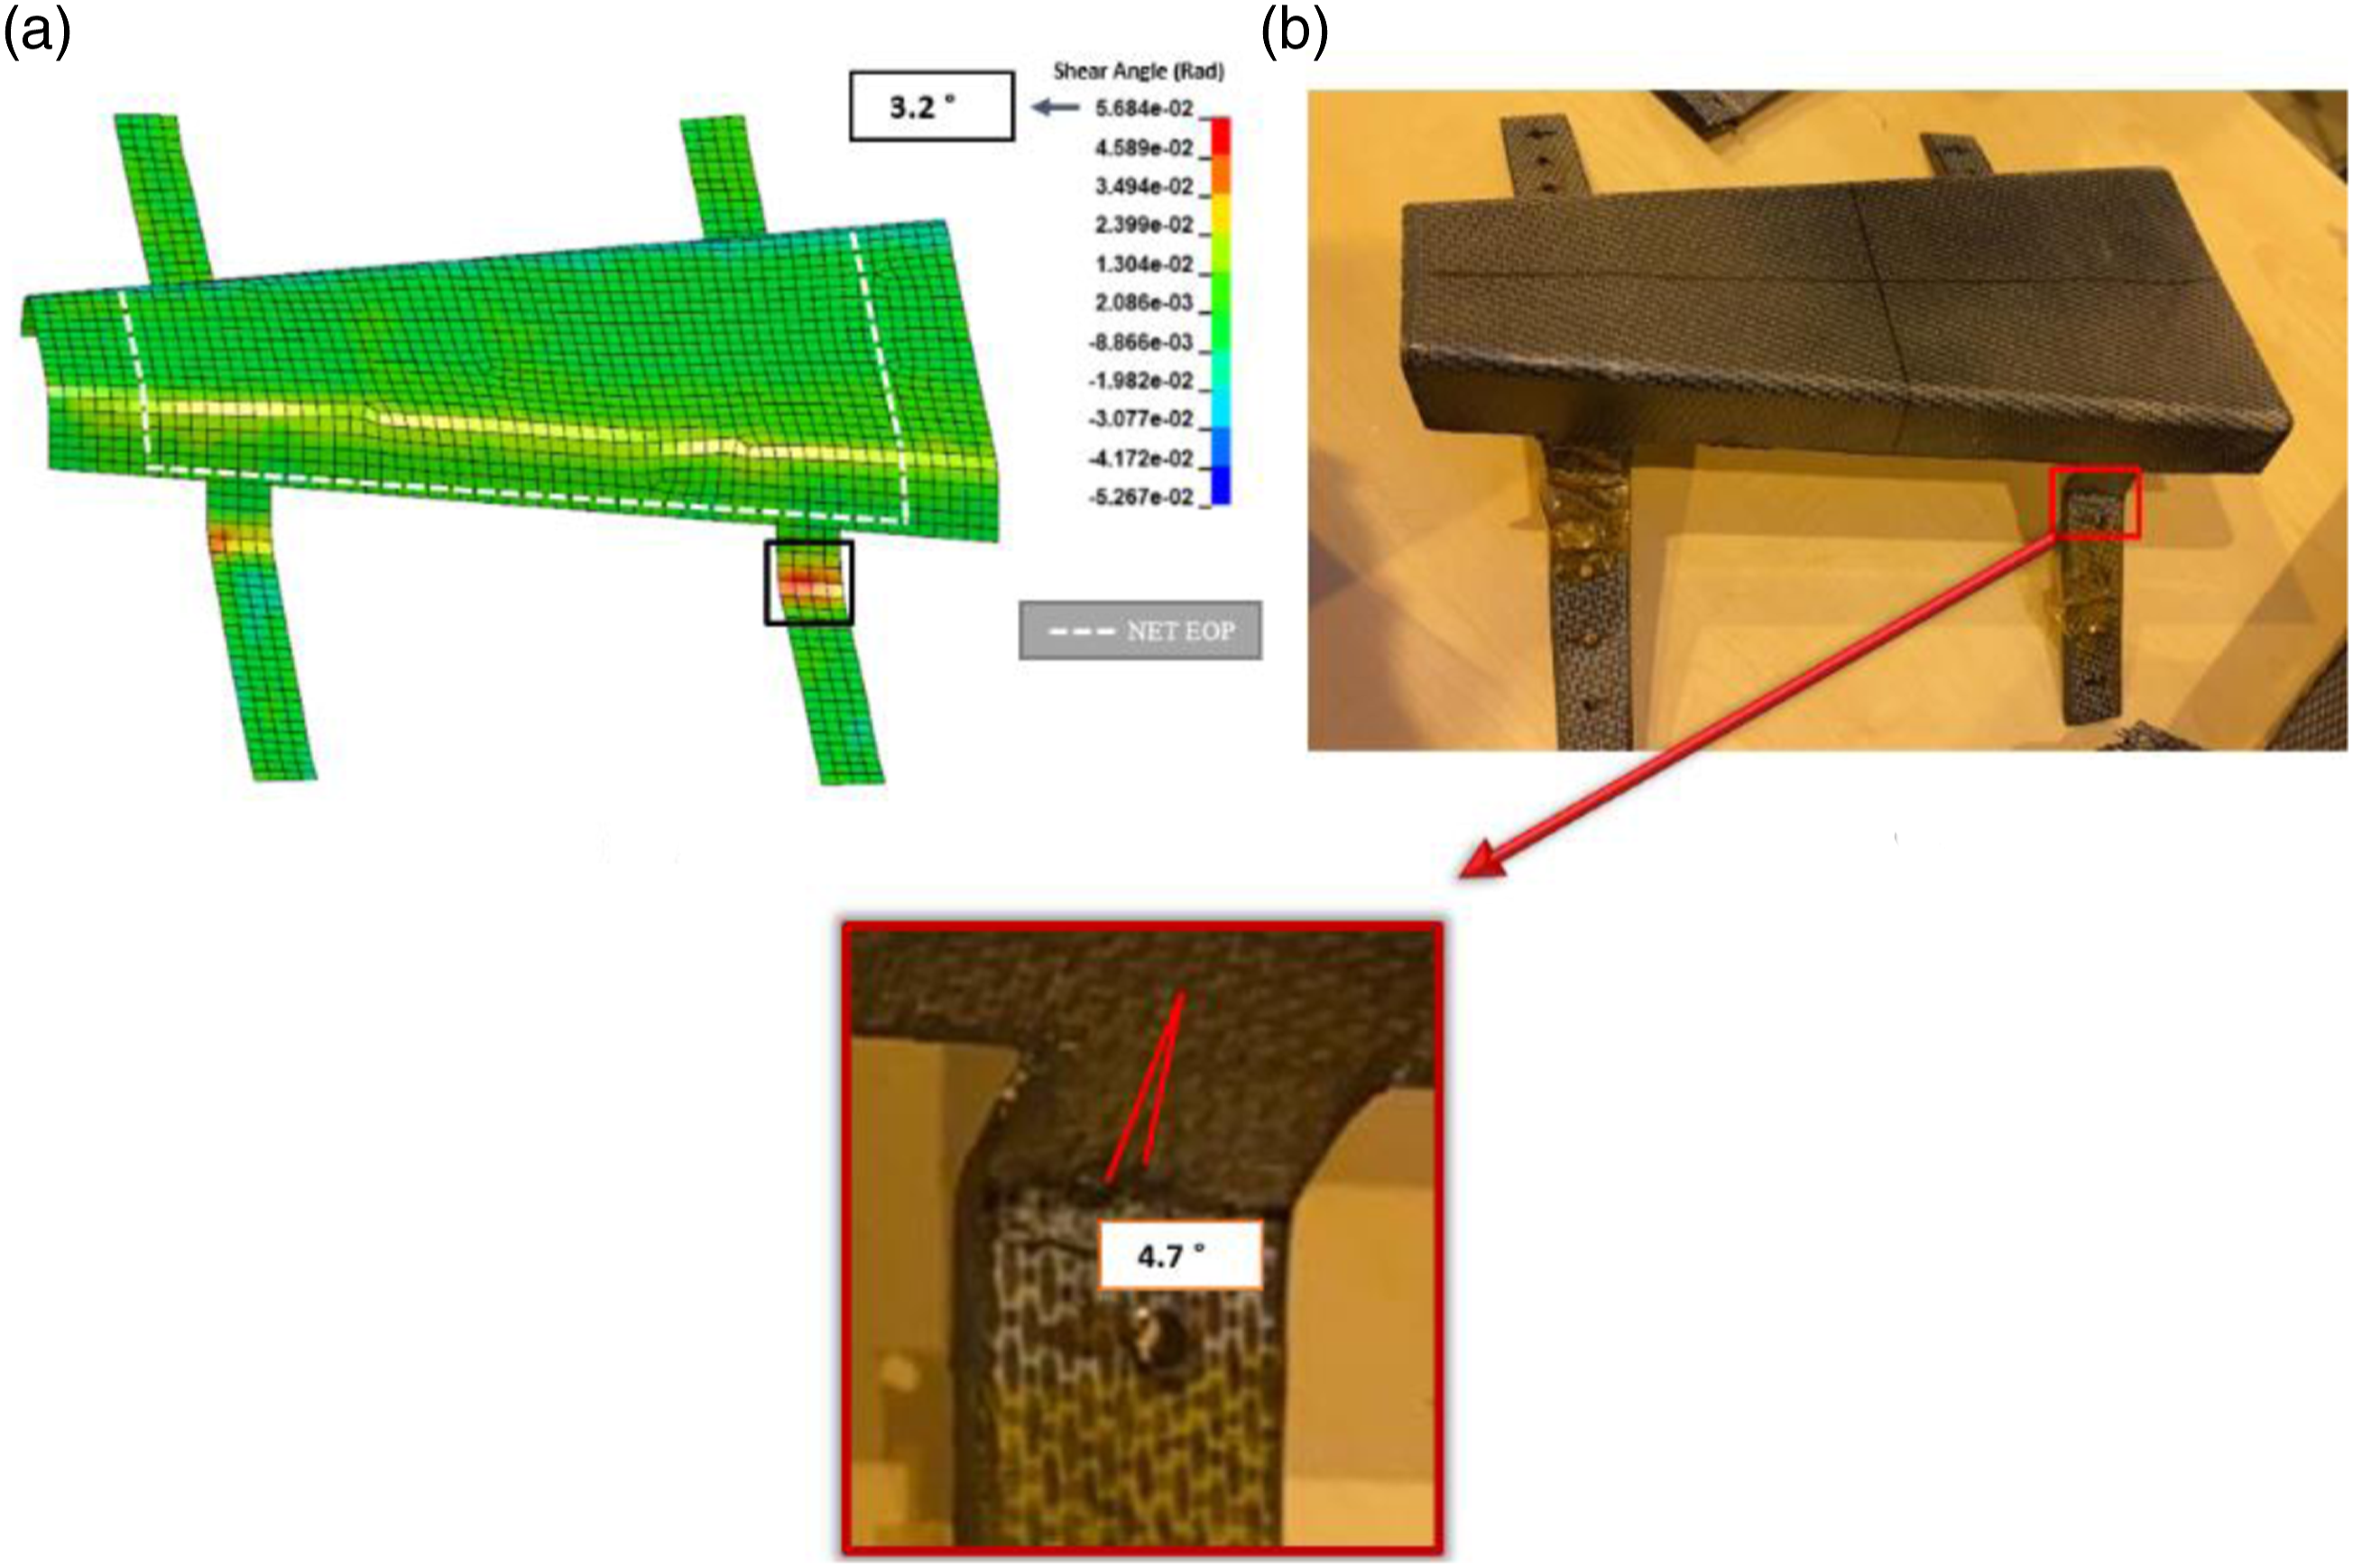
Composite materials are mostly anisotropic, in other words, their properties are directional. Maintaining the fiber orientations is critical especially for structural parts, since the in-plane tensile strength of fabric yarns is much greater than the transverse strength. During thermoforming, the angle between the fibers (warp and weft) changes depending on the part geometry. For this reason, knowing the position and orientation of the fibers becomes mandatory after forming. The angle between the fibers, known as the shear angle, was determined by the simulations and then compared with corresponding experiments.
Attaching the blank from the edge corners with springs in a diagonal manner, blank type 1, provides relatively uniform shear angle distribution both numerically and experimentally, as shown in Figures 15a and (b), respectively. The maximum shear angle in this blank as seen in the same figures concentrates at the corner regions of the bend radius and second radius area. The numerical maximum shear angle is determined 2.1°, which is slightly smaller than the experimentally determined one, 3.4°. The maximum shear angles of blank types 2 are located, both numerically and experimentally, in the lugs, close to the second radius area as shown in Figures 16a and (b), respectively. The numerical maximum shear angle is 6.8° and the experimental one is 10.2°. In the blank attached with eight springs from lugs, blank type 3, the greatest angular distortion is found in a region outside of the net EOP in the narrowing direction of the part as shown in Figures 17a and (b). A maximum shear angle of 9.2° is found numerically, which is fully agreed with the experimentally measured shear angle, 9.1°. Blank type 4 shows very similar shear angle distribution with blank type 2 numerically and experimentally, as sequentially shown in Figures 18a and (b). The maximum numerical and experimental shear angles between the fibers are 3.2° and 4.7°, respectively. The maximum shear angle determination for blank type 1: (a) numerical and (b) experimental. The maximum shear angle determination for blank type 2: (a) numerical and (b) experimental. The maximum shear angle determination for blank type 3: (a) numerical and (b) experimental. The maximum shear angle determination for blank type 4: (a) numerical and (b) experimental.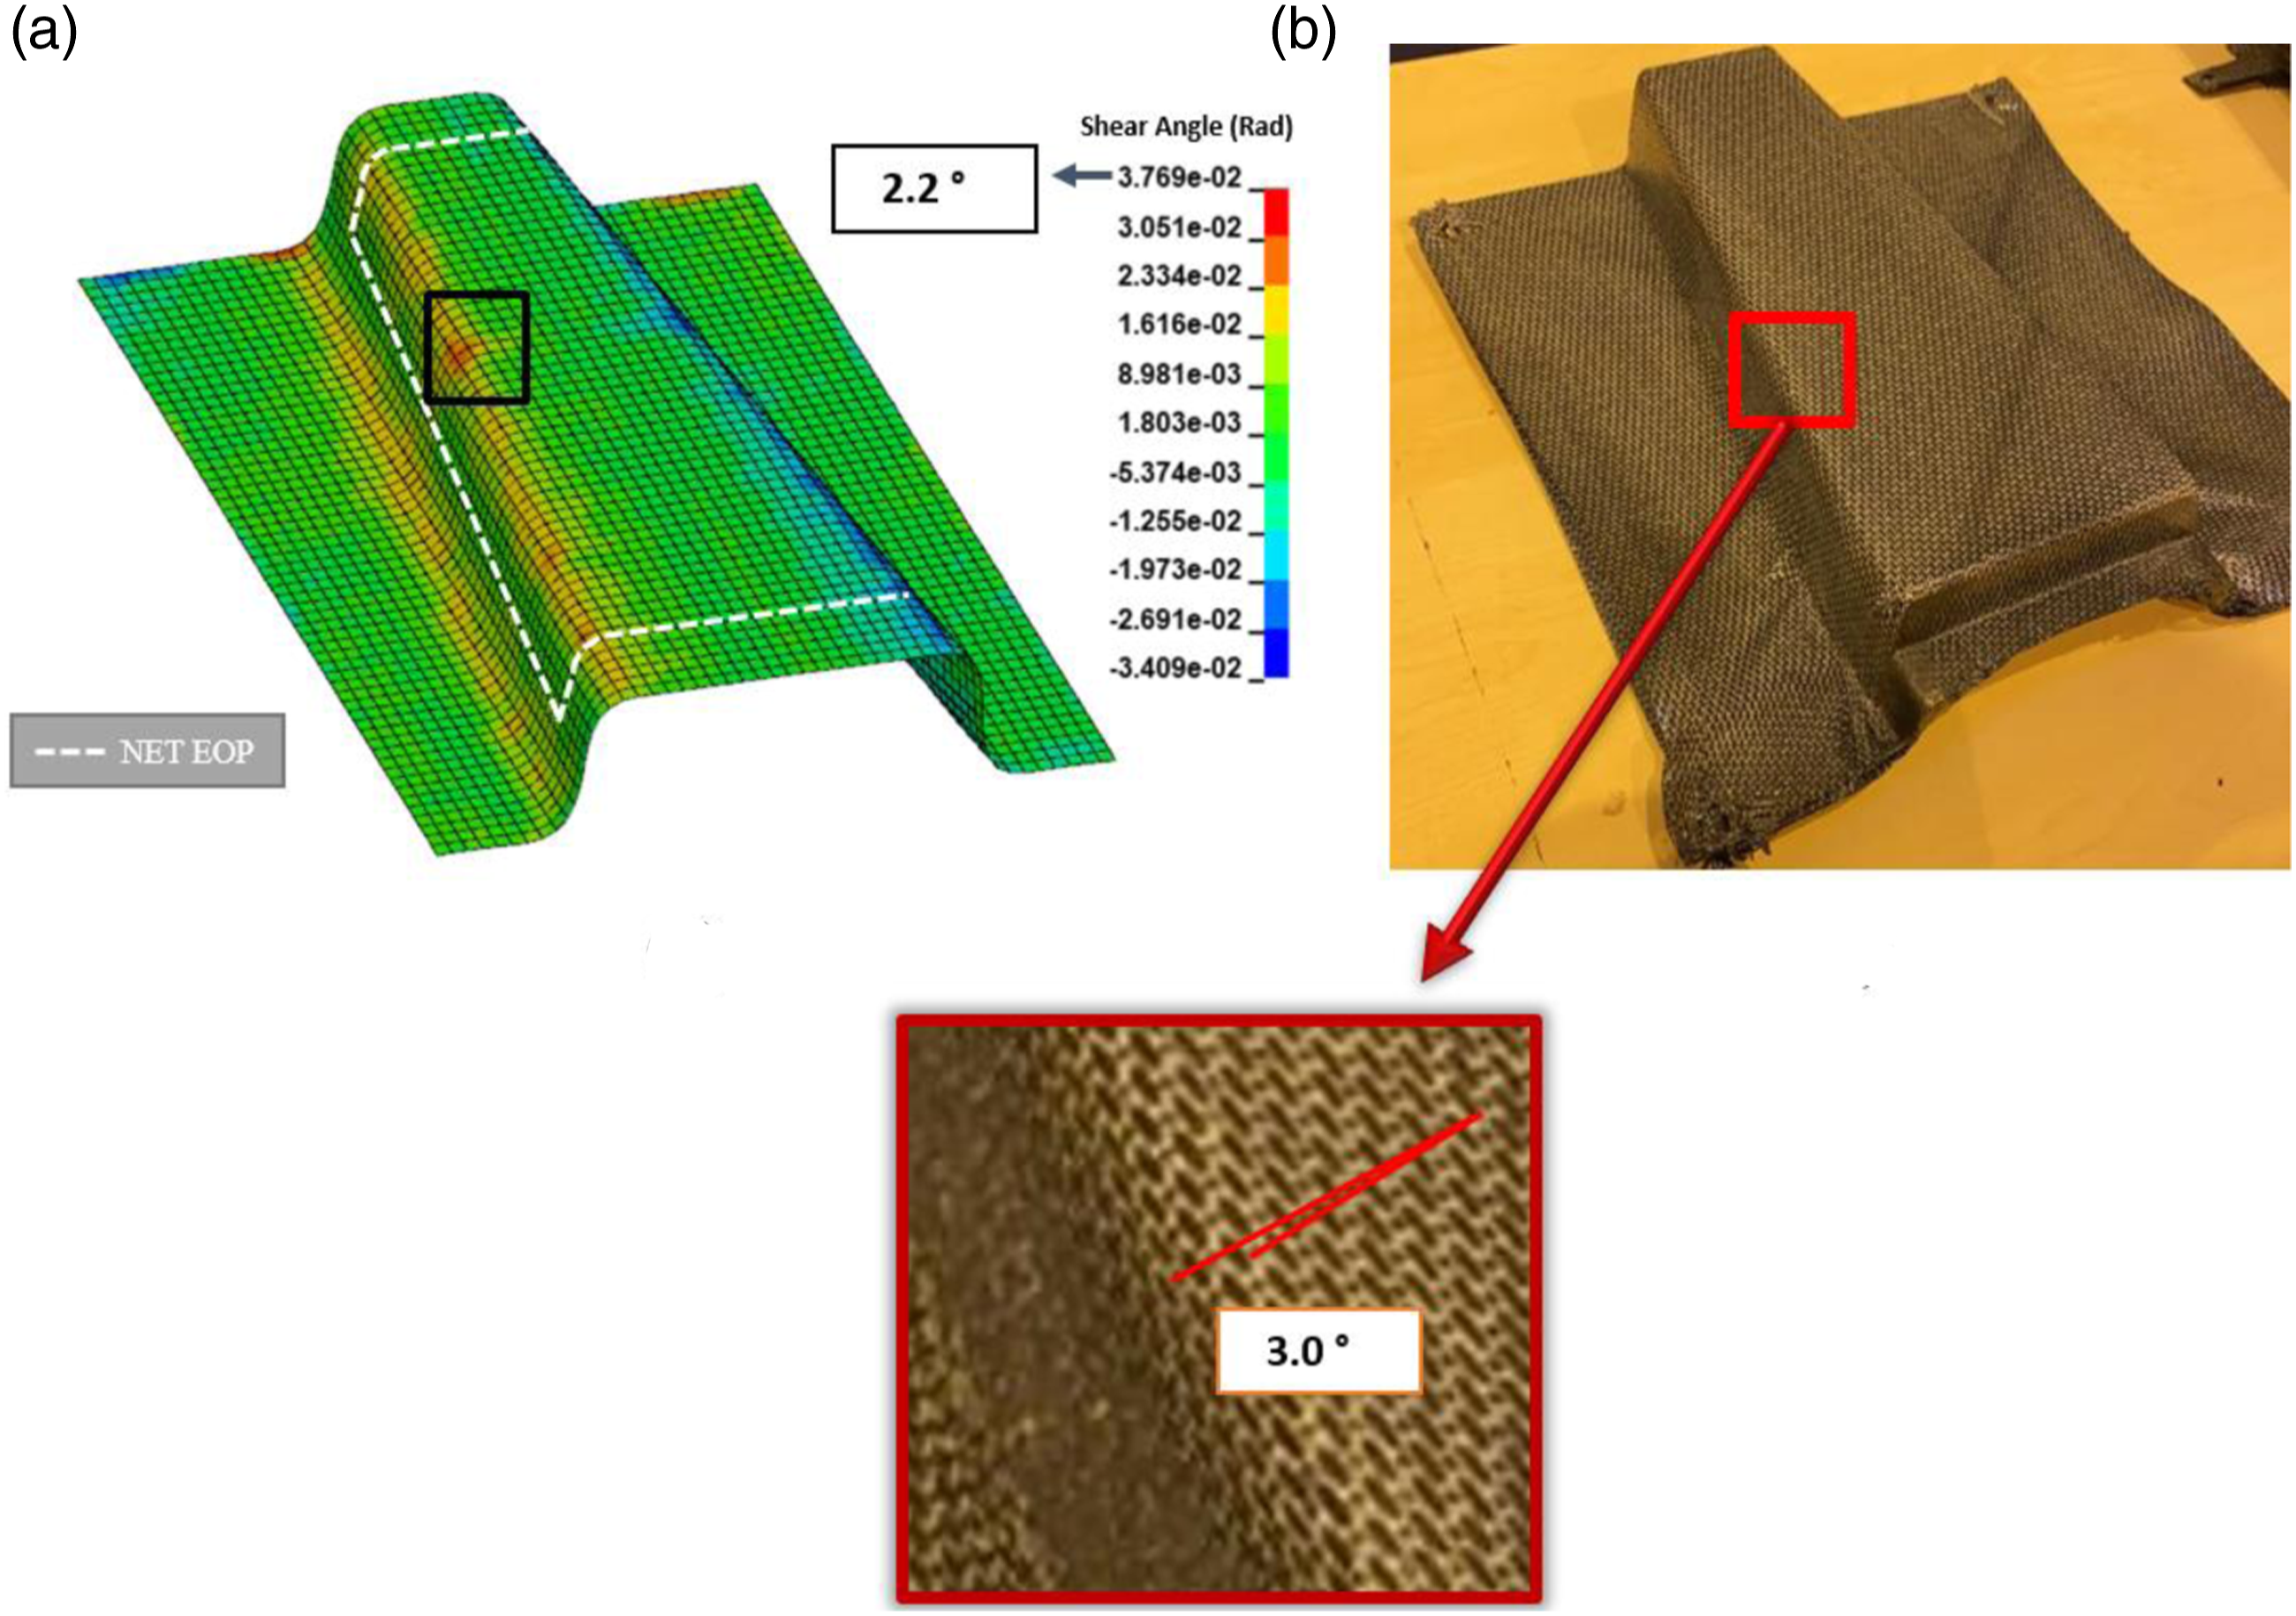
The results of present study showed that the thermo-mechanical model constructed by using MAT_249 in Ls-Dyna predicted well the fiber stresses and fiber orientations. However, the micromechanical effects of crystallization during cooling on the hardening of thermoplastic resin were not considered here and the potential errors resulting from crystallization during cooling of thermoplastic composite 33 could not be predicted by the present model. Examples of the models for the micromechanical effects of crystallization are found in refs34,35. In blank type 1, the simulation exhibited a homogenous stress distribution on the part, while a low surface quality of the part was obtained in the experiments. In the experiments, the contact of the excess material with the flat areas of the tool resulted in sudden temperature changes in the composite sheet, causing crystallization of the matrix and hence a lower surface quality of the part. But, this was not predicted by the model.
Conclusions
This study presented a methodology to simulate the effects of gripper location and blank geometry of the thermoforming of a PPS thermoplastic composite with an aim of producing a U-beam geometry with minimized defects. Followings were concluded. 1) An optimum punch speed of 14 mm/s was numerically determined at constant tool and composite sheet temperature for the thermoforming of PPS sheets by considering cooling and stress on the composite sheet. 2) Numerical simulations by the implementation of the optimum punch speed at constant tool and composite sheet temperature showed an average optimum spring coefficient of 0.25 N/mm basing on the lowest stress development on the composite sheets of all blank types investigated. 3) Since the geometry of the U-beam part did not contain a double curvature, large shear angles that might result in wrinkles were not observed. 4) The numerical thermoforming processes of different blank types investigated in present study using MAT_249 showed good agreements with the experiments in terms of defects formed in the composite part and the maximum shear angles between fiber directions. 5) The most successful configuration was found blank type 3, in which the blank was attached with eight springs from lugs to the frame. This was due to the absence of deformation in the net EOP and the occurrence of the angular distortions merely in the excess region. Keeping the lugs out of net EOP and attaching it with springs in both fiber directions provided a balanced stress distribution.
Footnotes
Acknowledgments
The author O.A. acknowledges Turkish Aerospace Industries (TAI), Inc. due to financial and technical support.
Authorship contribution
Declaration of conflicting interests
The author(s) declared no potential conflicts of interest with respect to the research, authorship, and/or publication of this article.
Funding
This study was supported by the Scientific and Technological Research Council of Turkey 1515 project numbered 5189900 of Turkish Aerospace Industries, Inc., Ankara, Turkey.