
Abstract
Thermoplastic tapes have found a prominent place in automated tape placement (ATP), due to their reduced processing time. ATP also offers significant reduction in labour; however, the most attractive aspect is the use of its welding properties. Welding or diffusion bonding is necessary for two thermoplastic materials to bond to each other through the combined effect of heating and consolidation pressure. The work published in this article shows how various thermoplastic tape materials with different material properties are bonded to each other using a direct flame-type ATP process. Contact angle and differential scanning calorimetry measurements help understanding of the processing needs of the considered materials. The samples obtained after ATP are sent for peel testing using a wedge peel test principle, so that the force required to separate the bonding is identified. A T-peel test/pull test is also employed to cross-compare peel results obtained through wedge peel testing. The main aim of the work is to study the quality of connection between the two plies with different material interfaces and also how friction might contribute to peel force when wedge peeling is used. A numerical model is also implemented to show the effects of this friction.
Introduction
Composites have been important materials due to their high-end properties and their versatility in a wide range of applications. Composite materials these days constitute a significant proportion of the engineered materials market ranging from everyday products to sophisticated niche applications. The ever-growing research sector in composite materials has pushed for newer polymer resin matrix materials and high-performance reinforcement fibres of glass, carbon and aramid. The penetration of these advanced materials has witnessed a steady expansion in uses and volume. The need for bigger volume has also resulted in cost reductions. High-performance fibre-reinforced polymers can now be found in diverse applications, such as composite armouring designed to resist explosive impacts, cylindrical vessels, offshore/onshore windmill blades and industrial drive shafts, and these materials also play a significant role in automotive or aerospace sectors. The benefits of corrosion resistance and light weight have proven attractive in many low-stress applications. There are also applications in which composites are combined with metal in order to save both costs and weight. One such type of composite material is thermoplastic composites, and they are highly attractive to the aerospace industry due to their combination of high fracture toughness, high damage tolerance, long (indefinite) out life and good recyclability compared to thermoset systems. 1 The processing difficulties associated with them do pose a problem in composite industries. Driven by the need for more cost-effective applications, researchers and design engineers of polymer composites are facing increasing demands for the development of faster and more environment-friendly processing methods. Rapid processing techniques require a better understanding and a more efficient control of phenomena such as heating, impregnation, bonding and solidification. Most of the new techniques promote non-isothermal and transient phenomena in order to achieve faster transformation of the materials. This has led to increasing research in the area of in situ consolidation using automated tape placement (ATP). The automation of the manufacturing process for thermoplastics by ATP can achieve an increased production rate, reduction in labour cost and improved geometric repeatability compared to conventional hand lay-up. 2 Thermoplastic tape placement also offers the possibility to save an additional consolidation treatment. 3 Furthermore, the thermoplastic tape material is much easier to handle and has no limited stock life. The high-quality requirement of the components requires the availability of adequate production processes and a deep understanding for the parameters affecting the process. 4 -6
Using an ATP process, it is possible to add several layers with reduced time and minimum supervision to create complex geometry. The mechanism to join the layers used here is the welding process. Welding of two thermoplastic tapes requires specific physical conditions: an intimate contact between the surfaces at sufficient pressure level, temperature at the nip point high enough to allow diffusion of macromolecules and a time span long enough in order to secure welding quality. Due to the low thermal conductivity of thermoplastic composites, a high temperature at the interface can be reached by local heating. Mantell et al. 7 introduced a simplification for the welding (bonding) of polymer surfaces that are well accepted for simulations of the tape placement process. Previous research work 8 -10 has been carried out in the field of intimate contact and polymer healing. Intimate contact and molecular diffusion occur at several interfaces, such as between plies of a laminate or between different elements assembled to form the final part. However, the high content of carbon fibre (CF) reinforcement in thermoplastics, resulting in high thermal and electrical conductivity, imposes difficulties such as uneven heating, delamination 11,12 and distortion of the laminates. These problems have posed a big threat when bonding large components. 13,14 In addition, as fibre volume fraction increases, the amount of resin available to melt and reconsolidate into a fused joint is reduced and this can also affect the welding quality. One can say that in situ consolidation might not offer the same benchmark as an autoclave but the research carried out recently reveals that there is huge potential for processed thermoplastic materials using the ATP process. Ageorges et al. 15 explain that the fusion bonding processes offer advantages such as reduced surface preparation requirements, reprocessing, recyclability and improved integrity/durability. Schell et al. 16 confirmed through mathematical modelling and experimental validations the effects of temperature at the interface between two composite parts and hence this can cause randomness in bonding quality. Bourban et al. 17 also illustrate how the material microstructure and transformation phenomena during diffusion bonding and crystallisation control the rapid processing of thermoplastic composites.
Heat input required for thermoplastic welding in an ATP process is carried out either using a high-powered laser, 18 -21 direct flame, 22 infrared (IR) heating, 23 ultrasonic heating 24 -26 or a combination of these methods. 27 Pressure using rollers then consolidates the heat-affected region to acquire the necessary bonding between the parts. Laser heat source is seen as the most accurate and high-end heat source for ATP process in industries. Rosselli et al. 28 showed a range of specimens tested in terms of power variation and the trends showed an increase and a decrease of shear strength typically at about a peak laser power of 70 W. They also confirm that slight misalignment of laser beam can result in shear strength reduction of up to 14%. The study by Ferraro et al. 29 overcomes the overheating of the tape using laser heat source by taking the local tape temperature or the actual winding speed as the variable controlling the laser output. Recent investigations of Stokes Griffin et al. 30,31 deal with a model-based approach for near-IR laser heating and selective reinforcement of steel with CF/polyamide 6 (PA6) tapes. Funck et al. 32 compare IR, direct flame, hot gas and laser with respect to their processing costs and parameters. The studies found IR to be inexpensive compared to laser but the energy density and response time are not nearly as high as with laser radiation. However, to keep purchasing costs low and to have faster incoming tape speed, direct flame would certainly fit the bill. Hot gas torch (HGT) on the other hand keeps the purchase cost reasonable, but the energy efficiency is low. Nonetheless, recent investigations of Qureshi et al. 33 showed the potential and possibilities with optimised HGT nozzle geometry and its influence on mechanical behaviour in interlaminar shear strength. The study of Funck and Neitzel 32 helped to establish that ideal heating source with best contact is required to achieve laying conditions suitable for optimal diffusion bonding. Calawa and Nancarrow’s 34 investigations have led them to design a quartz lamp IR heater suitable for heat application right before the application of tow. The main advantages of the quartz IR emitter are short response time, durability in a manufacturing environment and longest wavelength with high power output, and this allows for highly controlled localised heating of the area in a small package. It has also been found by Karpachevskyy 35 that increasing the number of individual light sources and optimizing IR geometry allow for both higher efficiency and uniformity. The heater geometries generated by Karpachevskyy’s method achieve excellent efficiencies, with up to 60% of emitted light being absorbed by the tape directly without intermediate reflection and irradiance functions that are visually indistinguishable from being constant. Schledjewski 3 conducted a cost-efficiency analysis (CEA) and it was concluded that the tape placement head’s efficiency depends mainly on the type of heat source chosen. This would also mean that the final properties and the quality of the tape would be strongly affected by the heat source selected. With this scoring system, Schledjewski evaluates the different heat sources and confirms that laser, direct flame and HGT systems result in the highest CEA score. Recent developments try to combine the pros of laser heating, namely, pulsed high energy emission (Xenon) for precise controllability without the cons, namely, security issues for human life. 36,37
Typically, bond strength of welded interfaces is characterised using a standard test, like the lap shear test (e.g. according to ASTM D1002 38 ) or double cantilever beam (DCB) test (e.g. according to ISO 15024 39 ). Since those tests require bulk specimens, a characterisation of the bond strength of two thin tapes continuously welded is not possible using such a test. Instead, peel testing is used to characterise the bonding. 40,41 Hulcher et al. 42 used a wedge peel tests to study the cohesive failure of specimens during peel testing under different loading conditions. For the current study, the wedge peel method was selected since it can be used to characterise the welding of two thin tapes. 43 The principle of the wedge peel test mechanism is that a bonded tape is passed over a stationary blade and is pulled with the force until the bond starts breaking along a crack line. Consequently, the strength of the bond is measured as a requirement for the application. Kawashita et al. 44 use different methods of peel testing to critically examine adhesive strength of two different sets of aerospace metal polymer laminates. Grouve et al. 45 investigate experimentally the validity of the mandrel peel test on thermoplastic laminates by comparing the measured fracture toughness with the values obtained by the DCB and the end-loaded-split beam test. Rao et al. 46 use a floating roller peel test method to determine the peel force that is required to separate the eight towpregs from the placement machine’s surface. The research of Rao et al. 46 identified that the lay-up temperature has the greatest influence in determining the resulting peel force. Comer et al. 47 conducted a series of manufacturing, mechanical and thermal trials to identify an optimum set of processing parameters for the laser-assisted tape placement using CF/polyether-ether-ketone (PEEK). Wedge peel test is employed here to study the quality of interlaminar strength and the study concluded that for any samples produced with unheated non-metallic tool provided the best peel force (4.1 N/mm) and void content (1%); however, low percentage crystallinity (approximately 20%) resulting from rapid cooling rates will likely compromise mechanical strength, stiffness and chemical resistance of CF/PEEK. Although energy intensive, a heated metallic tool (280°C) can serve to increase the percentage crystallinity to a level generally considered optimal (approximately 35%) but this indeed gave a significant drop in peel force values. Recent developments deal with quality assurance systems to detect gaps, overlaps, twists, bridging or foreign bodies. A promising project was presented by Denkena et al. 48
This introduction gives a brief insight into how previous research has focused on different aspects of ATP processing: from its industrial requirement to utilizing various mathematical models to predict manufactured parts property through microscale modelling. The present study showcases a full process chain starting from material selection until material testing with all its stages in between (Figure 1) and a separate modelling stage. Therefore, tape materials were pre-characterised in terms of their surface energy (Table 3). Parallel, differential scanning calorimetry (DSC) tests were carried out on all tape materials providing transition temperatures (Table 4) to estimate processing temperatures and energies. Subsequently, the selected tape combinations were placed and welded on an ATP machine considering pre-characterisation results (Table 6). Two mechanical test setups were employed to estimate the bonding strength of selected welded tape combinations, namely, wedge peel test and T-peel/pull test. Both the tests have their pros and cons; consequently, they were compared in terms of their results for selected tape combinations. Additionally, a finite element model was employed comparing peel force against energy release rate during peeling. For the wedge peel test, this finite element model also considers the effect of friction on peeling.

Process chain of the work carried out in this research work.
Experimental work
Materials selection and cutting
Thermoplastic tape materials were purchased from Suprem (Z.I. Le Bey 17, CH-1400 Yverdon-Ies-Bains, Switzerland) and Celanese (Am Unisys-Park 1, 65843 Sulzbach, Deutschland). Tape materials available for testing are listed in Table 1.
List of available tape materials and their thicknesses.
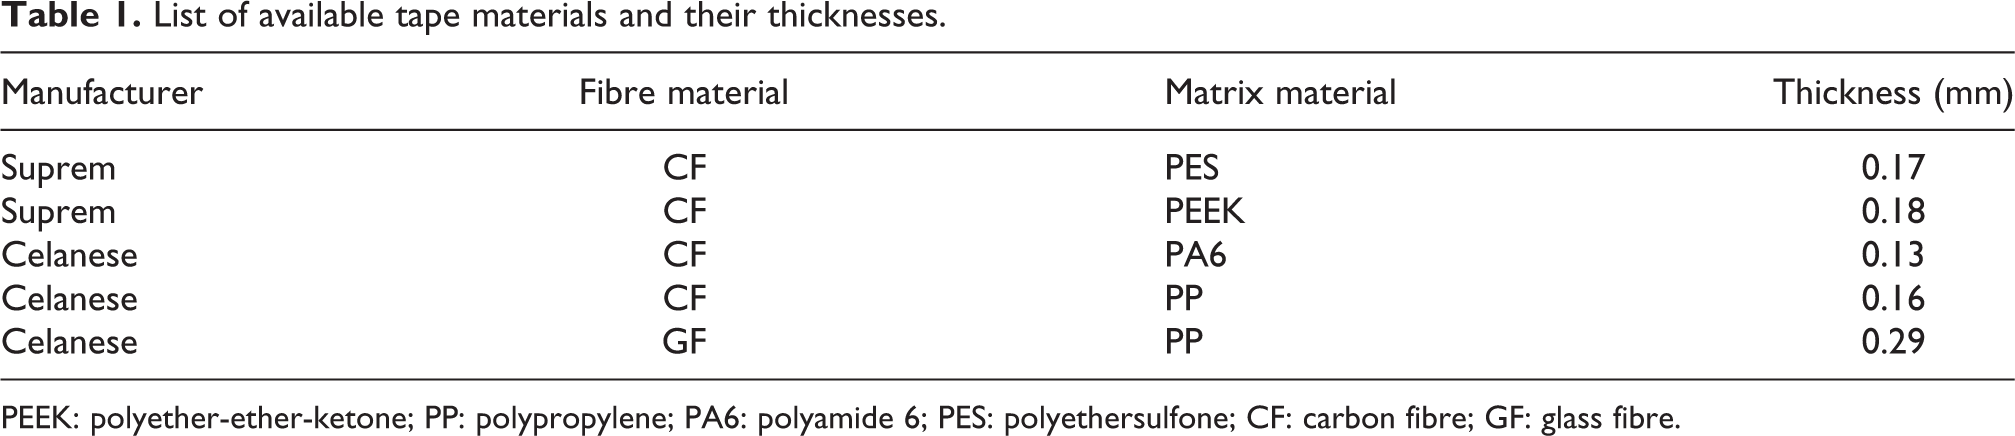
PEEK: polyether-ether-ketone; PP: polypropylene; PA6: polyamide 6; PES: polyethersulfone; CF: carbon fibre; GF: glass fibre.
Once the materials were chosen, the tapes needed to be confected using a rotating blade cutter. The tape samples were slit to the specific size of 700 × 24 mm2. Visual inspection of the cut tapes was carried out to ensure the integrity of the material after cutting. Moreover, each tape was measured at three distinct points over the 700-mm length to ensure a constant width was kept.
Tape characterisation
Tape characterisation was mainly carried out to understand the bonding and polarity against different other tapes. For these purposes, contact angle (CA) measurements were carried out. CA of the samples was measured with a drop shape analyser (DSA 100; Krüss GmbH, Borsteler Chaussee 85, 22453 Hamburg, Deutschland) at room temperature with a droplet volume of 2 µ l. CA measurements were averaged over five different positions of the surface and using three different liquids. The used liquids for the CA measurements and their respective surface tensions (γl ) are given in Table 2.

CA: contact angle.
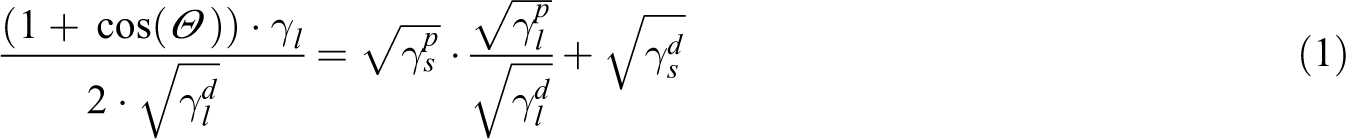
The surface energies of the tape materials were calculated with the Owens, Wendt, Rabel and Kaeble methods. 51 -54 Therefore, CAs of each tape material, with all three measurement liquids, were determined. These angles and the known surface energies of the measurement liquids served as input parameters for equation (1). The results were plotted accordingly and a linear approximation was performed. Polar surface energy parts are calculated from the slope, while the disperse parts are represented through the constant. The calculated surface energies (γs ) of the tape materials are given in Table 3.
Surface energy of tape materials.

PEEK: polyether-ether-ketone; PP: polypropylene; PA6: polyamide 6; PES: polyethersulfone; CF: carbon fibre; GF: glass fibre.
DSC tests for all tape samples at a heating rate of 10 K/min were also carried out to study tape parameters such as glass transition temperature and melting temperature. Table 4 lists the DSC data extracted from DSC curves. The information provided from DSC was used to determine the heating plate temperature for the ATP process of tape welding. According to heating plate, temperatures can be found in Table 6.
Sample materials and properties determined through DSC.

DSC: differential scanning calorimetry; PEEK: polyether-ether-ketone; PP: polypropylene; PA6: polyamide 6; PES: polyethersulfone; CF: carbon fibre; GF: glass fibre; T g: glass transition temperature; T m: melting temperature.
ATP processing
Figure 2 shows the ATP head with its schematic used for the purposes of this research work. It consists of a thick steel heating plate with dimensions 700 × 350 mm2 to lay tapes horizontally. The most important parts of the ATP head are the consolidation system and heating devices. There are three devices which can alter temperatures:
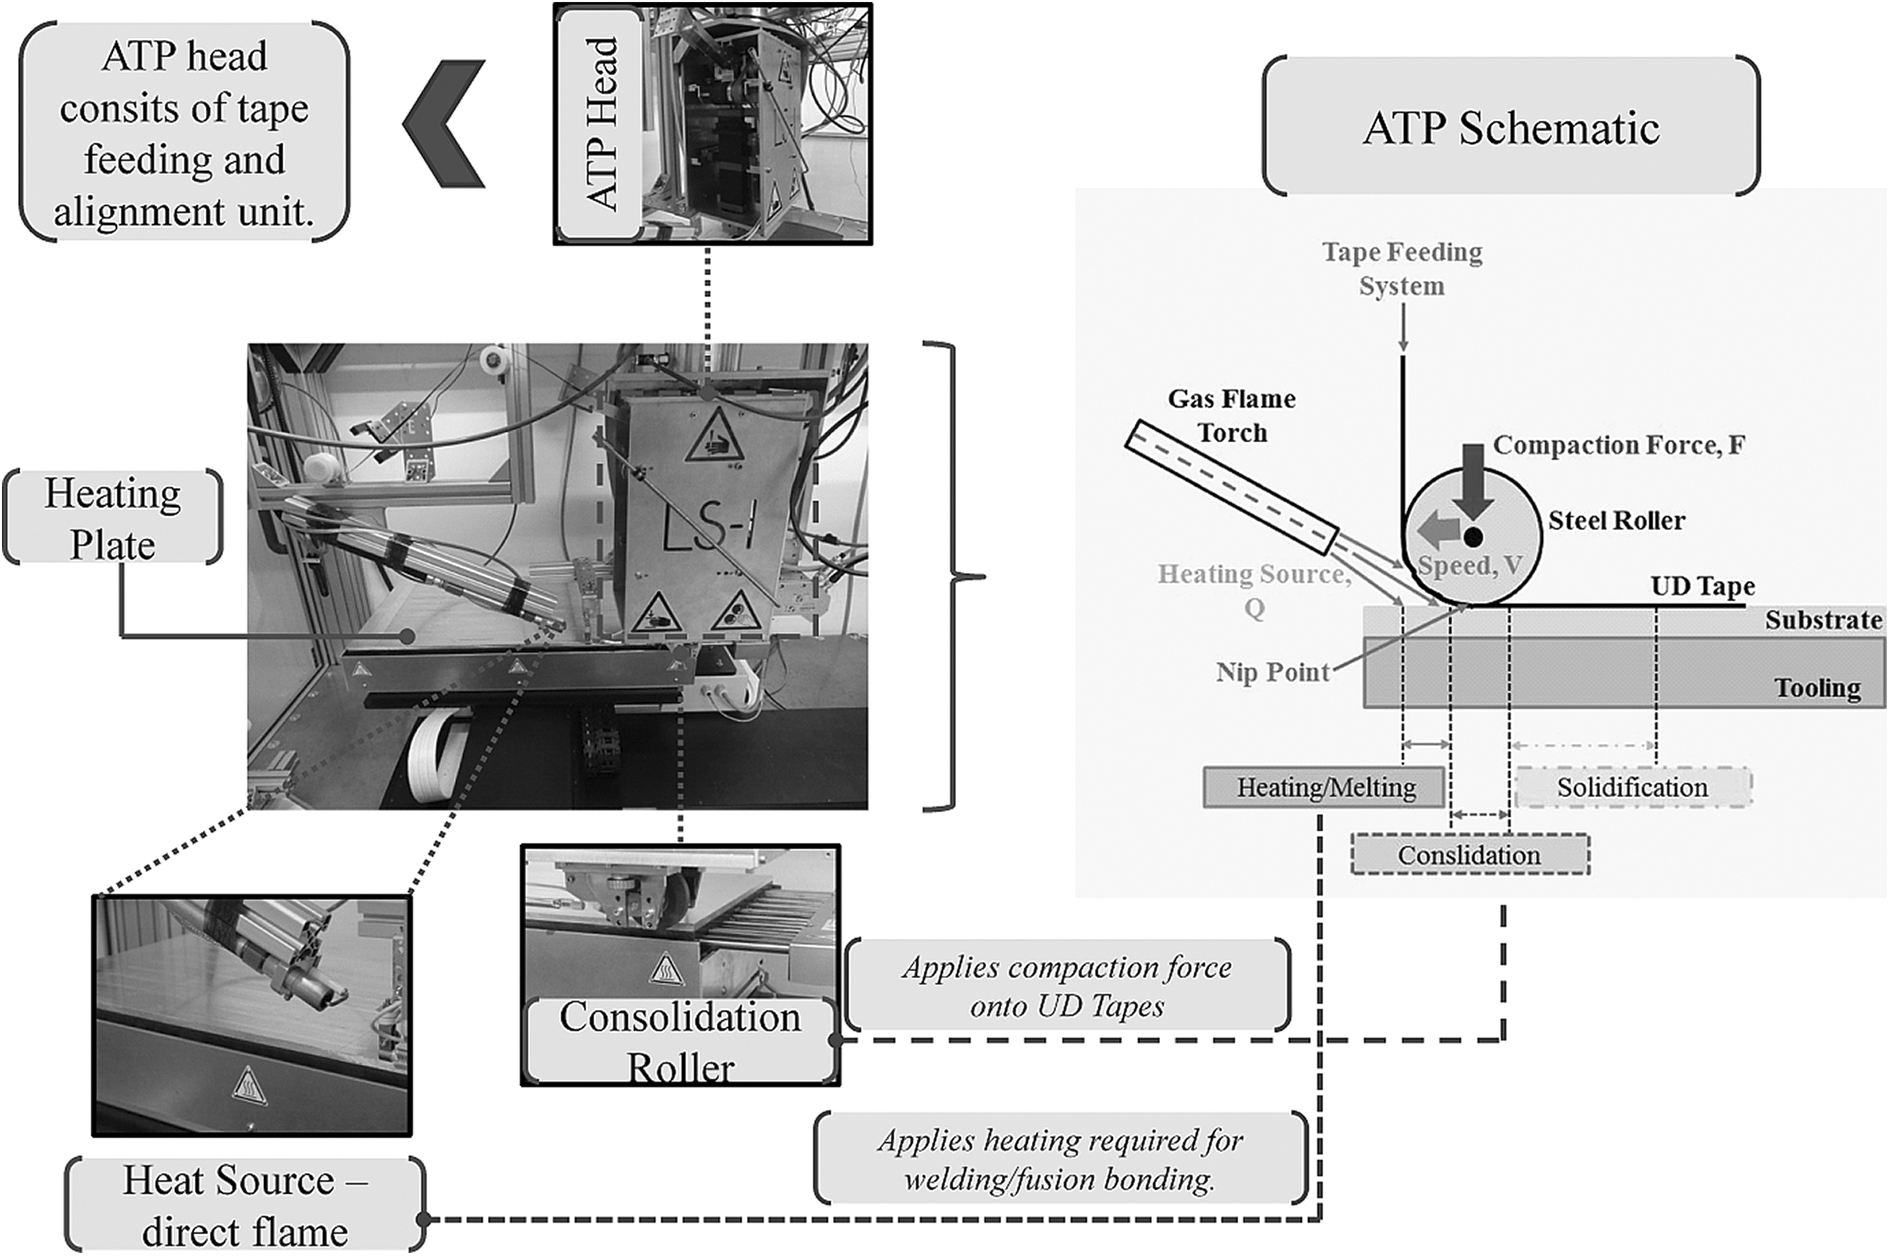
ATP test rig used for producing bonded tapes. A schematic of the ATP process shows the different zones after the application of heat source. ATP: automated tape placement.
heating plate for tool and substrate, consolidation roller and direct flame.
The heating plate for tool and substrate heating serves two purposes. First, it should provide enough temperature in order to make the tape material tacky. This should make the first layer stick to the tool. Second, it should slow down the temperature decrease after the welding process to maximise polymer healing. The heating source used for nip-point heating is the direct flame. It produces a flammable propane–air mixture controlled by a mechanical circuit. Through the adjusted airflow, a membrane is triggered that adds gas to the air. For igniting the flame, a diode is used. While the direct flame aids in the first step of welding process, a consolidation roller helps to apply the compaction force, F, to provide intimate contact between the two surfaces. This roller is also tempered, since high thermal energy is produced by the direct flame that would heat up the roller, which is supposed to keep a constant temperature.
As one can see in Table 5, the materials’ combinations were chosen on the basis of a full factorial design. The only two exceptions are the combinations of CF-PA6/CF-PEEK and glass fibre (GF)-polyethersulfone (PES)/CF-PEEK, since it was not possible to find a suitable processing window in which the combinations would bond against each other. Other than that all combinations were successfully welded.
Tape material pairing and combination.
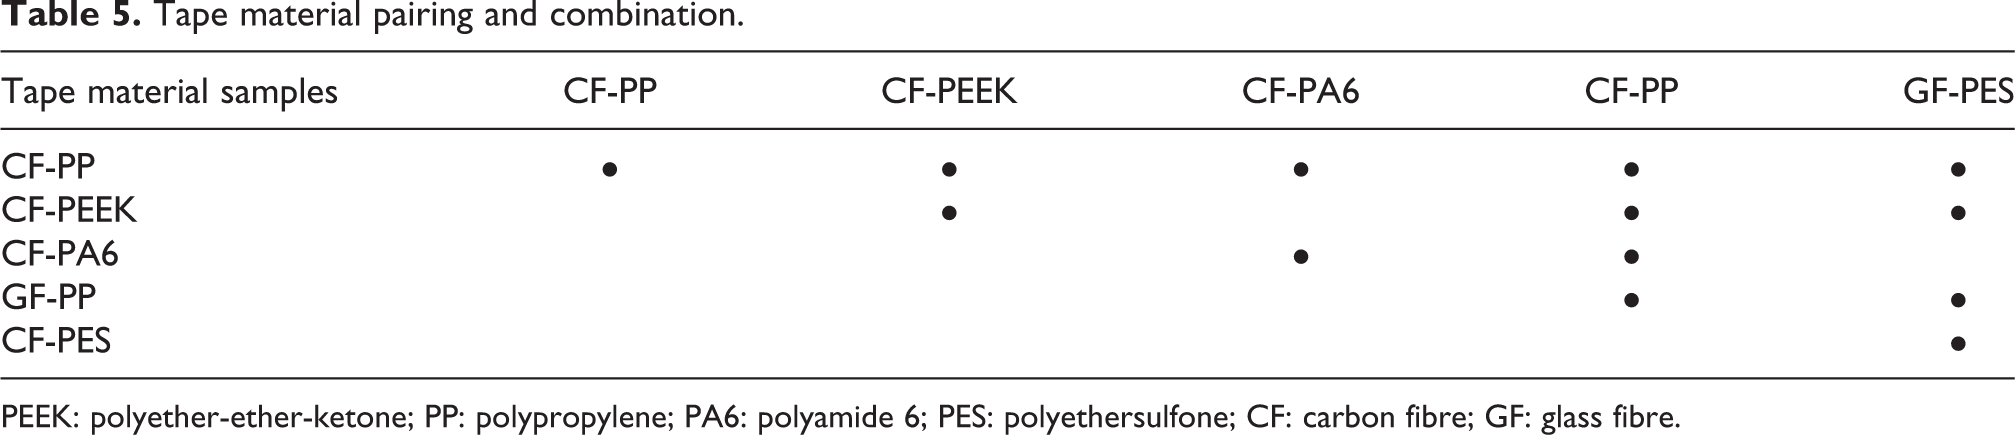
PEEK: polyether-ether-ketone; PP: polypropylene; PA6: polyamide 6; PES: polyethersulfone; CF: carbon fibre; GF: glass fibre.
During ATP processing, the process parameters such as consolidation force (900 N) and consolidation roll temperature (80°C) are kept constant. One parameter was adapted according to subjective optical inspection after welding trials, namely, the incoming tape speed. Nonetheless, this parameter affects several other ATP-related phenomena. First of all, the reduced incoming speed automatically increases the net time of direct flame acting on the nip point. Consequently, the surface temperature is believed to rise. Second, the consolidation force acts for a longer duration on the interfaces. This could potentially increase the quality of polymer healing, resulting in higher quality bonding.
After ATP processing, there is a clear increase in width of the welded tape specimens. This is due to the consolidation force acting directly on the tapes. A graphical illustration (Figure 3) is given below to show width factor increase from its initial width of 24 mm. The initial width and final width are all noted before passing the samples for peel testing. High increase in tape width also suggests that the surfaces had a good intimate contact by achieving maximum adhesion.
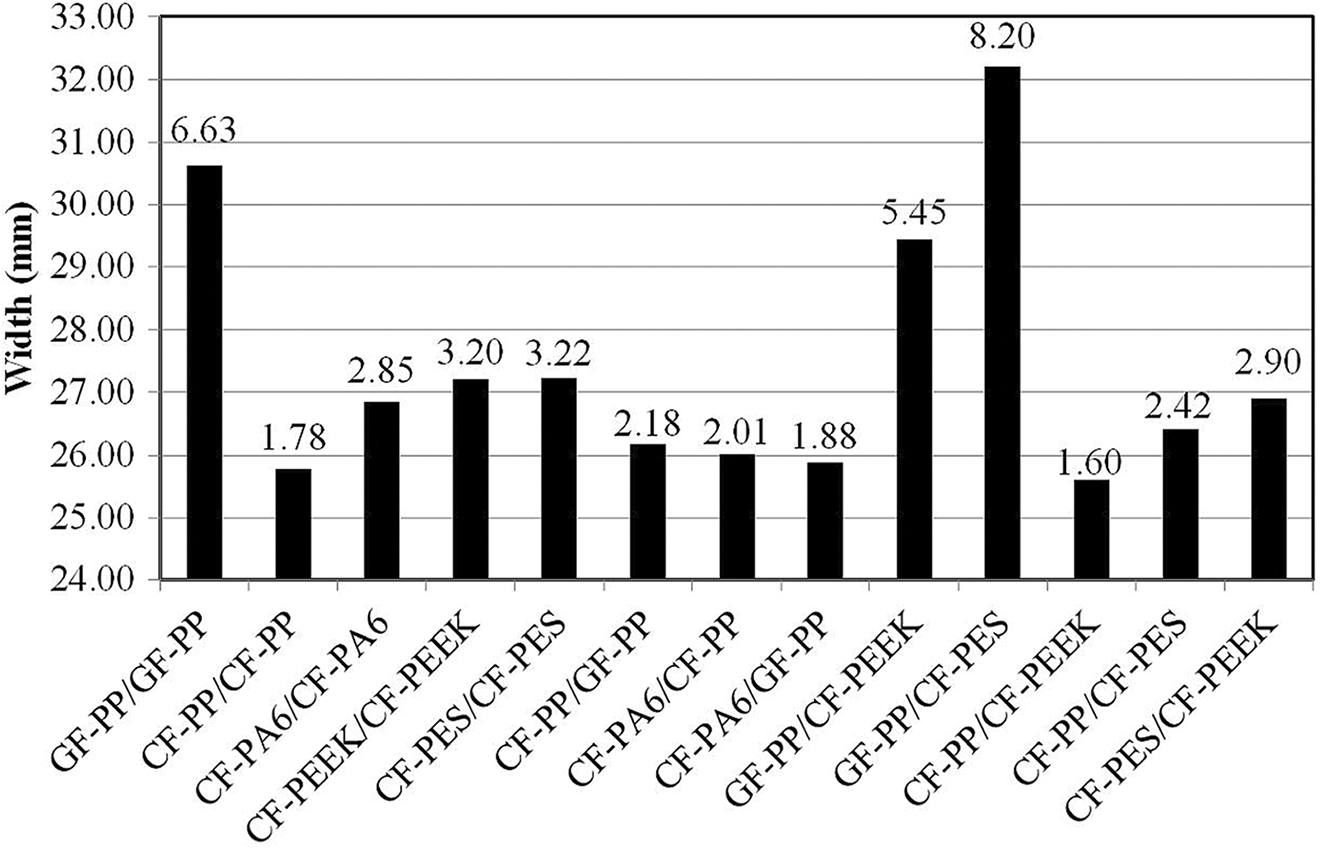
Mean increase in tape width profile for different tape material combination due to consolidation force.
Peel testing
Research work carried out in this article investigates how the wedge peel test compares against pull/T-peel test, and how these tests can help to characterise the adhesion properties of bonded thermoplastic tapes. For the wedge peel test, there is an effect of friction on tapes against the wedge blade but in the T-peel test, there is no such effect since the tapes are pulled apart. A schematic illustration can be found in the following figure.
When using a wedge peel test, the peel test controls the movement of the spindle drive to create the force FP . The output is generated in a form of peel force with respect to tape displacement data. The loading mode is different to that of other readily available peeling methods but the process parameters identified are identical to wedge peel resistance tests and other standard tests like short beam bending or DCB test. 42 Figure 4 shows the test equipment used for peel testing. Compared to the other peel tests explained in the past research work section, the wedge peel test can only be used vertically and at room temperature. This creates an easy qualitative possibility of fast characterisation. The peel sample is loaded vertically and there are steady fixtures that allow for smooth feeding of tape while it is pulled. The tape feeding unit consists of rollers to ensure vertical guiding for the entire peel length. The cleavage section of the tape is held firmly onto the tape alignment unit with the help of screw profiles. The bronze wedge-shaped blade is housed inside the blade housing unit and is rested on two load cells (Figure 4). The load cells are placed above the sensors and during pulling, the signals from the load cells are sent to the sensors for processing.

Wedge peel test rig used for peeling of bonded tapes to study adhesion behaviour.
T-peel test is done using a pull/pressure universal testing machine, Zwick (Z1.0; Zwick GmbH & Co.KG, August-Nagel-Straße 11, 89079 Ulm, Germany). The ends of a bonded tape are held on clamps and a pull mechanism is employed to peel the tapes. A load cell of 1 kN is used during pulling. Bending of the specimen could be a problem during this test. Figure 5 shows the working mechanism of the T-peel/pull test. For both types of peel test, peeling speeds of 0.5 and 0.75 mm/s are chosen. A simple schematic drawing showing the forces acting on the tapes along with the tape dimensions during both peel tests can be seen in Figure 6.

T-peel/pull peel test rig used for peeling bonded tapes to study adhesion behaviour.

Half geometry of the wedge blade used for mathematical modelling.
Finite element model
It is obvious that for the two test setups presented in Figure 7, the measured forces cannot be directly compared. For the wedge peel test, the force is applied in the delamination crack plane, whereas for the pull test, the force is applied perpendicular to the crack plane. The resistance against delamination of the interface can be described by the energy release rate for mode 1 (i.e. normal) loading GI . In a two-dimensional finite element model, the two test setups shown in Figure 7 are loaded and the GI values are evaluated with the virtual crack closure technique. 55 For both test setups, a symmetric model is used because only the CF-polypropylene (PP)/CF-PP and GF-PP/GF-PP combinations were studied. The plies were described by an isotropic elastic material with a Young’s modulus of 98.1 and 14.7 GPa for the CF-PP and GF-PP, respectively. Those stiffness values were extracted from bending tests. A Poisson’s ratio of 0.3 is used for both materials. The calculations are carried out for a ply thickness of 0.15 mm. The model uses quadratic plane-strain elements. The region of the crack tip is discretised with eight elements over the ply thickness and other regions with four elements over the ply thickness.

Schematic of wedge and T-peel/pull test when loaded and applied with a force, Fp .
For the wedge peel test, the wedge or knife is modelled rigidly. The half geometry of the knife is shown in Figure 6. Normal contact between wedge and ply is modelled using the augmented Lagrange formulation of SIMULIA/Abaqus and the tangential contact using a penalty contact algorithm with a friction coefficient of 0, 0.2, 0.4 or 0.6. Note that this friction coefficient is unknown in the wedge peel test, and the model thus shows its influence on the occurring peel forces by the variation of friction coefficient values.
For both the wedge peel test and the pull test, displacements are applied at the end of the ply. The forces due to those displacements are evaluated. At four nodes at the crack tip, the reaction forces and displacements are used to calculate the GI for quadratic elements. The length of the ply from the crack tip to the end, where displacements were applied, is 180 mm. The length of the bonded ply region is 30 mm.
Results and discussion
In total, test samples of 13 different material configurations (Table 6) were produced through ATP and provided for wedge peel testing and T-peel/pull testing, respectively. For both types of testing, two different levels of test speed, 0.5 and 0.75 mm/s, were chosen. In total, this enables the study of three different aspects: comparison of adhesive properties of the different material configurations as determined by the particular test methods, comparison of adhesive properties of specific material configurations as determined with the different test methods and comparison of test results obtained at different test speed levels.
Processing parameters utilised for the production of multi-material bonded tapes using ATP process.

ATP: automated tape placement; PEEK: polyether-ether-ketone; PP: polypropylene; PA6: polyamide 6; PES: polyethersulfone; CF: carbon fibre; GF: glass fibre.
Wedge peel test results
The test results of a typical wedge peel test are shown in Figure 8 by means of an example chosen from configuration no. 7 (Table 6), that is, a sample made of the material combination CF-PA6/GF-PP. Following a region of steady increase in peel force, that is, from the start of the experiment to a displacement of about 100 mm, the characteristics turn into a section of more stable data, which was further analysed in order to determine a peel force value characteristic for the sample under test.

Wedge peel test result showing the variation in peel force with respect to position for a tape material combination of CF-PA6/GF-PP. The displayed graph also shows the different regions during peel testing. PP: polypropylene; PA6: polyamide 6; CF: carbon fibre; GF: glass fibre.
The data characteristics were processed by means of a specifically developed ‘envelope filter’, which represents the mean data (highlighted as solid black line in Figure 8) of top and bottom envelope curves, respectively. These in turn were computed as interpolating curves of local peak and valley data, respectively. In order to derive a single peel force value characteristic for the sample under test, the average value of the filtered data (indicated as a dashed line in Figure 8) was computed.
A full overview of peel force values is given in Figure 9 for wedge peel tests conducted at two different test speeds. The results are visualised by means of average and standard deviation values as determined from testing three specimens for each of the material sample configurations.

Wedge peel test results spectrum for different tape material combinations at varying peel speeds.
T-peel/pull test results
For 5 of the 13 material configurations, in particular configurations 1 (GF-PP/GF-PP), 2 (CF-PP/CF-PP), 5 (CF-PES/CF-PES), 7 (CF-PA6/CF-PP) and 11(CF-PP/CF-PEEK), T-peel tests were conducted. All other material configurations showed critical failure by means of intralaminar fibre breakage. This caused a situation where these specimens could not be characterised.
Figure 10 shows the characteristics typically obtained from a T-peel/pull test as exemplarily chosen from configuration no. 1, that is, a sample from the material configuration GF-PP/GF-PP. Similarly to the results obtained from the wedge peel tests, a section of steady increase of peel force can be seen, which is followed by a section of more stable data. This again was further analysed in order to determine a peel force value characteristic for the sample under test by means of the ‘envelope filter’ and subsequent data averaging.

Typical pull/T-peel test results showing peel pattern as well as maximum and mean for a tape material combination of GF-PP/GF-PP. PP: polypropylene; GF: glass fibre.
The results are finally compared with respect to the test speed and the two different test methods, as shown in Figure 11. While there is no distinct influence from the test speed, the test method clearly shows a significant impact. The results obtained with the wedge peel test method are considerably higher than those gained with the T-peel/pull test method.

Wedge peel test result comparison with T-peel/pull test for chosen tape samples.
Modelling results
Figure 12 shows the energy release rate GI plotted over the peel force Fp evaluated in the pull test model and wedge peel test model. All GI over Fp curves are practically linear. For the pull test (see Figure 12(a)), a peel force of 50 N corresponds with a GI value of 2000 J/m2 and is practically the same for the CF-PP and GF-PP material. If delamination in the pull test would occur at 50 N, the energy release rate GI would be 2000 J/m2. For the wedge peel test (see Figure 12(b)), the GI over Fp curve significantly changes with the friction coefficient µ between wedge and ply. For a µ value of 0 (frictionless), the GI over Fp curve for the wedge peel test corresponds well with the curve for the pull test. At higher µ values, the slope of the GI over Fp curves decreases – for a measured peel force Fp in the wedge peel test of 50 N, the GI value would be 2000, 1200, 820 and 600 J/m2 for µ values of 0, 0.2, 0.4 and 0.6, respectively. Assuming that the critical GI value is the crucial physical parameter that describes the resistance of the delamination crack against propagation, this shows that in the wedge peel test, the friction coefficient can significantly change the measured forces. The curves of the pull test and the wedge peel test with a friction coefficient µ of 0 are nearly identical.

Energy release rate GI evaluated with the VCCT concept over the peel force for (a) the pull test model and (b) the wedge peel test model for different friction coefficients µ. VCCT: virtual crack closure technique.
Discussion
The work in this research article focussed on bonding characterisation of multimaterial interfaces. The results investigated the tape bonding polarity, process temperature analysis of individual tapes, width increase of tapes during ATP trials, two different peel test result comparisons, using varying peel speeds, data selection and filtering to identify suitable plateau region and using a simulation model to understand the effects of release energy in both peel test types.
The polarity of the tapes is of high importance and hence the measured CA values do help in understanding which tapes can actually bond against each other. The peeling of similar tape pairs depends on cohesion of the matrix, while peeling of tapes with different combinations depends on adhesion between the materials. Therefore, similar tape pairs tend to have higher peel force compared to tape combinations. Figure 9 confirms this trend. Tape combinations with CF-PES/CF-PA6 or PES with PP also showed reproducible results with the least errors when tested under different speeds. Lesser errors confirmed that the samples are reproducible and the adhesion between tapes tends to be more stable.
Cross-comparison of results was carried out using wedge and T-peel test results. Wedge peel test gave higher peel forces compared to that of T-peel/pull test. The samples tested with the wedge peel test should be carefully picked because any microcracks can cause the wedge blade to tear the tape samples. For the T-peel/pull test, the biggest concern was the bending stresses during pulling. When the cleavage end of the tape samples is clamped onto the testing machine (Figure 7(b)), the bonded part of the tape is left hanging under the influence of gravity. Those bending stresses might alter the measured peel forces. A typical peel result exhibits high force oscillations under the influence of staged crack development, as shown in Figure 13. In Figure 13, it can be clearly seen that there is a dramatic decrease in peel force.

A typical peel result obtained from T-peel/pull test for a tape sample GF-PP/GF-PP, showing dynamic behaviour in peel force recordings. PP: polypropylene; GF: glass fibre.
The results in Figure 12 indicate that in the pull test, the peel force Fp shows a linear dependency on the energy release rate GI . For the wedge peel test, this dependency is also linear but itself depends on the friction coefficient µ between the fractured surfaces and the wedge. Since those µ values are hard to obtain – no friction tests can be made of the fractured surface and the bronze surface of the wedge beforehand – it is hard to use the wedge peel test even for qualitative comparisons. If a certain ply combination shows higher peel forces than another ply combination, this can be either due to higher GI values or due to higher µ values. Further studies would have to be made to measure friction coefficients and thus help to extend the applicability of the wedge peel test.
Conclusions
The work presented here compared surface adhesion between tape materials using two different peel-type testing methods. The characterisation was made through its polarity, peel region, bonding capabilities and the flaws during ATP processing of tapes, and also a peel model was made to study the effect of friction on peel force. A string of conclusions can be drawn from the above work and they are listed below: Peel speed affects the peel force by increasing the force with speed. However, few tape combinations of CF-PES/CF-PES, CF-PA6/GF-PP and GF-PP/CF-PEEK showed negative response to peel speeds. This could be due to the polarity that affects the adhesion between tapes of different surfaces. For CF-PES/CF-PES, the peel force obtained was low and the obtained peel results showed highly oscillating regions that made the mean value evaluation difficult. Wedge peel test results showed regions with stable data points, but in the case of the T-peel/pull test, the scatter of data is highly oscillating, hence showed lesser stable data points for evaluation. The plateau region with steady data region was sometimes difficult to identify when evaluating the mean peel force. There are many reasons why the peel force result can sometimes show oscillating characteristics. Micro-cracks can be one reason and this is confirmed on comparison with the smoother data in the results of the wedge peel tests than those of the T-peel/pull test. The friction on tape surface can also have an influence on bonding during ATP production because there were times when the consolidation roller that applied pressure was dragged along the tape surface rather than having a controlled rolling motion. This could only reduce the peel forces in those regions where welding was affected due to the friction between roller and tape. The modelling results confirm the dependency of peel force on the friction coefficient value of tape surface with the wedge blade surface when using a wedge peel test. In the wedge peel test, there is, however, an uncertainty about the friction coefficient between wedge and ply. There is also no straightforward calculation of GI
from peel forces. In the case of a pull test, a direct calculation of GI
from peel forces is possible but there are higher force oscillation amplitudes generated during peeling.