
Abstract
The therapeutic potential of Kunzea ambigua essential oil is experiencing increased market demand. However, commercial production is currently limited by variability of wild-harvested feedstock so that managed production from high yielding clones is desired. This study explored the utility of near infrared (NIR) reflectance spectroscopy to predict total extracted oil and the major terpenes from intact and ground K. ambigua leaves. Partial least squares regression enabled accurate prediction of total extracted oil and the concentration of α-pinene, globulol and viridiflorol but not α-terpineol (the major components). This was the case for both ground and intact leaf samples, though the coefficients of determination (r2) values were lower for the intact leaf samples (r2: 0.59 to 0.71, ratio of residual prediction to the deviation, RPD: 1.4-5.0, RMSEP: 0.53-2.27 mg/g) as compared to the ground samples (r2: 0.72-0.88; RPD: 1.9-8; RMSEP: 0.32-1.40 mg/g). In contrast, a NIR predictive model was produced for ground but not intact samples for 1,8-cineole (r2: 0.72; RPD: 1.9; RMSEP: 0.42 mg/g). Though the predictive models developed in this study were less accurate and less precise than for the intact samples, this technology could still be immediately useful and allow for rapid identification and screening for superior K. ambigua genotypes from native vegetation for both total extracted oil and preferred chemical profiles.
Introduction
There is increasing demand for the essential oil of Kunzea ambigua (local: tick bush). Kuzena oil has a spicy medicinal aroma with eucalyptus, woody and sweet notes, and is currently included in many cosmetics and personal care products. 1 Belonging to the Myrtaceae family, this woodland shrub is indigenous to Australia and New Zealand. Research into the chemistry of Kunzea species is limited to a few studies2–5 with recent evidence indicating that the quality of wild harvested K. ambigua essential oil can be highly variable in both oil yield and profile. Oil yield can range from 0.2 to 2 % dry weight and major monoterpene components include α-pinene (0.6–62.5 %) and 1,8-cineole (3.6–14.5 %) while the major sesquiterpenes include globulol (0.5–22.6 %), viridiflorol (0.3–38.0 %) and ledol (1.3–4.8 %).2,5,6 The essential oil of K. ambigua has been recognised by the Australian Therapeutic Goods Administration (TGA).
Historically, quantification of extracted oil yields has relied on analytical methods based on gas chromatography (GC), which are technical in addition to being laborious and expensive. Near infrared (NIR) spectroscopy is a rapid, non-destructive vibrational spectroscopy technique that uses light in the near infrared region (780 – 2500 nm), which when combined with chemometrics has enabled the rapid analysis of extracted oils of both herbaceous (e.g. basil7,8) and perennial species.8–10
The majority of NIR studies have developed robust partial least square (PLS) regression models to allow quantification and identification of terpenoids of the extracted oil itself,11–14 from pelleted8,10 and dried and ground samples,5–18 However, fewer NIR studies have been reported for intact fresh or dried samples for terpenoid analysis (e.g. dried leaves of Salvia officinalis 19 ; dried flower buds of Egletes viscosa 20 ; fresh Pinus radiata needles and bark 10 ).
The current study was undertaken to investigate whether NIR spectroscopy would be suitable for the prediction of K. ambigua total extracted oil as well as the concentration of five key terpenes (α-pinene, α-terpineol, 1,8-cineole, globulol, and viridiflorol) in intact and homogenised fresh leaf samples. Previous studies have confirmed that small-scale solvent extraction can be used to accurately predict the essential oil yield of both K. ambigua 5 and tea tree (Melaleuca alternifolia) leaves. 21 This study hypothesized that homogenised leaf samples would provide the best predictive model. If suitable, this technology would enable in situ rapid identification and screening of superior genotypes in wild populations for subsequent propagation and commercialisation.
Materials and methods
Sample collection
In June 2022, leaf samples were collected from wild populations of K. ambigua growing on the east coast of Tasmania (see Supplementary Table 1 for GPS coordinates of the main locations). Approval for the collection of leaf samples of K. ambigua was obtained from the Department of Parks and Wildlife, State Government of Tasmania under permit number FL 22304. A further 13 samples were obtained from potted plants located at the Horticultural Research Centre (University of Tasmania) that had been previously collected from other locations around Tasmania (Flinders Island, Mount William, St Helens and Scottsdale) and propagated. A total of 151 leaf samples were collected for the experiment.
Field spectral measurements
NIR spectra of leaf samples were obtained the day after harvest using a portable Fourier transform FT-NIR spectrometer (ARCoptix FT-NIR Rocket, Switzerland). Normally this instrument is capable of in situ field measurements, however, this was not possible during the field trip due to a logistical error, which was corrected the next day. The lanceolate leaves of K. ambigua are relatively small in size (∼0.5–1.3 cm in length and 0.2 cm wide), therefore, multiple leaves (∼250) were stripped from branches located along the middle of the shrub growing in a northern aspect, and compressed into a prototype leaf holder (Supplementary Figure 1) then randomly scanned with a StellarNet R600-MAX utilising a fibre optic probe. Spectral data was acquired in the range of 3992–11 104 cm−1 with a spectral resolution of 8 cm−1. Eight scans were used for the external background (Halon RS50 standard) and sample measurements. The probe was regularly cleaned with ethanol and background measurements were performed at every change in location. The three spectra per sample were later averaged to obtain one single spectral file per sample for both calibration and validation data sets.
Chemical analysis
For each individual sample, 5 g of leaf material was dried for 3 days (72 h) at 60°C to determine moisture content while the rest was finely ground with liquid nitrogen in a mortar and pestle for both solvent extraction and NIR spectroscopy (3 g). For the latter, the ground, homogenised leaf samples were placed in 10 mL snap cap vials (ND18, 50 × 22 mm, Kinesis Australia Pty Ltd, Qld, Australia) and stored at −20°C until ready for scanning on the next day.
Terpenes were extracted from ∼2 g of homogenised samples in 10 mL of dicholoromethane (containing 1 mg/mL of octadecane as an internal standard). The samples were agitated on an automated shaker (KS 500, Janke & Kunkel IKA-Werke GmbH, Stauffen, Germany) for 24 h at 4°C. Then, 1 mL of the extract was filtered through a 13 mm 0.45 μm PTFE syringe filter. All samples were stored at −20°C and analysed within one week of extraction. Further, a total of six samples were measured in triplicate to ensure quality control of the laboratory method. The laboratory method error was determined by averaging the standard deviation of the triplicate analysis. 19
Quantitative analysis of the dichoromethane extracts was performed by gas chromatography (Agilent 8890GC system, Santa Clara, US), which was equipped with a flame ionisation detector (FID) and a HP-5 crosslinked methyl siloxane column (30 × 0.32 mm, film thickness 0.25 µm) following a modified micro extraction method by Park et al. (2022b). 5 Briefly, injector and detector temperatures were set at 220°C and 300°C, respectively. Oven temperature was increased from 30°C to 210°C at 6°C/min and then to 280°C at 25°C/min. The total analysis time was 28 min 1 µL was injected at a split ratio of 50:1. Peak areas and retention times were measured by electronic integration, and quantitation was obtained by peak normalization of GC/FID data.
The amount of each component in the K. ambigua oil was calculated based on a 1:1 response ratio of the component to the internal standard (which was confirmed with a selection of commercial standards including α-pinene, limonene, terpinene-4-ol, α-terpineol, citronellol and globulol 5 ):
mg of component in Kunzea extracted oil = area of peak area of octadecane × mg of octadecane.
Percentage of chemical components in Kunzea extracted oil was calculated as follows; % in component in Kunzea extracted oil = mg of component in Kunzea extracted oil mg × 100.
Identification of the major terpene peaks present in K. ambigua extracted oil was confirmed using a Bruker-300 triple quadrupole benchtop GC-MS (Bruker Corporation, Billerica, USA). The same column was used with similar experimental conditions to those described for the GC FID except that the carrier gas was helium at a flow rate of 1.2 mL/min. The ion source temperature was 220°C and the transfer line was held at 290°C. The range from m/z 35 to 350 was scanned three times every second. The identification of individual peaks was done using their Kovats Indices (KI)2,22 and MS data were compared to those for standard compounds in the MS database of National Institute of Standards and Technology (NIST) (Supplementary Figure 2).
Laboratory spectral measurements
Near infrared spectra of 151 homogenised samples were acquired by placing samples in quartz vials on a 30 position sample wheel and the spectra were acquired using the integrating sphere of a Bruker MPA FT-NIR spectrometer
Chemometrics and data analysis
Spectral files for both homogenised and intact samples were imported into the Bruker OPUS software version 8.1. Using the respective measured oil concentrations and the Quant 2 analysis software package and the optimise feature in the software, it was possible to optimise the spectral pre-processing and spectra ranges for PLS regression. It was found that the ideal method was a multiplicative scatter correction (MSC) followed by a first derivative using the Savitzky Golay (SGolay) method with 9 smoothing points in the spectra range of 4200–9400 cm−1. Using the suggested spectral pre-processing and range, PLS regression and principal component analysis (PCA) models were created using Unscrambler X version 10.5.1 (CAMO Software, Oslo, Norway).
Statistical summary for the parameters used, showing the calibration and validation datasets and the laboratory method error.
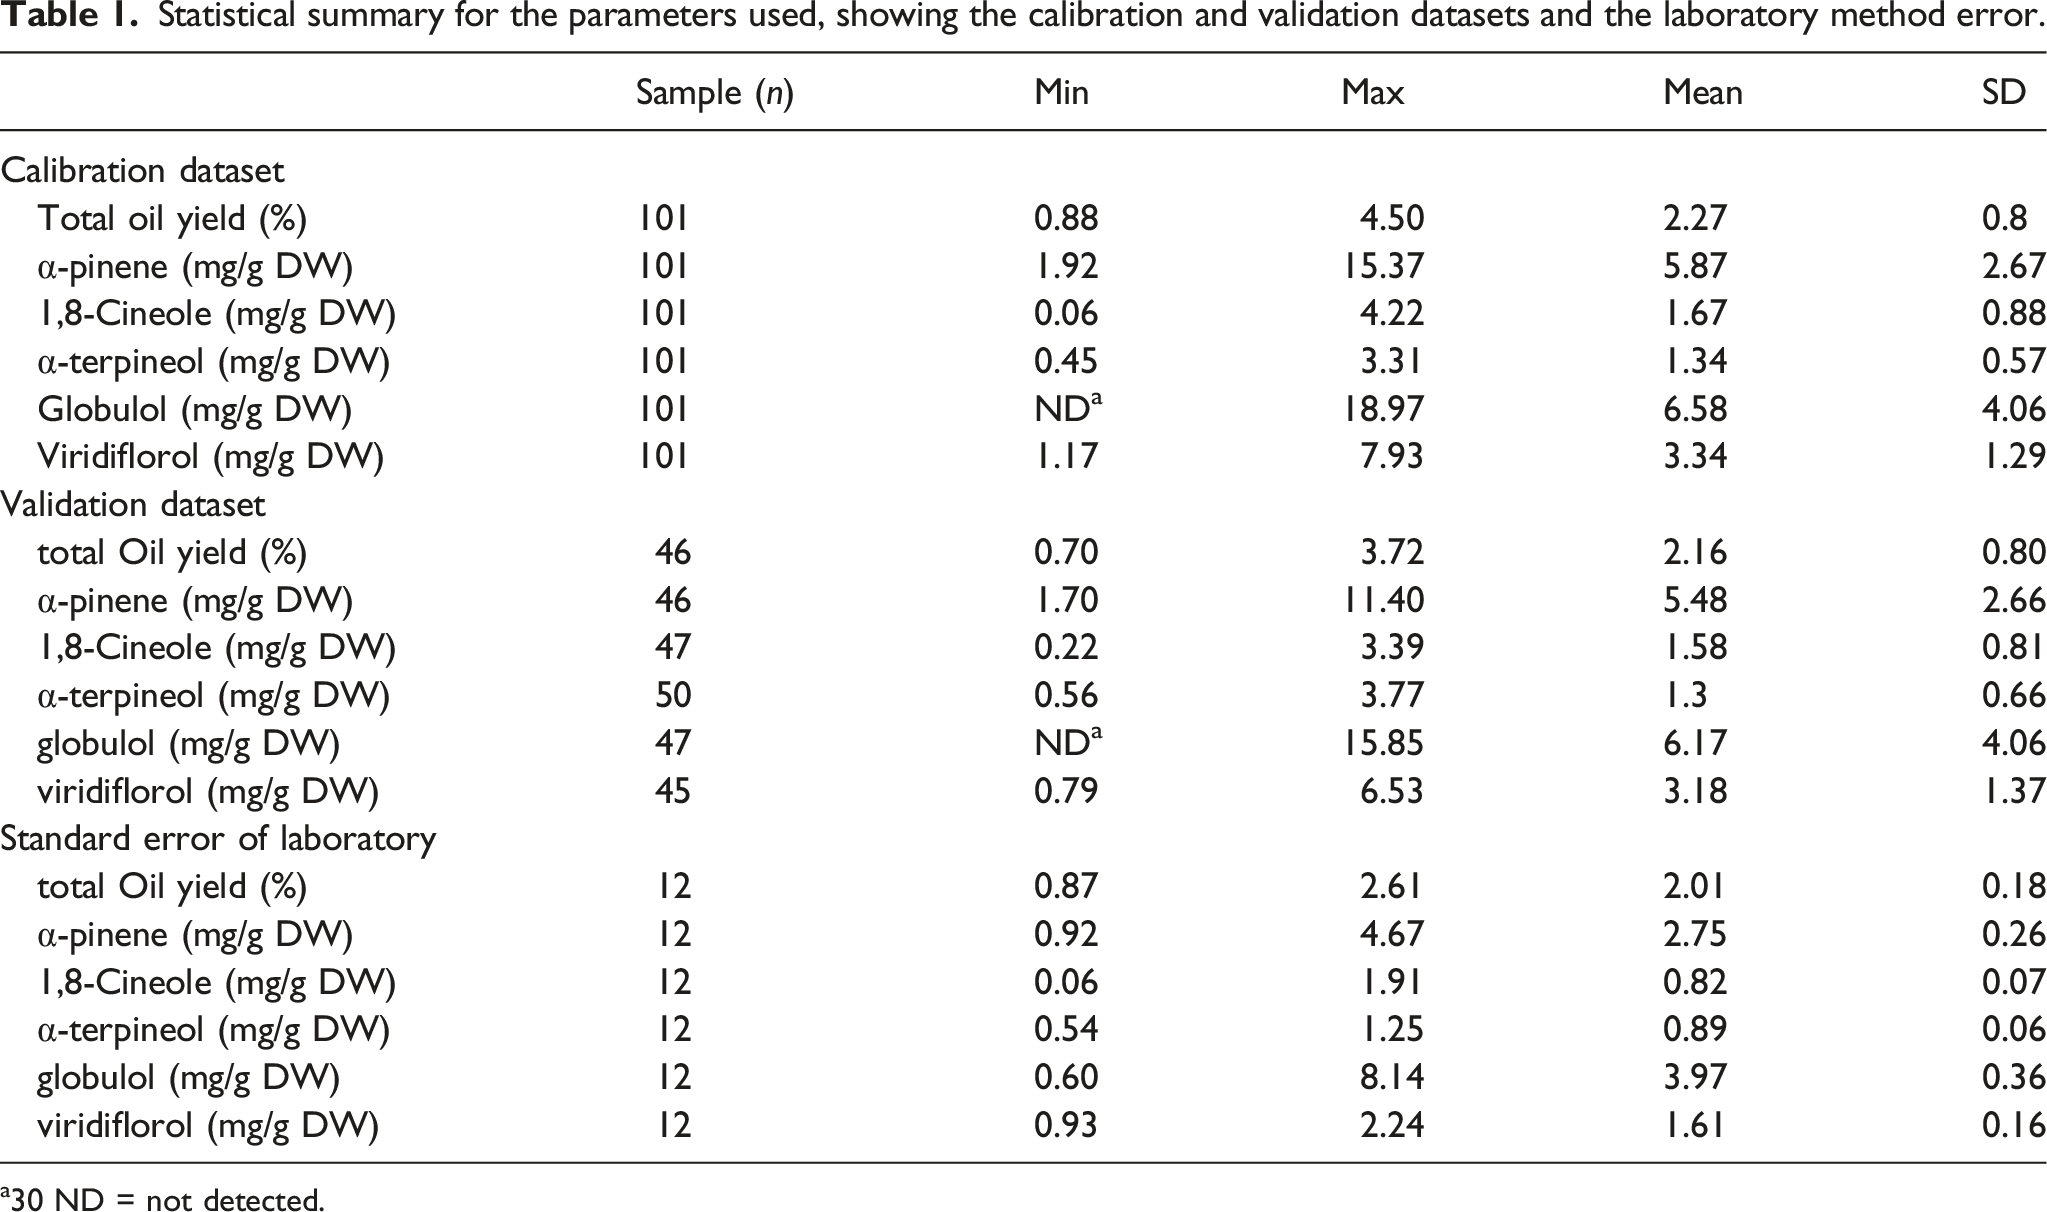
a30 ND = not detected.
Results
Table 1 shows the maximum, minimum, mean and standard deviation (SD) for the total extract oil (%) and terpene concentrations (mg/g) of the calibration and validation datasets analysed in this study. Calibration and validation populations were very similar for total extracted oil and individual terpenes. Figure 1 shows the absorption spectra of all homogenised K. ambigua leaf samples. A wavelength range of 4248 – 9400 cm−1 was used to develop the calibration model with dominant bands of interest occurring between 5824 and 5928 cm−1, indicating the region of first overtone of C-H stretches, and bands occurring between 4280 and 4428 cm−1, indicating the region of C-H combinations (Figure 1). (a) Raw absorption and (b) multiplicative scatter correction spectra acquired for homogenised Kunzea ambigua leaf samples collected from 151 samples.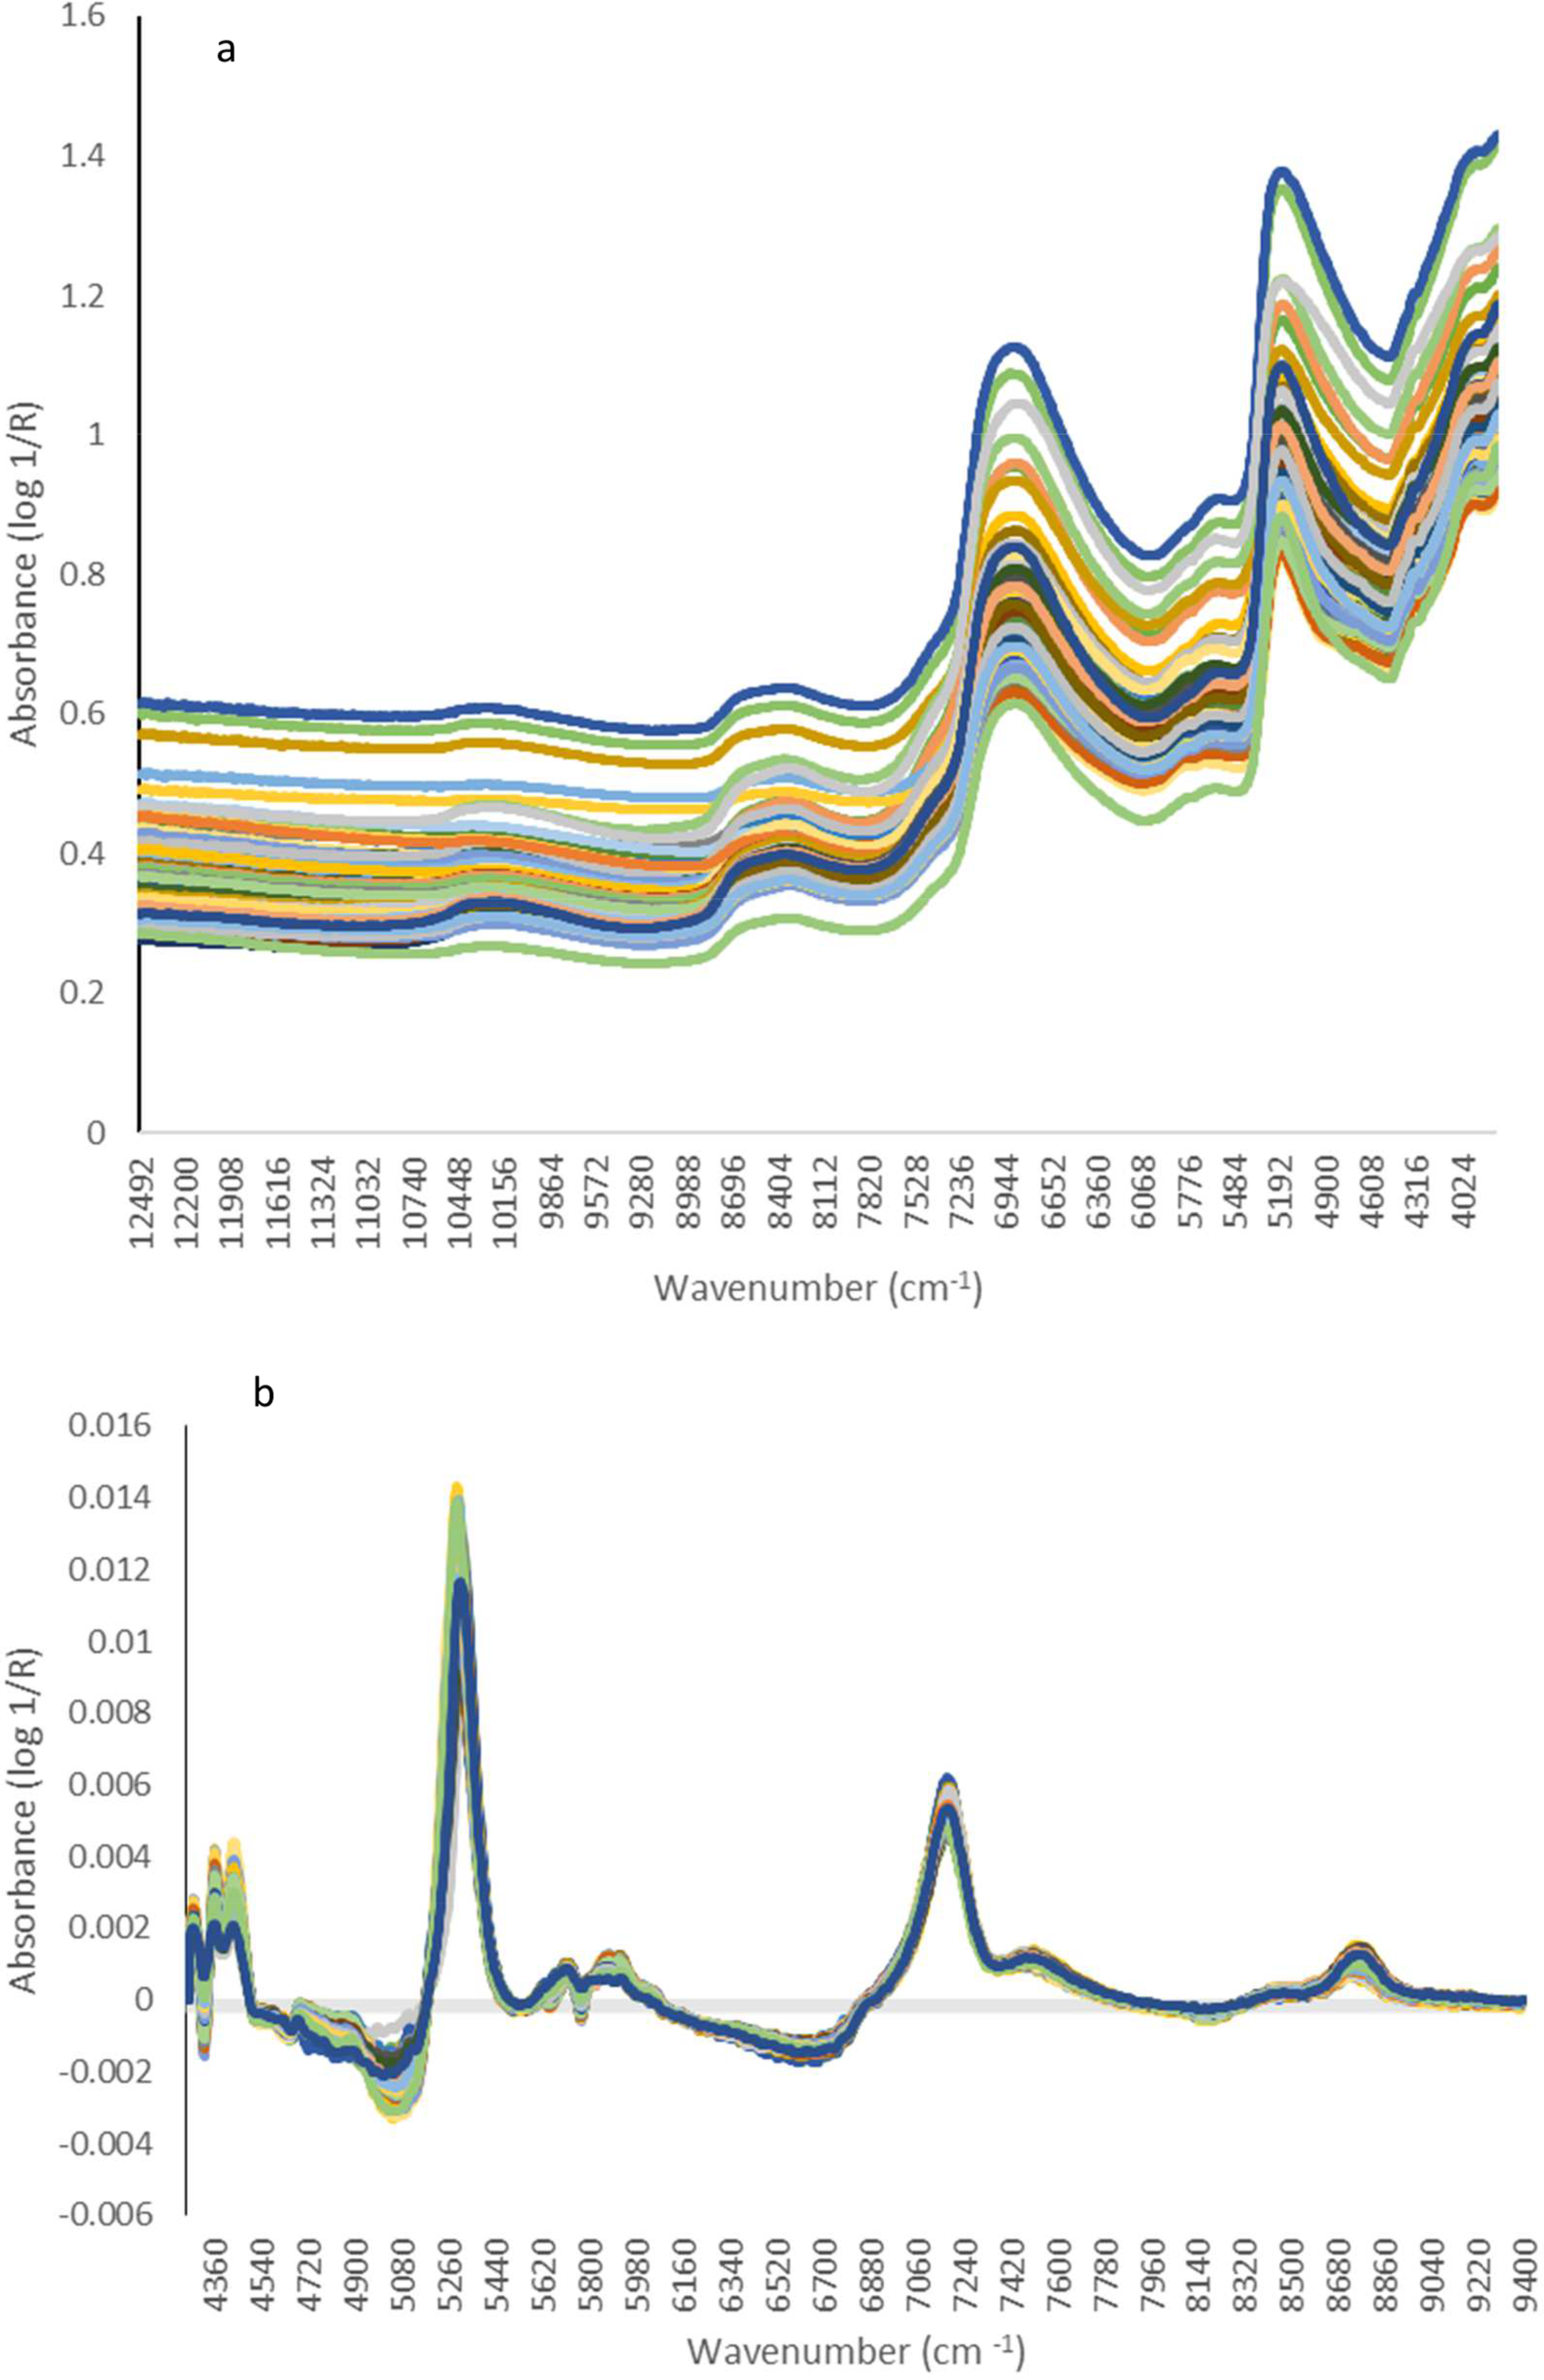
NIR comparison of homogenised and intact samples of total oil yield
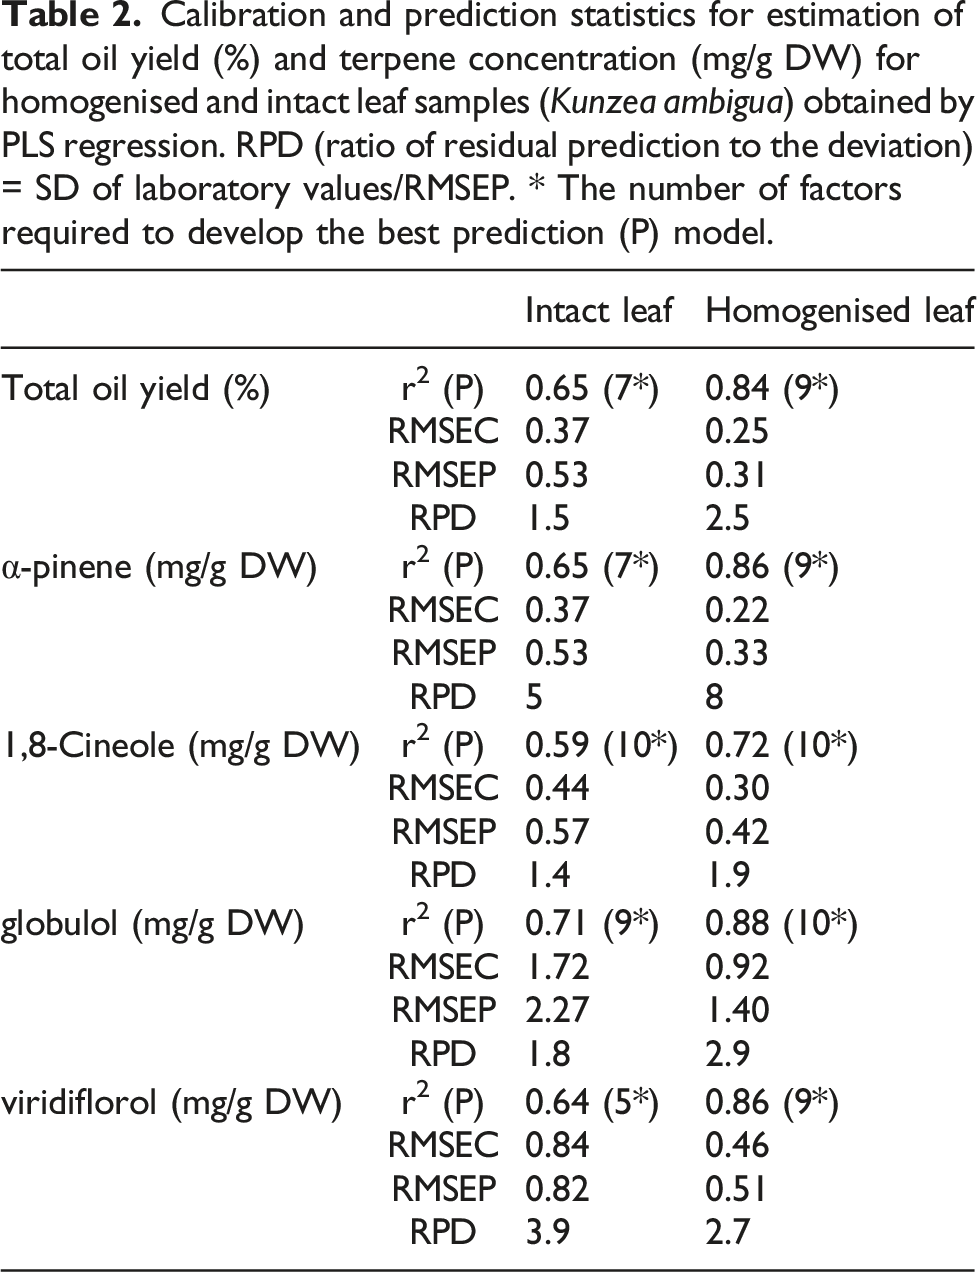
For total extracted oil, the highest r2 and lowest RMSEP for both intact and homogenised K. ambigua leaf samples were obtained from a 7- and 9-factor model, respectively. Homogenised leaf samples produced a more accurate and robust model (r2 = 0.86, RMSEP = 0.33 %) compared to intact leaf samples analysed by portable NIR (r2 = 0.65, RMSEP = 0.53 %) (Figure 2, Table 2). Scatter plots of measured total oil yield (%) and values predicted from NIR leaf spectra of (a) intact and (b) homogenised samples using PLS regression to determine appropriate model. Blue dots and dashed lines show calibration plots and red dots and solid lines show validation plots. r2 and error values are presented in Table 2. Calibration and prediction statistics for estimation of total oil yield (%) and terpene concentration (mg/g DW) for homogenised and intact leaf samples (Kunzea ambigua) obtained by PLS regression. RPD (ratio of residual prediction to the deviation) = SD of laboratory values/RMSEP. * The number of factors required to develop the best prediction (P) model.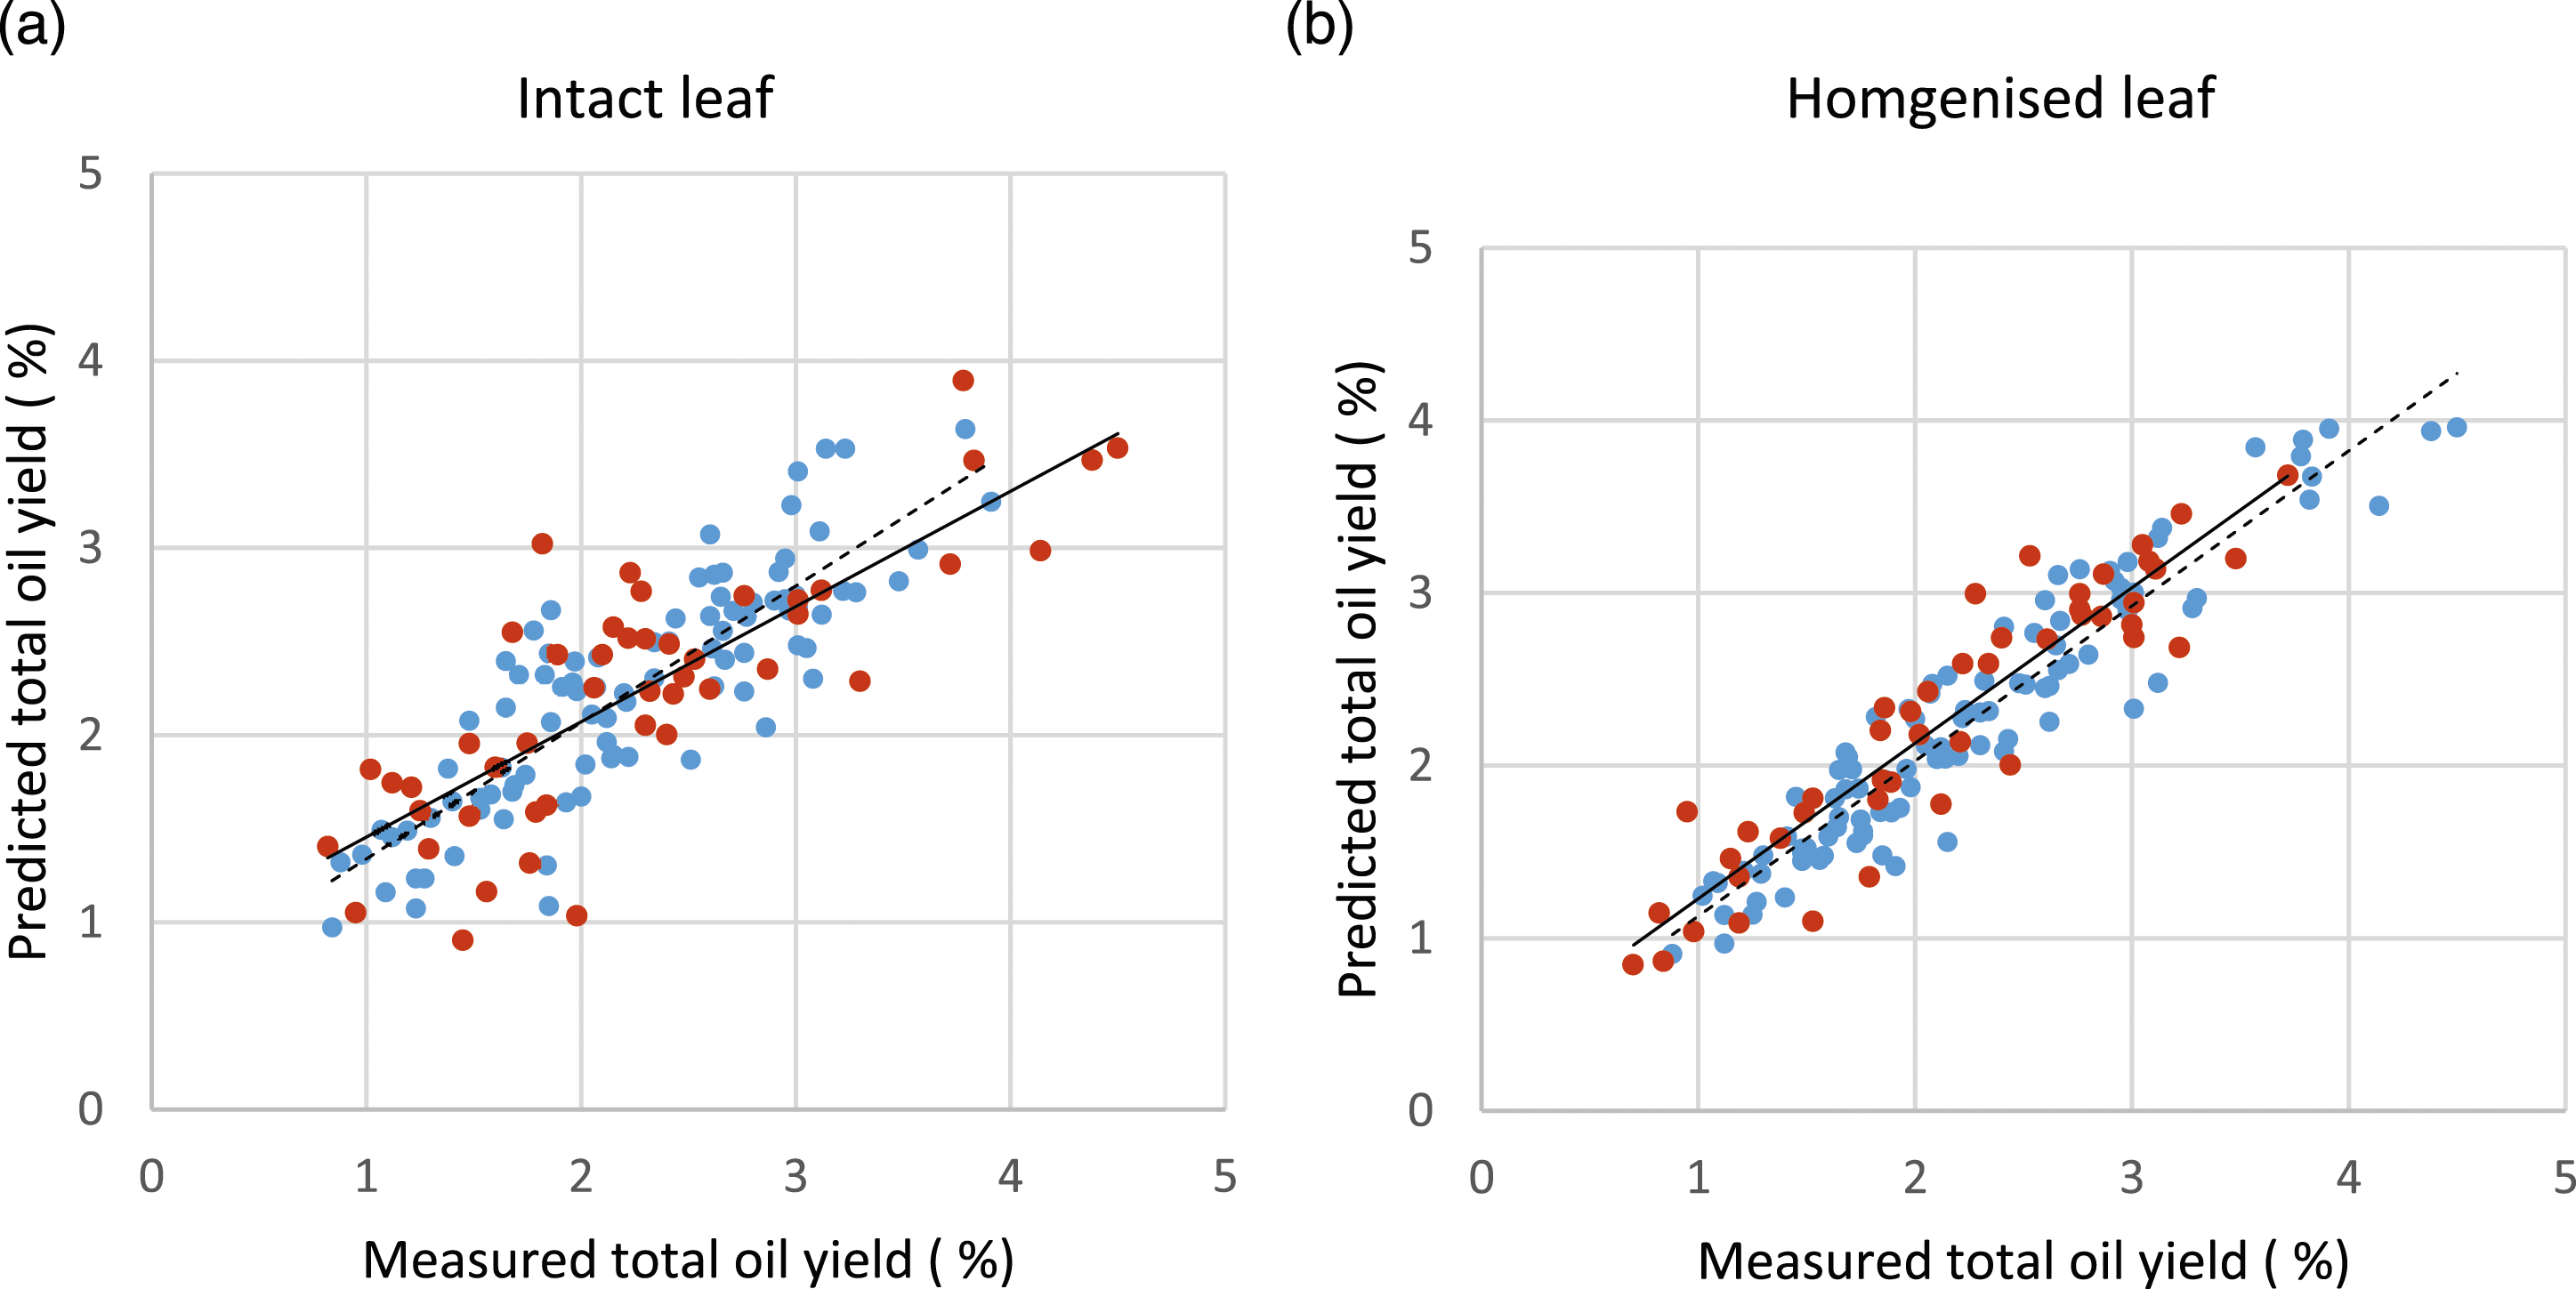
NIR comparison of homogenised and intact samples of selected terpenes
Despite a skew towards low and medium concentrations due to a lack of samples with high concentrations for all individual terpenes (Supplementary Figure 3), it was possible to obtain strong correlations between GC analysis results and NIR data for four out of the five individual terpenes (globulol, α-pinene, 1,8 cineole and viridiflorol, in decreasing order of r2 values) from the homogenised samples (Figure 3, Table 2). The best prediction models were based on the inclusion of up to 10 factors (Table 2). Of the four terpenes, globulol had the strongest correlation (Figure 3) (r2 = 0.88 homogenised), however globulol also had the highest RMSEP error of 1.40 mg/g (Table 2). In contrast, a very weak correlation was observed for α-terpineol (Figure 3). The histogram plot of α-terpineol showed a non-normal distribution due to the skew towards the low measured constituent values (Supplementary Figure 3). Similar correlations between terpene concentrations and NIR spectra were observed for intact leaf samples; though the accuracy was reduced, as indicated by the lower r2 and higher RMSEP values for all the parameters measured (Table 2). Scatter plots of measured total oil yield (%) and values predicted from NIR homogenised leaf spectra using PLS regression to determine appropriate model for five individual terpenes (α-pinene, 1,8-cineole, α-terpineol, globulol and viridiflorol). Blue dots and dashed lines show calibration plots, and red dots and solid lines show validation plots. r2 and error values are presented in Table 2.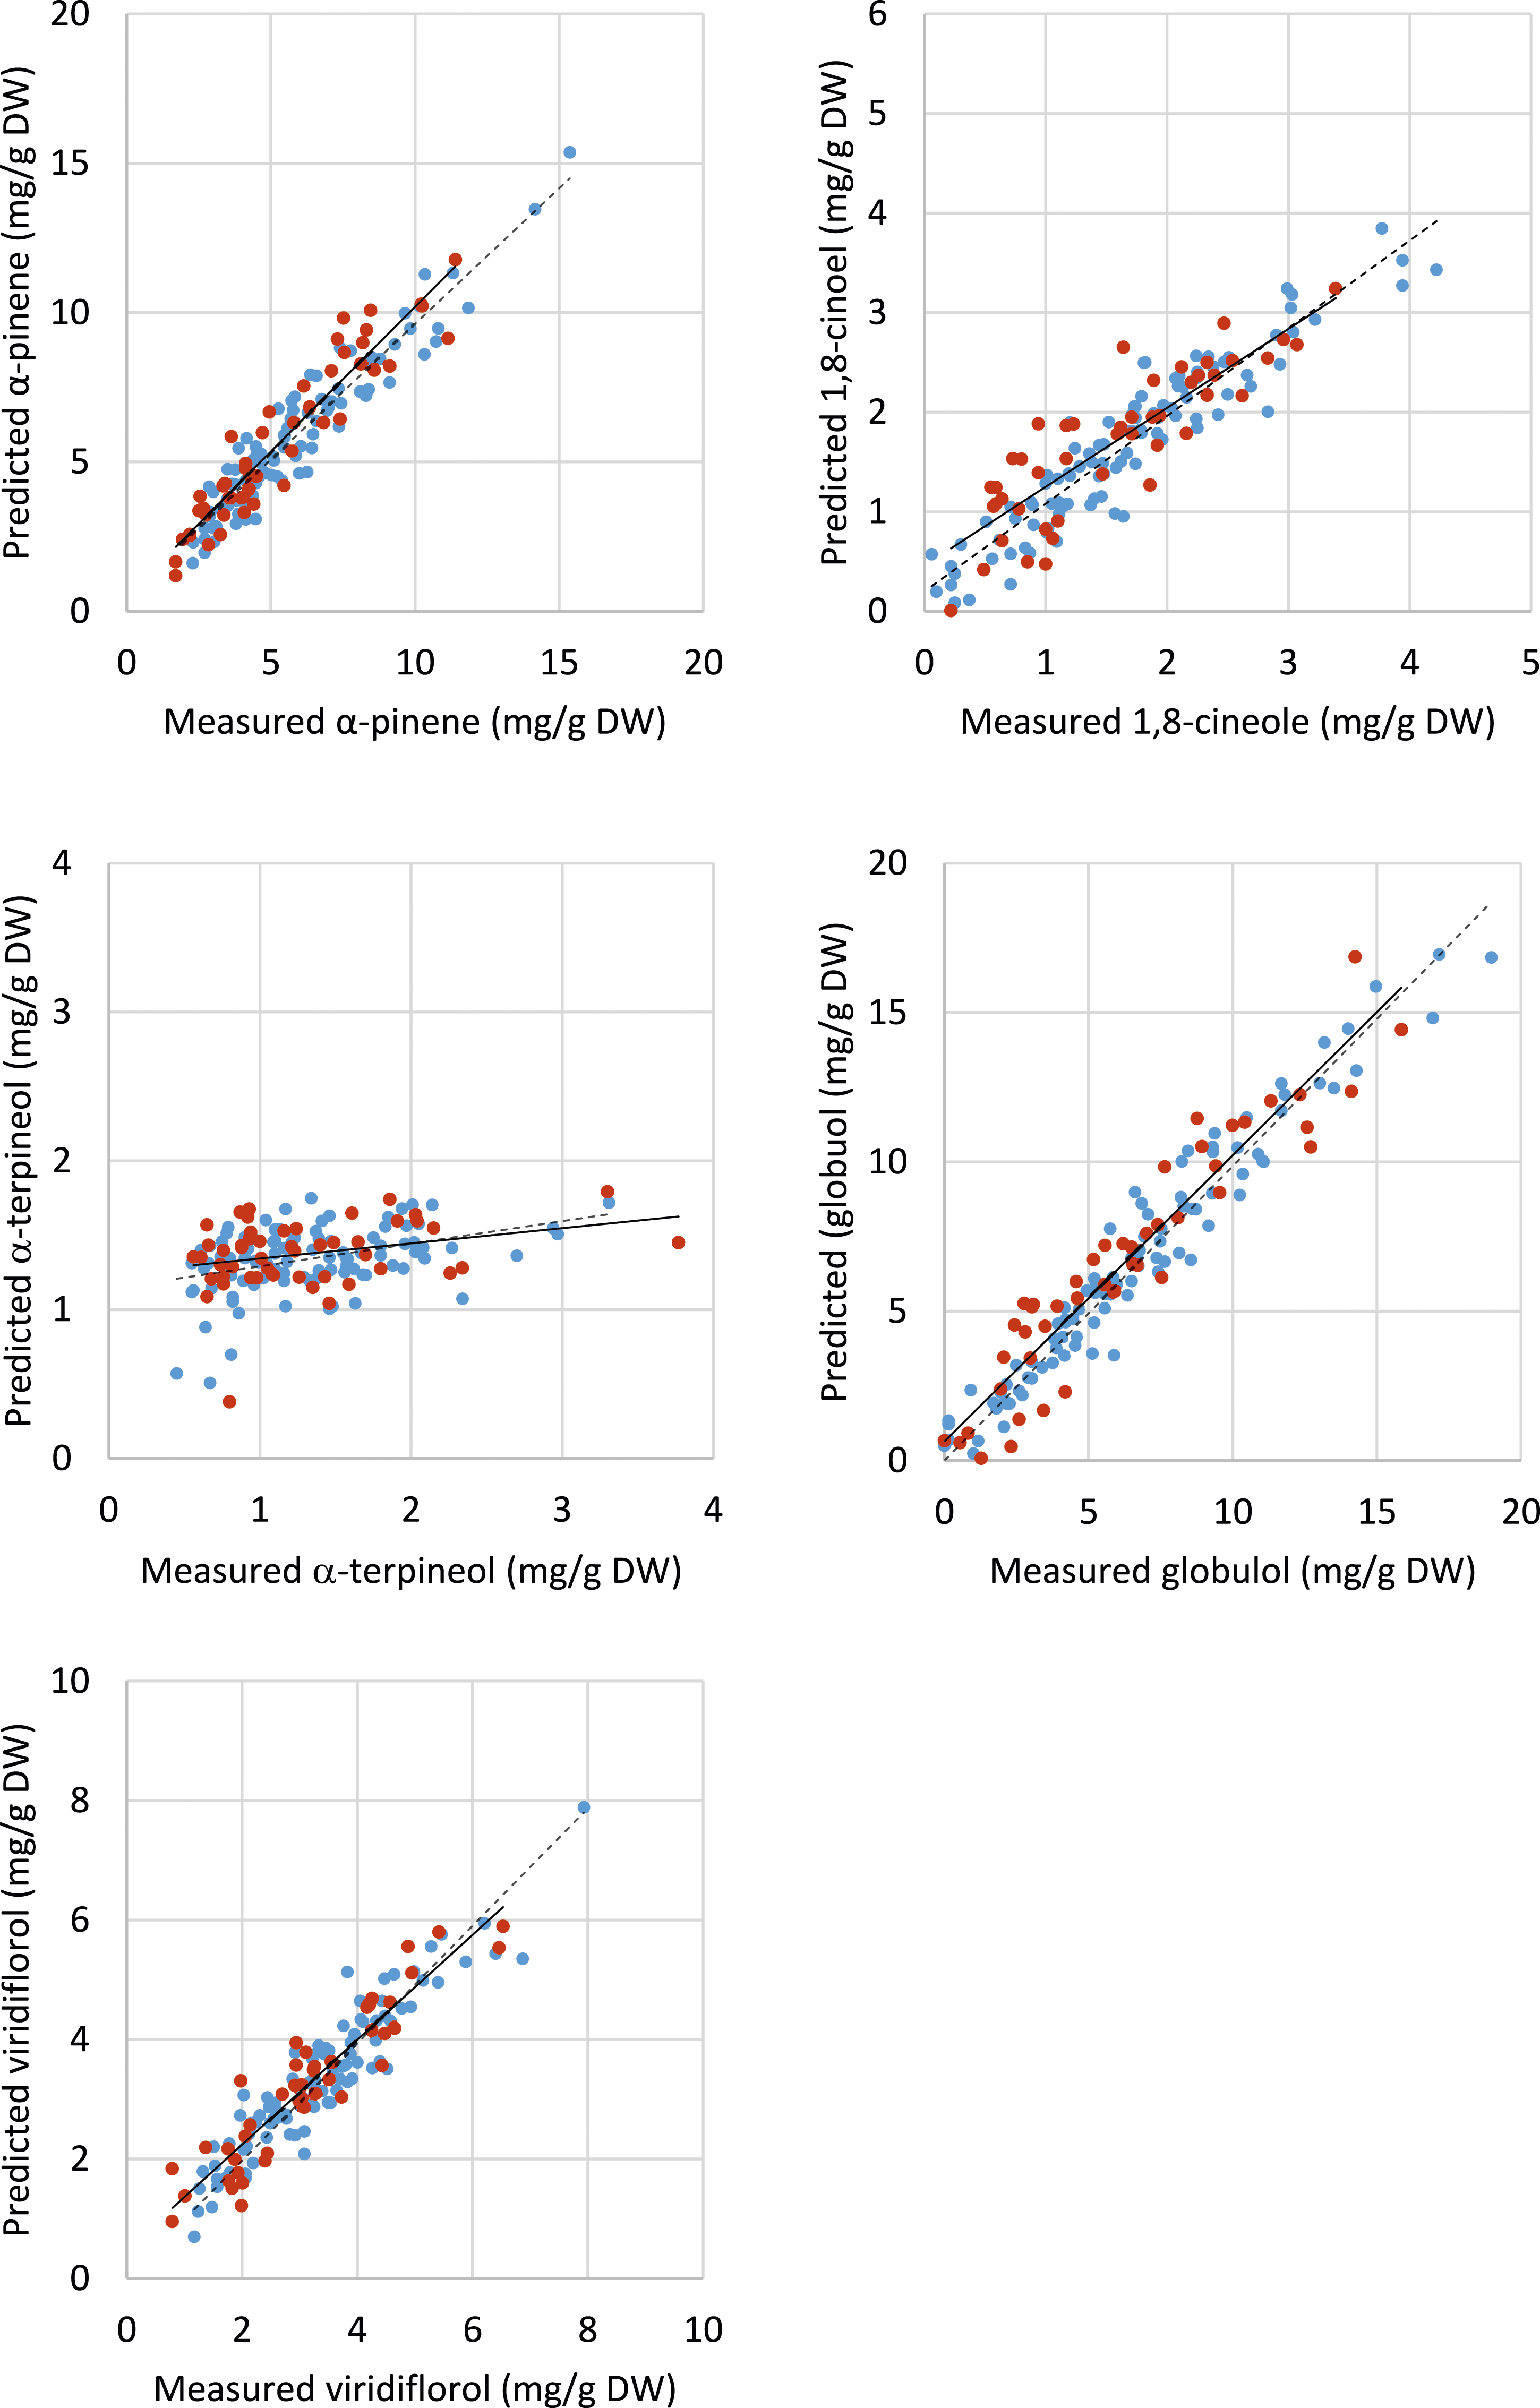
Discussion
In this study, a robust predictive model for total extracted oil was developed for homogenised K. ambigua samples, while a less accurate model was obtained for intact leaf samples. Good correlations of NIR spectra to terpene concentrations were also obtained for four of the five major terpenes (r2 ranging from 0.72 to 0.88 and RMSEP ranging from 0.32 to 1.40 mg/g for homogenised samples). These results are consistent with previous studies that demonstrated strong models for individual terpenes in other plant species. Particularly high values of prediction have been obtained for pure essential oils (r2 > 0.9714,25) and while still robust, relatively lower r2 are typically obtained for ground samples. 10 In contrast, the development of prediction models for intact heterogenous plant samples continues to be challenging (e.g. starch in grapevine cane wood 26 ; geographic origin of Prunus dulcis 27 ; cannabinoids in industrial hemp 28 ).
Issues with developing accurate prediction models of intact samples have been related to variation in moisture content of the sample, sample size/shape and insufficient coverage by the NIR light beam.26,27 For K. ambigua, the distribution of the oil glands in the foliage may also be a contributing factor to the lower correlation of NIR spectra to GC data of intact samples. Unlike other Kunzea species, K. ambigua oil glands are primarily located on the abaxial surface of the leaf (Supplementary Figure 4). Further, as the leaves of this species are relatively small in size, multiple leaves were scanned which in practice meant that it was not possible to control the orientation of the leaves and most likely, the probe measured a mixture of abaxial and adaxial leaf surfaces.
Despite the challenges of small leaf size and abaxial oil glands, the predictive models obtained for intact samples in the current study are sufficiently good for immediate industry application without further development. The current model could, for example, be used for non-destructive measurements in the field to screen individuals and allow for rapid identification of genotypes with the highest total extracted oils and desirable components. Although the RPD value of total extracted oil was lower than the preferred minimum value of 2.5, the fact that RPD values of individual terpenes including α-pinene and viridiflorol were 5, and 3.86, respectively, indicate there is potential to develop more robust models for intact leaf samples with further input from more sampling.
The RPD values also suggest that the robustness of the model varied with individual terpenes. RPD values >5.0 were obtained for α-pinene for both intact and homogenised samples. In contrast, RPD values <1.9 were obtained for all samples of 1,8-cineole. For the latter, the SD of the GC data was relatively low at 0.81 mg/g DW, which is perhaps not unexpected given the values for 1,8-cineole ranged from not detectable to 4 mg/g DW (Supplementary Figure 3). In contrast, the SD of α-pinene was much higher at 2.67 mg/g DW, perhaps reflecting the variability that may be expected for a wider data set from 0 to 15 mg/g DW (Supplementary Figure 3). The SD values of the GC data measured in this study appear to be similar to those published in previous papers that evaluated NIR predictive models for essential oil yield15,18 and individual plant terpenes in heterogeneous samples.11,17,18 Regardless, if improved accuracy is required, future models could potentially solely target the abaxial surface though this may be challenging in the field, as well as increase sampling to consider seasonal effects, in addition to variation due to K. ambigua chemotypes. 29
Conclusion
There is increasing consumer interest and demand for essential oils of native Australian plants particularly K. ambigua for its therapeutic health uses, organic animal health treatments and aromatherapy. As K. ambigua is endemic to Australia there is opportunity to greatly increase K. ambigua production to meet the growing demand. As indicated by the results, NIR spectroscopy has the potential to consistently measure total extracted oil and four key terpenes in K. ambigua of homogenised leaf samples. Though the predictive models developed in this study were less accurate and less precise for the intact samples, this methodology could still be immediately useful and allow for rapid identification of superior K. ambigua genotypes in the field, not just in terms of total extracted oil but desirable oil profile, particularly viridiflorol, globulol and α-pinene. Even the higher RMSEP values of 2.27 % for globulol would still allow clear practical differentiation between individuals in the field, given than that the concentrations of this terpene ranged from less than limit of detection to 15 %. More broadly, the promising results from this study indicate that NIR spectroscopy may also be developed for efficiently predicting total extracted oil and individual terpene concentrations for other commercial species in which their essential oils are extracted for herbal, medicinal and aromatherapy products.
Supplemental Material
Supplemental Material - Prediction of total extracted oil and major terpenes in leaves of Kunzea ambigua using near infrared reflectance spectroscopy
Supplemental Material for Prediction of total extracted oil and major terpenes in leaves of Kunzea ambigua using near infrared reflectance spectroscopy by Alieta Eyles, Thomas Rodemann, Etienne de Kock, Sandra M Garland and Dugald C Close in Journal of Near Infrared Spectroscopy
Footnotes
Acknowledgements
We thank Dr David Nichols from the Central Science Laboratory, University of Tasmania, for GC-MS analysis of samples and Phil Hortin for designing and building the NIR leaf holder. We thank Caroline Claye and Lynne Foster from the Tasmanian Institute of Agriculture (UTAS) for technical assistance.
Declaration of conflicting interests
The author(s) declared no potential conflicts of interest with respect to the research, authorship, and/or publication of this article.
Funding
The author(s) disclosed receipt of the following financial support for the research, authorship, and/or publication of this article: This work was supported by the Essential Oils Tasmania and the University of Tasmania (UTAS).
Supplemental Material
Supplemental material for this article is available online.
References
Supplementary Material
Please find the following supplemental material available below.
For Open Access articles published under a Creative Commons License, all supplemental material carries the same license as the article it is associated with.
For non-Open Access articles published, all supplemental material carries a non-exclusive license, and permission requests for re-use of supplemental material or any part of supplemental material shall be sent directly to the copyright owner as specified in the copyright notice associated with the article.