
Abstract
Glucose-stimulated insulin secretion (GSIS) testing of isolated islets of Langerhans is crucial for assessing β-cell function, yet protocol variability complicates result interpretation. This study investigated insulin secretion heterogeneity across 576 donors and examined the influence of donor characteristics on secretory responses. We compared static incubation (n = 408) and dynamic perifusion (n = 168) techniques using standardized glucose stimulation protocols (3 vs 15 mM). While both methods showed comparable stimulation indices (r2 = 0.652), dynamic perifusion uniquely captured temporal secretion patterns and revealed greater dynamic range in insulin responses. Notably, dynamic perifusion, with insulin content normalization, revealed a 22-fold variation in stimulation index across donors. Body mass index (BMI) and HbA1c significantly influenced basal insulin secretion, particularly in donors with glucose intolerance and type 2 diabetes (T2D) (HbA1c ≥ 6.5%). Cluster analysis identified two distinct groups based on age, BMI/body surface area (BSA), and HbA1c, which strongly predicted insulin secretion patterns, whereas donor sex had no measurable impact. This large-scale study demonstrates the superiority of standardized perifusion over static incubation for resolving islet glucose responses. By capturing dynamic secretion profiles, perifusion reveals substantial donor heterogeneity, primarily driven by BMI and HbA1c through their effects on basal insulin secretion.

Introduction
Islet allotransplantation has emerged as an effective treatment for type 1 diabetes (T1D) patients with severe glycemic instability1–3. This cellular therapy has gained widespread recognition and reimbursement status across numerous countries, reflecting its integration as a standard therapeutic option4,5. Clinical outcomes demonstrate sustained benefits, with 28% of recipients maintaining insulin independence a decade posttransplantation in our cohort 6 . Despite significant advances in transplantation procedures, immunosuppression protocols, and overall safety profiles, the challenge of reliably assessing islet function before transplantation remains a critical barrier to optimizing clinical outcomes.
The complexity of islet biology necessitates comprehensive evaluation through multiple in vitro assays, including glucose-stimulated insulin secretion (GSIS), oxidative stress measurements, ATP/ADP ratios, oxygen consumption, mitochondrial integrity assessments, and cellular composition analysis7–9. However, the field lacks a standardized protocol or reliable predictive test that can definitively determine islet quality. Glucose-stimulated insulin secretion evaluation, the most widely adopted approach, employs either static incubation9,10 or dynamic perifusion techniques10–12. The latter method offers distinct advantages by capturing biphasic insulin release kinetics in real-time, revealing both first- and second-phase secretions from various islet preparations10,11,13–15. This temporal resolution provides crucial insights into β-cell function that static methods cannot capture.
The interpretation of insulin secretion data is complex and influenced by various factors, including donor characteristics, such as sex, age, body mass index (BMI), body surface area (BSA), and islet preparation variables like size, purity, and cold ischemia 16 . While perifusion techniques have become widely adopted for islet characterization, the variability in protocols across different centers poses significant challenges for data comparison and standardization 17 . The implementation of standardized or centralized perifusion testing across islet production centers could improve quality assurance and enhance the predictability of outcomes12,18. Currently, the limited number of in vitro experiments conducted at each center, coupled with protocol heterogeneity, makes it difficult to establish reliable reference standards for human islet insulin secretion. Recommendation by Henquin 19 for greater consistency and rigor in reporting human islet in vitro studies highlights the critical need for standardization in therapeutic evaluation.
This study addresses these challenges by examining insulin secretion variability across a large cohort of human islets using both static and dynamic GSIS testing techniques. Furthermore, we investigated the impact of donor physiological variables on insulin secretion phases during glucose stimulation via perifusion, aiming to establish more reliable predictive markers for islet function assessment.
Materials and methods
Human islet donor information
Pancreata were procured from adult, brain-deceased donors through our clinical islet transplantation program (French “Agence de la BioMedecine”: PFS16-008). The study was conducted in accordance with French Regulations and approved by the Institutional Ethical Committee of the University of Lille and the Centre Hospitalier Universitaire (CHU) in Lille, France. Next of kin provided informed consent for scientific research following consultation with the French National Registry of Organ Refusal. The study encompassed 576 human islet donors, with 408 donors allocated to static glucose-stimulated insulin secretion (GSIS) assessment and 168 to dynamic perifusion studies, and 10 donors included in both methods for direct comparison. The clinical characteristics of each donor are summarized in Table 1.
Demographic and clinical characteristics of islet donors in static and dynamic perifusion studies.
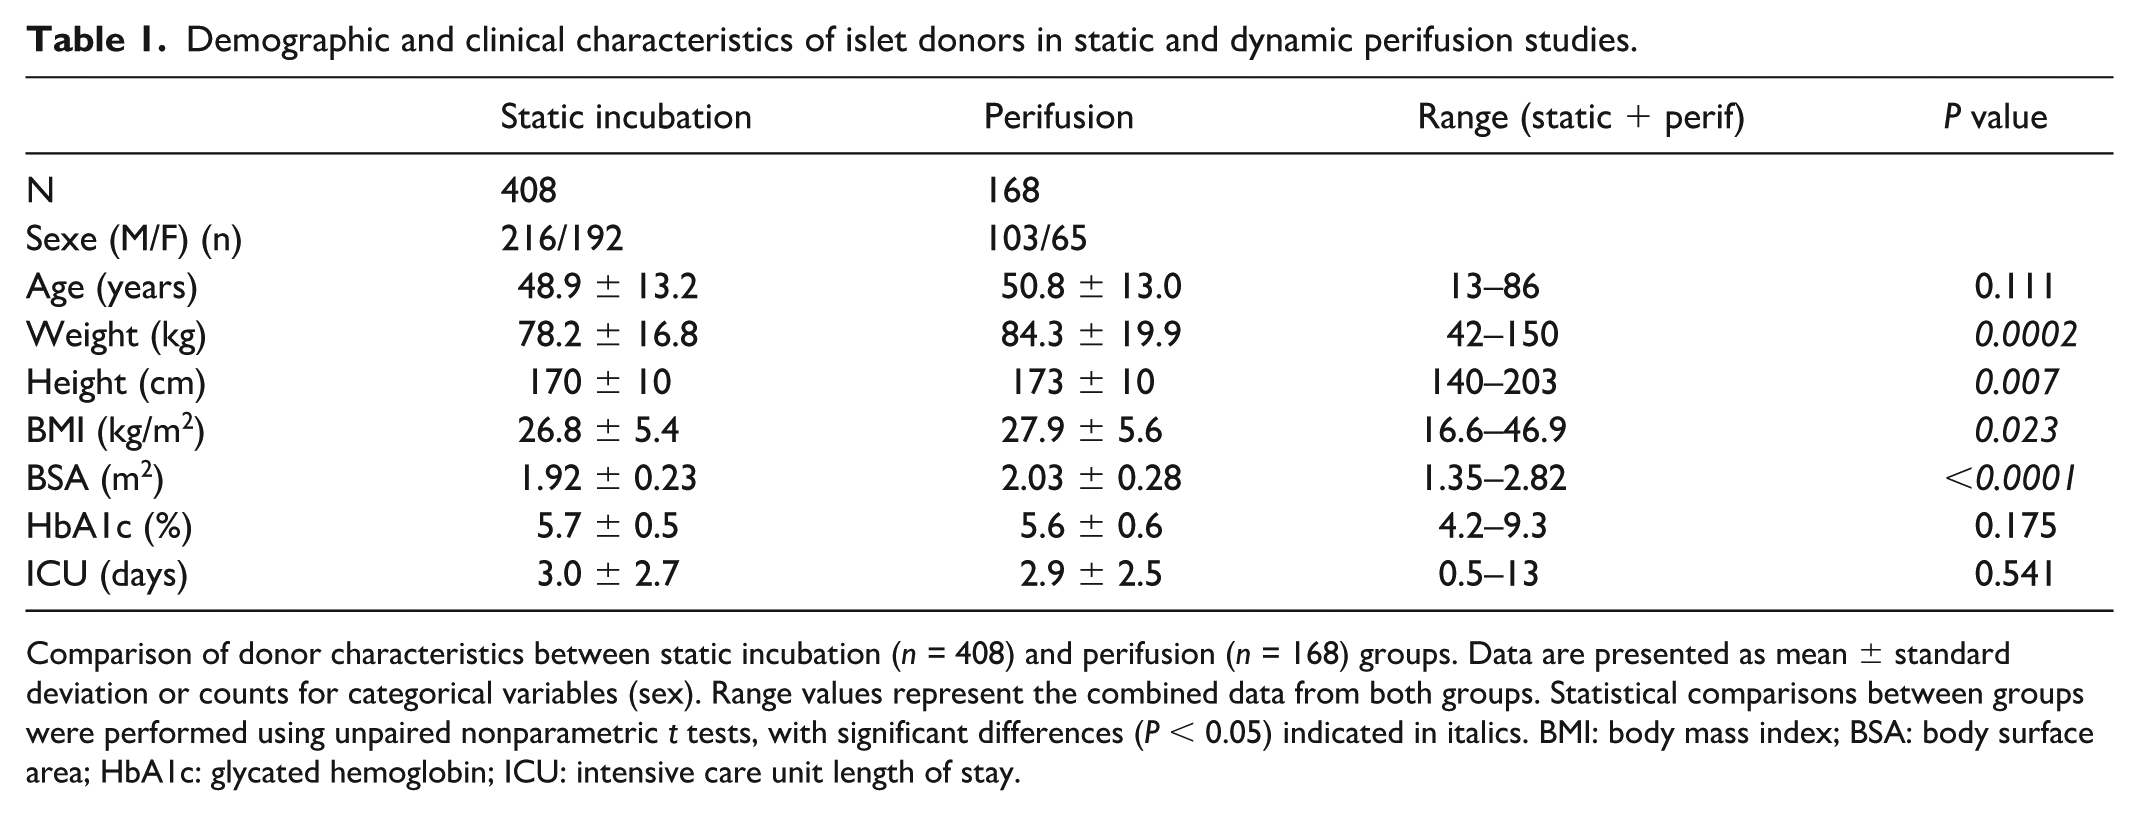
Comparison of donor characteristics between static incubation (n = 408) and perifusion (n = 168) groups. Data are presented as mean ± standard deviation or counts for categorical variables (sex). Range values represent the combined data from both groups. Statistical comparisons between groups were performed using unpaired nonparametric t tests, with significant differences (P < 0.05) indicated in italics. BMI: body mass index; BSA: body surface area; HbA1c: glycated hemoglobin; ICU: intensive care unit length of stay.
Pancreatic islets isolation, culture, and counting
Islet isolation followed the automated method of Ricordi et al. 20 with modifications 21 . Isolated human islets were maintained in custom CMRL 1066 medium (Thermo Scientific, Illkirch, France, containing 5 mM sodium pyruvate, 10 mM nicotinamide, 25 mM HEPES) supplemented with 0.625% human serum albumin, penicillin, streptomycin, and 0.18 mg/l insulin 21 . Prior to each experimentation, islets were systematically recounted to determine the number of islet equivalents (IEQ) required for static glucose stimulation or perifusion experiments 22 .
Static incubation technique
For static GSIS assessment, 40 IEQs were placed on cell culture inserts (3 µm pore size, PITP01250, Merck Millipore, Cork, Ireland). Each donor sample (n = 408) underwent sextuplicate testing, utilizing 240 IEQ in parallel, islets were equilibrated for 50 minutes in KREBS buffer (124 mM NaCl, 4.8 mM KCl, 2.5 mM CaCl2-H2O, 1.2 mM MgCl2-6H2O, 25 mM NaHCO3, pH 7.3) containing 3 mM glucose and 0.1% bovine serum albumin at 37°C. Glucose stimulation was performed by transferring inserts to KREBS buffer containing 15 mM glucose for 30 minutes. Following collection of supernatants, islets were resuspended in acid-ethanol solution (1.5% HCl, 70% EtOH, 28.5% ddH20), sonicated, diluted 1/400, and stored with supernatants at -20°C pending insulin measurement as described21,23.
Dynamic perifusion technique
Dynamic perifusion studies (n = 168) utilized 300 IEQ per reaction chamber, with continuous flow maintained at 1 ml/min and fractions collected every 2 minutes, as described 24 . The protocol employed KREBS buffer supplemented with 1 mg/ml Bovine Serum Albumin and consisted of three phases: 50-minute equilibration in 3 mM glucose without sampling, followed by sequential collection at 3 mM glucose (10 minutes, 0.54 g/l), 15 mM glucose (40 minutes, 2.72 g/l), and return to 3 mM glucose (20 minutes). Perifusion parameters, including flow rate (1 ml/min), temperature (37°C), and oxygenation (95% O2/5% CO2), were rigorously standardized across all experiments using automated, calibrated perifusion systems. Throughout the procedure, flow rate, pressure, temperature, and oxygen concentration remained constant. Each run included internal controls, and islet batches were randomly assigned across experimental days to minimize batch effects. Additionally, all experiments were conducted using identical buffer compositions and glucose ramping protocols, ensuring consistency in stimulus delivery and measurement conditions. Postexperiment, islets were processed in acid-ethanol, sonicated, serially diluted (1/2114, 1/3844, and 1/5761), and stored with outflow fractions at −20°C.
Insulin measurement and determination of insulin secretion
Insulin quantification was performed using the automatic ACCESS II Access Immunoassay System (Beckman Coulter France, Villepinte, France). Intracellular insulin was extracted via ultra-sonication of acid-ethanol resuspended islets. Results were expressed as absolute values (IU/ml/min) or as percentage of secretion normalized to intracellular insulin content. For perifusion experiments, the stimulation index (SI) was calculated from the mean of first-phase peak (S1) with or without second-phase plateau (S2) at 15 mM glucose, relative to baseline (B) secretion at 3 mM glucose. Static incubation SI was determined as the ratio of combined first and second phase secretion (S1 + S2) at 15 mM glucose to baseline (B) secretion at 3 mM glucose.
Statistical analysis
Data analysis was performed using Prism 10.4.1 (GraphPad Software, La Jolla, USA), with results expressed as means ± SD or SEM. Statistical evaluation included Pearson correlation coefficients and linear regression analysis (beta coefficients and regression equations). Group comparisons were conducted using Kruskal–Wallis tests, with significance set at P < 0.05. Body surface area calculations employed Mosteller’s 25 formula, incorporating height (cm) and weight (kg)

Results
Dynamic characterization of insulin secretion
The perifusion system enabled real-time observation of insulin secretion kinetics from isolated human islets. When stimulated with glucose, islets (300 IEQ) demonstrated a characteristic biphasic response (Fig. 1a). At baseline (3 mM glucose), islets maintained stable basal secretion (B phase). Upon exposure to 15 mM glucose, insulin secretion exhibited two distinct phases: an initial rapid and intense peak (S1), followed by a sustained but lower plateau (S2). Return to 3 mM glucose resulted in gradual descent to baseline levels over 20 minutes. This secretion pattern remained consistent whether expressed in absolute terms (μIU/ml/min, Fig. 1a) or as a percentage of total insulin content (Fig. 1b).

Dynamic glucose-stimulated insulin secretion profiles and method comparison. (a, b) Time-course analysis of insulin secretion from perifused islets (n = 168), expressed as (a) absolute values (mIU/ml/min) and (b) percentage of insulin content (%/ml/min). Phases of secretion are indicated: basal (B, 3 mM glucose), first-phase peak (S1), and second-phase plateau (S2) at 15 mM glucose. Blue line indicates glucose concentration. (c, d) Assessment of reproducibility using parallel perifusion chambers, showing insulin secretion expressed as (c) absolute values and (d) percentage of insulin content. (e) Correlation between static and dynamic stimulation indices (n = 10, r2= 0.652, P = 0.005); red dotted lines indicate 95% confidence intervals. (f) Comparison of stimulation indices and (g) intracellular insulin content per islet equivalent (IEQ) between static incubation (n = 408) and perifusion (n = 168) techniques. Data in (a, b) are presented as mean ± SEM. Statistical significance was determined by unpaired nonparametric t test: *P < 0.05; ****P < 0.0001.
System reproducibility and method comparison
To validate system reliability, parallel perifusion chambers were tested using the same islet preparations and conditions. While absolute insulin measurements (mIU/ml/min) showed approximately 1.6-fold variation between chambers (Fig. 1c), normalization to intracellular insulin content eliminated this sampling variation, yielding superimposable secretion profiles (Fig. 1d). Comparative analysis of static versus dynamic glucose stimulation was performed using matched islet preparations from 10 donors. Perifusion demonstrated greater dynamic range in Stimulation Indices (SI) (SI: 1.8–13.4) compared to static incubation (SI: 0.9–2.6) while maintaining a significant positive correlation (r2= 0.652, P = 0.005) between methods (Fig. 1e). This enhanced sensitivity of perifusion was further confirmed across the full dataset, with significantly higher SI in the perifusion group (4.28 ± 3.25, n = 168) compared to static incubation (1.88 ± 1.26, n = 408) (P < 0.0001, Fig. 1f).
Intracellular insulin content per IEQ showed comparable but statistically different values between static incubation (31.8 ± 21.9 ng) and perifusion (36.4 ± 22.8 ng) groups (P = 0.024, Fig. 1g), suggesting subtle variations in islet sampling or preparation methods between techniques.
Heterogeneity and impact of HbA1c and BMI on insulin secretion
Analysis of donor heterogeneity
Dynamic glucose stimulation of 168 islet preparations revealed substantial inter-individual variation in insulin secretion kinetics (Fig. 2a). Mean secretion rates were 0.011% ± 0.009 at low glucose (B phase) and 0.038% ± 0.034 at high glucose (S1 phase), yielding an average stimulation index of 4.25 ± 3.22. While all preparations demonstrated glucose responsiveness (SI > 1), the magnitude varied dramatically. The highest responding preparation showed a SI of 5.70 (B = 0.0412%, S1 = 0.2351%), while the lowest had a SI of 1.28 (B = 0.0021%, S1 = 0.0027%), representing remarkable inter-individual variations: 19.5-fold in basal secretion, 87-fold in stimulated secretion, and 22-fold in stimulation indices (Fig. 2b).

Analysis of insulin secretion heterogeneity and association with donor metabolic variables. (a) Individual insulin secretion profiles from n = 168 islet preparations during glucose stimulation (3 mM to 15 mM), expressed as percentage of insulin content. (b) Representative maximum (red) and minimum (black) secretion profiles illustrate the range of responses. (c) Insulin secretion kinetics stratified by donor HbA1c: normoglycemic (<5.7%, n = 91), prediabetic (5.7%–6.5%, n = 57), and diabetic (≥6.5%, n = 10). Data are presented as mean ± SEM. (d) Comparison of mean basal (3 mM glucose, left) and stimulated (15 mM glucose, right) insulin secretion across HbA1c groups. (e) Insulin secretion kinetics stratified by donor BMI: normal (<25 kg/m2, n = 56), overweight (25–30 kg/m2, n = 59), and obese (>30 kg/m2, n = 53). Data are presented as mean ± SEM. (f) Comparison of mean basal and stimulated insulin secretion across BMI groups. Statistical significance was determined by unpaired nonparametric t test: *P < 0.05; **P < 0.01.
Correlation analysis of donor variables
Multiple donor characteristics were found to significantly influence islet function, as summarized in Table 2. Basal insulin secretion correlated significantly with BMI, HbA1c, and BSA, whereas insulin secretion under high-glucose conditions was primarily associated with BMI. In contrast, the SI correlated with a broader range of factors, including age, HbA1c, intensive care unit (ICU) duration, and cold ischemia time. Given the strong correlation between BSA and BMI (r2= 0.62, P < 0.0001), the specific effects of BSA are detailed separately in Supplementary Fig. 1.
Correlation analysis of donor characteristics with insulin secretion variables in dynamic perifusion studies.

Linear regression analysis between donor physiological variables and insulin secretion kinetics (n = 168). Secretion variables were measured during basal stimulation (B, 3mM glucose), first-phase secretion peak (S1, 15mM glucose), and calculated as stimulation index (S1/B). R2 represents coefficient of determination; P-values were determined using Kruskal–Wallis multiple comparisons test. Statistical significance is indicated as: NS: not significant. BMI: body mass index; BSA: body surface area; HbA1c: glycated hemoglobin; ICU: intensive care unit length of stay.
P < 0.05; **P < 0.01.
Impact of glycemic status
Donors were stratified based on HbA1c levels following WHO criteria: normoglycemic (< 5.7%), prediabetic (5.7-6.5%), and diabetic (≥ 6.5%). Diabetic donors showed significantly elevated basal insulin secretion compared to normoglycemic donors (1.8-fold increase, P < 0.01), while prediabetic donors displayed intermediate levels (Fig. 2c, d). Despite these differences in basal secretion, all groups retained robust glucose responsiveness, showing comparable secretion kinetics during both stimulation and return to baseline phases.
Effect of BMI on insulin secretion
Donors were grouped by BMI into normal weight (<25 kg/m²), overweight (25–30 kg/m²), and obese (≥30 kg/m²). Clear differences in insulin secretion patterns emerged across groups (Fig. 2e, f). Both basal and glucose-stimulated insulin secretion increased progressively with BMI. Normal-weight donors showed significantly lower basal secretion compared to overweight (P < 0.05) and obese donors (P < 0.01). Under high-glucose conditions, obese donors demonstrated significantly higher insulin secretion compared to normal-weight donors (P < 0.01). Gender analysis revealed minimal overall impact; however, in the normal BMI group, females exhibited slightly higher glucose-stimulated secretion than males (1.3-fold, P = 0.023) (Supplementary Fig. 2).
Impact of donor physiological variables on insulin responses: clustering analysis
Identification of distinct donor clusters
A multivariate factorial mapping was conducted, incorporating key physiological variables, including age, BMI, HbA1c, and BSA, to explore underlying donor phenotypes. Despite strong correlations between some variables, such as BMI and BSA, all variables were retained to maximize analytical depth. Data were standardized through centering and reduction to ensure comparability. Clustering via the silhouette method identified two optimal donor groups (Fig. 3a), with no individuals excluded to ensure representation of clinically relevant extremes such as severe obesity and diabetes.

K-means clustering of donor characteristics in relation to insulin secretion. K-means clustering was performed using donor age, BMI, HbA1c, and BSA in relation to insulin secretion at low (3 mM) and high (15 mM) glucose. (a) Two distinct clusters emerged from the analysis. (b) Cluster-specific data with statistical comparisons of individual variables using unpaired nonparametric t tests. (c) Wilcoxon test comparing insulin secretion medians between clusters at low and high glucose levels. (d) Time-course profiles of insulin secretion (mean ± SEM) for the two clusters.
Cluster characterization
Distinct metabolic profiles emerged between the two clusters (Fig. 3b). Cluster 1 (n = 102) comprised donors with normal metabolic variables: mean BMI of 25.1 kg/m2, normal HbA1c (5.5%), and BSA of 1.9 m2. In contrast, Cluster 2 (n = 56) reflected a metabolically impaired cohort characterized by obesity (mean BMI: 33.6 kg/m2), elevated HbA1c (5.8%, prediabetic range), and higher BSA (2.3 m2). Age distribution was comparable between clusters (52.7 vs 48.3 years). Cluster robustness was confirmed through bootstrap techniques, with high Jaccard indices for both Cluster 1 (0.98) and Cluster 2 (0.99), exceeding the accepted stability threshold of 0.75.
Impact on insulin secretion dynamics
Comparison of insulin secretion profiles revealed significant functional differences between clusters. Both basal (3 mM glucose) and glucose-stimulated (15 mM glucose) insulin secretion were significantly higher in Cluster 2 (Fig. 3c; Wilcoxon test, P = 0.012 and P = 0.014, respectively). These differences were further illustrated in the full dynamic secretion curves (Fig. 3d), highlighting altered insulin kinetics in donors with metabolic dysfunction.
Gender analysis
Gender distribution analysis across clusters showed no significant impact on insulin secretion variables during perifusion (low glucose: P = 0.13; high glucose: P = 0.18). This was further confirmed by Pearson’s chi-squared analysis (P = 0.08), indicating that metabolic variables, rather than gender, were the primary drivers of clustering.
Discussion
This large-scale, single-center study provides the first comprehensive comparison of insulin secretion between static (n = 408) and dynamic perifusion (n = 168) techniques using standardized experimental variables. While both methods showed comparable stimulation index measurements (r2= 0.652), dynamic perifusion offered superior resolution in assessing secretion kinetics relative to donor physiological variables. Standardization was crucial given the intrinsic heterogeneity of pancreatic islets in size, endocrine cell distribution, and molecular expression patterns26,27. The observed variability in insulin secretion capacity, influenced by donor characteristics 28 and isolation center protocols16,17,29, highlights the necessity for consistent assessment methods. Our approach of normalizing secretion to total islet insulin content effectively mitigated islet-specific heterogeneity16,24. Notably, we observed higher intracellular insulin content (~34 ng/IEQ) compared to previous multi-center studies (13.3 ng/IEQ) 19 , emphasizing the impact of standardized protocols on measurement outcomes. The discrepancy likely reflects differences in islet isolation protocols, donor demographics (age, BMI, metabolic status), and measurement methodologies, including insulin quantification techniques and culture conditions. Variations in assay sensitivity and data normalization may further contribute to inter-study variability.
Our perifusion studies revealed substantial heterogeneity in stimulation indices (ranging from 1 to 20), consistent with previous findings13,30. The selected glucose concentrations (3 and 15 mM), while differing from other studies using 4–16 mM 13 or 5.6–16.7 mM 30 , were intentionally chosen. The use of 3 mM glucose, below physiological fasting levels, provided valuable insights into hypoglycemic responses, which may be predictive of islet graft function in T1D patients. Furthermore, we chose 15 mM glucose as it reliably elicits robust, physiologically relevant insulin responses, enabling clear resolution of secretion kinetics without inducing non-specific stress.
Analysis of donor variables traditionally associated with islet isolation yields 31 revealed novel insights into their influence on secretion kinetics. Our findings demonstrate that obesity and diabetes significantly affect both basal and stimulated insulin secretion, particularly under low glucose conditions. The enhanced insulin secretion observed under low glucose conditions in donors with obesity and prediabetes may reflect β-cell compensatory mechanisms in response to systemic insulin resistance. In these individuals, peripheral tissues exhibit reduced insulin sensitivity, prompting β-cells to increase basal insulin output to maintain euglycemia. This chronic compensatory demand may lead to an upregulation of glucose-independent insulin secretion pathways, including enhanced basal exocytosis and altered ATP-sensitive potassium channel activity. Additionally, low-grade inflammation and lipotoxicity associated with obesity may modulate islet function by sensitizing β-cells to non-glucose stimuli, such as free fatty acids, further contributing to elevated basal secretion. These adaptations, while initially protective, may precede β-cell dysfunction and are consistent with early-stage hyperinsulinemia seen in prediabetic individuals.
The combination of advanced age (>48 years), obesity (BMI > 33kg/m2), and prediabetes (HbA1c > 5.8%) was associated with higher insulin secretion kinetics. These results extend previous observations about BMI’s importance 16 and challenge earlier conclusions regarding age effects. Our in vitro findings align with clinical observations of primary insulin hypersecretion 32 and underscore the role of basal insulin secretion in glycemic regulation 33 . The absence of gender-based differences in our study aligns with existing literature 33 , suggesting that while subtle hormone-mediated differences may exist, gender does not significantly impact insulin secretion capacity.
Regarding islet quality assessment, it’s important to contextualize our findings alongside established donor scoring systems such as the North American Islet Donor Score (NAIDS)35,36 and the Kansas City Islet Score 37 . These tools, developed to predict islet isolation outcomes based on donor characteristics like age, BMI, cold ischemia time, and HbA1c, have demonstrated utility in estimating islet yield and viability 2 . However, they do not directly assess functional potency. Our work aims to complement these predictive scoring systems by offering a high-resolution functional evaluation of islet insulin secretion via dynamic perifusion. By doing so, we provide additional insight into islet quality that may further inform graft selection and improve transplantation outcomes.
In conclusion, dynamic perifusion reveals that inter-individual heterogeneity in isolated islet insulin secretion is primarily driven by donor BMI and HbA1c, especially under hypoglycemic conditions. These findings have important implications for donor selection and the optimization of islet transplantation protocols, reinforcing the value of standardized quality criteria in advancing cell therapy outcomes.
Supplemental Material
sj-docx-1-cll-10.1177_09636897251350654 – Supplemental material for Standardized dynamic glucose testing reveals donor-dependent heterogeneity in human islet function
Supplemental material, sj-docx-1-cll-10.1177_09636897251350654 for Standardized dynamic glucose testing reveals donor-dependent heterogeneity in human islet function by Priyadarshini Gnanasekar, Chiara Saponaro, Markus Mühlemann, Chimene Amayene Amassogo, Anais Coddeville, Julien Thevenet, Nathalie Delalleau, Pauline Petit, Arnaud Hanssen, Gianni Pasquetti, Valentin Lericque, Mikael Chetboun, Violeta Raverdy, Isabel Gonzalez-Mariscal, Marie-Christine Vantyghem, Caroline Bonner, François Pattou, Julie Kerr-Conte and Valery Gmyr in Cell Transplantation
Supplemental Material
sj-docx-4-cll-10.1177_09636897251350654 – Supplemental material for Standardized dynamic glucose testing reveals donor-dependent heterogeneity in human islet function
Supplemental material, sj-docx-4-cll-10.1177_09636897251350654 for Standardized dynamic glucose testing reveals donor-dependent heterogeneity in human islet function by Priyadarshini Gnanasekar, Chiara Saponaro, Markus Mühlemann, Chimene Amayene Amassogo, Anais Coddeville, Julien Thevenet, Nathalie Delalleau, Pauline Petit, Arnaud Hanssen, Gianni Pasquetti, Valentin Lericque, Mikael Chetboun, Violeta Raverdy, Isabel Gonzalez-Mariscal, Marie-Christine Vantyghem, Caroline Bonner, François Pattou, Julie Kerr-Conte and Valery Gmyr in Cell Transplantation
Supplemental Material
sj-tiff-2-cll-10.1177_09636897251350654 – Supplemental material for Standardized dynamic glucose testing reveals donor-dependent heterogeneity in human islet function
Supplemental material, sj-tiff-2-cll-10.1177_09636897251350654 for Standardized dynamic glucose testing reveals donor-dependent heterogeneity in human islet function by Priyadarshini Gnanasekar, Chiara Saponaro, Markus Mühlemann, Chimene Amayene Amassogo, Anais Coddeville, Julien Thevenet, Nathalie Delalleau, Pauline Petit, Arnaud Hanssen, Gianni Pasquetti, Valentin Lericque, Mikael Chetboun, Violeta Raverdy, Isabel Gonzalez-Mariscal, Marie-Christine Vantyghem, Caroline Bonner, François Pattou, Julie Kerr-Conte and Valery Gmyr in Cell Transplantation
Supplemental Material
sj-tiff-3-cll-10.1177_09636897251350654 – Supplemental material for Standardized dynamic glucose testing reveals donor-dependent heterogeneity in human islet function
Supplemental material, sj-tiff-3-cll-10.1177_09636897251350654 for Standardized dynamic glucose testing reveals donor-dependent heterogeneity in human islet function by Priyadarshini Gnanasekar, Chiara Saponaro, Markus Mühlemann, Chimene Amayene Amassogo, Anais Coddeville, Julien Thevenet, Nathalie Delalleau, Pauline Petit, Arnaud Hanssen, Gianni Pasquetti, Valentin Lericque, Mikael Chetboun, Violeta Raverdy, Isabel Gonzalez-Mariscal, Marie-Christine Vantyghem, Caroline Bonner, François Pattou, Julie Kerr-Conte and Valery Gmyr in Cell Transplantation
Footnotes
Acknowledgements
We gratefully acknowledge the Biotherapy department at the Centre Hospitalier Universitaire (CHU) of Lille for providing access to their islet isolation facility. We extend our thanks to Sandrine Belaich and Bruno Lukowiak for their technical expertise and invaluable assistance during the islet isolation procedures. This work greatly benefited from the collaborative environment and research infrastructure provided by the Direction de la Recherche et de l’Innovation (DRI) at CHU Lille. We also thank the FRENCH organ procurement organizations Agence de la Biomédecine and the surgical teams involved in pancreas recovery, as well as the donor families whose generosity made this research possible.
ORCID iDs
Ethical Considerations
This study is part of a research protocol approved by the French regulations on the Lille University Hospital site on the subject of “Design, development and optimization of production and evaluation tools to improve islet transplantation and evaluation of islet-parathyroid co-transplantation” # PFS16-008.
Author Contributions
P.Pa., V.G., C.S., M.M., C.B., F.P., and J.K.C. were involved in data acquisition, conceptualization, data analysis and visualization. A.C., P.Pe., J.T, N.D, A.H, V.G., M.C. and J.K.C. are involved in the pancreas procurement and islets isolation. G.P, V.L., A.C. and V.G. performed GSIS for the islet evaluation. I.G.M., M.C.V., V.G., F.P., C.B., and J.K.C. conducted data curation and formal analysis. C.A.A and V.R. participated in statistical studies (R software). V.G, P.Pa., C.S, M.M, F.P, C.B, and J.K.C. wrote the original draft and performed subsequent revisions.
All authors have read and approved the final manuscript.
Funding
The author(s) disclosed receipt of the following financial support for the research, authorship, and/or publication of this article: This research was supported by grants from the Agence de la BioMédecine (AOR “Recherche et Greffe 2023”), the Conseil Régional Hauts-de-France (CPER Tech Sante AAP2022), Fondation de la Recherche Médicale (EQU202303016330, Prix Line-Renaud et Loulou-Gasté), Association pour la Recherche sur le Diabète, and the European Genomic Institute for Diabetes (ANR-10-LABX-46). Priyadarshini Gnanasekar-Panchatcharam was supported by a doctoral fellowship from the CPER Tech Sante program.
Declaration of Conflicting Interests
The author(s) declared no potential conflicts of interest with respect to the research, authorship, and/or publication of this article.
Statement of Human and Animal Rights
This article does not contain any studies with human or animal subjects.
Statement of Informed Consent
There are no human subjects in this article and informed consent is not applicable.
Data Availability Statement
Anonymized datasets generated and analyzed during the current study are available from the corresponding author upon reasonable request, subject to institutional data sharing policies and ethical considerations. Access to raw clinical data is restricted to protect donor privacy in accordance with French regulations and institutional guidelines.
Supplemental Material
Supplemental material for this article is available online.
References
Supplementary Material
Please find the following supplemental material available below.
For Open Access articles published under a Creative Commons License, all supplemental material carries the same license as the article it is associated with.
For non-Open Access articles published, all supplemental material carries a non-exclusive license, and permission requests for re-use of supplemental material or any part of supplemental material shall be sent directly to the copyright owner as specified in the copyright notice associated with the article.