
Abstract
Mesenchymal stromal cells (MSCs) possess therapeutic properties, which can be blunted by obesity. Autophagy, a cellular recycling process, is essential for MSC function. We investigated the mechanisms by which obesity affects the properties of MSCs, with a focus on autophagy. Adipose tissue was obtained from kidney donors [body mass index (BMI) <30 kg/m2, non-obese] or individuals undergoing weight loss surgery (BMI ≥30 kg/m2, obese) for MSC harvesting (n = 11 each); samples were randomized to sequencing (seq; n = 5 each) or functional studies (n = 6 each). MSCs were sequenced to determine their epigenetic (5-hydroxymethylcytosine) and transcriptomic profiles across autophagy-related genes using hydroxymethylated DNA immunoprecipitation sequencing and mRNA-seq, respectively. Genes with shared trends in both datasets underwent Reverse Transcription Quantitative Polymerase Chain Reaction (RT-qPCR) validation. During functional studies, 2-h starvation was used to induce autophagy in vitro, enabling detection of changes in the protein expression of microtubule-associated protein 1A/1B-light chain-3 and in autophagic flux. Obesity amplified a starvation-induced reduction in autophagic flux in MSCs while promoting earlier generation of new autophagosomes during autophagy initiation. Integrated analysis of the two sequencing datasets revealed 124 differentially hydroxymethylated genes and 30 differentially expressed mRNAs. Among six overlapping autophagy-related genes, three exhibited same-direction trends. Of these, STX12 and SLC25A4 may be implicated in the impact of obesity on autophagic changes in MSCs. Therefore, human obesity may alter autophagy in adipose tissue–derived MSC, and thereby their metabolism and function.
Introduction
Autophagy constitutes the principal cellular mechanism for the degradation and retrieval of intracellular proteins and organelles across diverse physiological and pathological contexts 1 , with macroautophagy being the most commonly studied form. In the classical manifestation of macroautophagy, cytoplasmic constituents are encased within bi-layered vesicles denominated as autophagosomes. Autophagosomes emanate from the membranes of the endoplasmic reticulum, Golgi apparatus, or mitochondria in an intricate, multi-phase progression encompassing the nucleation of vesicles or phagophores followed by their extension and ultimate enclosure. After autophagosome formation, their outer membrane undergoes fusion with the lysosomal membrane, culminating in the generation of autolysosomes wherein the cargo undergoes digestion and repurposing 2 . This cellular response to stresses, including ischemia and nutrient abundance, results in elimination of redundant elements.
Mesenchymal stromal cell (MSC) transplantation confers therapeutic benefits across a spectrum of maladies, ameliorating tissue damage and facilitating functional convalescence3,4. With the advent of minimally invasive methodologies, adipose tissue has emerged as a preferential source for MSC therapy. Nonetheless, the variation in functionality of MSCs sourced from adipose tissue (AT-MSCs) among disparate donors poses a formidable impediment to clinical translation. Previous research has posited that obesity precipitates a decline in the functional attributes of AT-MSCs, epitomized by perturbed differentiation proclivities, mitochondrial dysfunction, compromised immunomodulatory capacity, attenuated angiogenesis, and augmented predisposition toward senescence, among other manifestations5–8.
A mounting body of empirical evidence intimates a conceivable nexus between autophagy and the comportment of MSCs, exerting a dualistic influence. The modulation of autophagy within MSCs may impact their operative capacity9–11, while MSCs may, in turn, orchestrate autophagic processes within immune cells and other cellular constituents instrumental to pathogenic etiologies12–14. Each of these mechanisms exerts a cumulative sway upon the therapeutic attributes of MSCs. Autophagy prominently regulates MSC metabolism, especially the early responses of undifferentiated MSCs to altered metabolic demands15–17. Unlike other cells, MSCs are in a state of autophagic stagnation, with a high accumulation of autophagosomes and readiness for rapid autophagic degradation 18 , making the initiation of autophagy unique in these cells. We have previously found a lower rate of early autophagy in kidney cells obtained from obese pigs 19 . However, the impact of donor obesity on the potency of autophagy in human AT-MSCs remains unclear.
Our study is underpinned by the hypothesis that disparities subsist in the realm of autophagy between “obese” and “lean” MSCs. We explored the differences between MSCs derived from obese and lean patients in terms of autophagy-related gene activation and expression and autophagic behavior at the beginning of autophagy. Comparing epigenetic markers, such as 5-hydroxymethylcytosine (5hmC), and mRNA-sequencing (mRNA-seq) in these cell populations has highlighted a constellation of differentially expressed genes (DEGs) associated with autophagy, heralding subsequent in-depth mechanistic studies.
Materials and Methods
The human study received approval from the Mayo Clinic Institutional Review Board.
Participant Recruitment
We obtained informed consent and recruited 22 obese and non-obese (lean) patients aged 18–80 years as MSC donors. Obesity was defined as a body mass index (BMI) ≥30 kg/m2 and non-obesity (“lean”) as BMI <30 kg/m2. We harvested primary AT-MSCs from 22 patients (11 obese individuals undergoing weight-loss surgery and 11 non-obese kidney donors) for autophagy assessment (Table 1). Due to the limited tissue availability, samples were randomized to sequencing (n = 5 each) or functional studies (n = 6 each). All patients were seen at the Mayo Clinic (Rochester, MN, USA) between February 2018 and January 2023. Exclusion criteria included pregnancy, chronic inflammatory diseases (eg, rheumatoid arthritis), active malignancies, recent stroke or myocardial infarction, solid organ transplant recipients, and immunosuppressive or anticoagulation therapy. Patient demographics were collected from medical records. The estimated glomerular filtration rate was calculated by the Chronic Kidney Disease Epidemiology Collaboration(CKD-EPI) equation. To assess insulin resistance, the triglyceride-glucose (TyG) index was calculated as Ln[triglycerides (mg/dl) × glucose (mg/dl)/2] 20 .
Patient Demographics [Mean ± SD, Median (IQR)].
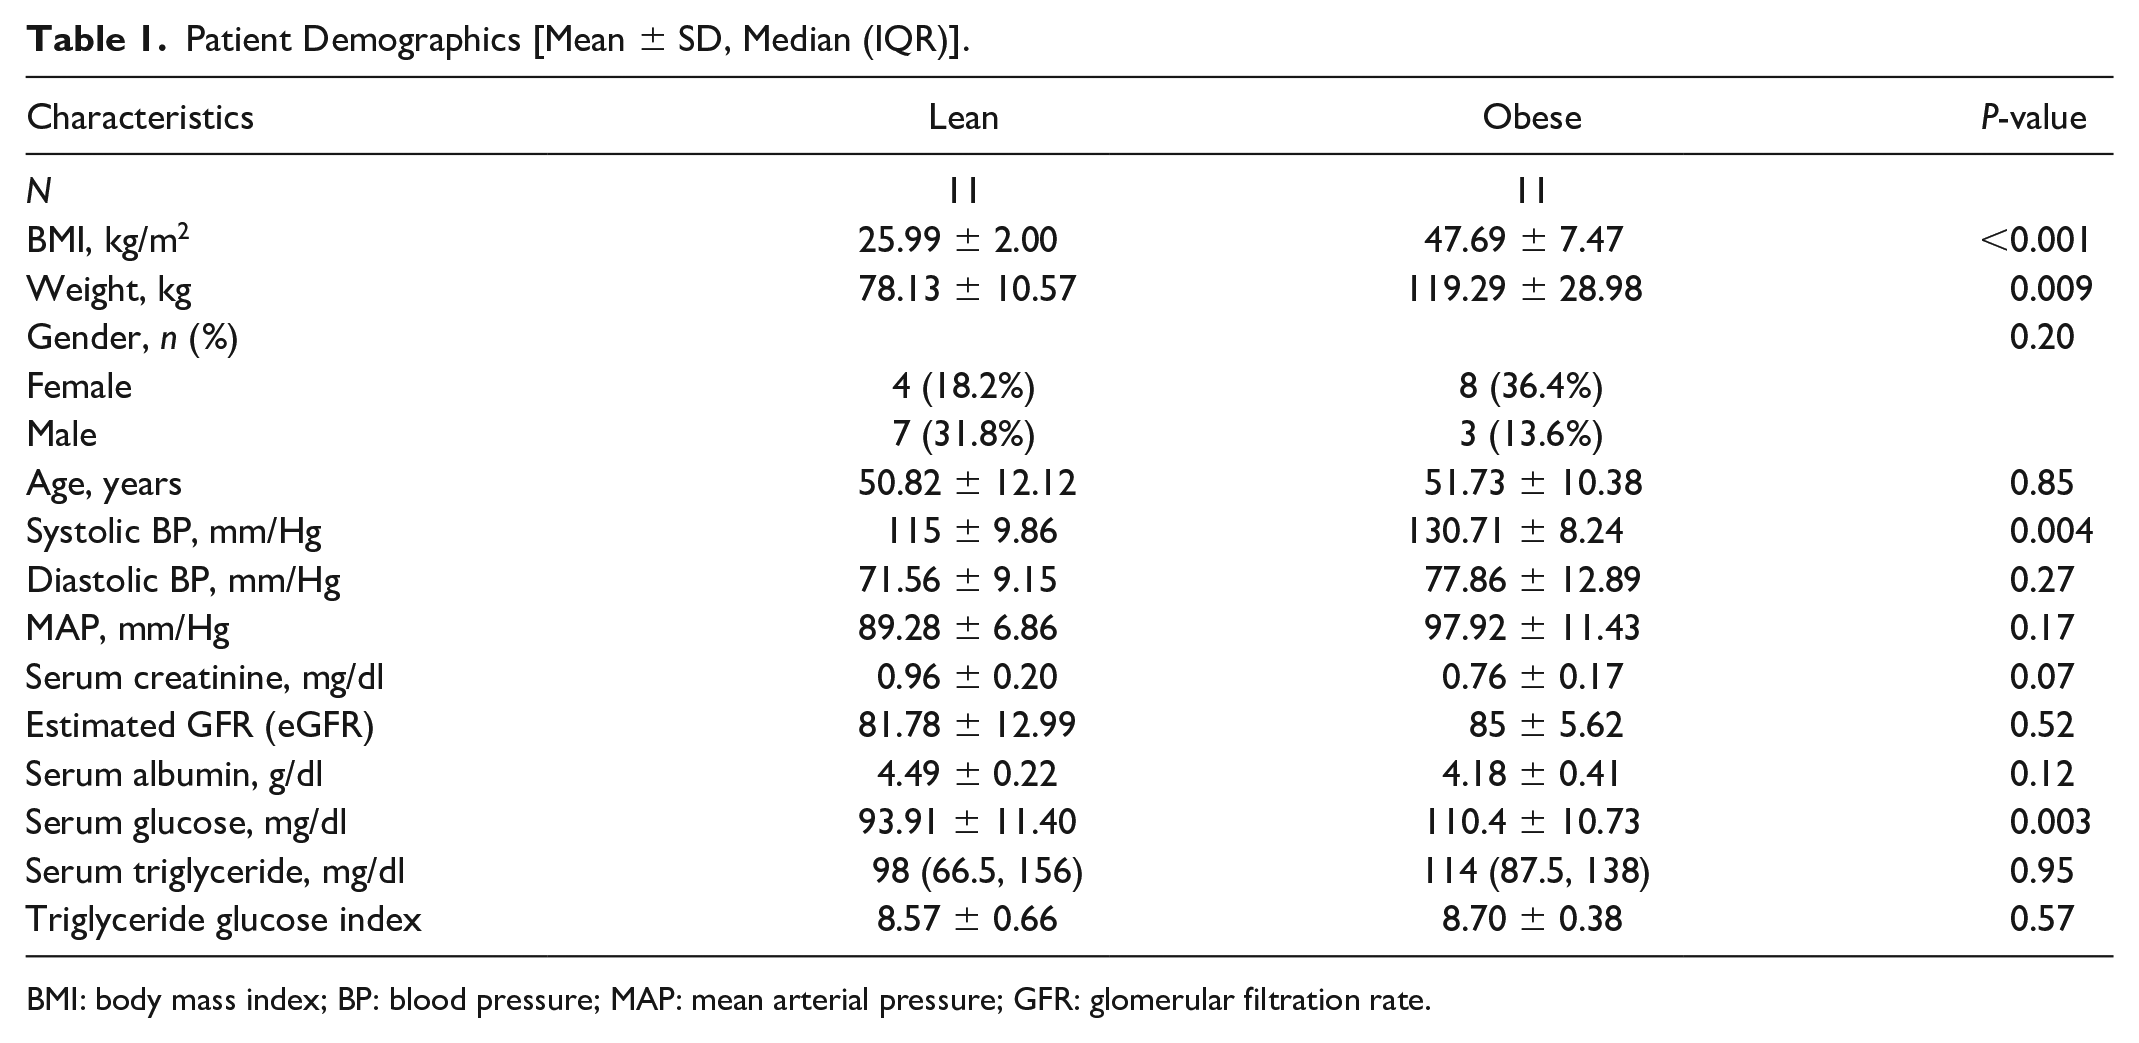
BMI: body mass index; BP: blood pressure; MAP: mean arterial pressure; GFR: glomerular filtration rate.
MSC Harvesting, Cultivation, and Characterization
Subcutaneous abdominal adipose tissue samples (0.5–2.0 g) were collected during gastric bypass surgery (patients with obesity) or donor kidney removal (non-obese patients) and prepared according to standard protocols 21 . Briefly, tissue was minced and digested with adipose tissue dissociation enzyme kit (Cat No130-105-808, Miltenyi Biotec, Bergisch Gladbach, Germany) on a gentleMACSTM Octo Dissociator (Miltenyi Biotec, Bergisch Gladbach, Germany). Serum-containing culture medium was added to the suspension, followed by filtration through a 100-μm cell filter. Cells were centrifuged, pellets resuspended in advanced Minimum Essential Medium (MEM) media supplemented with 5% platelet lysate, then incubated at 37°C. MSCs were expanded and cultured for three generations for experiments. Our previous studies7,21,22 have demonstrated that our laboratory protocol yields human AT-MSCs that align with the minimum standards set by the International Society for Cellular Therapy 23 .
Autophagy Detection
Autophagy was induced in MSCs obtained from lean and obese donors (n = 6 each) by a 2-h starvation using Hank’s balanced salt solution. Subgroups of autophagy or controls were also treated with chloroquine, a prototypical lysosome inhibitor used to test autophagy flux 24 (50 μM for 2 h). Subsequently, cells were collected for Western blotting, and both autophagy flux and LC3-II/LC3-I ratio were used to evaluate autophagy. The autophagic flux was calculated as LC3-II levels (with inhibitors) minus LC3-II levels (without inhibitors)24–26. In addition, since LC3-I converts to LC3-II during the formation of autophagosomes, the ratio of LC3-II/LC3-I is positively correlated with the number of autophagosomes and was, therefore, also used in this study for this purpose.
Western Blotting
Protein extracts from lean and obese MSCs were used for standard protein immunoblotting using specific antibodies that cross-reacted with human cells. Cell lysates were diluted, sonicated, heated, and loaded onto gels (4–15% Tris-HCl 1.0 mm) for detection of LC3 (Cell Signaling, Danvers, MA, USA, Cat No 4108S) and GAPDH (Abcam, Waltham, MA, USA, Cat No ab8245). Protein concentrations were measured using a Bicinchoninic Acid (BCA) assay. Lean and obese MSC samples were run on the same membrane, exposed together, and band intensities were read using ImageJ software (National Institutes of Health).
Quantitative Reverse-Transcription Polymerase Chain Reaction
Total RNA was isolated from human MSCs (Cat No AM1556, Life Technologies Carlsbad, CA, USA), and the SuperScript VILO cDNA synthesis kit (Cat No 11754-050) was applied to get cDNA. The probes used (all from Thermo Fisher Scientific, Waltham, MA, USA) were FLCN (Hs00376065), STX12 (Hs00295291), SLC25A4 (Hs00154037), and GAPDH (Hs02786624). To assess the effects of autophagy on MSC integrity and functionality, the expression of the senescence genes p16 (Hs00923894), p21 (Hs00355782), and p53 (Hs01034249) was measured as well. The relative mRNA expression levels were calculated using the 2−ΔΔCT method after normalization with GAPDH.
Hydroxymethylated DNA Immunoprecipitation Sequencing Analysis
For hydroxymethylated DNA immunoprecipitation sequencing (hMeDIP-seq), DNA was extracted from additional samples of lean and obese human MSCs (n = 5/group) using the DNeasy Blood and Tissue Kit (Qiagen, Hilden, Germany, Cat No 69504) with RNase treatment, as previously described27,28. The genomic DNA (100 μL) was subjected to sonication, and the size distribution of the fragmented DNA was determined using the Fragment Analyzer (Advanced Analytical Technologies, Ankeny, IA, USA) and the High-Sensitivity NGS Fragment Analysis Kit (Cat No DNF-486). Denaturation of DNA fragments with an average size of 200 bp was followed by immunoprecipitation with 1 μg of 5hmC antibody (equivalent to Millipore-Sigma, Burlington, MA, USA, Cat No MABE1093) from hybridoma clone EDL HMC 1A in 1X DNA immunoprecipitation buffer. Dynabeads Protein-G (Thermo Fisher, Waltham, MA, USA, Cat No 10003D) were added to the DNA/antibody mixture, which was incubated overnight. The captured bead-antibody-DNA complexes were thoroughly washed, enriched DNA fragments were eluted, purified, and quantified using the Qubit ssDNA High-Sensitivity Assay Kit (Thermo Fisher, Waltham, MA, USA, Cat No Q10212). DNA libraries were prepared from both input and enriched DNA using the Accel-NGS® 1S Plus DNA Library Prep Kit (Swift Biosciences, Ann Arbor, MI, USA, Cat No 10024), and subjected to paired-end sequencing of 51 bp on the Illumina HiSeq 4000 instrument.
Bioinformatic analysis of hMeDIP-seq data from human MSC samples was performed as described 28 . Briefly, paired-end sequencing FASTQ files were aligned to the reference genome (hg38) using Bowtie-2 (v2.3.3.1). Duplicate reads were removed using MarkDuplicates (PICARD v1.67), and hMeDIP-seq peaks were called using MACS2. Differential binding analysis of the hMeDIP-seq peaks was conducted using the DiffBind package (v2.14.0). The Homer peak annotation tool (v4.10) and the BioMart database were employed in a consensus approach to assign differential peaks to genomic regions.
mRNA-seq Analysis
mRNA-seq analysis was conducted on samples of obese and lean MSCs (n = 5/group) at the Mayo Clinic Genomic Analysis Core Facility and Bioinformatics Core Facility, as described 28 . Libraries were prepared using the TruSeq RNA Sample Preparation Kit v2 (Illumina, San Diego, CA, USA). mRNA-seq data were analyzed using the MAPRSeq workflow and standard tools from the Bioinformatics Core Facility. Differential expression analysis was performed (edgeR v3.20.1), with expression values normalized as counts per million mapped reads.
Integrated Analysis of MSC Gene Expression and 5hmC Profiles
To investigate the impact of DNA hydroxymethylation on the biological and cellular processes occurring in obese and lean MSCs, we analyzed mRNA-seq and 5hmC profiles using R-language (R v4.2.2). First, we compiled a reference list of autophagy-related genes (Supplemental Table 1) by integrating information from the AmiGO2 and MGI databases. For the 5hmC profiles, we applied a filtering criterion of fold-change (FC) >1.4 or FC <0.7 and P < 0.05 to identify autophagy-related differentially activated or deactivated genes, respectively. We visualized these genes using volcano plots and heatmaps and generated a pie chart of peak annotations. For mRNA-seq, we used similar methods to identify autophagy-related DEGs and then created volcano plots based on these criteria, as well as heatmaps. Finally, we used Venn diagram analysis to identify overlapping dysregulated genes between the 5hmC and mRNA-seq datasets.
Statistical Analysis
Statistical analysis was conducted using R-language and statistical packages. Levene’s test was used to assess variance homogeneity, the Shapiro–Wilk normality test for normality, and Kruskal–Wallis Test and One-way analysis of variance (ANOVA) or Welch one-way ANOVA for group differences. We considered P ≤ 0.05 as statistically significant.
Results
Patients in the obese group had higher BMI, systolic blood pressure, and serum glucose versus patients in the non-obese group (Table 1), although their TyG index was not different, arguing against development of insulin resistance.
Obese MSCs Show a Greater Starvation-Induced Decrease in Autophagic Flux
At baseline, LC3-I and LC3-II expression was similar between obese and lean MSCs (Fig. 1A, E). Treatment with the autophagy inhibitor chloroquine increased the expression of LC3-II similarly in both groups (Fig. 1A, Supplemental Fig. 1A). Two hours of starvation induced a decrease in LC3-II autophagic flux (Fig. 1B), which was significantly greater in obese compared to lean MSCs (Fig. 1C). Under the premise of autophagic stagnation, as LC3-II is only present on the autophagosome membrane 29 , we used the expression level of LC3-II normalized to GAPDH to represent the accumulation of autophagosomes. In the context of this autophagic stalling and the same initial accumulation of autophagosomes (Fig. 1E), the greater starvation-induced reduction in autophagic flux suggests that obesity prompts MSCs to degrade a larger pool of accumulated autophagosomes. Interestingly, during starvation, obese but not lean MSCs manifested a significant increase in the LC3-II/LC3-I ratio (Fig. 1D). Since the formation of autophagosomes involves a fall in LC3-I due to its conversion to LC3-II (ie, increased LC3-II/LC3-I), this may imply that obesity induces the generation of new autophagic vesicles in MSCs.

Autophagic flux in human AT-MSCs. (A) Expression levels of LC3-I and LC3-II in lean and obese MSCs (n = 6 each) with or without chloroquine and starvation. MSCs cultured in MSC media were starved using Hanks’ balanced salt solution for 2 h with or without the degradation inhibitor chloroquine (50 μM). (B) Autophagic flux (the difference between LC3-II expression measured with and without chloroquine) decreased in both lean- and obese-starved MSCs. (C) However, the degree of change in autophagic flux was significantly greater in obese compared to lean MSCs. (D) Based on the LC3-II/LC3-I ratio, autophagosomes increased only in obese MSCs. Taken together, compared to lean MSCs, obese MSCs show greater lysosomal autophagosome degradation. (E) Basal LC3-II expression normalized to GAPDH indicated no significant differences in the cumulative autophagic vesicle quantity between lean and obese MSCs.
Obesity Alters Peaks of Hydroxymethylation on Autophagy-Related Genes
We identified 124 differentially hydroxymethylated, autophagy-related genes in obese versus lean MSCs, which are presented in a volcano plot (Fig. 2A) and heatmap (Fig. 2B). Analysis of the peak locations indicated a concentration in exonic and intronic regions (Fig. 2C). Given the role of 5hmC in gene regulation, the impact of obesity on 5hmC within these regions suggests a potential mechanism for altering the expression of functional genes.

Epigenetic sequencing analysis of lean and obese human MSCs. A volcano plot (A) and a heatmap (B) of hMeDIP-seq results identified 124 differential peaks of 5hmC (74 hypo-hydroxymethylated and 50 hyper-hydroxymethylated) in autophagy-related genes between obese versus lean MSCs. A peak annotations chart (C) showed them to be primarily assigned to introns and exons.
Epigenetic Changes Partially Overlap With Differential mRNA Expression
Volcano plots (Fig. 3A) and heatmaps (Fig. 3B) represent 30 autophagy-related DEGs in obese versus lean MSCs. Comparison of the mRNA and 5hmC differential gene profiles revealed six overlapping genes (Fig. 3C). Of these, two genes—Syntaxin-12 (STX12) and Solute Carrier Family-25 Member-4 (SLC25A4)—were both upregulated and activated, whereas Folliculin (FLCN) was both downregulated and deactivated. Notably, as 5hmC facilitates active gene expression 30 , the expression patterns of these three DEGs were highly likely influenced by their directionally consistent 5hmC modifications.

mRNA-sequencing analysis of lean and obese human MSCs. A volcano plot (A) and a heatmap (B) of mRNA-seq results identified 30 significantly different autophagy-related genes (11 downregulated and 19 upregulated) between obese versus lean MSCs. (C) A Venn diagram revealed six overlapping genes with simultaneous differences at the level of 5hmC and mRNA, of which two are both activated and upregulated (STX12 and SLC25A4, red) and one both deactivated and downregulated (FLCN, blue).
Confirmation of Differential mRNA Expression in Obese MSCs
qPCR analysis of mRNA expression levels of STX12, SLC25A4, and FLCN in obese versus lean MSCs showed a significant increase in the expression of STX12 (Fig. 4B) and SLC25A4 (Fig. 4C), consistent with the sequencing data. However, in contrast to the sequencing results, PCR detected no change in FLCN expression (Fig. 4A).

mRNA expression of differentially expressed genes in MSCs from lean and obese individuals. qPCR showed that while FLCN mRNA expression was unchanged between lean and obese MSCs (A), mRNA expression of STX12 (B) and SLC25A4 (C) was significantly increased in obese MSCs.
In addition, PCR showed that obesity upregulated the expression of senescence-associated genes p21, p16, and p53 in MSCs (Supplemental Fig. 2).
Discussion
This study shows that adipose tissue–derived human MSCs exposed to obesity show a greater starvation-induced decrease in autophagic flux, in association with generation of new autophagic vesicles. The change in autophagic flux was accompanied by dysregulation of autophagy-related genes, particularly activation and upregulation of STX12 and SLC25A4, along with deactivation of FLCN. These alterations contribute to impaired autophagy, which was associated with increased MSC senescence and might disrupt MSC function in obesity. Therefore, targeting autophagy could serve as a potential therapeutic strategy to restore MSC function under obese conditions.
Autophagy is a cellular recycling mechanism that helps cells adapt to various stress conditions. However, its precise role in stem cell biology, particularly in MSCs, remains poorly understood. Evidence suggests that autophagy supports stem cells by providing energy and essential precursors, especially under conditions of increased metabolic demand, such as differentiation, reprogramming, or starvation15–17. The unique characteristics of autophagy in undifferentiated MSCs include a considerable accumulation of autophagosomes, required for cell survival and differentiation, with little autophagic turnover, remaining in a blocked state 18 . In the early stages of differentiation, these cells avoid immediate autophagic vesicle cycling, potentially enhancing the efficiency of ultimate autophagic vesicle utilization.
LC3 is a soluble protein prevalent in mammalian cells. During autophagy, autophagosomes engulf cellular components, including cytoplasmic proteins and organelles. Cytoplasmic LC3 (LC3-I) then forms an LC3-phosphatidylethanolamine conjugate (LC3-II), which is recruited to the autophagosomal membrane. Autophagosomes fuse with lysosomes to generate autolysosomes, where the contents are degraded by lysosomal hydrolases. LC3-II degradation within the autolysosome reflects autophagic activity, such as that induced by starvation. Given its pivotal role, LC3 is often monitored as a readout of autophagy and related processes 29 . In this study, we assessed changes in autophagy before and after starvation using autophagic flux, and evaluated changes in autophagosomes under these conditions through the ratio of LC3-II/LC3-I.
We observed that starvation induced autophagy in undifferentiated MSCs, resulting in decreased autophagic flux, and that obesity magnified the extent of this autophagy flux reduction. Considering the autophagic arrest that characterizes undifferentiated MSCs, it is conceivable that during the initiation phase of autophagy, only accumulated autophagosomes are degraded, while new autophagosomes have not yet been generated. After a 2-h starvation, obesity augmented the fall in autophagic flux, without affecting the initial accumulation of autophagosomes (Fig. 1E). Thus, obesity causes MSCs to degrade more accumulated autophagosomes in the beginning of autophagy. Furthermore, the LC3-II/LC3-I ratio revealed that obesity induces MSCs to generate new autophagosomes earlier, supporting the notion that obesity increases autophagosome consumption during MSC autophagy.
Autophagy plays a critical role in MSC differentiation, with accelerated autophagosome depletion inhibiting osteogenic differentiation during its early stages 18 . Similarly, obesity-induced rapid autophagosome consumption may impair the differentiation capacity of MSCs. Previous studies demonstrated that obesity induces mitochondrial dysfunction and increases oxidative stress in AT-MSCs 5 , which, in turn, enhances autophagy to hinder MSC vitality 31 . This not only explains the increased consumption of autophagic vesicles in the beginning of autophagy in obesity but also provides a novel perspective on the functional decline of MSCs induced by obesity. For example, accelerated autophagy can both induce and maintain MSC senescence 32 , which is associated with premature autophagosome depletion and functional aging. Therefore, the accelerated consumption of autophagosomes caused by obesity may represent both a driver and a manifestation of MSC senescence. Congruently, we observed that obesity upregulated the expression of senescence-associated genes in MSCs (Supplemental Fig. 2), consistent with MSC dysfunction.
Nevertheless, autophagy acts as a double-edged sword, with its effects depending on the nature, severity, and duration of the given stress 33 . Under some circumstances activating autophagy can alleviate MSC aging34,35. Caloric restriction reduces aging in AT-MSCs 36 , and can extend the lifespan and enhance the vitality of obese MSCs 37 . Possibly, enhanced starvation-induced autophagy in obese cells may also attenuate MSC senescence. The beneficial effects of caloric restriction are not necessarily limited to obese individuals 38 , although autophagic activation was not observed in non-obese MSCs in our experiments. Therefore, further research is needed to determine the impact of starvation-induced autophagy on obese MSC function.
5hmC is a robust epigenetic driver which is sensitive to metabolic disturbances and capable of regulating chromatin structural remodeling to facilitate active gene expression while potentially altering cellular functions 30 . Evaluating the effects of obesity on 5hmC in autophagy-related genes of MSCs, we identified a total of 124 differential peaks, mainly distributed in gene introns and exons. Exons encode mRNA sequences, but introns also influence gene expression and in eukaryotic cells can increase transcription levels by affecting transcription rate, nuclear export, transcript stability, and mRNA translation efficiency 39 . This distribution within genes thus makes it highly likely for these differential 5hmC modifications to influence gene expression. In our previous studies, treatment of porcine obese MSCs with the epigenetic modulator vitamin-C partially reversed obesity-induced 5hmC marks on senescence-associated genes 27 . Possibly, a similar approach may also modulate activation of autophagy-related genes, and in turn MSC function. Because the senescent state of MSCs partly relies on autophagy 32 , regulating autophagy in obese MSCs may alleviate their senescence, thereby improving their functionality.
Comparison of the mRNA expression of autophagy-related genes in obese versus non-obese MSCs revealed 30 DEGs. Cross-referencing these DEGs with the 5hmC dataset revealed six overlapping genes. Among these, three exhibited same-direction changes: STX12 and SLC25A4 were activated whereas FLCN was suppressed. This dual expression and activation regulation ascribes a prominent role for these genes in the effect of obesity on MSCs.
STX12 is a member of the SNARE family located in endosomes or autophagosomes. SNARE proteins are essential for membrane fusion events in the autophagy pathway, and STX12 has been identified to be closely associated with vesicle fusion at endosomes 40 and involved in autophagosome assembly 41 . Inhibition of STX12 promotes LC3-II accumulation, thereby suppressing autophagic flux 42 , whereas activating autophagy upregulates STX12 expression 43 . In this study, obesity upregulated mRNA expression and associated 5hmC levels of STX12 in MSCs, potentially increasing or safeguarding the rate of autophagic vesicle degradation and autophagosome formation 40 . This may suggest that obesity prompts MSCs to degrade more autophagic vesicles through enhanced autophagy.
SLC25A4, a member of the solute carrier protein gene mitochondrial carrier subfamily, encodes ANT-1, a mitochondrial inner membrane protein that transports adenosine diphosphate (ADP) from the cytoplasm to the mitochondrial matrix, and adenosine triphosphate (ATP) in the opposite direction. We previously reported this finding, and the activation and upregulation of this gene induced by obesity may alter ATP/ADP exchange across the mitochondrial inner membrane, thereby affecting autophagy in MSCs 28 .
FLCN is a poorly characterized tumor suppressor protein that interacts with GABA(A) receptor-associated protein, regulated by the autophagy kinase ULK1. FLCN deficiency may reduce autophagic flux 44 . However, in this study, sequencing indicated a reduction in FLCN mRNA and 5hmC levels in obese MSCs, but a change in its expression was not confirmed by PCR analysis, possibly due to limited sample size. Evidently, changes in FLCN expression are less consistent or central to the impact of obesity on autophagy in AT-MSCs than changes in STX12 and SLC25A4. Thus, further research is needed to clarify the impact of FLCN on autophagy in the context of obesity.
This study has limitations, including a limited sample size of primary human samples and potential influences of patient demographics. The use of third-passage MSCs avoids cell aging but risks losing some characteristics during cultivation 45 . Furthermore, due to the limited availability of primary cells, different samples were used for the analysis of functional autophagy and gene sequencing. This may have led to some inconsistent results but could also have avoided some inter-individual variability. Finally, because insulin levels were unavailable, we indirectly assessed donor insulin resistance using the TyG index 20 , which was not significantly different between the obese and non-obese donor groups.
In conclusion, this study reveals that obesity dysregulates the initial stage of autophagy in MSCs, characterized by earlier generation of new autophagic vesicles, greater reduction in autophagic flux, and increased degradation of accumulated autophagic vesicles. Conceivably, a decreased utilization efficiency of autophagosomes may be related to the impaired function of MSCs. Our sequencing analysis identified 5hmC sites in STX12 and SLC25A4 as potential regulators of autophagic behavior in MSCs. Based on the current understanding of gene function, STX12 and SLC25A4 might constitute potential targets to normalize the autophagic process affected by obesity, warranting additional research. Future studies are needed to determine the feasibility of modulating autophagy to improve additional aspects of MSC function in obesity besides cellular senescence.
Supplemental Material
sj-docx-1-cll-10.1177_09636897251323339 – Supplemental material for The Impact of Obesity on Autophagy in Human Adipose-Derived Mesenchymal Stromal Cells
Supplemental material, sj-docx-1-cll-10.1177_09636897251323339 for The Impact of Obesity on Autophagy in Human Adipose-Derived Mesenchymal Stromal Cells by Li Xing, Ronscardy Mondesir, Logan M. Glasstetter, Xiang-Yang Zhu, Bo Lu, Mina Al Saeedi, Gurparneet Kaur Sohi, Alfonso Eirin and Lilach O. Lerman in Cell Transplantation
Footnotes
Author Contributions
Li Xing: Conception, Data curation, Formal analysis, Investigation, Methodology, Resources, Software, Validation, Visualization, Writing—original draft, Writing—review & editing.
Ronscardy Mondesir: Data curation, Formal analysis, Investigation, Methodology, Software, Validation, Visualization.
Logan M. Glasstetter: Data curation, Formal analysis, Investigation, Methodology, Software, Validation, Visualization.
Xiang-Yang Zhu: Data curation, Investigation, Methodology, Software, Validation, Visualization, Writing—review & editing.
Bo Lu: Data curation, Formal analysis, Investigation, Methodology, Writing—review & editing.
Mina Al Saeedi: Data curation, Resources, Investigation, Methodology, Software, Visualization, Writing—review & editing.
Gurparneet Kaur Sohi: Data curation, Formal analysis, Investigation.
Alfonso Eirin: Conception, Data curation, Formal analysis, Funding acquisition, Investigation, Methodology, Project administration, Resources, Software, Supervision, Writing—review & editing.
Lilach O. Lerman: Conception, Funding acquisition, Investigation, Methodology, Project administration, Resources, Supervision, Writing—review & editing. All authors read and approved the final manuscript.
Ethics Approval
Title of the approved study: “Mesenchymal Stem Cell Senescence in Obesity.”
Name of the approving ethics committee: Mayo Clinic Institutional Review Board.
Ethics approval reference number: 18-005076. Date approved: August 15, 2018.
Statement of Human and Animal Rights
This article does not contain any studies with human or animal subjects.
Statement of Informed Consent
There are no human subjects in this article and informed consent is not applicable.
Data Availability Statement
The data that support the findings of this study are available from the corresponding author upon reasonable request.
Declaration of Conflicting Interests
The author(s) declared the following potential conflicts of interest with respect to the research, authorship, and/or publication of this article: Dr Lerman is an advisor to CureSpec, Cellergy, and Ribocure. The authors confirm that there are no conflicts of interest.
Funding
The author(s) disclosed receipt of the following financial support for the research, authorship, and/or publication of this article: This study was partly supported by NIH grant numbers: DK120292, DK122734, HL158691, and AG062104.
Supplemental Material
Supplemental material for this article is available online.
References
Supplementary Material
Please find the following supplemental material available below.
For Open Access articles published under a Creative Commons License, all supplemental material carries the same license as the article it is associated with.
For non-Open Access articles published, all supplemental material carries a non-exclusive license, and permission requests for re-use of supplemental material or any part of supplemental material shall be sent directly to the copyright owner as specified in the copyright notice associated with the article.