
Abstract
Circadian dysregulation involved in the pathophysiology of spinal cord injury (SCI). Modulation of circadian rhythms hold promise for the SCI treatment. Here, we aim to investigated the mechanism of olfactory ensheathing cells (OEC) in alleviating neuroinflammation via modulating clock gene expression in microglia. In this study, SCI rats were randomly divided into OEC group and vehicle group. At 1 day after the surgery, OECs were intravenously transplanted into OEC group SCI rat, while the rats in vehicle group received culture medium. After 7 days post of OEC transplantation, tissues were collected from the brain (prefrontal cortex, hypothalamus, spinal cord) for PCR, western blotting and immunohistochemistry (IHC) assay at zeitgeber time (ZT) 6, ZT 12, ZT 18, and ZT 24. The roles of OEC in modulating REV-ERBα in microglia were studied by experimental inhibition of gene expression and the co-culture experiment. In the vehicle group, IHC showed a significant increase of Iba-1 expression in the cerebral white matter and spinal cord compared with control group (P < 0.0001 for all comparisons). The expression of Iba-1 was significantly decreased (P < 0.0001 for all comparisons). In the OEC group, the expression of PER 1, PER 2, CLOCK, and REV-ERBα was in a rhythmical manner in both spinal cord and brain regions. SCI disrupted their typical rhythms. And OECs transplantation could modulate those dysregulations by upregulating REV-ERBα. In vitro study showed that OECs couldn’t reduce the activation of REV-ERBα inhibited microglia. The intravenous transplantation of OECs can mediate cerebral and spinal microglia activation through upregulation REV-ERBα after SCI.
Introduction
Spinal cord injury (SCI) is a devastating disease that affects the physical and mental condition of patients and places a heavy financial burden on national healthcare systems worldwide 1 . The pathologies of SCI could be generally defined as primary and secondary injury. And the primary injury might be traumatic events, tumors or vascular disorders which is irreversible 2 . Thus, the therapeutic approaches are mainly focused on its secondary processes especially for neuroinflammation which leads to various neurological disorders. Spinal cord injury triggers both local spinal cord and remote cerebral neuroinflammatory response 3 . There are a growing number of therapeutic paradigms aimed at modulating inflammatory responses to improve neurological recovery following SCI 4 .
Circadian clocks are biological timing mechanisms. They generate 24-h rhythms in physiology and behavior. The importance of functional circadian clocks in modulating cellular and organismal responses ranging from cancer to neurological diseases has been demonstrated in animal and human models5,6. There is also evidence showing that SCI can lead to circadian disruption, which is severe at acute times and gradually recovers over time. And neurological function recovery could be improved by circadian rhythms normalization 7 . Latest evidence suggested that the circadian protein Rev-erbα involved in regulating microglial activation and neuroinflammation 8 . And their work also emphasized that normalization of Rev-erbα could serve as a potential therapeutic strategy for treatment of neuroinflammation 9 . In light of the relationships between circadian dysregulation and pathologies of diseases, researchers have been looking for ways to develop novel treatments by targeting the circadian clock.
Cell therapies are cutting-edge and hot research topic in the field of regeneration medicine, which have been applied in animal studies and clinical trials in recent decades10–12. Among the seed cells for the treatment of SCI, olfactory ensheathing cells (OECs) have been considered as a promising candidate due to their pro-regenerative properties 13 . In our previous studies, our results demonstrated that intravenously transplanted olfactory bulb (OB) derived OECs could significantly decrease the activation of microglia in the lesion sites at 7 days post of treatment14,15. However, their underlying mechanisms in neuroinflammation modulation still need further investigation. Previous literatures have demonstrated that OB has robust rhythms for its circadian behaviors16,17. There were five cellular subtypes had been identified in OB including, including OECs, astrocytes, neurons, granule cells, and oligodendrocyte lineages18,19. As one of the major cellular compositions of OB, OECs play key roles in both the development and regeneration of the olfactory nervous system. Here, we hypothesized that the OECs might also have the biological function in regulating circadian rhythms. And the transplanted OECs might elicit their therapeutic effects on modulating the microglial activation through normalizing the circadian genes expression.
In this study, we investigated the alternation of clock genes expression in microglia after co-culture with OECs, and also examined the expression pattern of those clock genes in both lesion epicenter and prefrontal cortex and hypothalamus following SCI and after OEC treatment.
Materials and Methods
Co-Culture of OECs With BV2 Microglial Cells
The OECs used in this study were isolated from the olfactory bulbs of SD rats as we described previously in our group 14 . BV2 microglial cells were seeded in 6-well plates (1 × 10⁵ cells each). Lipopolysaccharide (LPS) (1 mg/ml, 4 h, L2630, Sigma-Aldrich, Germany) was used to activate microglia BV2 cells. Olfactory ensheathing cells were seeded (1 × 10⁵ cells each) in Transwell plate inserts as we previously described Zhang et al 14 . Then, the OECs seeded in the upper chamber were co-cultured with the activated microglia for a further 24 h.
To explore their roles in regulating microglia activation, the BV2 cells were collected at ZT 6, ZT 12, ZT 18, and ZT 24 post of co-culture for qRT-PCR analysis of circadian gene expression, including REV-ERBα, PER 1, PER 2, CLOCK and pro-inflammatory cytokines including TNF-α and IL-6. For each sample, an aliquot of cDNA equivalent to 1 µg of starting RNA was mixed with XYbiotech qPCR Master Mix (XYbiotech, Inc. Shanghai, China) and the mixture was added into a RNA Quantification PCR Array (XYbiotech, Inc. Shanghai, China) and PCR was performed according to manufacturer’s instructions. BV2 cells were also harvested for WB analysis. Briefly, 20 μg total protein was separated by 10% SDS-PAGE and transferred to PVDF membranes. Then, the membranes were incubated with the following primary antibodies: P-IKKα/β (1:1000, 2697, Cell Signaling, Massachusetts, USA), P-NF-κB-P65 (1:1000, ab76302, Abcam), IKKα/β (1:1000, ab178870, Abcam, Cambridge, UK), NF-κB-P65 (1:1000, ab32536, Abcam, Cambridge, UK), PER 1(1:1000, a8449, ABclonal, Wuhan, China), PER 2(1:1000, a3217, ABclonal, Wuhan, China), and REV-ERBα (1:1000, 2129, Cell Signaling, Massachusetts, USA) overnight at 4°C. The membranes were probed with secondary antibodies for 2 h at room temperature after several washes with TBST.
Co-Culture of SR8278 Preconditioned BV2 Microglial Cells With OECs
BV2 microglial cells were pretreated with SR8278 (20 μM, MedChem Express, USA) for 1 h. Then, OECs were co-cultured with the BV2 cells or SR8278 preconditioned BV2 cells for another 24 h. The culture supernatants were collected for ELISA analysis, including iNOS (ab285316, Abcam, Cambridge, UK), CD206 (NBP3-08152, Novus Biologicals, Littleton, CO). Then, BV2 microglia cells were fixed in 4% formaldehyde solution for immunocytofluorescense. Primary antibody with PBS, secondary antibody Alexa Fluor 488 AffiniPure Goat Anti-Mouse IgG (H+L) (1:100, 115-545-003, Jackson ImmunoResearch, West Grove, USA) were used in this study. DAPI (C1002, Beyotime, Shanghai, China) was used to counterstain nuclei. Images were acquired with an Olympus FV1000 spectral confocal microscope (Olympus Corporation, Tokyo, Japan). The fluorescence intensities were analyzed by Image J software (http://rsb.info.nih.gov/ij) as we previously described 15 .
Animals
All the experimental protocols included in this study was approved by the Animal Ethics Committee of Affiliated Hospital of Hebei University (IACUC-2021XG009). We confirm that all experiments were performed in line with the ARRIVE guidelines. All the experiments that have employed anesthesia or euthanasia methods were in accordance with American Veterinary Medical Association (AVMA) Guidelines. In this study, 135 male Sprague-Dawley (SD) rat (8 weeks, 250–300 g) were used. And all rats were individually housed after surgery under constant temperature and humidity with a 12-h light/dark cycle. Rats were fed soy-free chow. Water was provided ad libitum. A left hemisection SCI rat model was established at T10 (thoracic 10). A needle (26G) was used to establish a lateral hemisection. The needle was bent by 90 with the end in 5 mm. Initially, an angled needle punctured the spinal cord dorsoventrally at the midline while avoiding the arteriae spinalis anterior, and it was then pulled to cut the left half of the spinal cord. This operation was repeated three times to ensure completeness of the hemisection13,20. In the control group, the rats only received laminectomy taking care not to damage the spinal cord. All surgeries performed between ZT 2 and ZT 11. OECs were prepared in 1 ml cell culture medium per 1&x42;106 cells. The experiments of cell transplantation were carried out at 1 day post-SCI via a tail vein. In the OEC+SCI group, the SCI rat model revived 1 ml of OECs suspension. In the control group and SCI group, the rats received 1 ml culture medium.
Tissue Processing and Histological Examination
To assess microglial activation at the lesion site and also in the brain, tissues were harvested for immunohistochemistry at 7 days after OEC transplantation. The rats were perfused transcardially with 0.9% saline followed by 4% paraformaldehyde after an intraperitoneal overdose of pentobarbital. The spinal cord and brain tissues including prefrontal cortex, hypothalamus, hippocampus were suspended in paraformaldehyde overnight. They were cryoprotected in 30% sucrose and cryosectioned at 5 µm. Immunohistochemistry was performed by incubation with 10% normal donkey serum for 1 h followed by primary antibody (Iba1, 1:100, ab178846, Abcam, Cambridge, MA) overnight. Then, secondary antibody Alexa Fluor 594 (1:100, ab150064, Abcam, Cambridge, MA). The images were captured using an Olympus IX81 microscope and analyzed using Fiji, as we have described in the previous section 15 .
Circadian Gene Expression in the Spinal Cord and Brain After Injury
Spinal cord and brain tissues (prefrontal cortex, hypothalamus, hippocampus) were collected at 7 days after OEC transplantation at ZT 6, ZT 12, ZT 18, and ZT 24 for the PCR study (n = 10/time point, n = 5 for PCR study, n = 5 for WB study). RNA was extracted from spinal cord and brain tissue using TRIZOL reagent. 2 μg of RNA was reverse transcribed into cDNA using Superscript II (Life Technologies). The cDNA was amplified by PCR with the QuantiTect SYBR Green RT-PCR Kit (204243, Qiagen, Valencia, CA) with a MyiQ PCR detector. Gene expression was measured as a ratio to β-actin.
For the western blotting (WB) analysis, total tissue protein was extracted with RIPA lysate containing PMSF and 1% protease inhibitor after harvesting. Protein concentration of tissue extract was determined by bicinchoninic acid (BCA) method and stored at −70°C. Then, the proteins were separated by using 8% SDS-PAGE gel electrophoresis and transferred onto nitrocellulose membranes. Membranes were incubated overnight at 4°C with the following primary antibodies after blocking for 1 h in Tris-buffered saline and Tween-20 (TBST, pH 7.6) containing 5% FBS. The primary antibodies used in this study are as follow PER 1 (1:1000, a8449, ABclonal, Wuhan, China), PER 2 (1:1000, a3217, ABclonal, Wuhan, China), and REV-ERBα (1:1000, 2129, Cell Signaling, Massachusetts, USA) and GAPDH (1:10000, EPR16884, Abcam, Cambridge, MA). The membranes were probed with secondary antibodies for another 2 h at room temperature after several washes with TBST.
Statistics Analysis
All data are presented as mean ± standard deviation (SD) and were analyzed by repeated measures ANOVA followed by Dunnett’s post-hoc test. The normal distribution of all data in this study was evaluated using the Shapiro-Wilk method. The sample size was determined by using the freely downloadable software G Power (http://www.psycho.uni-duesseldorf.de/aap/projects/gpower) for sample size calculation. In the present study all the statistical analyses were performed with GraphPad Prism 7.0 (GraphPad Software, La Jolla, CA, USA). Differences were considered significant when P-values were < .05.
Results
Circadian Gene Expression in Microglia Before and After OEC Treatment
In vitro study, we investigated the rhythmical expression manner before and after OEC treatment in LPS treated microglia. Compared with the LPS treated microglia, the expression of REV-ERBα was increased after OEC treatment at ZT 6, but without significant difference. At ZT 12, the expression of REV-ERBα in LPS treated microglia was significantly decreased compared with the normal microglia (P = 0.0371) (Fig. 1A). For the expression of PER 1, the significant difference presented at ZT 12. LPS treated microglia, its expression was significantly higher than that in the normal and OEC treated group (P = 0.0018 and P = 0.0109, respectively) (Fig. 1B). As for PER 2, the significant difference among groups presented at ZT 18. In LPS treated microglia, its expression was significantly higher than that in the normal and OEC treated group (P = 0.0048 and P = 0.0005, respectively) (Fig. 1C). And the significant difference of CLOCK expression among groups presented at ZT 18. In LPS treated microglia, its expression was significantly higher than that in the normal and OEC treated microglia group (P = 0.0048 and P = 0.0005, respectively) (Fig. 1D).
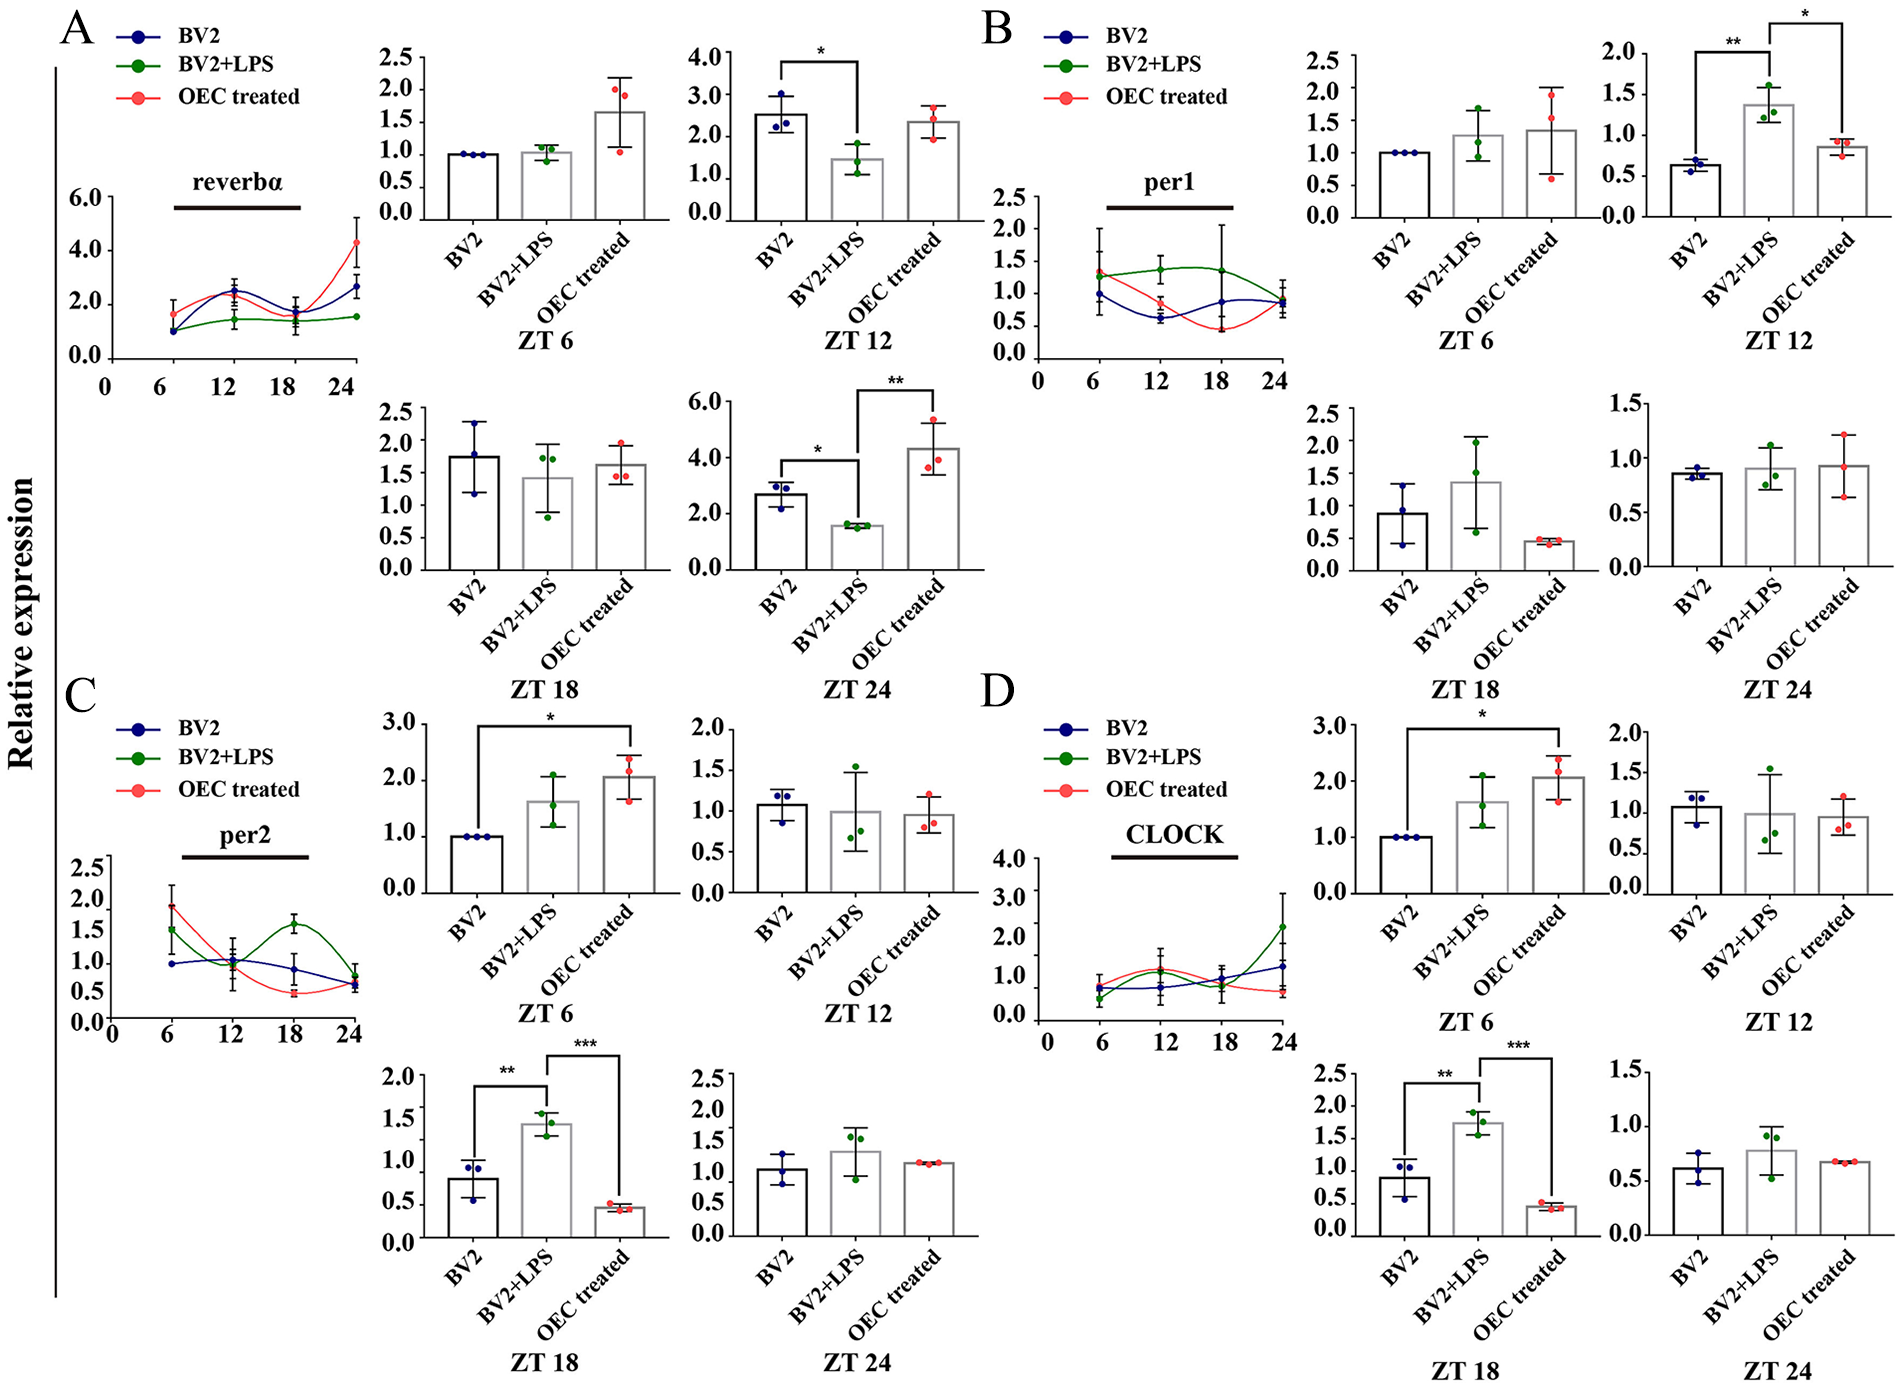
A. The rhythmic expression of rev-erbα in control BV2 microglia, LPS treated BV2 microglia, and after co-culture with OEC. B. The rhythmic expression of per 1 in control BV2 microglia, LPS treated BV2 microglia, and after co-culture with OEC. C. The rhythmic expression of per-2 in control BV2 microglia, LPS treated BV2 microglia, and after co-culture with OEC. D. The rhythmic expression of CLOCK in control BV2 microglia, LPS treated BV2 microglia, and after co-culture with OEC. *P < 0.05; **P < 0.01; *P < 0.05; ***P < 0.001; n = 5. Data are presented as mean ± SD.
The Expression of Pro-Inflammatory Cytokine TNF-α and IL-1β in Microglia Before and After OEC Treatment
In addition, we also investigated the rhythmical changes of key microglia-produced pro-inflammatory cytokines including tumor necrosis factor-α (TNF-α) and IL-1β. In the normal microglia, the expression of IL-1β peaked at ZT 12. And in the LPS treated microglia, the expression of IL-1β showed a peak at ZT 6, and was lowest at ZT 12. In the OEC treated group, the expression of IL-1β also showed a peak at ZT 12 (Fig. 2A). Compared with normal and OEC treated microglia group, the significant difference in the expression of IL-1β presented at ZT 24 (P = .0154 and P = .0013, respectively). The expression of TNF-α showed a peak at ZT12. In the LPS treated group, the expression of TNF-α appeared to be biphasic, with peak at ZT 12 and ZT 18. After the treatment of OEC, both the TNF-α showed the lowest expression at ZT24. Compared with LPS treated group, the significant difference in the expression of TNF-α presented at ZT6 and ZT24 (P = .0011 and P = 0.0029, respectively) (Fig. 2B).
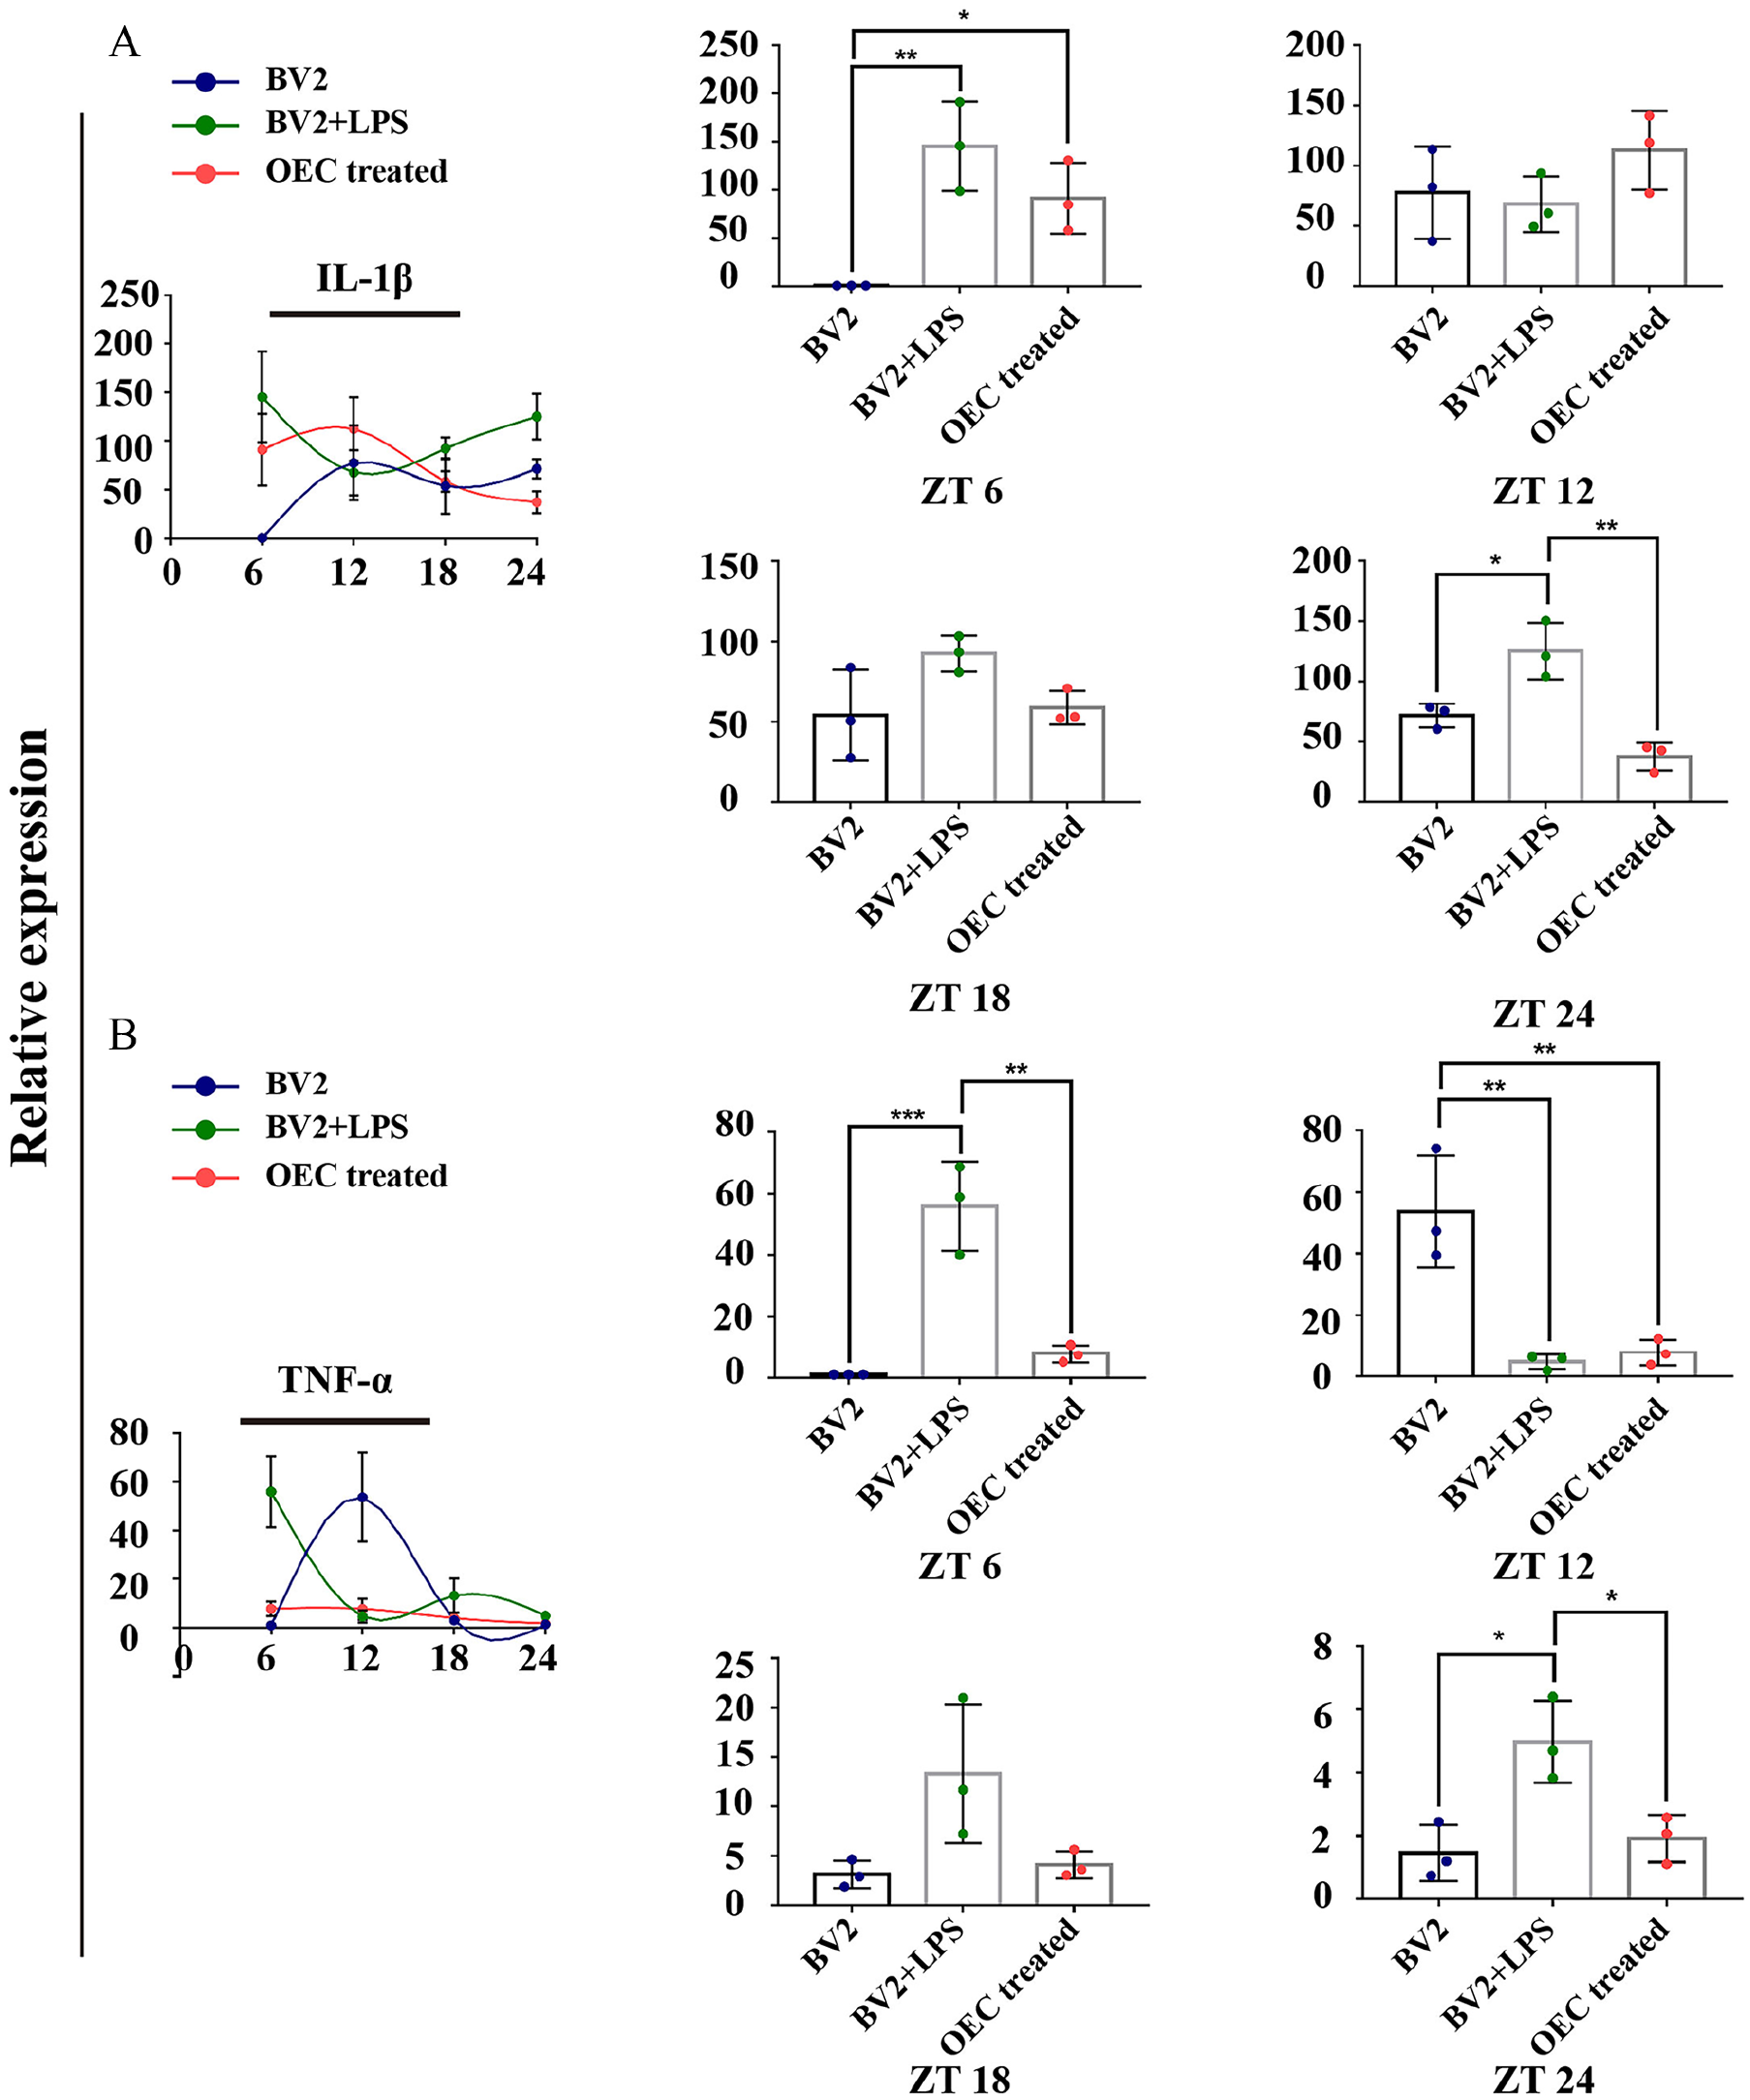
A. The rhythmic expression of IL-1β in control BV2 microglia, LPS treated BV2 microglia, and after co-culture with OEC. B. The rhythmic expression of TNF-α in control BV2 microglia, LPS treated BV2 microglia, and after co-culture with OEC. *P < 0.05; **P < 0.01; *P < 0.05; ***P < 0.001; n = 5. Data are presented as mean ± SD.
OECs Inhibit the Activation of Microglia via Upregulating REV-ERBα
The results of immunocytochemistry showed that the microglia cells were significantly activated by the LPS stimulation. The measured fluorescent intensity of Iba-1 staining was significantly increased in BV2+LPS group compared with the BV2 group (P < 0.0001) (Fig. 3A). After the treatment of OECs, the fluorescent intensity of BV2 cells was significantly reduced compared with the BV2+LPS group (P < 0.0001). However, the fluorescent intensity of Iba-1 was still significantly higher in the SR8278 group when compared with the OEC treated group (P < 0.0001) (Fig. 3B).
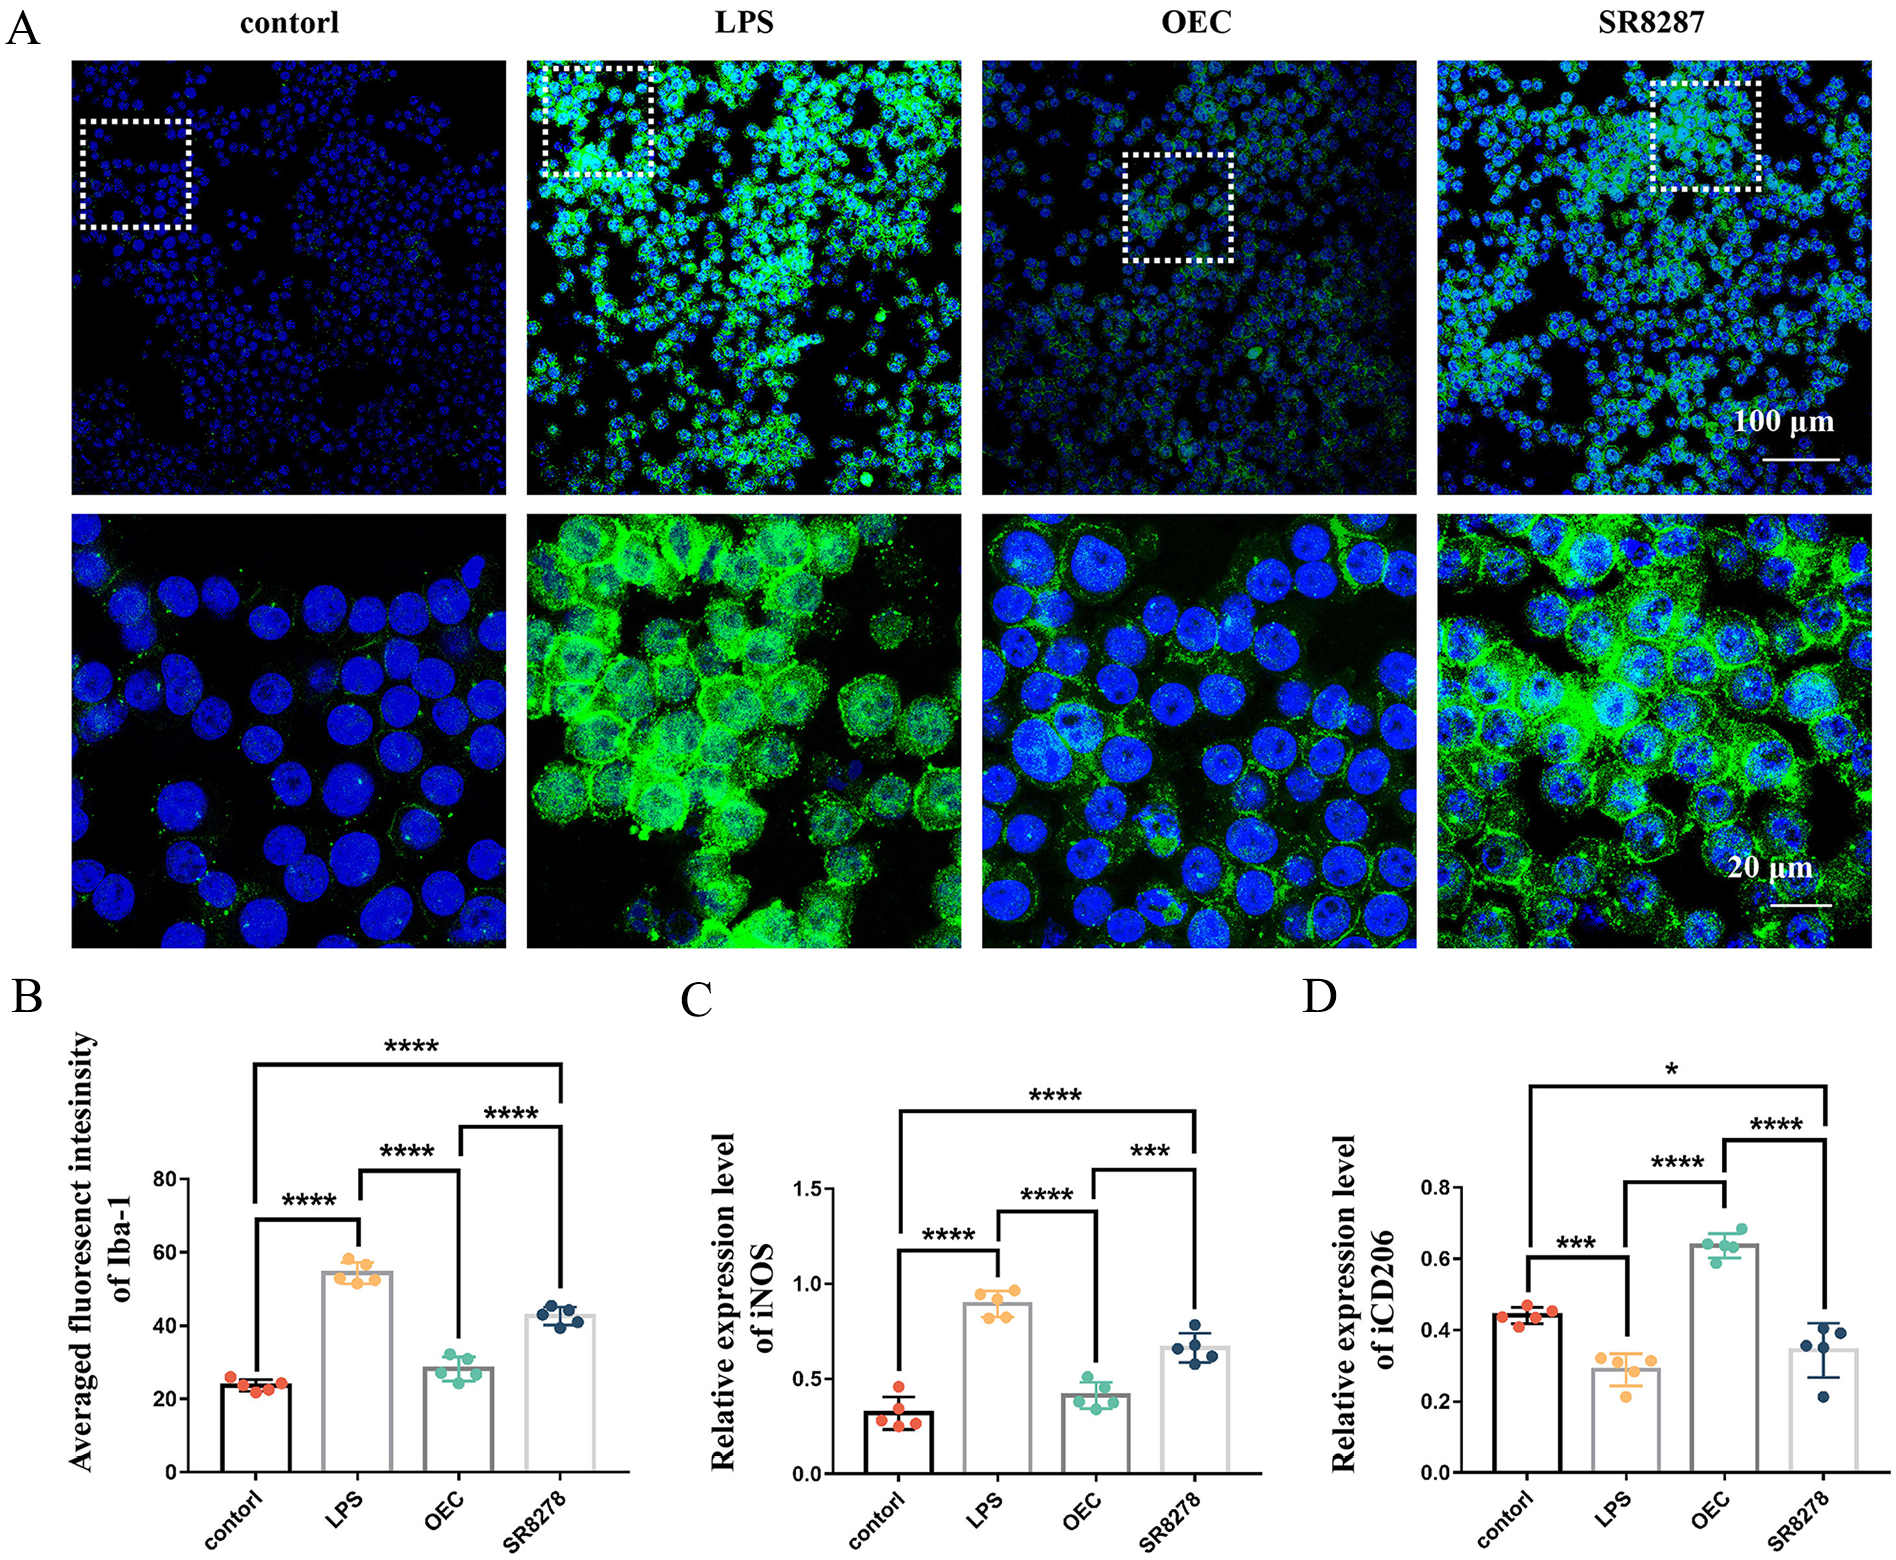
OECs inhibited microglia activation via REV-ERBα. (A) Immunofluorescent staining of microglia marker Iba-1 (green) and DPAI (blue). (B) Quantification of the fluorescence intensity of Iba-1. (C, D) Expression of cytokines iNOS, CD206 in the supernatant of BV2 cells after 24 h co-culture with normal or SR287 preconditioned BV2 cells. ***P < 0.001; ****P < 0.0001; n = 5.
The expression of pro-inflammatory cytokines and anti-inflammatory cytokines in the supernatants of microglia was also measured. Our results showed that iNOS was significantly upregulated after LPS stimulation (P < 0.0001). After OECs treatment, the expression of iNOS was significantly decreased (P < 0.0001 for both). However, the expression of iNOS in SR7278 group was still significantly higher than that in the control group (P < 0.0001) (Fig. 3C). Moreover, the expression of CD206 in microglia was significantly decreased after LPS treatment (P < 0.0001). The CD206 expression in microglia was upregulated following OECs treatment (P < 0.0001). Although, the expression of CD206 in SR8278 pretreated microglia was upregulated following OECs treatment. The expression level of CD206 in SR8278 pretreated microglia was still significant lower than that in OEC treated group. And the expression of CD206 in SR7278 group was significantly lower than that in the control group (P = 0.0297). (Fig. 3D). These results indicated that preinhibition of REV-ERBα in microglia by SR7278 could reduce the anti-inflammatory potency of OECs.
REV-ERBα Regulates Microglial Activation via NF-κB Pathway
We further elucidated the potential mechanisms by which REV-ERBα regulates microglial activation through SR8278 inhibition experiment. The results showed that p-NF-κB p65, NF-κB, Iba-1, and IL-1β were increased in the LPS group compared with the control group (all P < 0.05) (Fig. 4A). In addition, the activation of microglia was more pronounced after SR8278 pretreatment, while the inflammatory cytokines including IL-1β and iNOS increased (P < 0.0001, P = 0.0228, respectively) (Fig. 4B). These results suggested that higher expression level of REV-ERBα may alleviate LPS induced microglial activation and promote the transformation of microglia from M1 to M2 type through the NF-κB pathway (Fig. 5).
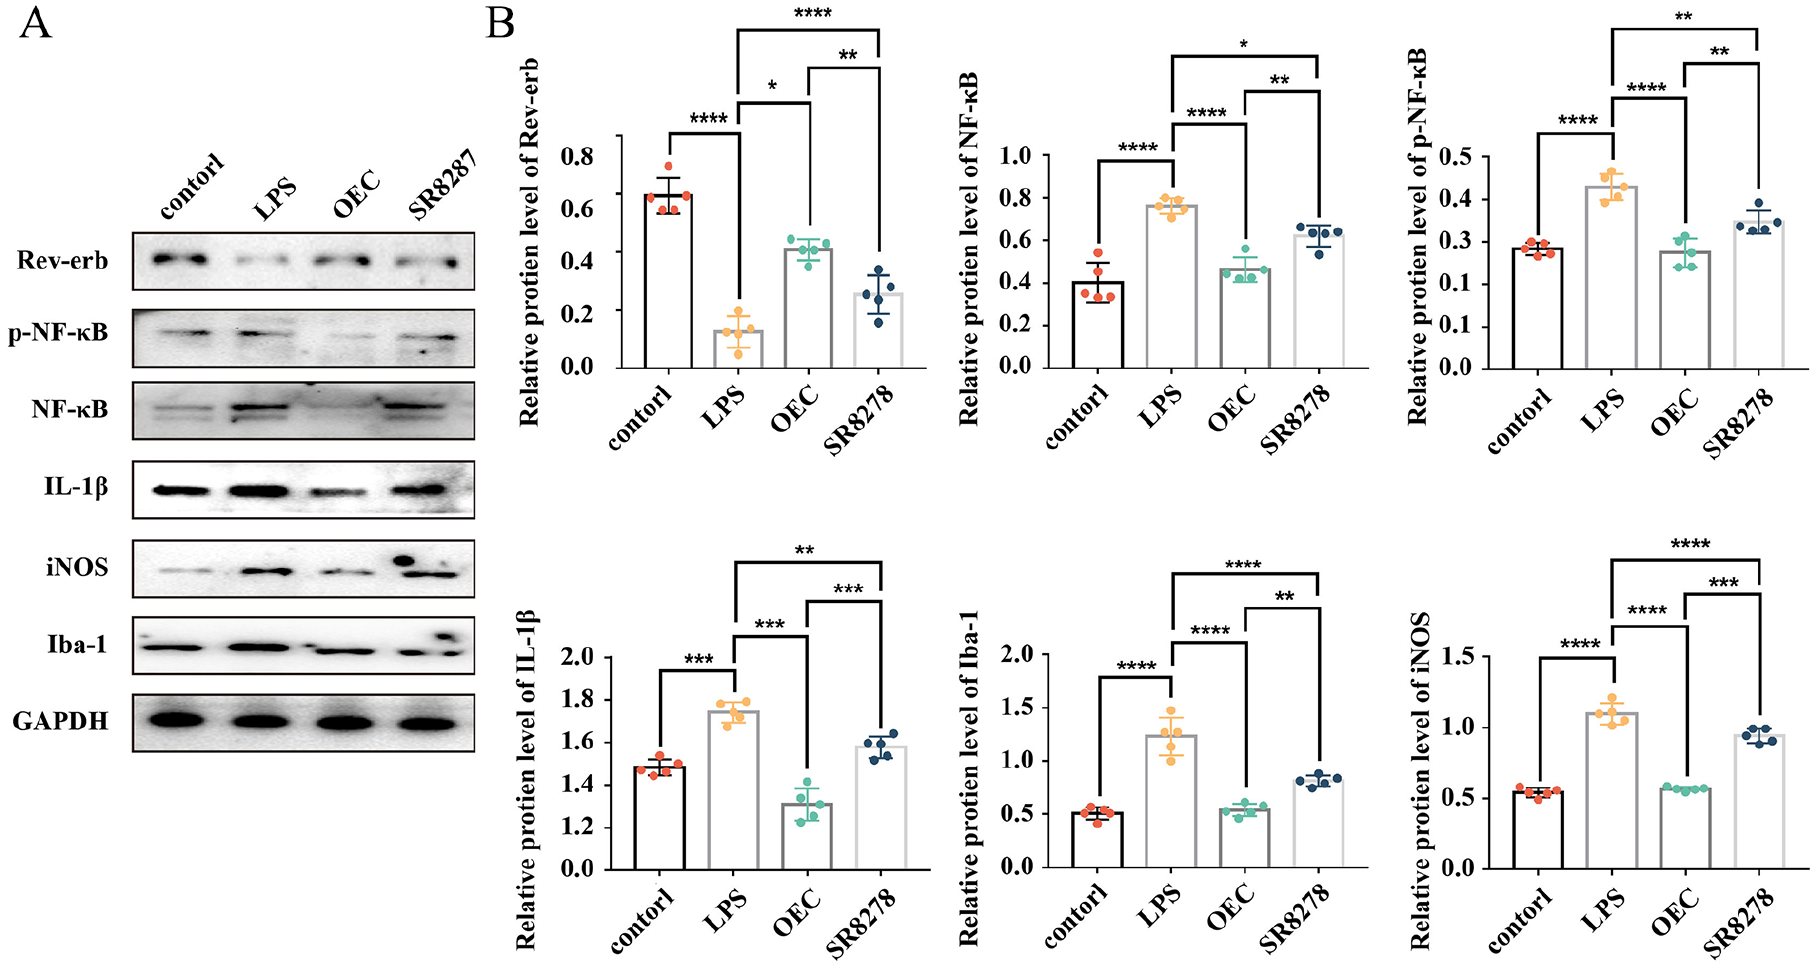
Rev-erbα regulates microglial activation via NF-κB pathway. (A) Representative blots for each protein. The band intensities were assessed by scanning densitometry. (B) The relative protein expression (optical density ratio to GAPDH) of the representative proteins REV-ERBα, p-NF-κB, NF-κB, IL-1β, iNOS, and Iba-1. Data are expressed as the mean ± SD (n = 5). *P < 0.05; **P < 0.01; ***P < 0.001; ****P < 0.0001.
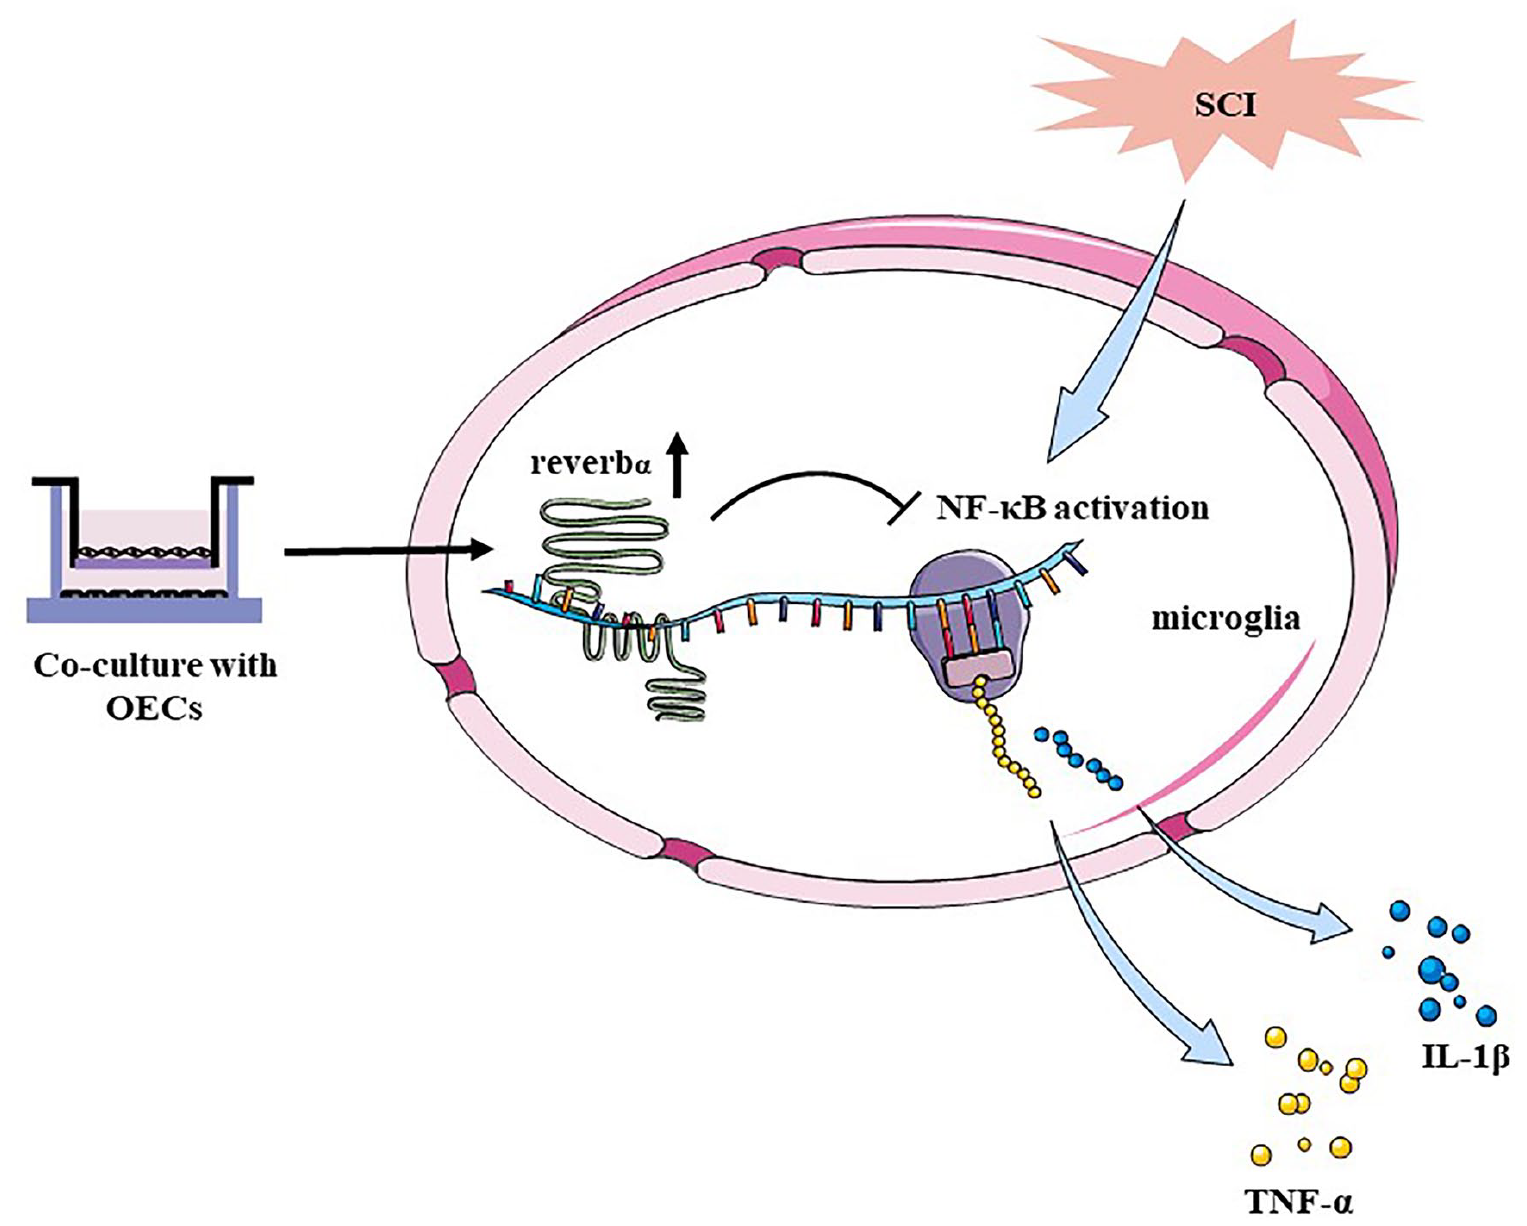
Mechanism of olfactory ensheathing cells in modulating microglia activation. The activated microglia could release inflammatory cytokines including TNF-α and IL-1β through NF-κB pathway. Olfactory ensheathing cells upregulated the expression of REV-ERBα in microglia, which could block NF-κB pathway.
OECs Alleviate Microglia Activation in Both Spinal Cord and the Brain
Immunohistochemistry (IHC) assay for activated microglia was performed with Iba-1 to explore the therapeutic effects of OECs on regulating microglia activation in both spinal cord and cerebral regions (Fig. 6A). In the SCI group, the IHC results showed a significantly increased expression of Iba-1 in and around the injury site of the spinal cord and prefrontal cerebral white matter compared with control group (P < 0.0001 for all) (Fig. 5B). In the OEC group, the Iba-1 expression in both spinal cord and prefrontal cerebral regions were significantly decreased (P < 0.0001 for all) (Fig. 6C).
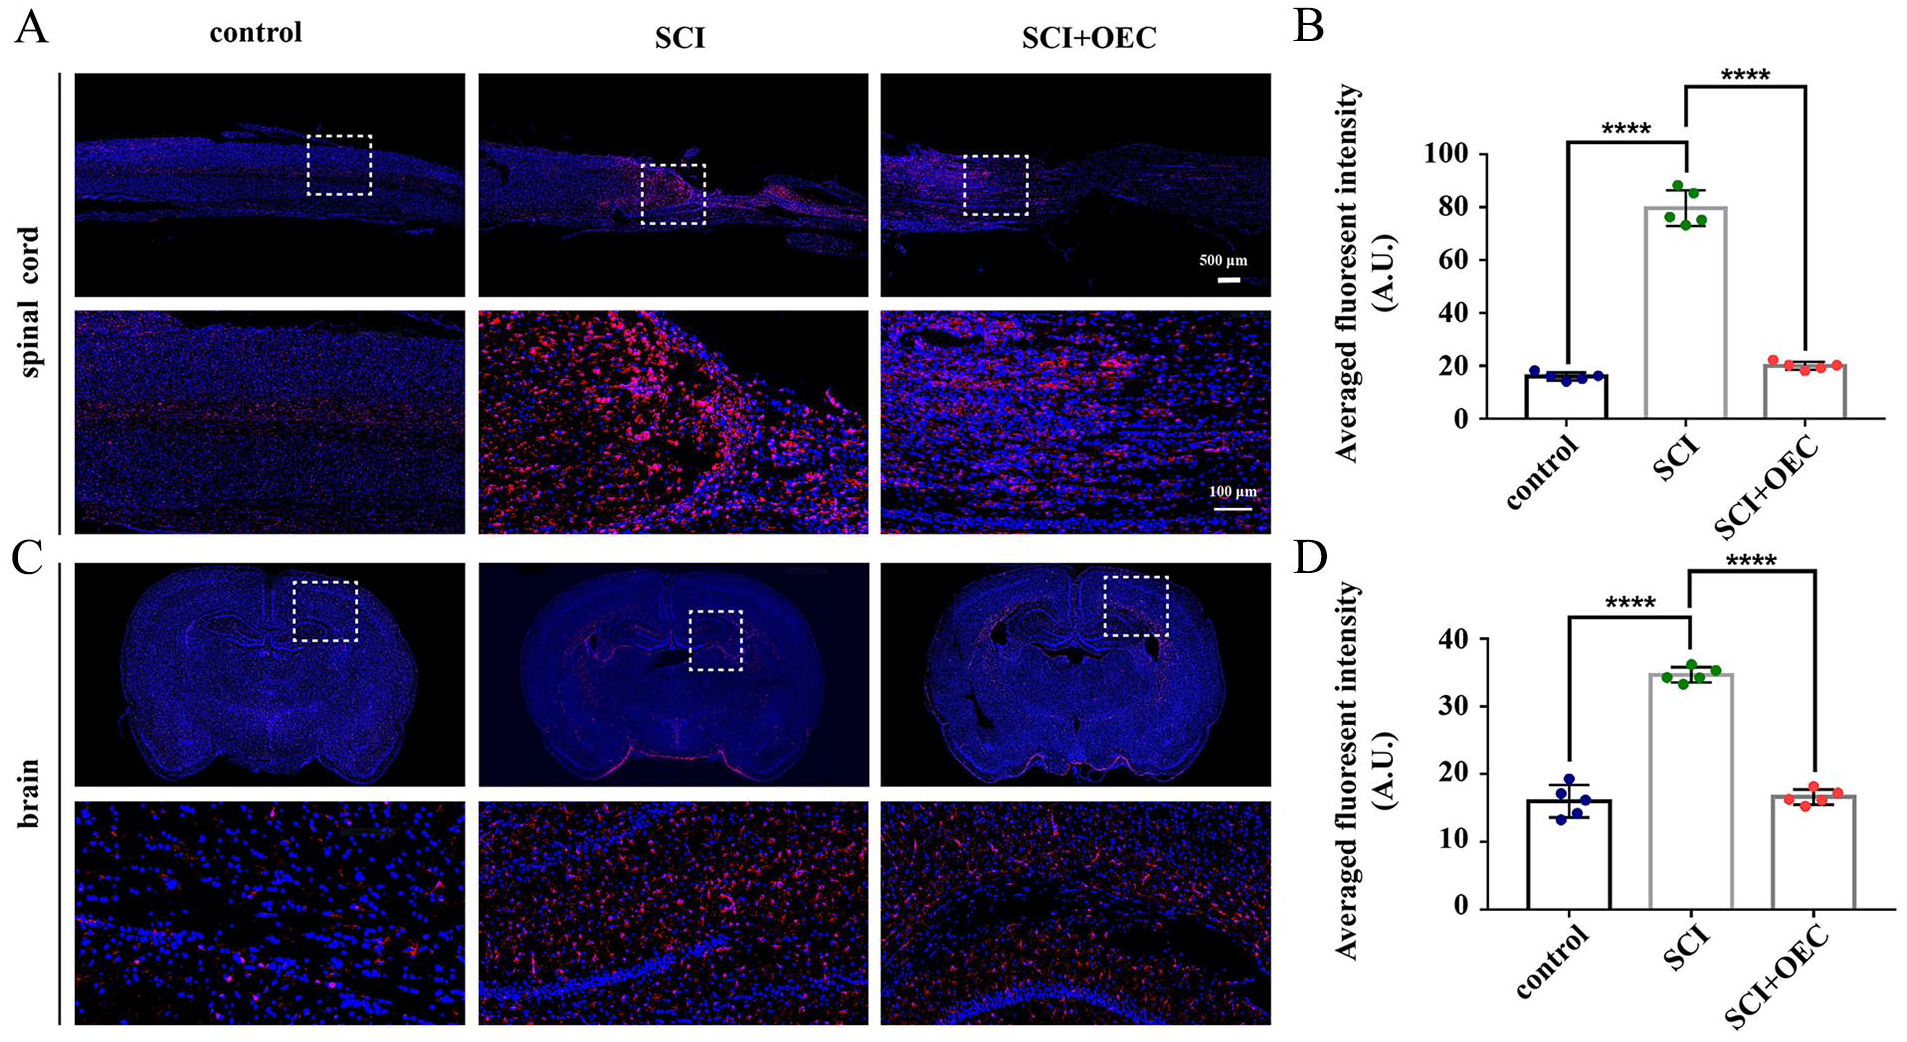
A. Immunofluorescent staining of microglia marker Iba-1 (red) and nucleus (blue) in the injured spinal cord. B. Quantification of Iba-1 expression (integrated optical density, IOD) in the injured spinal cord. C. Immunofluorescent staining of microglia marker Iba-1 (red) and nucleus (blue) in the brain regions. D. Quantification of Iba-1 expression (integrated optical density, IOD) in the brain regions. *P < 0.05; **P < 0.01; ***P < 0.001; ****P < 0.0001; n = 5.
OECs Transplantation Regulated Circadian Gene Expression in Brain Regions
The mRNA levels of REV-ERBα, PER1, PER2, and CLOCK was in a rhythmical manner in hypothalamus. SCI disrupted their typical rhythms. And OECs transplantation could modulate those dysregulations. In hypothalamus, the mRNA level of REV-ERBα in control group gradually decreased with the lowest expression level reached at ZT 24. SCI significantly decreased its expression at ZT 6 when compared with the control group (P < 0.0001). And its expression level was significantly increased at ZT 18 and ZT 24 compared with the control group (P = 0.0112 and P < 0.0001, respectively). In the OEC treated group, the expression of REV-ERBα was gradually increased. And the significant difference reached at ZT 6 and ZT 12 compared with the SCI group (P = 0.0024 and P < 0.0001, respectively) (Fig. 7A). For PER 1, its expression was significantly decreased in the SCI group when compared with the control group at ZT6 (P = 0.0077). Then, the mRNA levels of PER 1 were gradually elevated with the highest expression reached at ZT 24. In the SCI+OEC group, the mRNA levels of PER 1 was significantly increased at ZT 6 and ZT 12 (P = 0.0013 and P = 0.007, respectively), and significantly decreased at ZT 18 and ZT 24 (P = 0.0044 and P = 0.0022, respectively) compared with the SCI group (Fig. 7B). The mRNA level of PER 2 was significantly increased at ZT 12, ZT 18, and ZT 24 compared with the control group (P = 0.0426, P < 0.0001 and P = 0.0004, respectively). The mRNA level of PER 2 in the SCI group was significantly higher than that in OEC group at ZT6, ZT12 (P = 0.0002 and P = 0.0107, respectively), and then decreased at ZT18, ZT24 (P < 0.0001 and P = 0.028, respectively). And the significant different expression between SCI and OEC treated group presented at ZT18 (P = 0.0489) (Fig. 7C). For CLOCK, SCI significantly decreased its expression at ZT 6 (P = 0.0053). And the significant different expression between SCI and OEC treated group presented at ZT24 (P = 0.0142) (Fig. 7D).
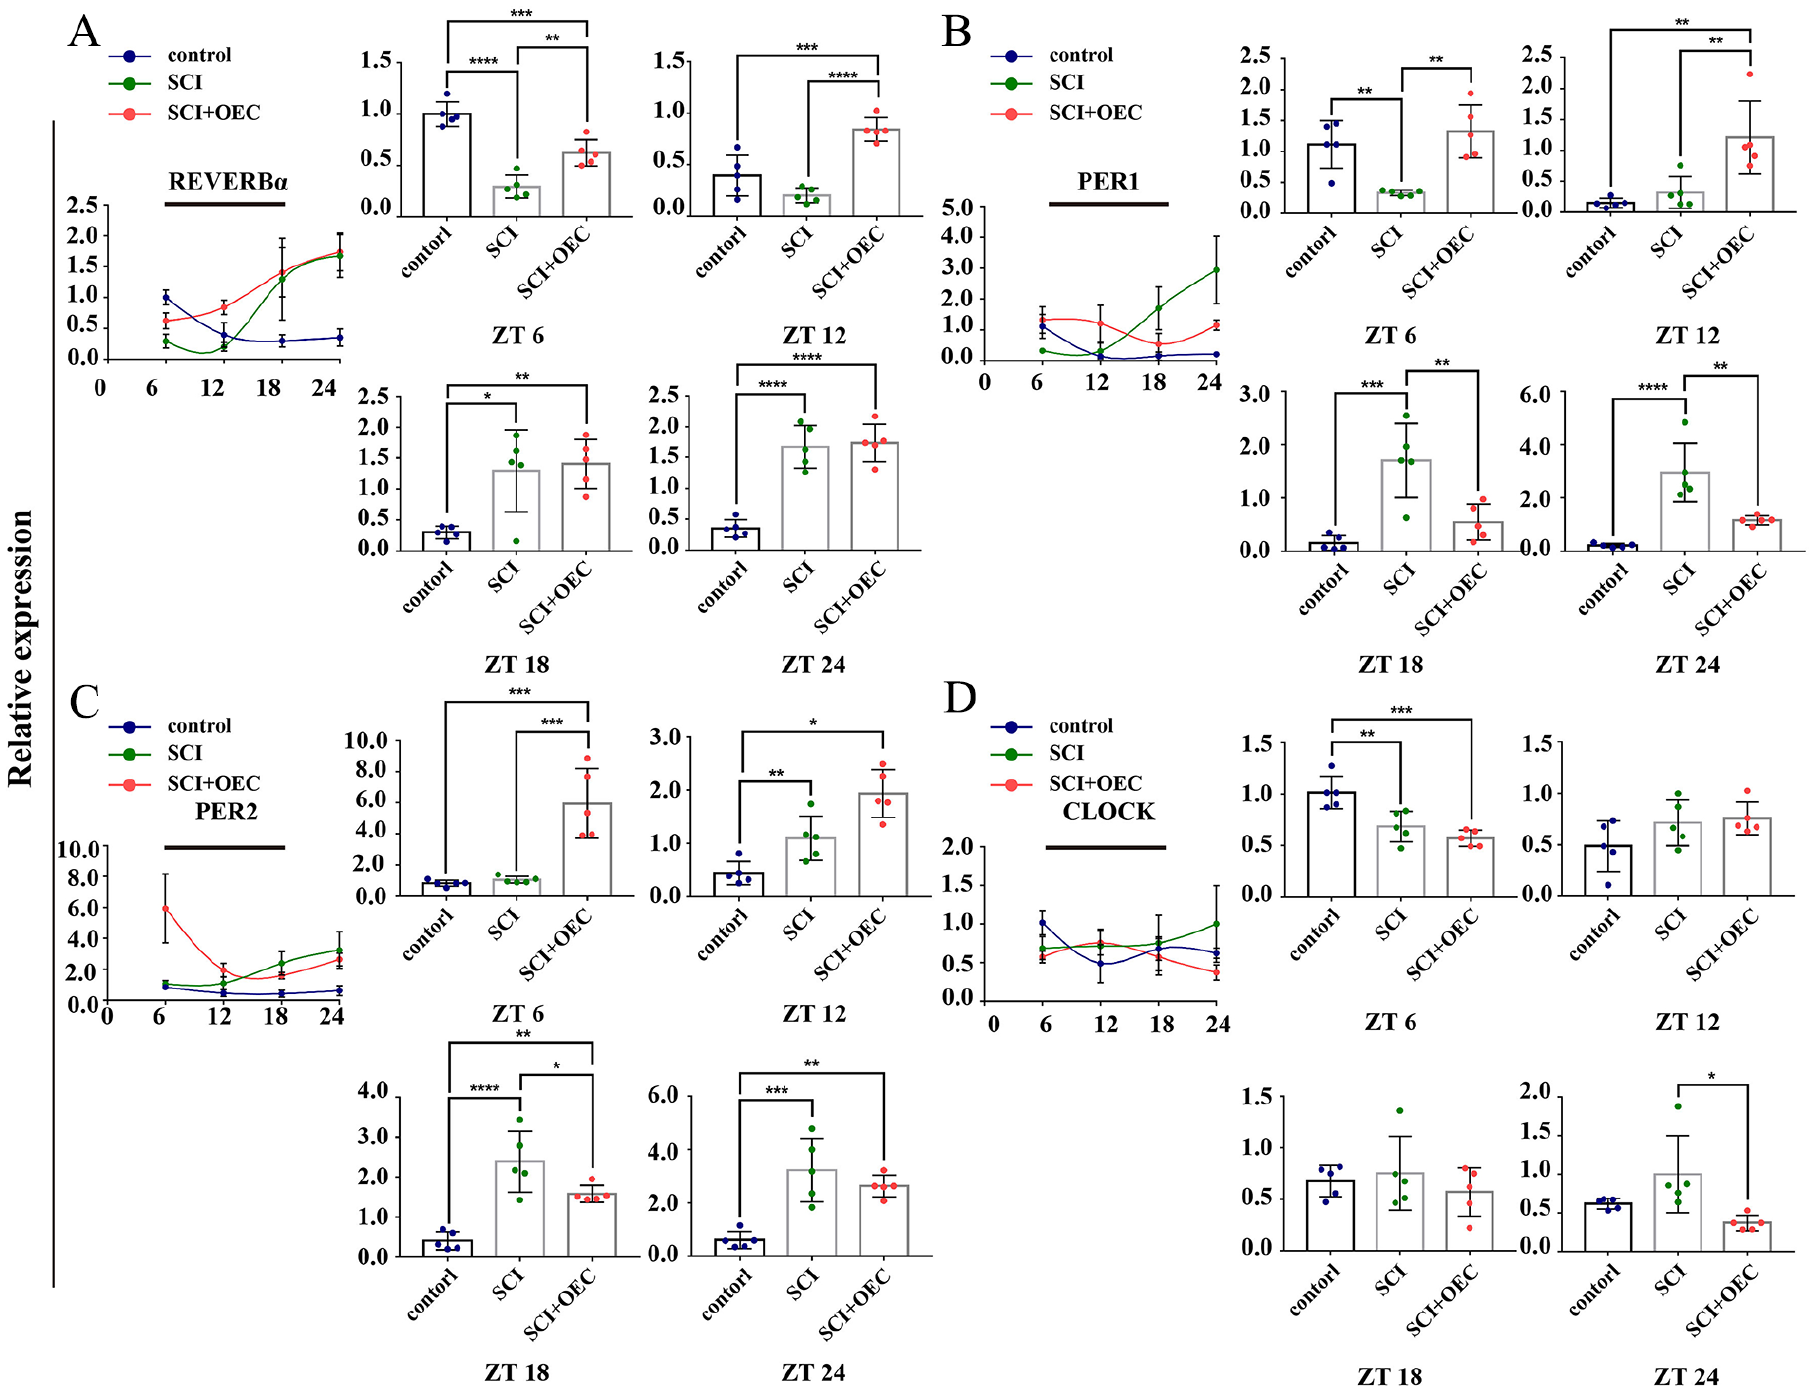
Circadian gene expression in hypothalamus before and after OEC treatment. (A) The relative expression of REV-ERBα at 7 days post of OEC transplantation. (B) The relative expression of PER1 at 7 days post of OEC transplantation. (C) The relative expression of PER 2 at 7 days post of OEC transplantation. (D) The relative expression of CLOCK at 7 days post of OEC transplantation. n = 5. Data are presented as mean ± SD. *P < 0.05; **P < 0.01; *P < 0.05; ***P < 0.001.
In prefrontal cortex, the mRNA level of REV-ERBα was significantly decreased at ZT 6, ZT 12 in the control group compared with SCI and SCI+OEC group (P < 0.0001 and P < 0.0001, respectively) (Fig. 8A). When compared with the control group, the expression of PER1 and PER2 were decreased in both SCI and OEC treated group. No significant differences were found (Fig. 8B, C). The mRNA level of CLOCK was significantly decreased after OEC treatment compared with SCI group at ZT 6 (P < 0.0028) and ZT 24 (P = 0.0447) (Fig. 8D).
Circadian gene expression in cortex before and after OEC treatment. (A) The relative expression of REV-ERBα at 7 days post of OEC transplantation. (B) The relative expression of PER 1 at 7 days post of OEC transplantation. (C) The relative expression of PER 2 at 7 days post of OEC transplantation. (D) The relative expression of CLOCK at 7 days post of OEC transplantation. n = 5. Data are presented as mean ± SD. *P < 0.05; **P < 0.01; *P < 0.05; ***P < 0.001.
Circadian Gene Expression in Spinal Cord Before and After OEC Treatment
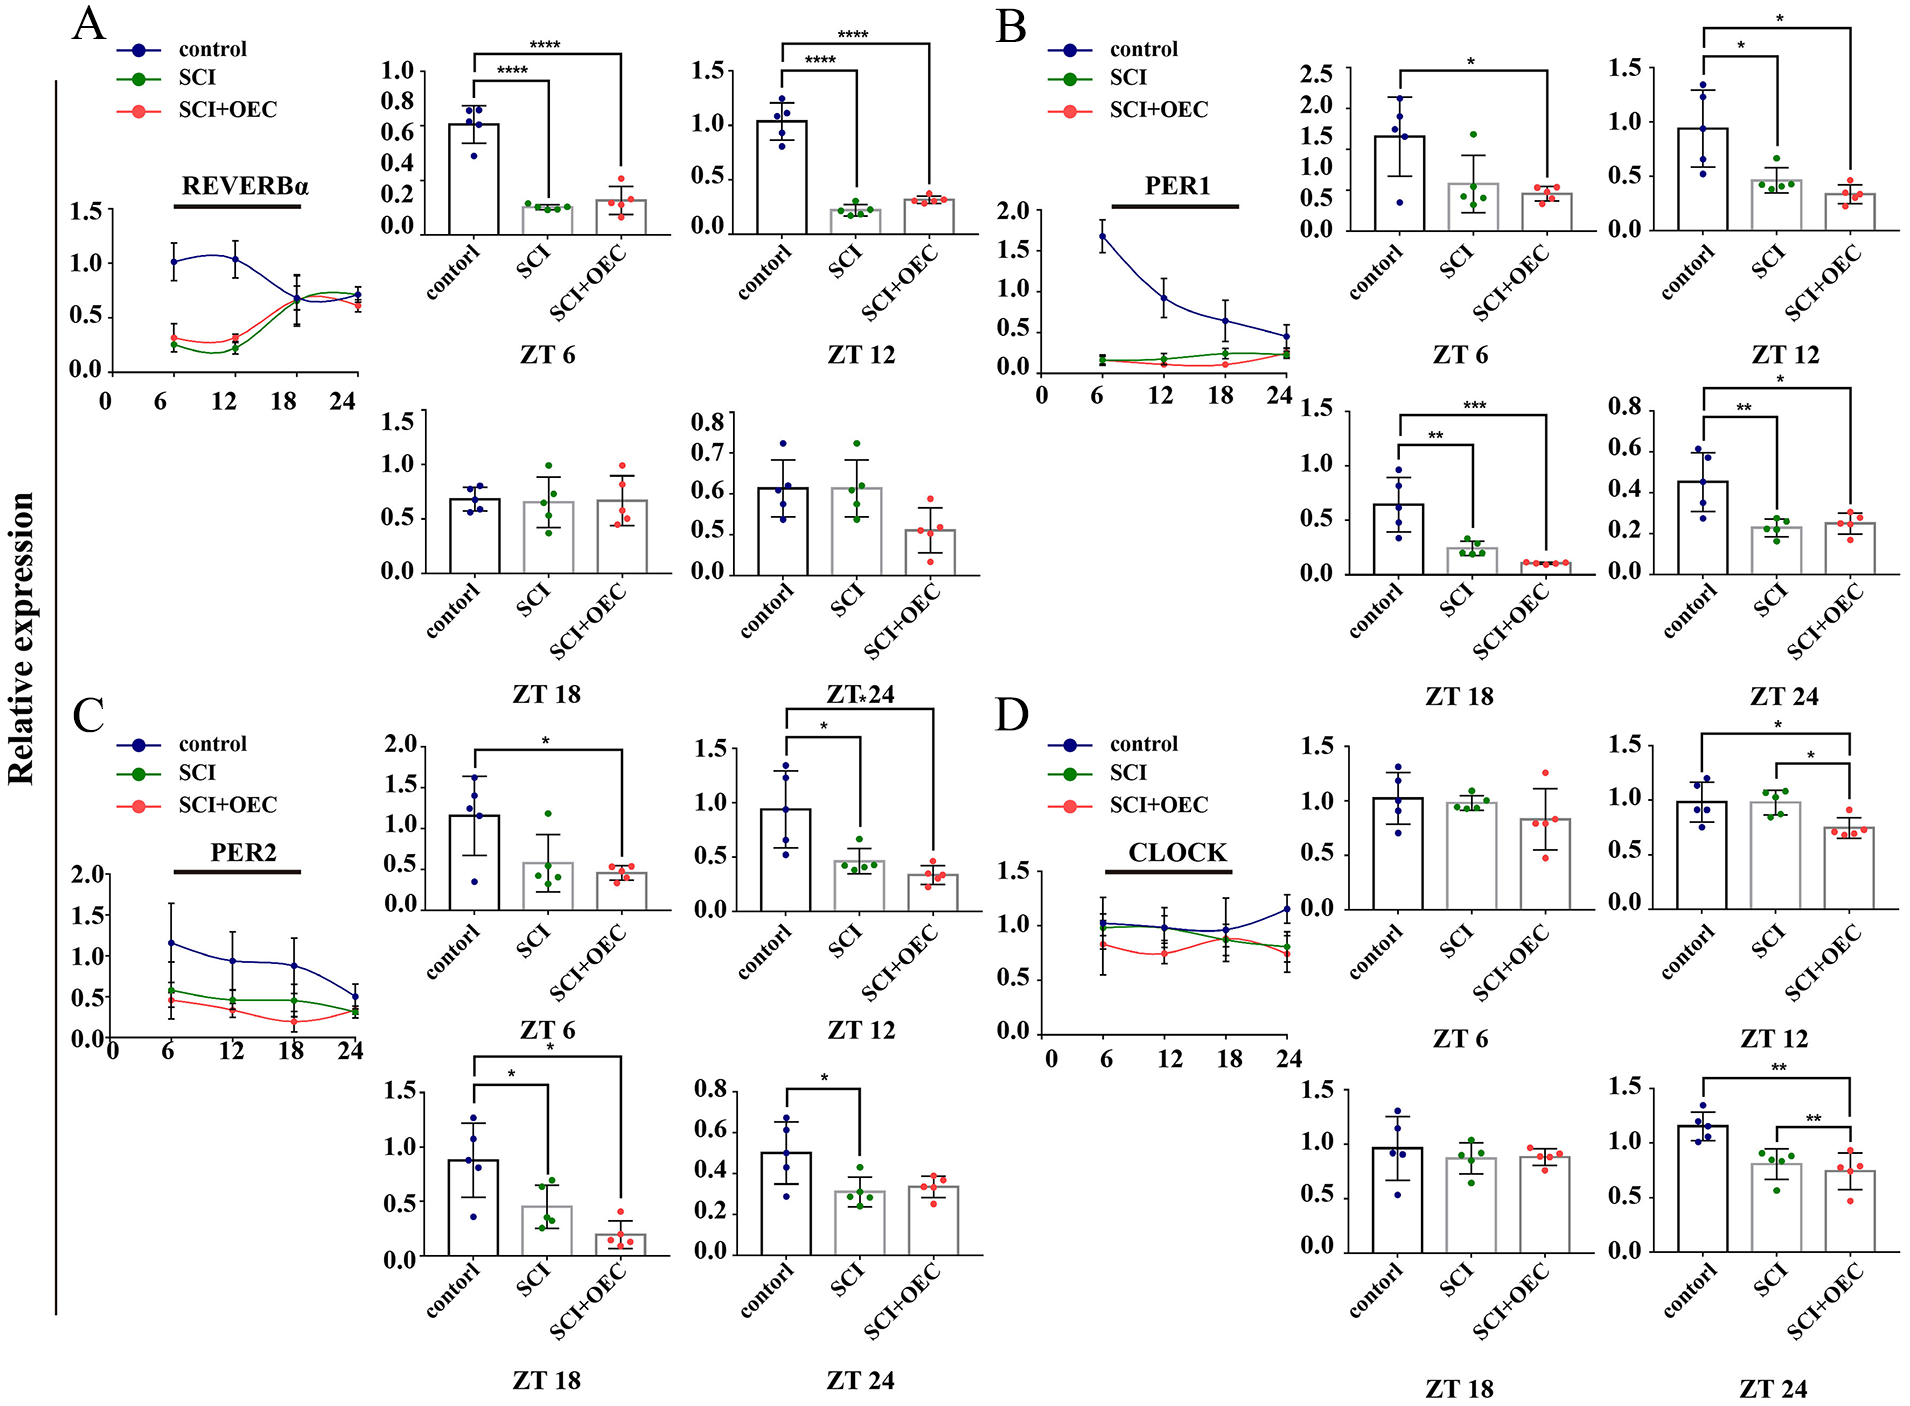
In the spinal cord, the mRNA level of REV-ERBα was significantly decreased following SCI and post of OEC treatment at ZT 6 (P = 0.0003, P = 0.0013, respectively) and ZT 12 (P = 0.0001, P = 0.0006, respectively). And its expression levels were increased post of OEC treatment at ZT 24 (P = 0.0015) when compared with the SCI group (Fig. 9A). For PER 1, its mRNA level in the OEC treated group was significantly increased at ZT 6 compared with both the control and SCI group (P = 0.0062, P = 0.0007, respectively). At ZT 18, the mRNA level of PER 1 in OEC group showed the lowest expression with significant difference between SCI group (P = 0.0012). Contrarily, the PER 1 mRNA level in SCI group showed its highest expression with significant difference between control group (P = 0.0037) (Fig. 9B). The mRNA expression levels PER 2 were significantly decreased at ZT 6 and ZT 12 in both SCI group (P < 0.0001, P = 0.0033, respectively) and OEC group (P < 0.0001, P = 0.0414, respectively) when compared with the control group. And the significant difference between SCI and OEC treated group presented at ZT 24 (P = 0.0112) (Fig. 9C). The mRNA level of CLOCK was elevated after OEC treatment. And the significant difference presented at ZT 6 when compared with both control group (P = 0.0035) and SCI group (P = 0.0004) (Fig. 9D). As shown in Fig. 10, our results showed that the maximal expression of REV-ERBα in OEC treated group presented at ZT 24.
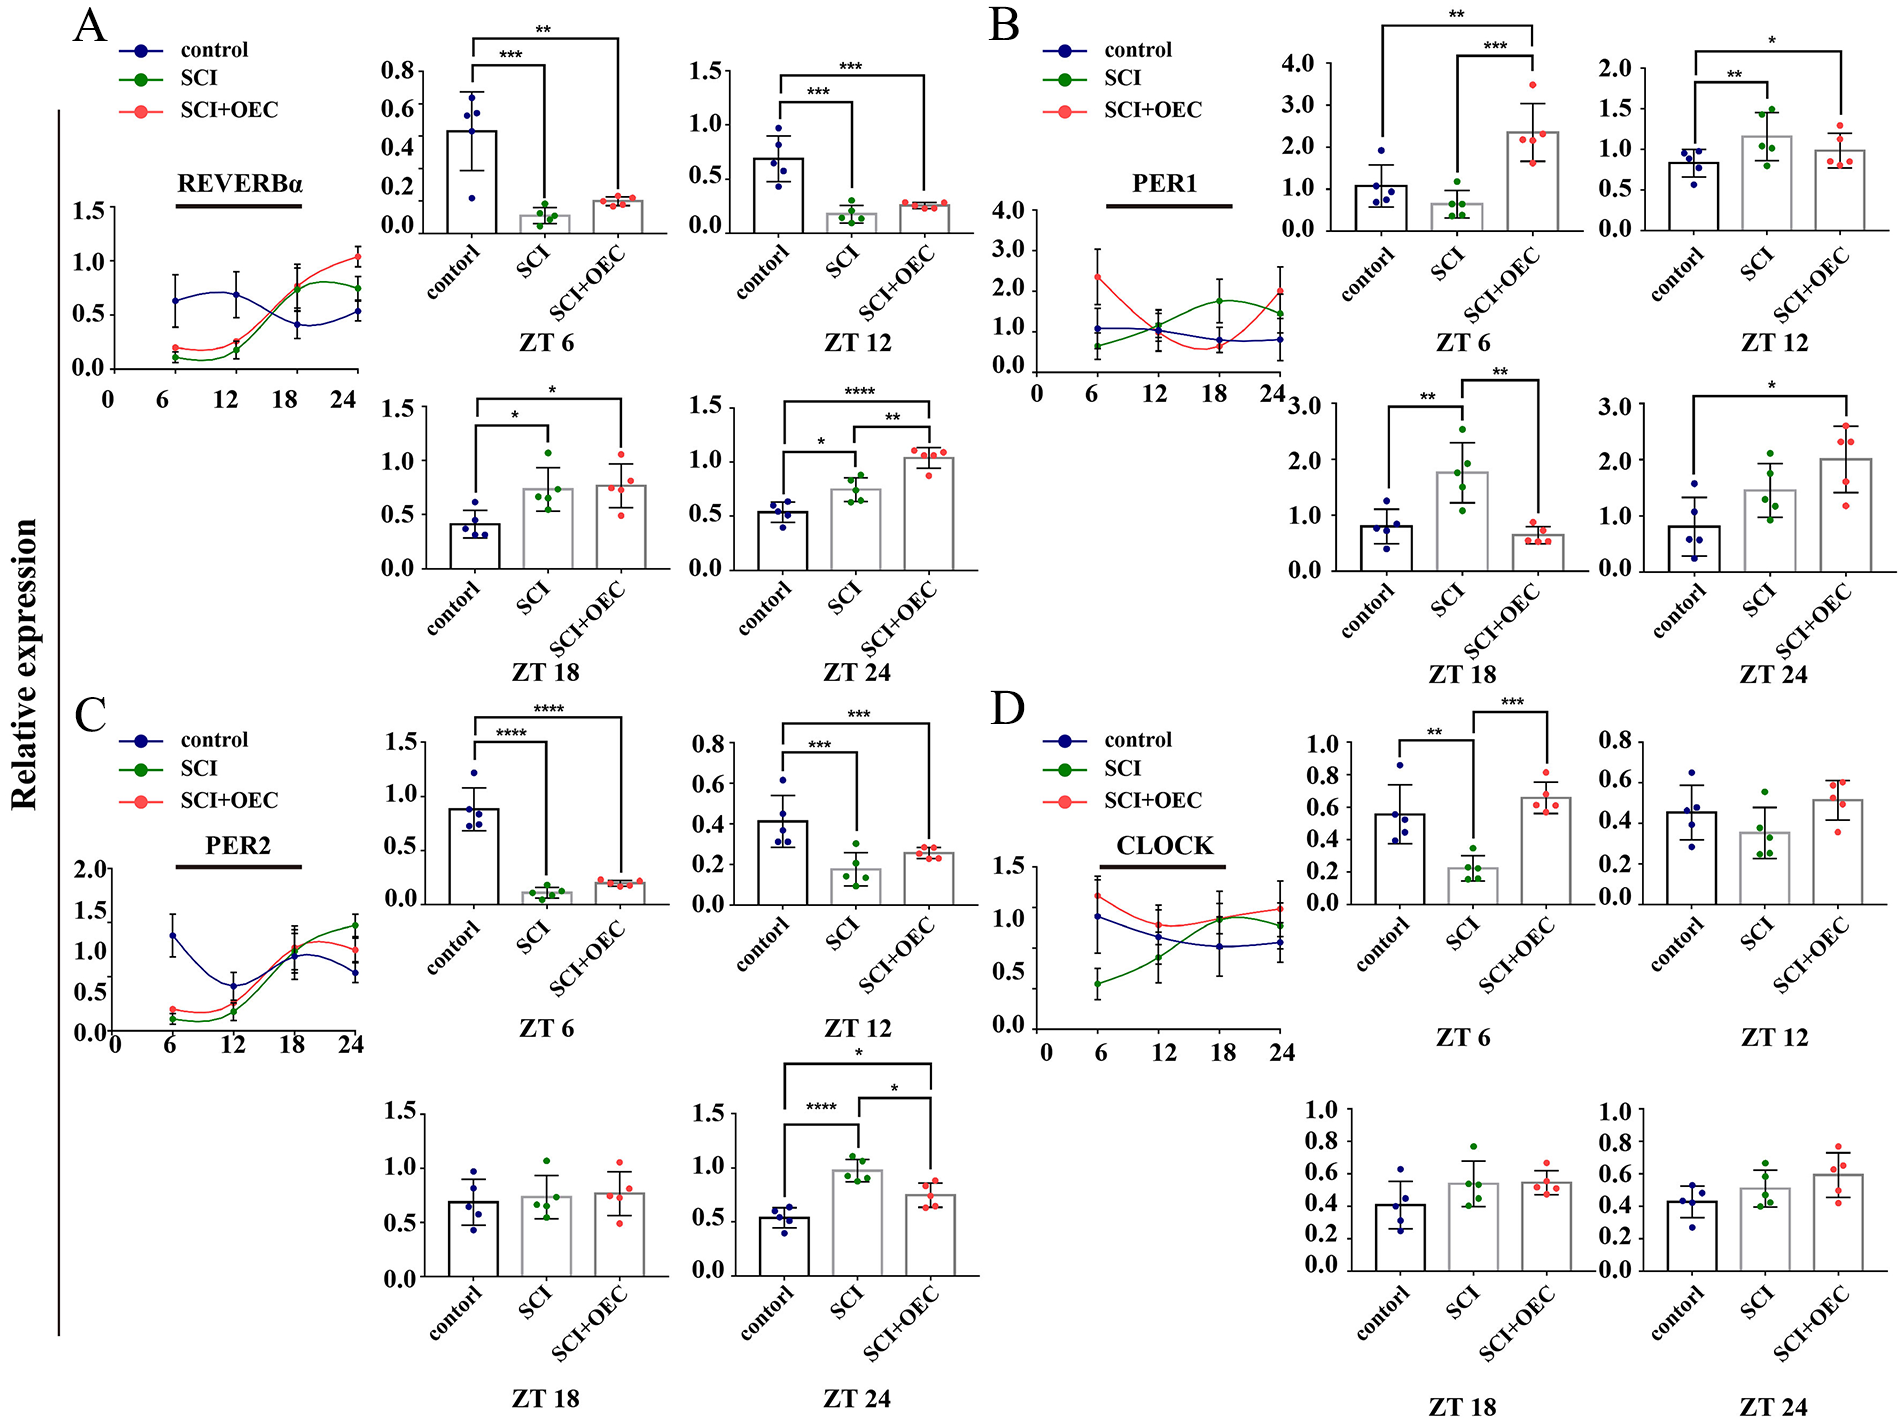
Circadian gene expression in spinal cord before and after OEC treatment. (A) The relative expression of REV-ERBα at 7 days post of OEC transplantation. (B) The relative expression of PER1 at 7 days post of OEC transplantation. (C) The relative expression of PER 2 at 7 days post of OEC transplantation. (D) The relative expression of CLOCK at 7 days post of OEC transplantation. n = 5. Data are presented as mean ± SD. *P < 0.05; **P < 0.01; *P < 0.05; ***P < 0.001.
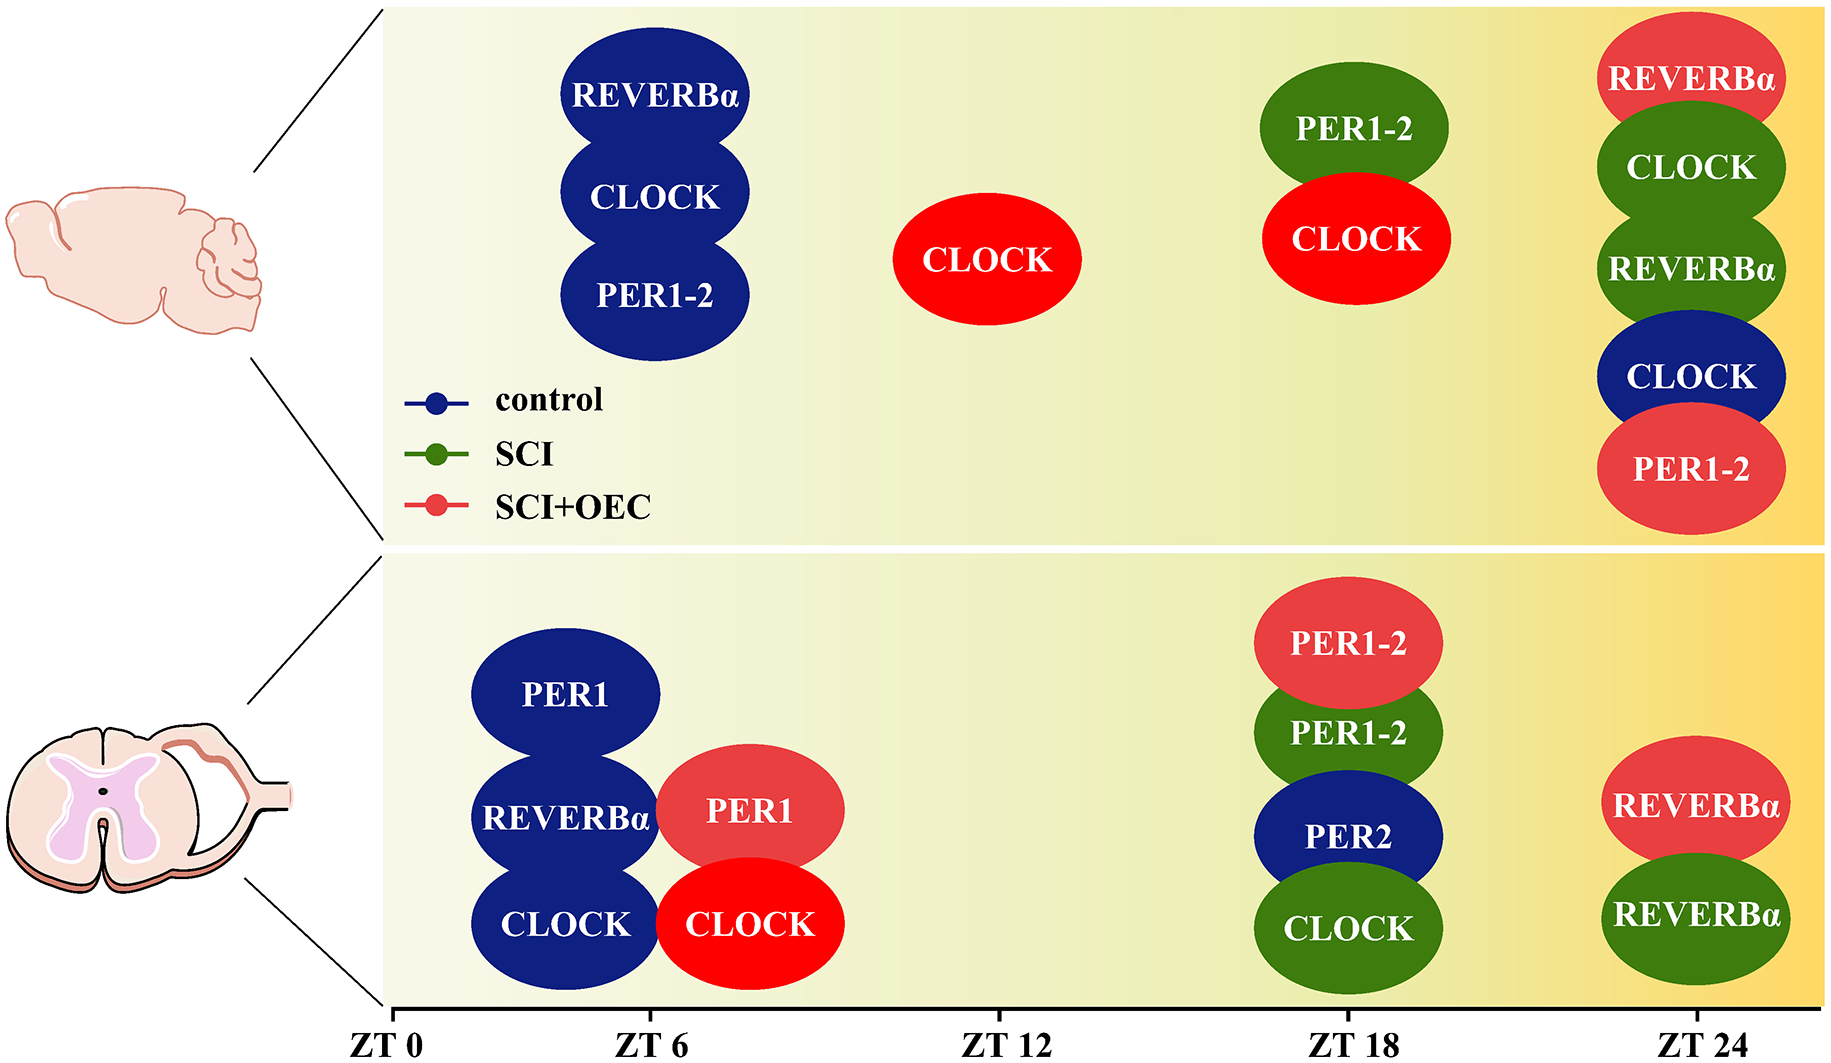
The time map of the maximal clock gene expression map for REV-ERB, PER1, PER 2 and CLOCK. The blue ellipse refers to control group. The green ellipse refers to SCI group. The red ellipse refers to OEC treated group. ZT refers to Zeitgeber time. ZT 0 indicates the beginning of day, or the light phase, and ZT 12 is the beginning of night, or the dark phase.
The Expression of REV-ERBα in Spinal Cord and Hypothalamus at ZT 24
We performed western blot to confirm the expression profiles of REV-ERBα at ZT 24 after OEC treatment (Fig. 11A). Compared with control group, the results showed both the OEC treatment and SCI induced a higher expression of REV-ERBα in the hypothalamus (P = 0.0004). However, the expression of level REV-ERBα between OEC and SCI group did not reach significant difference (Fig. 11B). In the spinal cord, treatment with OEC significantly promoted the expression of REV-ERBα with significant different compared with both SCI group and control group (P = 0.0406, and P = 0.0025, respectively) (Fig. 11C).
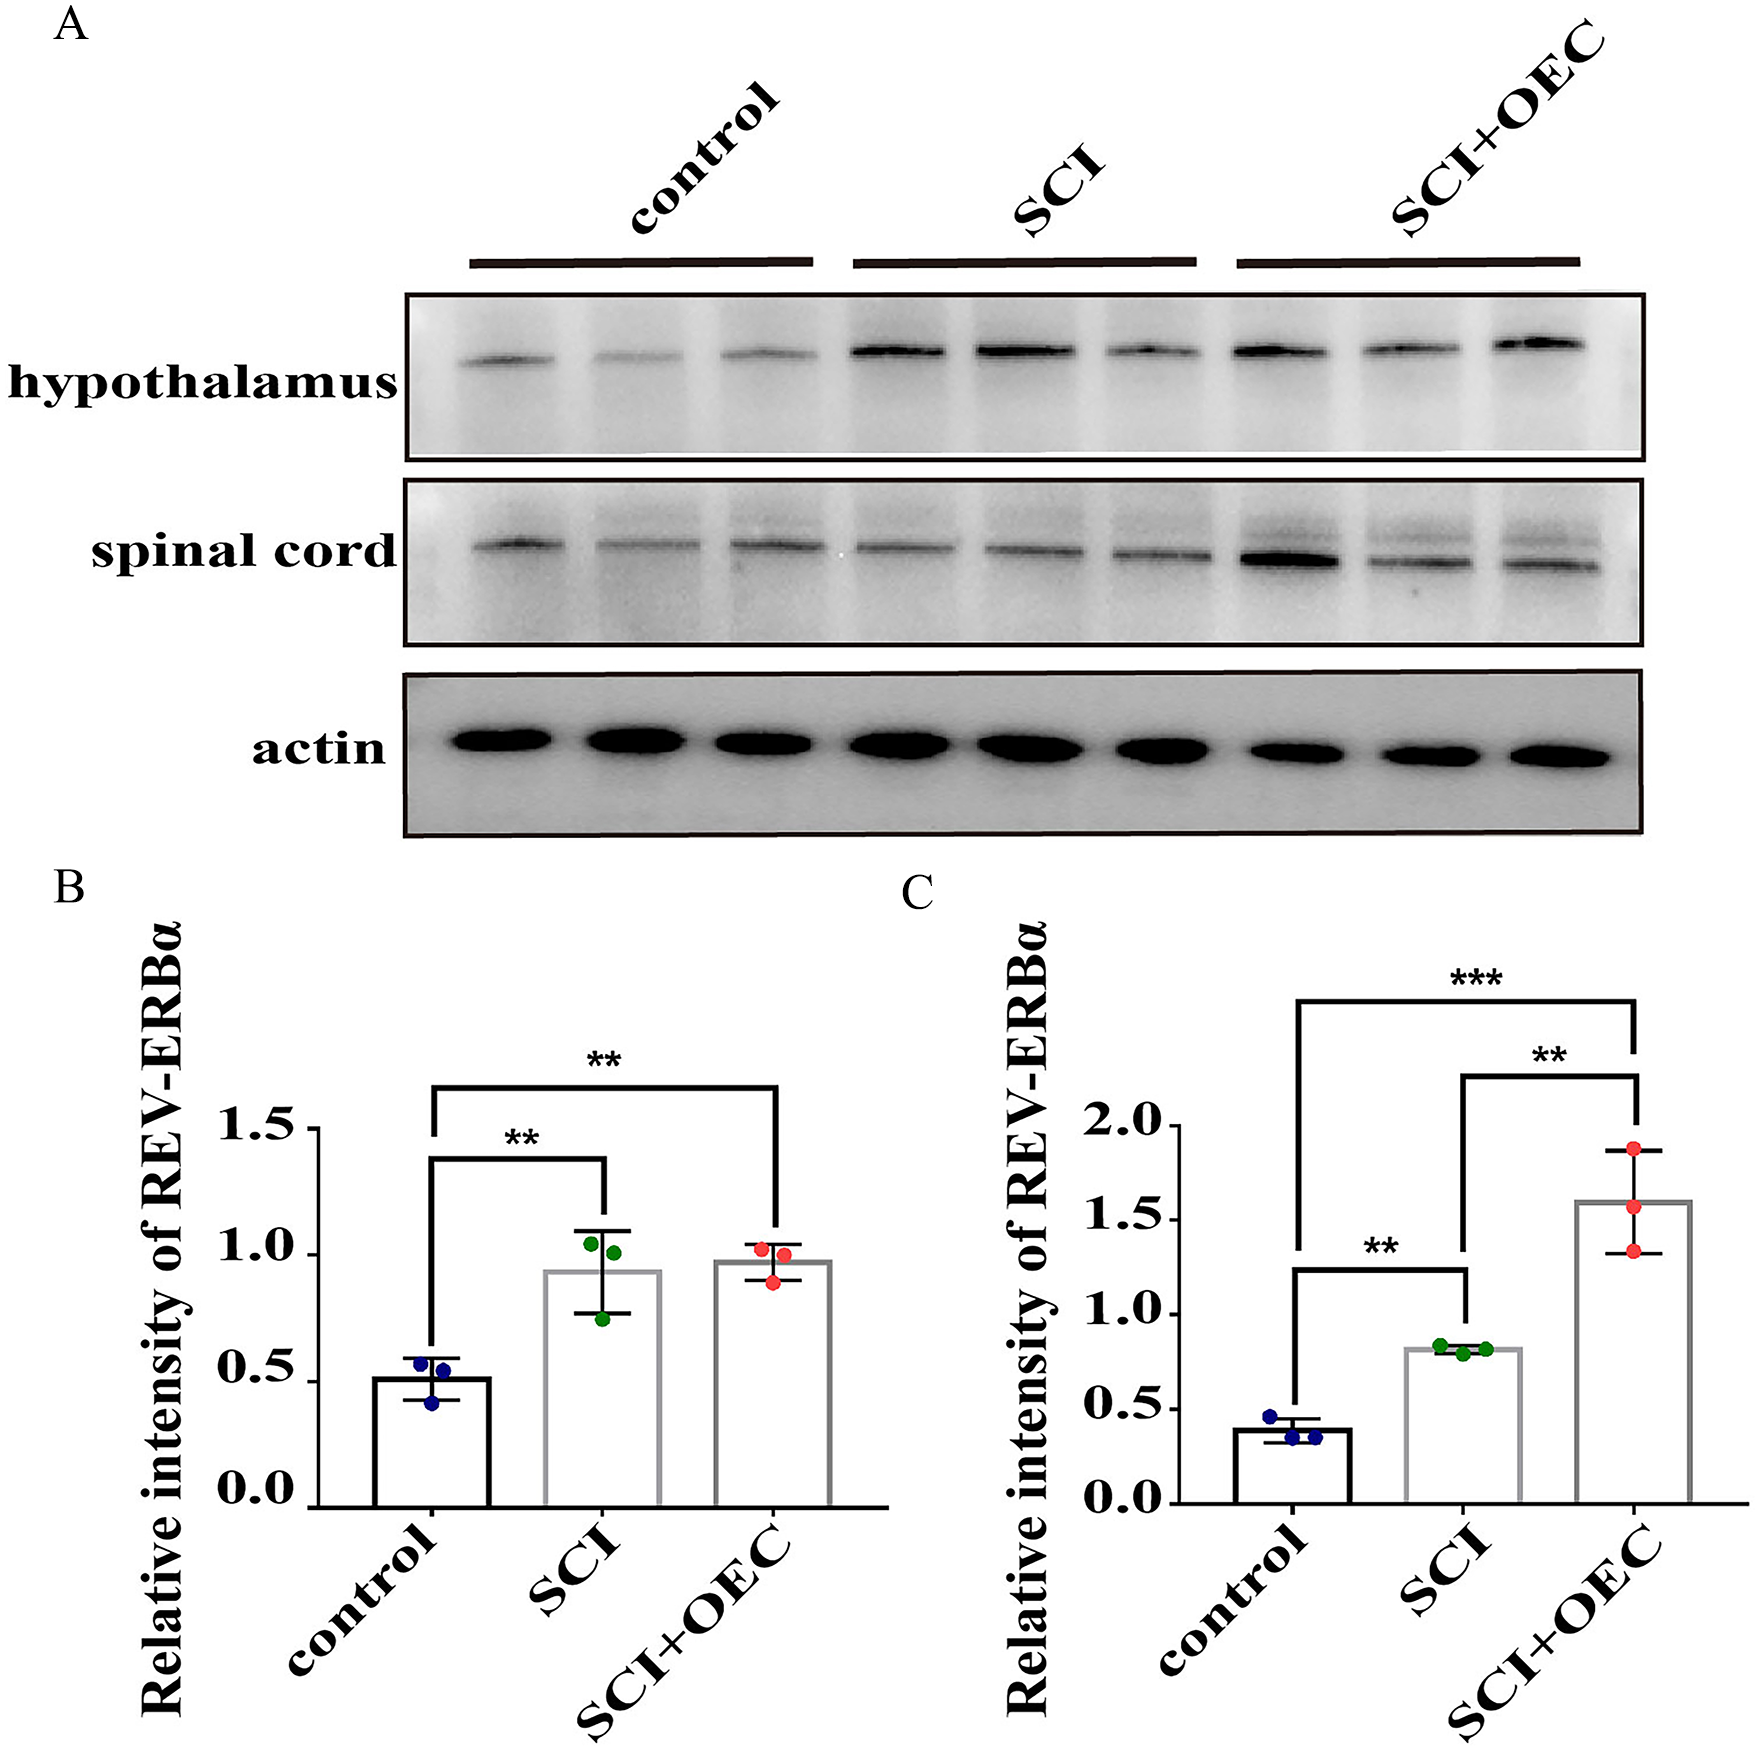
A. Representative blots for each protein. The band intensities were assessed by scanning densitometry. B. The relative protein expression (optical density ratio to actin) of the REV-ERBα in hypothalamus. C. The relative protein expression (optical density ratio to actin) of the REV-ERBα in spinal cord. Data are expressed as the mean ± SD (n = 3). *P < 0.05; **P < 0.01; ***P < 0.001.
Discussion
Microglia-induced neuroinflammation is the hallmarks of secondary injury following SCI 21 . Based on the previous studies and our observations, the findings suggested OECs could serve as the promising seed cells to modulate the neuroinflammation following SCI22–24. Moreover, the strong dependence of neuroinflammation on circadian gene disruption has been studied25–27. However, the correlation between OECs transplantation and circadian gene regulation has yet to be explored. To the best of our knowledge, our study for the first time investigated how the SCI or OEC transplantation induced the alternation of clock genes. And our results suggested that the dysregulated circadian genes such as Rev-erbα might serve as therapeutic targets in modulation neuroinflammation
There is growing list of physiological processes that are controlled by the circadian clock includes metabolism, neural repair and inflammation28–31. Recent research in both rodents and humans has suggested a link between the circadian clock dysregulation and SCI. In rats, temperature rhythms were disrupted following thoracic 3 (T3) spinal cord transection 32 . In humans, cervical SCI could also disrupt the diurnal rhythm of body temperature in chronic phase 33 , and sleep disturbance is common in people with SCI 34 . Dysregulation of the circadian rhythm could affect physiological function, predispose to disease, and worsen outcomes after injury35,36. For instance, disruption of the circadian clock by exposure to abnormally timed light after traumatic brain injury in rats increased neuronal death and the volume of cortical lesions, resulting in a worsening of sensorimotor and cognitive impairments 37 . Thus, the dysregulated clock genes could serve as therapeutic target for the treatment of SCI.
The presence of clock genes in microglial cells has been documented in the published literatures, suggesting that not only do microglia express clock genes, but that they actually have an oscillating molecular clock38,39. Rev-erbα, a nuclear receptor and circadian clock component, has been reported involved in microglial activation and neuroinflammation 8 . In order to explore the mechanisms of OECs in modulating microglia activation via regulation of REV-ERBα, we analyzed the expression patterns of inflammatory cytokines and clock genes of microglia after OECs treatment. We found that the Rev-erbα expression was upregulated following OECs treatment. Evidence has showed that NF-κB signal pathway could be regulated by circadian clockworks 40 . And pharmacological activation of Rev-erbα could inhibit NF-κB pathway 41 . In line with a valuable study, we also found that the upregulation of Rev-erbα might alleviate the activation microglial cells and facilitate their subtype switch from the M1 to the M2 state via the NF-κB pathway 42 . We next sought to determine if downregulating REV-ERBα in microglia could limit OECs-induced therapeutic effects. REV-ERBα is an orphan nuclear receptor and thus can be inhibited using brain-permeant small-molecule antagonist such as SR8278 43 . In this study, we used SR8278 to inhibit the transcriptional repressor activity of REV-ERBα in microglia. And we found that OECs could not significantly decrease the activation of SR8278 preconditioned microglia cells. Thus, we hypotheses that the OECs could upregulate the expression of REV-ERBα in microglia cells and reduce their activation through NF-κB pathway. However, the underlying molecular mechanism of OECs in regulating REV-ERBα in microglia still need further investigation in our future study. Here, we pointed out that the therapeutic approaches that targeted on the circadian gene in neuroinflammatory cells could be a promising idea in modulation neuroinflammation following central nervous system disease such as SCI.
In this study, we also investigated the expression pattern of clock genes in both lesion epicenter and prefrontal cortex and hypothalamus following SCI and after OEC treatment. Literatures have showed a 24-h rhythmic expression profile of clock genes in brain regions including in the prefrontal cortex and hypothalamus which participated in various physiological and pathological processes44–48. In consistent with those previous study, we also found that the expression of clock genes in both lesion epicenter and prefrontal cortex and hypothalamus were in circadian rhythm. And SCI disrupted their typical rhythms. OECs transplantation could modulate those dysregulations. Moreover, our results showed that the expression of those clock genes was in a tissue-dependent manner. We found that SCI induced a decrease of REV-ERBα expression in the early to mid-dark phase (from ZT 6 to ZT 18) in both spinal cord and brain regions. That are consistent with earlier research which documented that REV-ERBα downregulation could promote a switch of microglia to the pro-inflammatory state 9 . At ZT 24, the expression of REV-ERBα, which has been documented as an anti-inflammatory clock gene, was significantly upregulated after OEC treatment. Combined with the in vitro results, our results suggested that OEC might mediate neuroinflammation via upregulating REV-ERBα gene expression in microglia. Evidence have indicated that PER 2 gene contributes to microglia induced neuroinflammatory response49–52. In this study, the expression of PER 2 in spinal cord and prefrontal cortex tissue showed a higher expression level in the in the early to mid-dark phase (from ZT6 to ZT18) in the control group which were significantly higher than that in the SCI and OEC-treated group. However, the expression of PER 2 in hypothalamus was higher that both the SCI and OEC-treated group during the 24 rhythmicity. In the presented study, we also found that the expression patterns of REV-ERBα, PER 1, PER 2, and CLOCK were different when compared between the tissues extracts and microglia cells. Moreover, previous study has reported that REV-ERBα expression is negatively regulated by PERs proteins and positively regulated by CLOCK. However, the in vivo results did not show the same tendency. We proposed that these differences might be caused by the difference in cell types within different brain regions, resulting in a blunted composite amplitude at the tissue level. The tissues extract might have several cell composition including astrocytes, neurons, immune cells, and oligodendrocyte lineages, and so on 7 . And those localized cells could have their cell type-specific clock gene expression pattern53,54. Moreover, one previous study also showed that the subtypes of microglia cells were distinct in the different central nervous system regions 55 . Thus, the results might not reflect how the OECs transplantation regulate microglia-specific clock genes expression. In the future work, specific cell sorting methods such as fluorescence-activated cell sorting (FACS) will be needed to verify the results obtained of the presented study 56 .
This study has limitations that should be considered. First, we only investigated the alternation of clock genes expression in the acute phase after OEC treatment. It would be also very important to investigate the alternations in those clock genes expression in the chronic phase of SCI. Second, in this study, we just focused on how the OECs regulated the REV-ERBα expression in the microglia. The underlying mechanism for OECs in modulating PER 1, PER 2 and CLOCK gene expression and their interactions need further investigation in the future work. Third, creating loss of function or “null” mutation in a gene is a powerful way to investigate what that gene does with loss-of-function analyses 57 . However, the use of Rev-erbα knock out animal models in SCI research has not been reported. As a future theme, it is of importance to investigate the effect of REV-ERBs deficiency on the circadian clock alternation following SCI as well as global changes of circadian gene expression rhythms after OEC treatment.
Conclusion
The dysregulated expression of the clock genes may be a critical factor in the modulation of neuroinflammation after SCI. Neuroinflammatory responses in both the spinal cord and brain were attenuated by intravenous transplantation of OECs via normalization of clock gene expression. In addition, we demonstrated that OECs could reduce the activation of microglia via upregulation REV-ERBα through NF-κB pathway. This study inspired novel therapeutic paradigm such as chronotherapy based on OEC transplantation targeting neuroinflammation.
Footnotes
Acknowledgements
We thank Percy Griffin from Washington University School of Medicine for his thoughtful work. The inspiration comes from his previous publications.
Author Contributions
Lijian Zhang and Chuan Fang conceived and designed the experiments. Lijian Zhang, Luxuan Wang and Yanli Tan performed the experiments. Lijian Zhang and Chunhui Li analyzed the data. Lijian Zhang and Luxuan Wang wrote the paper. Lijian Zhang and Luxuan Wang contributed equally to this work.
Data Accessibility Statement
All data used in this study are available from the corresponding author upon reasonable request.
Ethical Approval
This study was approved by the ethical review board of Affiliated Hospital of Hebei University Animal Ethics Committee, Baoding, China.
Statement of Human and Animal Rights
This article does not contain any studies with human subjects. All the experiments included in this study was approved by the Affiliated Hospital of Hebei University Animal Ethics Committee (IACUC-2021XG009).
Statement of Informed Consent
There are no human subjects in this article and informed consent is not applicable.
Declaration of Conflicting Interests
The author(s) declared no potential conflicts of interest with respect to the research, authorship, and/or publication of this article.
Funding
The author(s) disclosed receipt of the following financial support for the research, authorship, and/or publication of this article: This work was supported by National Natural Science Foundation of China (82201541, 82260256); China Postdoctoral Science Foundation (2022M710997); The Scientific Research Starting Foundation of Affiliated Hospital of Hebei University (31010413). Scientific Research Foundation for the Returned Overseas Chinese Scholars of Hebei Province (20230352).