
Abstract
Long non-coding RNAs (lncRNAs) are frequently reported to be involved in breast cancer (BC) oncogenicity. The goal of this study was to probe lncRNA LINC01140’s role and action mechanism in BC. Relative LINC01140, miR-200b-3p, and dystrophin (DMD) levels were determined using quantitative real-time polymerase chain reaction (qRT-PCR). DMD protein levels in BC cells were quantified using Western blotting, and the targeting relationships were validated by luciferase reporter assays and RNA immunoprecipitation experiments. The proliferative potential of the cells was evaluated using CCK-8 and colony formation tests, while the migratory and invasive abilities of the cells were assessed using scratch and transwell assays. Apoptosis was assessed by flow cytometry. Nude mouse models have been established to allow the examination of tumor growth in vivo. Pronounced downregulation of LINC01140 and DMD, as well as upregulation of miR-200b-3p, was observed in BC. LINC01140 binds directly to miR-200b-3p to downregulate DMD expression. Ectopic LINC01140 expression not only limited tumor growth in vivo but also diminished the proliferation, migration, and invasion abilities of BC cells in vitro, however, it induced apoptosis in BC cells. Elevated miR-200b-3p expression stimulated the tumorigenic potential of BC cells and attenuated the suppressive effect of LINC01140 or DMD overexpression on BC cell malignancy, whereas DMD overexpression restricted the tumorigenic potential of BC cells. Overall, LINC01140 prevents BC development via the miR-200b-3p–DMD axis. These findings support the latent potential and usefulness of the LINC01140-miR-200b-3p–DMD network as a target for BC therapy.
Introduction
Breast cancer (BC) is a prevalent malignancy among females and has been reported to rank second among the leading causes of cancer-associated death worldwide1–3. The incidence and mortality rates of BC have increased sharply over the past few years 4 . For instance, in the United States, approximately 230,000 patients were newly diagnosed with BC, with 40,000 cancer deaths occurring in 2014 4 . In 2018, these figures rose to 1.7 million and 610,000, respectively 5 . The clinical symptoms of BC at the onset stage are insidious and generally manifest as atypical hyperplasia6,7. Resistance and distal metastases dominate in patients with advanced BC, greatly hindering therapeutic success6,7. Therefore, a better understanding of the pathogenicity underlying the initiation and progression of BC is essential to develop effective therapeutic procedures.
Long non-coding RNAs (lncRNAs), which are non-coding RNAs (ncRNAs) of at least 200 nucleotides (nt) in length, have been shown to execute epigenetic, transcriptional, and post-transcriptional functions in organisms8–11. Several lncRNAs have been reported to play key roles in BC biology, many of which are considered oncogenic. For example, high levels of lncRNA LSINCT5 have been identified in BC, and its knockdown contributes to the abatement of the proliferative properties of BC cells 12 , and BC patients with BC overexpressing lncRNA BCRT1 have an inferior prognosis 13 . However, certain lncRNAs may serve as cancer suppressors during BC progression. Poor lncRNA GAS5 levels have been detected in BC, and its elevated expression can induce growth arrest and stimulate apoptosis, thereby hindering BC development14,15. Downregulation of LINC01140 in BC samples was found using the online tool GEPIA (http://gepia.cancer-pku.cn/index.html). According to previous studies, the upregulation of LINC01140 has been detected in bladder cancer, lung cancer, and glioma, and its overexpression is strongly correlated with poor survival rates in patients with these cancers16–18. More importantly, a recent study by Li et al. found the LINC01140 levels in 291 healthy volunteers and 1,085 BC patients 19 . They detected poor LINC01140 expression in patients with BC, suggesting that high levels of LINC01140 may predict a decrease in the relapse rate among patients with BC. Nevertheless, LINC01140’s precise role and detailed action in BC tumorigenesis remain poorly understood.
Mature microRNAs (miRNAs), which are single-stranded RNA that are 19–25nt in length, execute regulatory roles by controlling the expression of downstream genes20,21. Many miRNAs have been confirmed to play key regulatory roles in BC development. A great deal of miRNAs, such as the antineoplastic miR-205, miR-145, miR-217-5p, and miR-18322–25 as well as the oncogenic miR-155, miR-21, and miR-20a26–28, have been confirmed to execute important functions during BC development. Numerous studies have indicated that lncRNAs can sponge miRNAs and influence cancer progression. For example, lnc015192 sponges miR-34a and enhances BC metastasis 29 . Through bioinformatic analysis, miR-200b-3p was predicted to bind to LINC01140 and is upregulated in BC samples, and according to the literature on the topic, high levels of miR-200b-3p were validated in BC biopsy samples 30 . However, the interaction between miR-200b-3p and LINC01140 during BC progression remains unclear.
Dystrophin (DMD) is the most abundant gene in humans 31 . It comprised 79 exons and spans approximately 2.2 Mb of the genome 32 . DMD gene encoding DMD protein has two subunits (α and β), which have been reported to participate in tumorigenesis33,34. DMD was predicted to be a target gene of miR-200b-3p in BC using both the online tool StarBase (https://starbase.sysu.edu.cn/panCancer.php) and two mRNA microarrays from the GEO DataSets. According to a previous study, DMD expression is reduced in BC 35 . However, the specific function and mechanism of action of DMD in BC has not yet been reported.
Bioinformatics analysis predicted that the LINC01140/miR-200b-3p/DMD axis is a key regulatory pathway in BC development. Based on previous studies, we put forward a hypothesis that LINC01140 may prevent BC progression by targeting the miR-200b-3p/DMD axis. Exploring this axis may broaden our understanding of BC pathogenesis and highlight novel molecular targets for BC therapy.
Methods
Reagents
Dulbecco’s modified Eagle’s medium (DMEM)/F12, DMEM-H, RPMI-1640 medium, horse serum (HS), and fetal bovine serum (FBS) were purchased from Procell Life Science and Technology Co., Ltd. (Wuhan, China). Genomeditech (Shanghai, China) supplied the pcDNA3.1-LINC01140 overexpression vectors (LINC01140-OE), pcDNA3.1-DMD overexpression vectors (DMD-OE), pcDNA3.1 empty vector (empty vector), miR-200b-3p mimic, and its negative control (mimic-NC). Lipofectamine 3000, TRIzol reagent, and SuperScript II Reverse Transcriptase were purchased from Invitrogen (Carlsbad, CA, USA). TaKaRa (Shiga, Japan) provided the SYBR Premix Ex TaqTM Kit for the polymerase chain reaction (PCR) analysis. The crystal violet reagent and Magna RIP RNA-Binding Protein Immunoprecipitation Kit were acquired from Sigma-Aldrich (St Louis, MO, USA). PARIS Kit was purchased from Ambion (Austin, TX, USA). CCK-8 was purchased from Dojindo Laboratories (Kumamoto, Japan). For Western blot analysis, Santa Cruz Biotechnology (Dallas, TX, USA) supplied primary antibodies (DMD. sc-73592 and GAPDH—cat.no. sc-137179), and horseradish peroxidase-conjugated secondary antibody (cat. sc-2005). Beyotime Biotechnology (Beijing, China) provided the BCA protein assay kit, enhanced chemiluminescence (ECL) detection system, and RNA immunoprecipitation assay (RIPA) buffer.
Clinical Samples
Thirty-eight pairs of tumor and matched normal tissues were collected from patients with BC at The Central Hospital of Wuhan, Tongji Medical College, Huazhong University of Science and Technology. No relevant anticancer therapies were administered to the patients prior to admission. All the volunteers provided informed consent. All experimental procedures in this investigation obtained the ethical approval of the Central Hospital of Wuhan, Tongji Medical College, Huazhong University of Science and Technology (registration number: 院-市卫健委-伦2022(05)).
Culturing and Transfection of Cells
Normal breast epithelial cells (MCF-10A) and BC cell lines (HCC1937, MDA-MB-231, and MCF-7) were provided by Procell Life Science & Technology Co., Ltd. (Wuhan, China). MCF-10A cells were cultured in DMEM/F12 with 5% HS, 20 ng/ml EGF, 0.5 μg/ml hydrocortisone, and 10 μg/ml insulin. HCC1937 cells were cultured in RPMI-1640 medium, whereas MDA-MB-231 and MCF-7 cells were maintained in DMEM. All the BC cell cultures had 10% FBS and were maintained at 37°C with 5% CO2, in a humidified incubator.
For the transfections, MDA-MB-231 and MCF-7 at the logarithmic growth phase were transfected with 2 μg LINC01140-OE, 2 μg DMD-OE, 2 μg empty vector, 50 nM miR-200b-3p mimic, or 50 nM mimic-NC with the aid of the Lipofectamine 3000. Approximately, 48 h later, cells were collected for subsequent experiments.
In Vivo Assays
To detect BC tumorigenesis in vivo, 4-week-old BALB/c nude mice (24–28 g) were purchased from the Vital River Laboratory Animal Technology (Beijing, China) to perform in vivo assays. Five BALB/c nude mice were assigned to the LINC01140-OE group and the other five were assigned to the empty vector group. MCF-7 cells (1 × 10⁷) transfected with either the empty lentiviral vector or LINC01140-OE lentiviral vector were subcutaneously administered to the right side of each mouse. The tumor volume was monitored weekly. After 28 days, the animals were euthanized. Neoplasms were collected from each mouse and weighed. The Ethics Committee of the Central Hospital of Wuhan, Tongji Medical College, Huazhong University of Science and Technology approved this assay on 6th March, 2022 (registration number: 202203014).
RNA Extraction and Quantitative Real-time Polymerase Chain Reaction
RNA from tumor cell lines and tissues was extracted using the TRIzol reagent. SuperScriptTM II reverse transcriptase was used to synthesize cDNA. Strictly following the instructions for the SYBR® Premix Ex TaqTM Kit, the resulting cDNA were subjected to PCR analysis in an ABI 7900 Real-Time PCR System (Applied Biosystems, Foster City, CA, USA). The reaction conditions were 95°C for 10 min, 95°C denaturation performing 40 cycles for 15 s, and 60°C for 30 s. The primers used in this study are listed in Table 1. The 2-ΔΔCt was adopted to determine the expression levels, with GAPDH (for LINC01140 and DMD) and U6 (for miR-200b-3p) as the controls.
Real-Time PCR Primer Synthesis List.

PCR: polymerase chain reaction.
Subcellular Fractionation Experiment
To ascertain the localization of LINC01140 in MDA-MB-231 and MCF-7 cells, their cytoplasmic and nuclear fractions were isolated according to the aid of the PARIS instructions. Quantitative real-time polymerase chain reaction (qRT-PCR) was conducted to estimate the relative LINC01140 expression levels in the cytoplasm and nucleus. U6 and GAPDH were used as nuclear and cytoplasmic controls, respectively.
Dual Luciferase Reporter Experiments
The full-length of the 3′UTR of the DMD and LINC01140 fragments that contain the wild-type (WT) or mutant (MUT) miR-200b-3p binding sequences were cloned into pGL3 vectors, to generate the DMD-WT/MUT and LINC01140-WT/MUT, respectively. Combinations of a WT/MUT plasmid and a miR-200b-3p mimic/mimic-NC were introduced into MDA-MB-231 and MCF-7 cells with the aid of the Lipofectamine 3000. Thereafter, the Promega Dual-Glo Luciferase Assay System (Madison, WI, USA) was used to assess luciferase activity in BC cells after 24 h.
RNA Immunoprecipitation Assay
As the Magna RIP RNA-Binding Protein Immunoprecipitation Kit (Millipore, USA) directed, the beads were first coated with the anti-Ago2 or anti-immunoglobulin G (IgG) prior to their incubation at 4°C overnight with the lysed MDA-MB-231 and MCF-7 cells. Subsequently, the abundance of LINC01140 and miR-200b-3p was determined by qRT-PCR.
CCK-8 Test
BC cell viability was measured using a CCK-8 kit (Beyotime, China). Briefly, MDA-MB-231 and MCF-7 cells (1 × 10⁵ cells/ml) were seeded in 96-well plates and cultivated for 0, 24, 48, and 72 h. Thereafter, the cells were incubated for 2 h with 15 μl CCK-8. A Bio-Rad microplate reader (Berkeley, California, USA) was used to analyze cell viability at an absorbance of 450 nm.
Colony Formation Tests
The proliferative potential of BC cells was further evaluated using colony formation tests. MDA-MB-231 and MCF-7 cells were transferred in six-well plates, at a 1 × 10³ cells/well density. Two weeks after seeding, the cloned cells were fixed by adding 4% paraformaldehyde for 30 min. Subsequently, the cells were stained with 0.5% crystal violet for 20 min. Photographs of the cell colonies were captured under a light microscope (Olympus, Tokyo, Japan).
Scratch Experiments
MDA-MB-231 and MCF-7 cells (8 × 10⁴ cells) were seeded into six-well plates and grown until they reached confluence. Following this, the cell monolayers were rapidly scratched using a 10 μl pipette tip. Photographs of the scratch wounds were captured at the zeroth and 24th hours by means of a phase-contrast microscope (Olympus). Migration distances were estimated using the ImageJ software (National Institutes of Health, Bethesda, MD, USA).
Transwell Experiment
Prior to the transwell experiment, 8 μm Matrigel (Corning Incorporated, USA) was used to coat the transwell chambers overnight. A total of 5 × 10³ MDA-MB-231 and MCF-7 cells resuspended in a serum-free medium were then put into the top chambers, meanwhile, the medium containing 20% FBS was pipetted into the bottom chambers. After culturing cells at 37°C for 24 h, we immobilized and stained the cells on the lower surface with methanol and 0.1% crystal violet, respectively. Finally, the cells were observed under a light microscope (Nikon).
Flow Cytometry Experiment
The Annexin V-FITC Apoptosis Detection Kit (Beyotime, China) was used to perform flow cytometry experiments according to the manufacturer’s instructions. MDA-MB-231 and MCF-7 (1 × 10⁶ cells) were collected and 200 μl binding buffer containing 2.5% Annexin V-FITC and 5% propidium iodide was added. After incubation for 20 min in the dark, the cell apoptosis rate was determined using flow cytometry.
Western Blotting Analysis
Proteins were extracted from MDA-MB-231 and MCF-7 cells using ice-cold RIPA lysis buffer. Protein concentrations were quantified using a BCA protein assay kit (Beyotime, China), and thereafter, the protein products were separated by sodium dodecyl sulfate-polyacrylamide gel electrophoresis (SDS-PAGE) and transferred onto a polyvinylidene fluoride (PVDF) membrane. Non-fat milk (5%) was used in blocking the membranes at room temperature, and it was subsequently probed with the primary antibodies DMD and GAPDH and maintained at 4°C overnight. Subsequently, the membrane was probed with a secondary antibody for 2 h at room temperature. An ECL detection kit (Beyotime, China) was used to detect protein signals.
Statistical Analysis
All data were analyzed using SPSS 20.0, and are indicated as the mean ± standard deviation. Analysis of variance (ANOVA) plus Tukey’s post-hoc test and Student’s t test were applied for data comparisons. The Pearson correlation coefficient was used for linear correlation analysis. A P < 0.05 indicates a significant difference.
Results
The LINC01140 Expression Is Downregulated in BC
According to GEPIA analysis, LINC01140 expression was lower in BC samples than in normal samples (Fig. 1A). qRT-PCR analysis indicated that the BC cell lines (HCC1937, MDA-MB-231, and MCF-7) showed considerably lower LINC01140 expression than MCF-10A cells (Fig. 1B). Moreover, in our collected clinical BC samples, LINC01140 was downregulated in tumor tissues compared with in adjacent normal tissues (Fig. 1C). The subcellular localization analysis demonstrated that the distribution ratios of LINC01140 in the MCF-7 and MDA-MB-231 were 60% within cytoplasm and 40% within the nucleus, suggesting that LINC01140 was predominantly scattered within the cytoplasm of BC cells (Fig. 1D). These data demonstrated that LINC01140 expression was downregulated in BC.

The LINC01140 expression is downregulated in BC. (A) An online tool GEPIA analyzed the LINC01140 expression in BC samples and normal samples. *adj. P < 0.01. T, tumor. N, normal. (B) The expression levels of LINC01140 in BC cell lines (HCC1937, MDA-MB-231, and MCF-7) and normal breast epithelial cells (MCF-10A) cells were estimated through qRT-PCR. **P < 0.01 vs MCF-10A using ANOVA. (C) LINC01140 levels among the BC tumors and paired adjacent normal tissues were quantified by means of qRT-PCR. P < 0.0001 vs normal using Student’s t test. (D) LINC01140 expression within the cytoplasm and nuclei of MDA-MB-231 and MCF-7 cells was assessed by subcellular fractionation experiment. The data are presented as the mean ± SD. BC: breast cancer; GEPIA: Gene Expression Profiling Interactive Analysis; ANOVA: analysis of variance; qRT-PCR: quantitative real-time polymerase chain reaction.
The Malignancy of BC Cells Is Repressed by the Ectopic LINC01140 Expression In Vitro and In Vivo
To determine how it functions in BC progression in vitro, LINC01140 was overexpressed in MDA-MB-231 and MCF-7 cells (Fig. 2A). As shown in Fig. 2B, the CCK-8 assay proved that LINC01140 overexpression MCF-7 and MDA-MB-231 cells had significantly reduced cell viability. By performing scratch and transwell assays in MCF-7 and MDA-MB-231 cells, LINC01140 overexpression was found to attenuate their migratory and invasive potential (Fig. 2C, D), as well as reducing their colony numbers (Fig. 2E). In addition to this, flow cytometry showed that LINC01140 overexpression induced the cell apoptosis in MCF-7 and MDA-MB-231 cells (Fig. 2F). These findings suggested that LINC01140 suppresses BC progression in vitro.

The tumorigenic capacities of BC cells are repressed by the ectopic expression of LINC01140 in vitro. (A) LINC01140 expression in MCF-7 and MDA-MB-231 cells after transfection of LINC01140-OE or empty vector was assessed through qRT-PCR. (B) The viability of MCF-7 and MDA-MB-231 cells harboring an empty vector or LINC01140-OE vector was measured through CCK-8 test. *P < 0.05, **P < 0.01 vs empty vector using ANOVA. (C) Cell migration rate was assessed by scratch experiment in MCF-7 and MDA-MB-231 cells after transfection of LINC01140-OE or empty vector. Scale bar: 100 μm. (D) The number of invasive BC cells with empty vector or LINC01140-OE transfections was assessed via transwell experiment. Scale bar: 50 μm. (E) The number of BC cell colonies, after their transfections with LINC01140-OE or empty vector, was measured by the colony formation assay. (F) The apoptosis rate of BC cells after transfection of LINC01140-OE or empty vector was measured by flow cytometry. **P < 0.01 vs empty vector using Student’s t test. The data are presented as the mean ± SD. LINC01140-OE, LINC01140 overexpression vector. BC: breast cancer; ANOVA: analysis of variance; qRT-PCR: quantitative real-time polymerase chain reaction.
Next, LINC01140’s role in tumor formation was investigated in vivo. As shown in Fig. 3A–C, compared with mice injected with empty vectors, those injected with LINC01140-OE-transfected MCF-7 cells had remarkably lower tumor volumes and weights. This indicates that LINC01140 overexpression delays the development of BC in vivo.

LINC01140 overexpression limits tumor growth in vivo. The solid tumor image (A), tumor volume (B), and tumor weight (C) of the mouse xenograft model after injection of MCF-7 cells stably transfected with LINC01140-OE/empty vector. **P < 0.01 vs empty vector using Student’s t test. The data are presented as the mean ± SD. LINC01140-OE, LINC01140 overexpression vector.
LINC01140 Binds to miR-200b-3p
The miRNAs binding to LINC01140 were predicted using StarBase, whereas the upregulated miRNAs in BC samples were screened from two miRNA microarrays (GSE113740 and GSE143564) with adj. P < 0.05 and logFC > 2. As shown in Fig. 4A, only one miRNA, miR-200b-3p, overlapped with the StarBase, GSE113740, and GSE143564. StarBase revealed a latent LINC01140-miR-200b-3p binding site (Fig. 4B). Luciferase reporter experiments revealed that MDA-MB-231 and MCF-7 cells harboring the LINC01140-WT and miR-200b-3p mimic combination had slightly lower luciferase activity than those transfected with the LINC01140-WT and mimic-NC combination. Furthermore, the luciferase activities induced by LINC01140-MUT + miR-200b-3p mimic and LINC01140-MUT + mimic-NC co-transfection exhibited no obvious changes (Fig. 4C). The results of RIP experiments indicated that LINC01140 and miR-200b-3p were more easily enriched with Ago2 antibodies than with IgG antibodies (Fig. 4D). Relative to their respective controls, higher miR-200b-3p levels were detected in BC cell lines (Fig. 4E) and tumors (Fig. 4F). In addition, as illustrated in Fig. 4G, a strong inverse association was observed between LINC01140 and miR-200b-3p expression in BC samples. These results indicated that LINC01140 directly targets miR-200b-3p in BC.
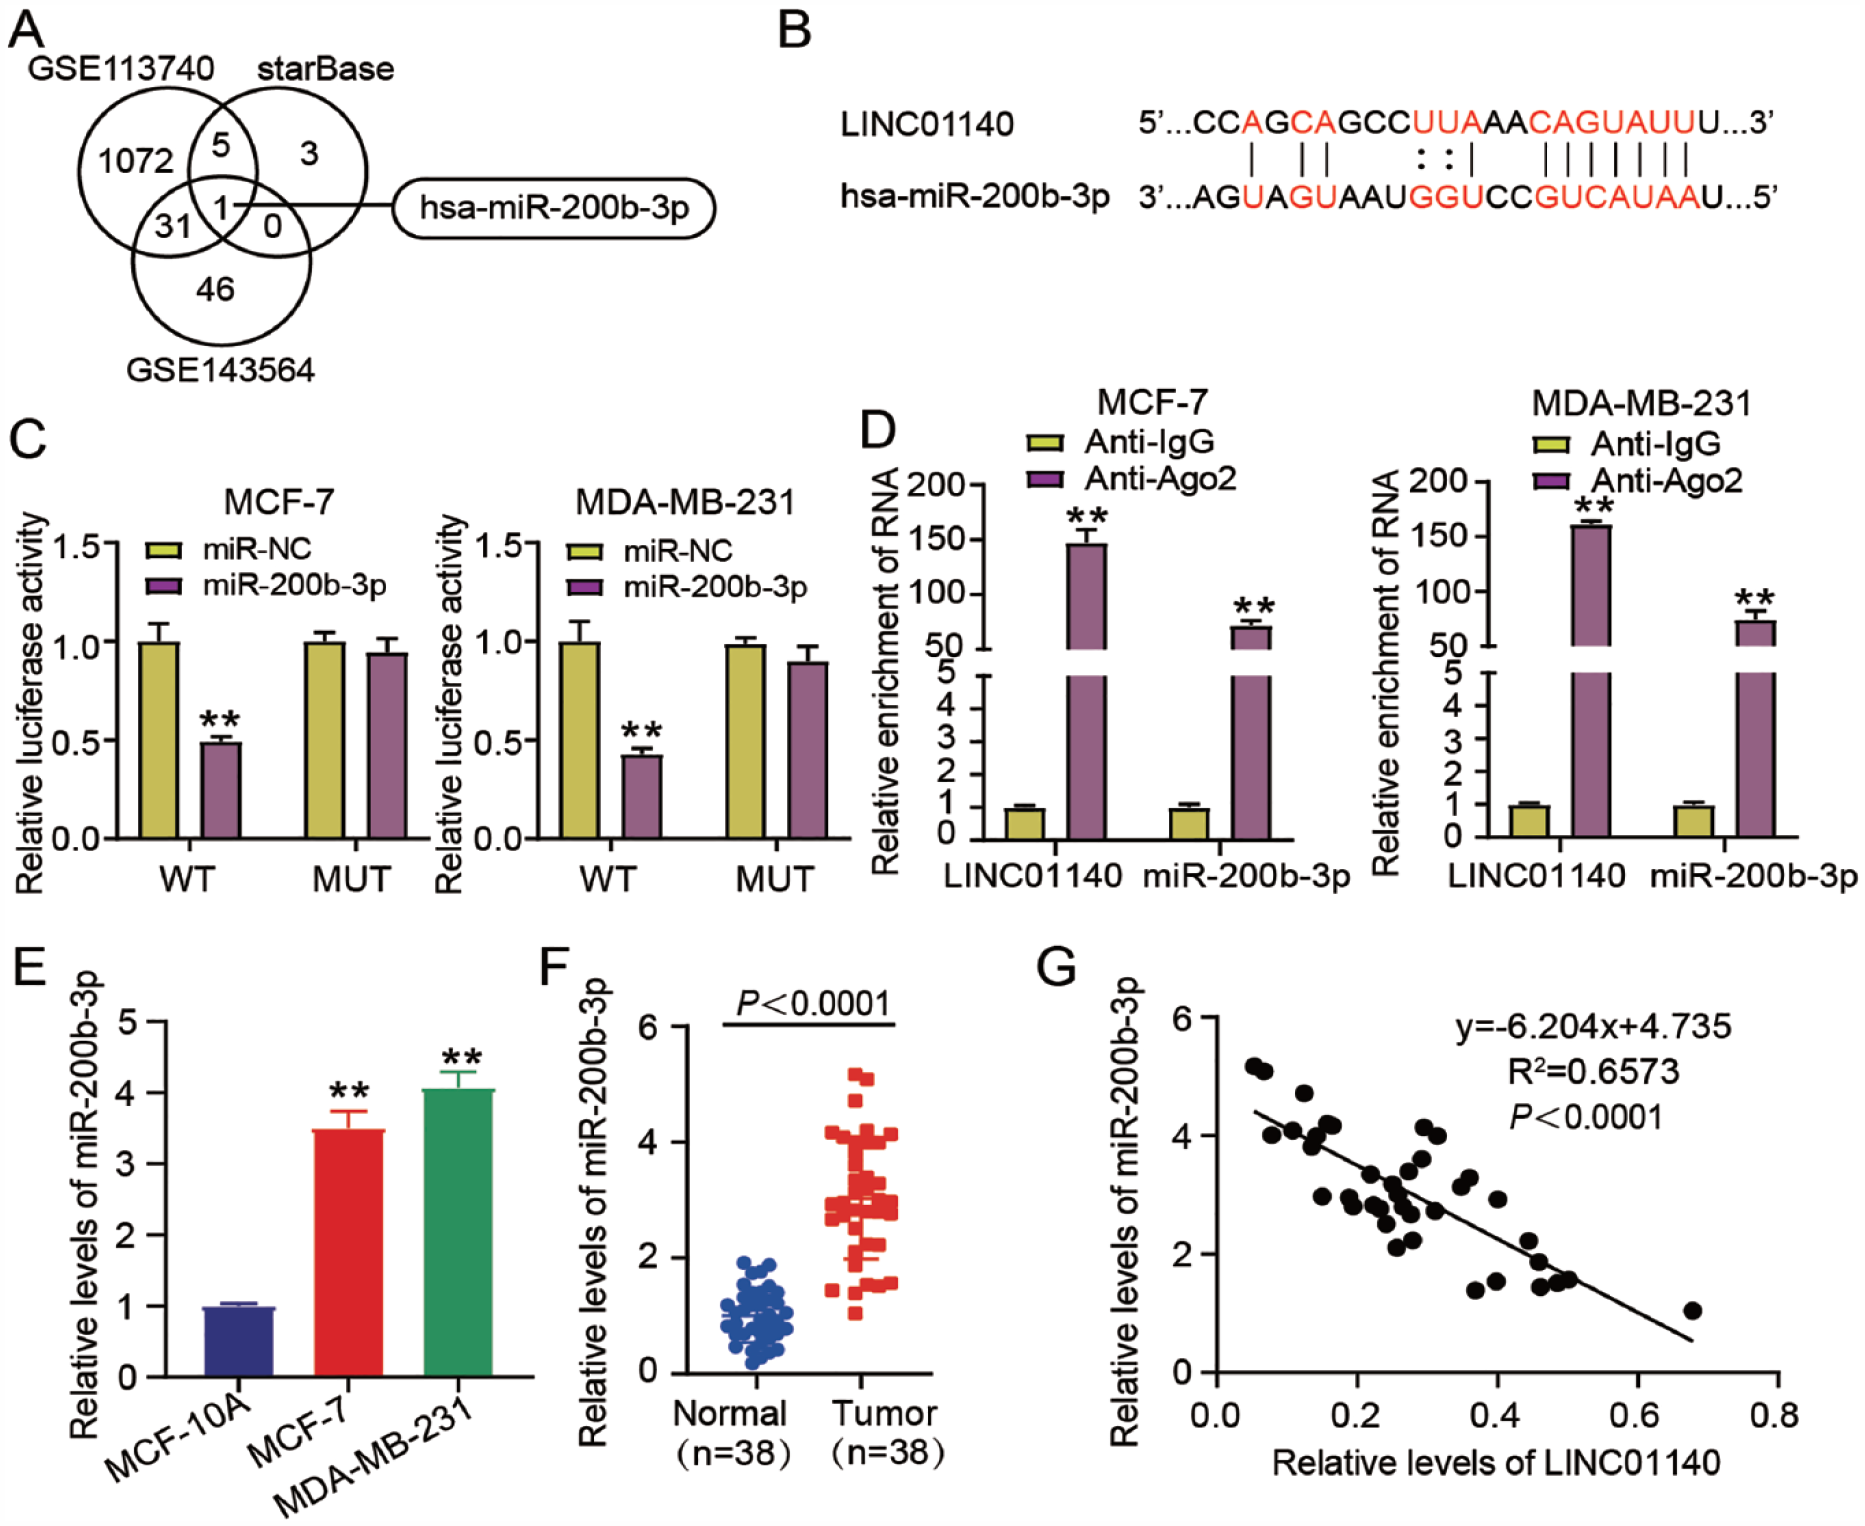
LINC01140 binds to miR-200b-3p. (A) miR-200b-3p was overlapped from two miRNA microarrays (GSE113740 and GSE143564) and StarBase. Two miRNA microarrays from GEO Datasets were used to screen the upregulated miRNAs in BC with adj. P < 0.05 and logFC > 2. An online tool StarBase was used to predict the miRNAs binding to LINC01140. (B) StarBase predicted LINC01140–miR-200b-3p binding site. (C) Luciferase activities in BC cells with the transfection of pGL3-LINC01140-WT/pGL3-LINC01140-MUT and miR-200b-3p mimic/mimic-NC were estimated through the dual luciferase reporter experiment. WT: LINC01140 wild-type vectors. MUT: LINC01140 mutant vectors. **P < 0.01 vs LINC01140-WT + mimic-NC using ANOVA. (D) RIPA was done to validate the interaction of LINC01140 with miR-200b-3p in BC cells. **P < 0.01 vs Anti-IgG using Student’s t test. (E) The miR-200b-3p levels in normal breast epithelial cells (MCF-10A) cells and BC cells (MDA-MB-231 and MCF-7) were quantified through qRT-PCR. **P < 0.01 vs MCF-10A using ANOVA. (F) The miR-200b-3p levels in paired adjacent normal and BC tissues were gauged through qRT-PCR. P < 0.0001 vs normal using Student’s t test. (G) The correlation of LINC01140 expression in BC tissues with that of miR-200b-3p was ascertained by the Pearson correlation coefficient. The data are presented as the mean ± SD. GSE: gene set enrichment analysis; GEO: Gene Expression Omnibus data base; BC: breast cancer; ANOVA: analysis of variance; RIP: Radioimmunoprecipitation assay; NC: negative control; qRT-PCR: quantitative real-time polymerase chain reaction.
LINC01140 Overexpression Prohibits BC Development In Vitro by Regulating miR-200b-3p
MiR-200b-3p mimic and mimic-NC were transfected into BC cells. We observed that miR-200b-3p expression was upregulated upon transfection with the miR-200b-3p mimic, but was suppressed following the transfection of LINC01140-OE (Fig. 5A). This suppressive effect was partially attenuated by transfection with a miR-200b-3p mimic. MiR-200b-3p upregulation enhanced the viability of MDA-MB-231and MCF-7 cells (Fig. 5B), and the miR-200b-3p mimic boosted the migration and invasion of cells (Fig. 5C, D) as well as the formation of cell colonies (Fig. 5E), however, it decreased apoptosis (Fig. 5F). More crucially, we found that miR-200b-3p mimic transfection attenuated the repressive influence of LINC01140 overexpression on the proliferative, migratory, and invasive abilities of BC cells, and the promotive influence of LINC01140 overexpression on BC cell apoptosis (Fig. 5B–F). As indicated above, the interaction between miR-200b-3p and LINC01140 during BC malignancy was confirmed.

LINC01140 overexpression prohibits the development of BC in vitro by regulating miR-200b-3p. (A) MiR-200b-3p levels in MCF-7 and MDA-MB-231 cells with the transfection of mimic-NC, LINC01140-OE, miR-200b-3p mimic, OE + mimic, or empty vector were assessed via qRT-PCR. (B) The viability of the BC cells transfected with the above plasmids was evaluated by means of CCK-8 test. (C) Cell migration rate in the BC cells with the transfection of above plasmids was assessed by scratch experiment. Scale bar: 100 μm. (D) The number of invasive BC cells with the above plasmids transfection was detected by transwell experiment. Scale bar: 50 μm. (E) The colony number of BC cells transfected with the above plasmids were determined in the colony formation assays. (F) Cell apoptosis rate in BC cells transfected with the above plasmids was detected by flow cytometry. *P < 0.05, **P < 0.01 vs empty vector using ANOVA. #P < 0.05, ##P < 0.01 vs mimic-NC using ANOVA. &P < 0.05, &&P < 0.01 vs OE + mimic using ANOVA. The data are presented as the mean ± SD. LINC01140-OE, LINC01140 overexpression vector. mimic, miR-200b-3p mimic. OE + mimic, co-transfection of LINC01140 overexpression vector and miR-200b-3p mimic. BC: breast cancer; NC: negative control; CCK: Cell Counting Kit; ANOVA: analysis of variance; OE: overexpressing; qRT-PCR: quantitative real-time polymerase chain reaction.
MiR-200b-3p Targets DMD
The target genes of miR-200b-3p were predicted using StarBase, whereas the downregulated genes in BC were screened using two mRNA microarrays (GSE139038 and GSE124646) with adj. P < 0.05, and logFC < –2. The results showed that 25 genes overlapped with those in StarBase, GSE139038, and GSE124646 (Fig. 6A). The expression of these 25 genes in TCGA-BC samples is shown in Fig. 6B; five genes (TGFBR3, MME, ADH1B, FHL1, and DMD) with low expression levels in BC samples attracted our attention. In our collected clinical samples, the qRT-PCR results showed that DMD was significantly downregulated in BC tissues (P < 0.0001; Fig. 6C). The miR-200b-3p–DMD binding site was identified using StarBase (Fig. 6D), which suggested a potential targeting relationship between the two. As shown in Fig. 6E, a pronounced reduction in luciferase activity was observed in the DMD-WT/miR-200b-3p mimic group than that in the DMD-WT/mimic-NC group. Neither group showed any statistically significant changes. The miR-200b-3p and DMD expression levels in BC tissues were negatively correlated (Fig. 6F). Moreover, we detected an obvious decline in DMD levels in BC tumor cells (Fig. 6G), suggesting that DMD is a miR-200b-3p target gene.

MiR-200b-3p further targets DMD. (A) Twenty-five genes were overlapped from two mRNA microarrays (GSE139038 and GSE124646) and StarBase. Two mRNA microarrays from GEO Datasets were used to screen the downregulated mRNAs in BC with adj. P < 0.05 and logFC < –2. An online tool StarBase was used to predict the targeted genes of miR-200b-3p. (B) The expression of 25 genes in TCGA-BC samples. (C) qRT-PCR detected the levels of five genes (TGFBR3, MME, ADH1B, FHL1, and DMD) in BC tissues and paired adjacent normal tissues. P < 0.0001 vs normal using Student’s t test. (D) StarBase predicted miR-200b-3p–DMD binding site. (E) The target relationship between miR-200b-3p and DMD was verified by the dual luciferase reporter experiment in MDA-MB-231 and MCF-7 cells. WT: DMD wild-type vectors. MUT: DMD mutant vectors. **P < 0.01 vs DMD-WT + mimic-NC using ANOVA. (F) The correlation of miR-200b-3p expression in BC tissues with that of DMD was ascertained by the Pearson correlation coefficient. (G) DMD levels in normal breast epithelial cells (MCF-10A) cells and BC cell lines (MCF-7 and MDA-MB-231) were estimated via qRT-PCR. **P < 0.01 vs MCF-10A using ANOVA. The data are presented as the mean ± SD. DMD: dystrophin; GSE: gene set enrichment analysis; GEO: Gene Expression Omnibus data base; BC: breast cancer; TCGA: The Cancer Genome Atlas; TGFBR3: transforming growth factor beta receptor 3; MME: membrane metalloendopeptidase; ADH1B: alcohol dehydrogenase 1B (classI), beta polypeptide; FHL1: four and a half LIM domains 1; NC: negative control; ANOVA: analysis of variance; qRT-PCR: quantitative real-time polymerase chain reaction.
MiR-200b-3p Upregulation Accelerates the BC Development by Controlling DMD Expression
DMD-OE cells and empty vectors were transfected into MCF-7 and MDA-MB-231 cells. We then performed Western blotting to measure DMD protein production following transfection. As shown in Fig. 7A, DMD protein levels dramatically increased after the introduction of DMD-OE, but were overtly reduced upon upregulation of miR-200b-3p. Moreover, DMD-OE transfection significantly attenuated the suppressive effect of miR-200b-3p mimic transfection on DMD protein expression. The pronounced increase in DMD levels significantly reduced the viability (Fig. 7B), migratory capacity (Fig. 7C), invasive capacity (Fig. 7D), and colony number (Fig. 7E) of BC cells. However, DMD upregulation induced apoptosis in BC cells (Fig. 7F), and attenuated the potentiating influence of miR-200b-3p upregulation on these cellular processes (Fig. 7B–F). These findings suggest that miR-200b-3p interacts with DMD during BC progression in vitro.

MiR-200b-3p upregulation accelerates the development of BC by controlling DMD expression. (A) The protein levels of DMD in MCF-7 and MDA-MB-231 cells were assessed via Western blotting after transfecting the cells with empty vector, mimic-NC, DMD-OE, miR-200B-3p mimic, or OE + mimic. (B) The viability of MCF-7 and MDA-MB-231 cells harboring empty vector, mimic-NC, DMD-OE, miR-200B-3p mimic, or OE + mimic was evaluated through CCK-8 test. (C) Cell migration rate in MCF-7 and MDA-MB-231 cells transfected with empty vector, mimic-NC, DMD-OE, miR-200B-3p mimic, or OE + mimic was assessed by scratch experiment. Scale bar: 100 μm. (D) The number of invasive MCF-7 and MDA-MB-231 cells transfected with empty vector, mimic-NC, DMD-OE, miR-200B-3p mimic, or OE + mimic was assessed by transwell assay. Scale bar: 50 μm. (E) The colony number of MCF-7 and MDA-MB-231 cells, after their empty vector, mimic-NC, DMD-OE, miR-200B-3p mimic, or OE + mimic transfections were measured by colony formation experiment. (F) Cell apoptosis rate in MCF-7 and MDA-MB-231 cells transfected with empty vector, mimic-NC, DMD-OE, miR-200B-3p mimic, or OE + mimic was detected by flow cytometry. *P < 0.05, **P < 0.01 vs empty vector using ANOVA. #P < 0.05, ##P < 0.01 vs mimic-NC using ANOVA. &P < 0.05, &&P < 0.01 vs OE + mimic using ANOVA. The data are presented as the mean ± SD. DMD-OE, DMD overexpression vector. mimic, miR-200b-3p mimic. OE + mimic, co-transfection of DMD overexpression vector and miR-200b-3p mimic. DMD: dystrophin; NC: negative control; BC: breast cancer; OE: overexrepssion; CCK: Cell Counting Kit; ANOVA: analysis of variance.
Discussion
The onset of BC is generally insidious, until the advanced stage accompanied by metastasis 36 . Metastasis severely restricts therapeutic efficiency and contributes to the high mortality of BC patients at an advanced stage37–39. Currently, molecular targeted therapies with fewer side effects and less toxicity in cancer patients can retard the proliferative and metastatic potential of neoplastic cells40,41, and this phenomenon has attracted the attention of many researchers. In this study, we confirmed the downregulation of LINC01140 and DMD as well as the upregulation of miR-200b-3p in BC. The in vitro and in vivo experiments revealed that LINC01140 hindered BC progression by targeting the miR-200b-3p–DMD axis. Our findings reveal a novel regulatory mechanism for controlling the development of BC.
Public data from various types of human cancers, including bladder and lung cancers, suggest that LINC01140 has a carcinogenic role. In the tumorigenesis of those cancers, LINC01140 is overexpressed and obviously has potential effects on the proliferative, invasive, and migratory abilities of cancer cells16–18. In the present study, contrary to previous results, a pronounced decrease in LINC01140 expression was observed in BC cells and tissues. This outcome is similar to the findings of Li et al. 19 , who reported low LINC01140 expression in tumor samples from patients with BC Low LINC01140 expression was also observed in the T4 stage and was associated with poor relapse-free survival probability 19 . However, they did not explore the role of LINC01140 in BC development. Our study, however, is the first to explore the function of LINC01140 in BC, using both in vivo and in vitro experiments. The results revealed that the ectopic LINC01140 expression significantly retarded BC development by repressing the migration, invasion, and proliferation, and inducing cell apoptosis in vitro, as well as through the suppression of the growth of tumors in vivo. These findings suggest that LINC01140 acts as a tumor-suppressive lncRNA during BC progression.
Several studies have revealed regulatory roles of miRNAs in BC progression. For example, miR-217-5p sponged by circROBO1 could suppress tumor growth and liver metastasis in BC 25 . miR-34a is sponged by lnc015192 to inhibit BC metastasis 29 . According to published data, the amount of miR-200b-3p is minimal in human cancers, such as colorectal, liver, and esophageal cancers. Pronounced miR-200b-3p downregulation is prone to aggravate the malignant phenotypes of neoplastic cells by promoting mobility and metastasis in cancers42–44. Our results lent credence to an earlier study conducted by Kolacinska et al. 30 , who reported that miR-200b-3p expression in BC cells and tissues was higher than in the respective controls. At the same time, the proliferative and migratory capacities of BC cells dramatically improved upon the upregulation of miR-200b-3p. Thus, miR-200b-3p may play an oncogenic role in BC progression. Recently, Venkatesh et al. 45 have proposed a novel viewpoint on the pathogenesis of BC, namely, the intricate crosstalk between lncRNAs and miRNAs. They revealed that the lncRNA-miRNA axis may have oncogenic or tumor-suppressive effects on BC progression 45 . Considering the influence of LINC01140 and miR-200b-3p on BC tumorigenesis and bioinformatic analysis, we speculated that there is an interplay between them in BC progression. As expected, our results showed that high levels of miR-200b-3p in BC cells attenuated the repressive effects of ectopic LINC01140 expression on BC cell malignancy. Collectively, we believe that the LINC01140–miR-200b-3p axis functions as a tumor suppressor during BC development.
DMD interacts with sarcoglycans and dystroglycans and connects the cytoskeleton to the extracellular matrix; this has been linked to the malignant behavior of cancer cells32,33. Loss of dystroglycan expression and DMD has been implicated in the progression of human cancers, including prostate, colon, and even BCs46,47. In this study, we detected a clear decline in DMD levels in BC cells and tissues. Therefore, we speculated that DMD dysregulation is involved in BC development. Moreover, DMD overexpression limited the migratory, invasive, and proliferative capacities of BC cells but enhanced the apoptotic capacity of BC cells, which was further supported by this assumption. DMD was confirmed as a miR-200b-3p target gene. Emerging research has manifested the importance of the lncRNA–miRNA–mRNA signature in the diagnosis and treatment of BC48,49. Using bioinformatics analysis, we speculated that DMD might be involved in the LINC01140–miR-200b-3p axis to affect BC progression. Interestingly, the data gathered in this study support the idea that enforced DMD expression significantly abated the stimulatory effect of miR-200b-3p upregulation on BC cell malignancy. Therefore, we concluded that LINC01140 protects against BC development by targeting the miR-200b-3p–DMD axis.
Through in vivo and in vitro experiments, this study revealed the function of the LINC01140/miR-200 b-3p/DMD axis in BC cells. However, we have not explored how this axis affects prognosis as all samples were collected in recent years and all patients had a good prognosis. Therefore, the correlation between the LINC01140/miR-200b-3p/DMD axis and prognosis should be explored in the future. In addition, the downstream signaling pathways of DMD are also worth exploring.
Conclusion
Our study revealed that LINC01140 is a cancer-repressive lncRNA in BC. It sponges miR-200b-3p to downregulate DMD expression, thereby hindering BC development. This newly identified regulatory axis may represent a therapeutic target for BC treatment.
Footnotes
Author Contributions
GP and JY conducted the experiments as well as the analysis of data. PS and HL conceived and designed this research. HL and GP acquired the data. JY conducted the data analyses and interpretation. All authors have read and granted their approval to this manuscript.
Availability of Data and Materials
All data that had been produced and/or analyzed in the duration of this research have been appended in this manuscript.
Ethical Approval
The Central Hospital of Wuhan, Tongji Medical College, Huazhong University of Science and Technology (Wuhan, China) (registration number: 院-市卫健委-伦2022(05)) Ethics Committee granted approval to this research. The processing of clinical tissue specimens had been accomplished in precise observance of the ethical standards of the Declaration of Helsinki. Each patient submitted a signed consent form. The Ethics Committee of The Central Hospital of Wuhan, Tongji Medical College, Huazhong University of Science and Technology—Institutional Animal Care and Use Committee authorized this animal experiment, which was accomplished in accordance with the ARRIVE guidelines (registration number: 202203014).
Statement of Human and Animal Rights
The processing of clinical tissue samples is in strict compliance with the ethical standards of the Declaration of Helsinki. All patients signed written informed consent. This animal experiment was conducted in accordance with the ARRIVE guidelines.
Statement of Informed Consent
All patients signed written informed consent.
Consent for Publication
The participants gave their consent for the study to be published.
Declaration of Conflicting Interests
The author(s) declared no potential conflicts of interest with respect to the research, authorship, and/or publication of this article.
Funding
The author(s) disclosed receipt of the following financial support for the research, authorship, and/or publication of this article: This work is under the project “Preclinical study on preparation of individualized tumor vaccine by fusion of breast cancer cells with autologous dendritic cells,” which is supported by Health Commission of Hubei Province (General Program) (grant number: WJ2021M009), subordinating to Hai Li. This is also under the project “The molecular mechanism of CIRCHIPK3 targeting STAT3 regulating the proliferation and invasion of breast cancer cells,,” which is supported by Hubei Natural Science Foundation Youth Program (2019CFB124) subordinating to Pengfei Shi.