
Abstract
Background:
We tested the hypothesis that overexpression of cellular-prion-protein in adipose-derived mesenchymal stem cells (PrPCOE-ADMSCs) effectively protected the kidney against ischemia-reperfusion (IR) injury in rat.
Methods:
Part I of cell culture was categorized into A1(ADMSCs)/A2(ADMSCs+p-Cresol)/A3(PrPCOE in ADMSCs)/A4 (PrPCOE in ADMSCs+p-Cresol). Part II of cell culture was divided into B1(ADMSCs)/B2[ADMSCs+lipopolysaccharide (LPS)]/B3(PrPCOE in ADMSCs)/B4(PrPCOE in ADMSCs+LPS). Sprague-Dawley (SD) rats (n = 50) were equally categorized into groups 1 (sham-operated-control)/2 (IR)/3 (IR+ADMSCs/6.0 × 105 equally divided into bilateral-renal arteries and 6.0 × 10⁵ intravenous administration by 1 h after IR)/4 [IR+PrPCOE-ADMSCs (identical dosage administered as group 3)]/5 [IR+silencing PRNP -ADMSCs (identical dosage administered as group 3)], and kidneys were harvested post-day 3 IR injury.
Results:
Part I results demonstrated that the cell viability at 24/48/72 h, BrdU uptake/number of mitDNA/APT concentration/mitochondrial-cytochrome-C+ cells and the protein expressions of ki67/PrPC at 72 h-cell culturing were significantly higher in PrPCOE-ADMSCs than in ADMSCs (all P < 0.001). The protein expressions of oxidative-stress (NOX-1/NOX2/NOX4/oxidized protein)/mitochondrial-damaged (p22-phox/cytosolic-cytochrome-C)/inflammatory (p-NF-κB/IL-1ß/TNF-α/IL-6)/apoptotic (cleaved caspase-3/cleaved-PARP) biomarkers were lowest in A1/A3 and significantly higher in A2 than in A4 (all P < 0.001). Part II result showed that the protein expressions of inflammatory (p-NF-κB/IL-1ß/TNF-α/IL-6)/apoptotic (cleaved caspase-3/cleaved-PARP) biomarkers exhibited an identical pattern of part I among the groups (all P < 0.001). The protein expressions of inflammatory (p-NF-κB/IL-1ß/TNF-α/MMP-9)/oxidative-stress (NOX-1/NOX-2/oxidized-protein)/mitochondrial-damaged (cytosolic-cytochrome-C/p22-phox)/apoptotic (cleaved caspase-3/cleaved-PARP/mitochondrial-Bx)/autophagic (beclin-1/ratio of LC3B-II/LC3B-I)/fibrotic (Smad3/TGF-ß) biomarkers and kidney-injury-score/creatinine level were lowest in group 1, highest in group 2, significantly higher in group 5 than in groups 3/4 (all P < 0.0001).
Conclusion:
PrPCOE in ADMSCs rejuvenated these cells and played a cardinal role on protecting the kidney against IR injury.
Keywords
Introduction
Acute kidney injury (AKI) which is very popularly identified in hospitalization victims with various disease entities for administration comprises a group of clinical syndromes that essentially display as a quickly drop in kidney function associated with the accumulated metabolic wastes, electrolyte imbalance, fluid overload and acidic pH value1,2. Studies have previously revealed that in the United States about 17 million hospitalizations per year are thorny by AKI, resulting in increased costs to the medical-care organization 1 .
Abundantly accumulating data have clearly elucidated that the causal etiology of AKI is multifactorial3–8. Acute kidney ischemia–reperfusion (IR) injury, particularly is not only a popular etiology of AKI, but it is still a serious medical care issue with an unacceptable highly in-hospital morbidity and mortality rates3,6,9,10 and an increase in risk of chronic kidney disease (CKD) and high long-term mortality3,11–14 despite of the current advanced pharmacological management and renal replacement therapy. This situation, therefore, warrants to develop an alternative modality for improving the kidney function and in-hospital and long-term outcomes after AKI15–17.
The mechanistic basis of acute IR detriment of organs, that is, comprising of the kidney organ, resulting from different disease entities, has been well recognized dominantly resulted in the rapid blast of reactive oxygen species (ROS)18–20, critically inflammatory response, 17 and mitochondrial damage 17 during reperfusion of ischemic tissues/organs that ultimately draws forth an even more ROS production. Furthermore, the tissue injury via activating the vicious cycles of increased production of ROS, seriously inflammatory reaction, complement activation, inflammatory cell infiltrations in ischemia tissues/organ and augmentation of innate and adaptive immune responses that draw forth mitochondrial dysfunction, cell apoptosis and death, and eventually organ failure1,16–23.
Our previous animal model studies identified that adipose tissue–derived mesenchymal stem cells (ADMSCs) treatment substantially ameliorated IR injury of various organs mainly via suppressing inflammatory reaction, cellular apoptosis, production of oxidative stress and ROS along with vigorously immune-system activation16,24,25. Thus, ADMSCs emerge as an innovative way for improving organ dysfunction and tissue regeneration. However, it is well recognized that the survival period and rate of mesenchymal stem cells (MSCs)/ADMSCs in ischemic zone are usually relatively short and low that is fundamentally due to the accumulating ROS and inflammation in the IR/ischemic zone, resulting in attenuating the benefit of cell therapy on improving the organ function and outcomes in setting of IR injury26,27. These issues raise the need of finding an innovative modality to enhance MSCs/ADMSCs to resist to the hypoxic and harsh environment.
Recently, we have identified that melatonin and valsartan therapy upregulated the expression of cellular prion protein (PrPC) in CKD rodent, resulting in preservation of the residual kidney function in CKD rodent 28 . In addition, another our recent study has shown that overexpression of PrPC in ADMSCs (i.e., PrPCOE-ADMSCs) enhanced the speed of myocardial regeneration in apical balloon syndrome rodent 29 . According to the abovementioned issues25–29, we hypothesized that PrPCOE-ADMSCs could be an alternative new weapon for offering additional benefit on conserving the kidney parenchymal and functional integrity in kidney IR injury.
Materials and Methods
Ethical Statement
All animal procedures were approved by the Institute of Animal Care and Use Committee at Kaohsiung Chang Gung Memorial Hospital (Affidavit of Approval of Animal Use Protocol No. 2020061701) and performed in accordance with the Guide for the Care and Use of Laboratory Animals.
Animals were housed in an Association for Assessment and Accreditation of Laboratory Animal Care International (AAALAC; Frederick, MD, USA)-approved animal facility in our hospital with controlled temperature and light cycles (24°C and 12/12 light cycle).
Preparation of ADMSCs
In this study, the rats in groups 3 to 5 were enrolled for isolation of autologous ADMSCs. The methodologies have been clearly reported by our previous studies16,17. Segregated ADMSCs were cultured in a 100-mm diameter culture plate with 10-mL low-glucose Dulbecco’s Modified Eagle Medium (DMEM) culture medium containing 10% Fetal Bovine Serum (Hyclone) for 14 days. In addition, for in vitro study, additional six rats were utilized for preparation of ADMSCs.
Methodology for ADMSCs Culture and Cell Grouping
To elucidate the effect of overexpression of PrPC in ADMSCs on alleviating the oxidative stress, we proceeded with the Part I of in vitro study and the cells were divided into A1 (ADMSCs only), A2 [ADMSCs + p-Cresol (50μM) for 24 h co-culture], A3 (PrPCOE in ADMSCs, that is, PrPCOE-ADMSCs) and A4 [PrPCOE-ADMSCs+ p-Cresol (50μM) for 24 h co-culture]. In addition, to verify the effect of overexpression of PrPC in ADMSCs on ameliorating the inflammatory reaction induced cell damage, we established the Part II of in vitro study and the cells were classified as B1 (ADMSCs only), B2 [ADMSCs + lipopolysaccharide (LPS) (50 ng/mL) for 24 h co-culture], B3 (PrPCOE-ADMSCs), and B4 [PrPCOE-ADMSCs + LPS (50 ng/mL) for 24 h co-culture].
Methodology of Kidney Ischemia–Reperfusion Injury and Animal Grouping
SD rats (n = 50) were adopted in this study. The methodology for kidney IR damage has been reported in detail in our recent studies 16 . In detail, SD rats were anesthetized by inhalational 2.0% isoflurane for midline laparotomies. The sham control (SC) group received laparotomy merely. Acute IR damage of both kidneys was conducted in acute kidney IR groups by clamping the renal pedicles for 60 min. using non-traumatic vascular clips, followed by reperfusion for 72 h.
In this study, the SD rats (n = 50) were equally assigned into group 1 (SC, i.e., merely opened the abdomen, accompanied by identifying the renal arteries and then closed the skin and muscle layers), group 2 (acute kidney IR, followed by 50 μL of culture medium into the right and left renal arteries), group 3 [ acute kidney IR + ADMSCs (total 1.2 × 10⁶ cells, including 3.0 × 10⁵ cell injection to left and right renal arteries, and 6.0 × 10⁵ by intravenous transfusion at 80 min after IR procedure)], group 4 [acute kidney IRI + PrPCOE-ADMSCs (1.2 × 10⁶ cells to be administered as in group 3)], and group 5 [acute kidney IR + silencing PRNP in ADMSCs (i.e., PRNP SIL-ADMSCs/1.2 × 106 cells to be administered as in group 3)].
By 72 h after IR procedure, all rodents were sacrificed and the kidneys were obtained for individual study, that is, left kidney specimens for immunofluorescent (IF), immunohistochemical (IHC), and H&E staining, whereas the right kidney specimens for Western blot analysis, respectively.
Transfection of ADMSCs With Plasmids for PrPC Expression
The methods were described by our recent report 29 . In detail, the pCS6-PRNP plasmid was purchased from Transomic Technologies. The plasmid transfection process was conducted with Lipofectamine 3000 according to the manufacturer’s instructions with slight modifications. The ADMSCs were replated 24 h prior to transfection at a density of 5 × 10⁵ cells in 4 mL of fresh culture medium in a 6-cm plastic dish. Since PRNP is the gene of PrPC, PRNP was replaced by PrPC to facilitate the early comprehension of this relationship in the present study.
Transfection of ADMSCs With siRNA
Transient transfection of cells with siRNA was conducted with Lipofectamine RNAiMAX (Invitrogen, Life technologies, Carlsbad, CA, USA) basic on the manufacturer’s instructions but with some modifications. Briefly, 1 × 10⁶ cells were seeded to 10-cm plastic dish overnight. For use in transfection, Lipofectamine RNAiMAX was incubated with 100 pmol of siPRNP at room temperature for 15 min.
To Assess the Circulatory Renal Functional Parameters, and Collected 24-h Urine for the Ratio of Urine Protein to Creatinine (RuPr/uCr) at Baseline and at 72 h After Kidney IR Procedure
The methodologies were described in our previous investigations16,22,23. In detail, the circulatory blood was drawn from all SD rats to determine the changes in plasma creatinine and blood urine nitrogen (BUN) levels before and at 72 h after acute kidney IR procedure. Urine in 24 h was collected in all animals prior to and at 72 h after the IR procedure to analyze the RuPr/uCr.
Assessment of the Kidney Injury Score at 72 h After Acute Kidney IR Induction
Histopathologic scoring was analyzed in a blinded fashion according to our previous studies16,22,23. The scoring system reflected the grading of tubular necrosis, loss of brush border, cast formation, and tubular dilatation in 10 randomly chosen, non-overlapping fields (200×) as follows: 0 (none), 1 (≤10%), 2 (11–25%), 3 (26–45%), 4 (46–75%), and 5 (≥76%) 3 .
MTT Cell Viability Examination
Rat-derived ADMSCs growth was analyzed by the MTT assay. About 5 × 10³ cells, that is, including ADMSCs or PrPCOE-ADMSCs in 100 μL of medium were seeded into wells of a 96-well plate. After over-night incubation, the pCS6-PRNP plasmid was transfected to ADMSCs for 24 h. At the interval for MTT assessment, the medium was discarded, and 200 µl MTT reagent was added to the cells for 30 min. After incubation, the purple crystal sediment was dissolved in DMSO and read at 595 nm in an enzyme-linked immunosorbent assay (ELISA) reader. The absorbance value was used to represent the cell viability.
Western Blot Analysis by 72 h After Acute Kidney IR Induction
The procedure and protocol of Western blot analysis have been depicted in our previous reports16,22,23. Briefly, 50 μg of protein extracts were loaded and separated by SDS-PAGE using acrylamide gradients. After electrophoresis, the separated proteins were transferred electrophoretically to a polyvinylidene difluoride (PVDF) membrane (GE, UK). Nonspecific sites were blocked by incubation of the membrane in blocking buffer overnight. The membranes were incubated with the indicated primary antibodies [PrPC (1:1,000, Abcam), NOX1 (1:1,000, Sigma), NOX2 (1:1,000, Sigma), cytosolic (1:2,000, BD) and mitochondrial (1:2,000, BD) cytochrome C, mitochondrial Bax (1:1,000, Abcam), cleaved caspase-3 (1:1,000, Cell Signaling), cleaved- poly (ADP-ribose) polymerase (c-PARP) (1:1,000, Cell Signaling), transforming growth factor beta (TGF-ß) (1:1,000, Abcam), p-Smad3 (1:1,000, Cell Signaling), oxidized protein (1:100, Millipore), p22-phox (1:1,000, Abcam), phosphorylated nuclear factor (p-NF)-κB (1:1,000, Cell Signaling), interleukin (IL)-1ß (1:1,000, Cell Signaling), tumor necrosis factor (TNF)-α (1:1,000, Cell Signaling), IL-6 (1:1,000, Biorbyt), matrix metalloproteinase (MMP)-9 (1:1,000, Abcam), LC3B-II (1: 3000, Abcam), LC3B-I (1: 3000, Abcam), and actin (1:10,000, Chemicon)] for 1 h at room temperature. Horseradish peroxidase-conjugated anti-rabbit immunoglobulin IgG (1:2000, Cell Signaling, Danvers, MA, USA) was used as a secondary antibody for 1-h incubation at room temperature. The washing procedure was repeated eight times within 1 h. Immunoreactive bands were visualized by enhanced chemiluminescence (ECL; Amersham Biosciences, Amersham, UK) and exposed to Biomax L film (Kodak, Rochester, NY, USA). For quantification, ECL signals were digitized using Labwork software (UVP, Waltham, MA, USA).
Note that in this study, we applied six animals per group for each experiment, indicating six sets of samples were prepared for each Western blotting. In each set of samples, we utilized the antibody against β-actin for loading control and normalization. Therefore, if the presented pictures of Western blotting against different proteins were derived from the same set of samples, the image of actin for normalization should be the same one.
Statistical Analyses
Quantitatively continuous data are expressed as mean ± standard deviation. Statistical analysis was conducted for continuous variables among groups by one-way analysis of variance (ANOVA), followed by Bonferroni multiple-comparison post hoc test for the between-group comparison. All analyses were conducted using SAS statistical software for Windows version 8.2. A probability value P < 0.05 was considered statistically significant.
Results
Impact of PrPC Overexpression on Cell Proliferation Rate
First, to prove the PrPC gene was successfully overexpressed in ADMSCs, the protein analysis was performed (Fig. 1). The result revealed that the protein level of PrPC was remarkably upregulated in PrPCOE-ADMSCs than in ADMSCs merely.

Impact of PrPC overexpression (PrPCOE) on the time courses of cell proliferation rate. (A–B) Protein expression of PrPC, * vs †, P < 0.0001. (C) 3-(4,5-Dimethylthiazol-2-yl)-2,5-diphenyltetrazolium bromide (MTT) assay of cell viability at 24 h, * vs †, P < 0.0001. (D) MTT assay of cell viability at 48 h, * vs †, P < 0.0001. (E) MTT assay of cell viability at 72 h, * vs †, P < 0.0001. n = 6 for each group. (F–G) Illustrating the microscopic finding (400×) of immunohistochemical stain for identification of BrdU up-take by the ADMSCs (gray color). Scale bar in right lower corner represents 20 µm. (H) * vs †, P < 0.001. n = 3 for each group. (I–J) Protein expression of ki67, * vs †, P < 0.001. n = 3 for each group. ADMSCs: adipose tissue-derived mesenchymal stem cells; PrPCOE-ADMSCs: cellular prion protein overexpression in ADMSCs.
To verify whether overexpression of PrPC would enhance cell proliferation/growth rate, the MTT assay, IHC stain and Western blot analysis were utilized for assessment. The result of MTT assay exhibited that the cell proliferation rate at the time points of 24, 48, and 72 h were substantially higher in PrPCOE-ADMSCs group than in ADMSCs group. In addition, the microscopic finding of 72 h cell culture revealed that the BrdU uptake was markedly upregulated in PrPCOE-ADMSCs group than in ADMSCs group. Furthermore, the protein level of Ki67, a biomarker of cell proliferation, also revealed a similar manner of MTT assay. In this way, the results of our in vitro studies suggested that overexpression of PrPC could upregulate the cell proliferation and growth.
Impact of PrPC Overexpression on Enhancing Mitochondrial Expression in the Cells
To elucidate whether PrPC overexpression could also upregulate the mitochondrial expression in the cells, qPCR, ELISA kit, and the IF microscope were utilized for the studies (Fig. 2 and Supplementary Table 1). As we expected, the qPCR showed that the relative density of mitDNA and intracellular ATP concentration (i.e., by ELISA) was substantially increased in PrPCOE-ADMSCs group than in ADMSCs group. In addition, IF microscopic finding illustrated that number of mitochondrial-cytochrome-C+ cells was also significantly increased in PrPCOE-ADMSCs group than in the ADMSCs group. Our results implicated that overexpression of PrPC could upregulate the generation of mitochondria in the ADMSCs that provides adequate energy for cell division, proliferation and growth.

Impact of PrPCOE on enhancing mitochondrial expression in the ADMSCs. (A) Result of the quantitative real-time reverse transcription polymerase chain reaction (qRT-PCR) for identification of relative density of mitDNA (i.e., mitochondrial DNA level), * vs †, P < 0.001. (B) Analytical result of intracellular ATP concentration, * vs †, P < 0.001. n = 3 for each group. (C–F) Illustrating the immunofluorescent (IF) microscopic finding (400×) for identification of mitochondrial cytochrome C+ cells (green-red color) in ADMSCs (upper panel) shown as merge picture. (G–J) Illustrating the IF microscopic finding (400×) for identification of mitochondrial cytochrome C+ cells (green-red color) in PrPCOE-AMDSCs (upper panel) shown as merge picture. Scale bars in right lower corner represent 20 µm. (K) Analytical result of number of mitochondrial cytochrome C+ cells (%) in AMDSCs and in PrPCOE-ADMSCs, * vs †, P < 0.001. n = 4 for each group. (L) Protein expression of PrPC, * vs. other groups with different symbols (†, ‡,§), P < 0.001. (M) Protein expression of Oct4, * vs. †, P < 0.0001. (N) Protein expression of Nanog, * vs. †, P < 0.0001. (O) Protein expression of Sox-2, * vs. †, P < 0.0001. ADMSCs: adipose tissue-derived mesenchymal stem cells; ATP: adenosine triphosphate; DNA: deoxyribonucleic acid; IF: immunofluorescent; PrPCOE-ADMSCs: cellular prion protein overexpression in ADMSCs.
Supplementary Table 1 listed the primer sequences for qPCR, including: Forward primer (5′ to 3′) and Reverse primer (5′ to 3′), respectively.
Impact of PrPC Overexpression on Alleviating p-Cresol Induced Oxidative Stress and Mitochondrial Damage
To verify the issues mentioned in the subhead title, the Western blot examination was utilized and the in vitro study was divided into A1 (ADMSCs only), A2 (ADMSCs + p-Cresol), A3 (PrPCOE-ADMSCs), and A4 (PrPCOE-ADMSCs + p-Cresol) (Fig. 3). The results illustrated that the protein levels of NOX-1, NOX-2, NOX-4 and oxidized protein, four indicators of oxidative stress, were notably lower in A1 and A3 than in A2 and A4 and notably lower in A4 than in A2, but they revealed no significant difference between A1 and A3. In addition, the protein levels of p22phox and cytosolic cytochrome C, two indicators of mitochondrial damage, displayed a similar manner, whereas the protein level of mitochondrial cytochrome C, an index of mitochondrial intact, displayed a reversed manner of oxidative stress within the four groups.

Impact of PrPCOE on alleviating p-Cresol induced oxidative-stress and mitochondrial damage, cellular apoptosis and inflammation. (A) Protein expression of NOX-1, * vs other groups with different symbols (†, ‡), P < 0.001. (B) Protein expression of NOX-2, * vs other groups with different symbols (†, ‡), P < 0.001. (C) Protein expression of NOX-4, * vs other groups with different symbols (†, ‡), P < 0.001. (D) The oxidized protein expression, * vs other groups with different symbols (†, ‡), P < 0.001 (Note: the left and right lanes shown on the upper panel represent protein molecular weight marker and control oxidized molecular protein standard, respectively). (E) Protein expression of p22phox, * vs other groups with different symbols (†, ‡), P < 0.001. (F) Protein expression of cytosolic cytochrome C (cyto CytC), * vs other groups with different symbols (†, ‡), P < 0.001. (G) Protein expression of mitochondrial cytochrome C (mito CytC), * vs other groups with different symbols (†, ‡), P < 0.001. All statistical analyses were performed by one-way ANOVA, followed by Bonferroni multiple comparison post hoc test (n = 3 for each group). Symbols (*, †, ‡) indicate significance for each other (at 0.05 level). ADMSCs: adipose tissue-derived mesenchymal stem cells; ANOVA: analysis of variance; DNP: 1–3 dinitrophenylhydrazone; M.W.: molecular weight; PrPC-OE-ADMSCs: cellular prion protein overexpression in ADMSCs.
Impact of PrPC Overexpression on Attenuating Lipopolysaccharide (LPS) Induced Inflammation and Apoptosis
We wanted to further confirm that whether PrPC overexpression was able to ameliorate the inflammation, the Western blot examination was called up again and the in vitro investigation was grouped into B1 (ADMSCs merely), B2 [ADMSCs + LPS (50 ng/mL for 24 h co-culture)], B3 (PrPCOE-ADMSCs), and B4 [PrPCOE-ADMSCs + LPS (50 ng/mL for 24 h co-culture)] (Fig. 4). The result demonstrated that the protein levels of p-NF-κB, IL-1ß, TNF-α, and IL-6; four indicators of inflammation; and the protein expression of c-caspase 3 and c-PARP, two indices of apoptosis, were remarkably lower in B1 and B3 than in B2 and B4, and remarkably lower in B4 than in B2, but these parameters were similar between B1 and B3. Accordingly, our findings supported our hypothesis.

Impact of PrPC overexpression on ameliorating LPS induced inflammation and apoptosis. (A) Protein expressions of phosphorylated nuclear factor (p-NF)-κB, * vs other groups with different symbols (†, ‡), P < 0.001. (B) Protein expression of IL-6, * vs other groups with different symbols (†, ‡), P < 0.001. (C) Protein expression of poly [adenosine diphosphate-ribose] polymerase (c-PARP), * vs other groups with different symbols (†, ‡), P < 0.001. (D) Protein expression interleukin (IL)-1ß, * vs other groups with different symbols (†, ‡), P < 0.001. (E) Protein expression of tumor necrosis alpha (TNF-α), * vs other groups with different symbols (†, ‡), P < 0.001. (F) Protein expression of cleaved caspase-3 (c-Casp3), * vs other groups with different symbols (†, ‡), P < 0.001. All statistical analyses were performed by one-way ANOVA, followed by Bonferroni multiple comparison post hoc test (n = 3 for each group). Symbols (*, †, ‡) indicate significance for each other (at 0.05 level). ADMSCs: adipose tissue-derived mesenchymal stem cells; ANOVA: analysis of variance; IL: interleukin; LPS: lipopolysaccharide; PrPC-OE-ADMSCs: cellular prion protein overexpression in ADMSCs.
Circulating Levels of Renal Functional Parameters and the RuPr/uCr at Baseline and by 72 h After Acute Kidney IR Procedure
Based on the attractive findings of the in vitro studies, we then conducted an animal model of acute kidney IR and collected the fundamental parameters in detail (Fig. 5). The result of biochemistry examination revealed that the baseline parameters in terms of blood levels of BUN and creatinine and the RuPr/uCr were similar within the groups. However, by 72 h after acute kidney IR performance, these variables were lowest in group 1 (SC), highest in group 2 (IR), remarkably higher in group 5 (IR + PRNP SIL-ADMSCs) than in groups 3 (IR + ADMSCs) and 4 (IR + PrPCOE-ADMSCs), and remarkably higher in group 3 than in group 4.

Circulating levels of BUN and creatinine and the ratio of urine protein to urine creatinine at baseline and by 72 h after acute kidney IR procedure. (A) Circulatory level of blood urine nitrogen (BUN) at baseline, P > 0.5. (B) Circulating level of creatinine at baseline, P > 0.5. (C) The ratio of urine protein to urine creatinine (RuPr/uCr) at baseline, P > 0.5. (D) Circulating level of BUN at 72, * vs other groups with different symbols (†, ‡, §, ¶), P < 0.0001. (E) Circulating level of creatinine at 72 h, * vs other groups with different symbols (†, ‡, §, ¶), P < 0.0001. (F) RuPr/uCr at 72, * vs other groups with different symbols (†, ‡, §, ¶), P < 0.0001. All statistical analyses were performed by one-way ANOVA, followed by Bonferroni multiple comparison post hoc test (n = 8–10 for each group). Symbols (*, †, ‡, §, ¶) indicate significance for each other (at 0.05 level). ADMSCs: adipose tissue-derived mesenchymal stem cells; ANOVA: analysis of variance; IRI: ischemia-reperfusion injury; PRNP SIL-ADMSCs: silencing cellular prion protein in ADMSC; PrPCOE-ADMSCs: overexpression of PrPC in ADMSCs; SC: sham-operated control.
Protein Levels of Inflammatory, Oxidative-Stress and Mitochondrial Damaged Biomarkers in Kidney Tissues by 72 h After Kidney IR Conduction
The protein manifestations of p-NF-κB, IL-1ß, TNF-α and MMP-9, four mediators of inflammation, were lowest in group 1, highest in group 2, remarkably higher in group 5 than in groups 3 and 4, and remarkably higher in group 3 than in group 4 (Fig. 6). In addition, the protein levels of NOX-1, NOX-2, and oxidized-protein, three indicators of oxidative stress, and protein levels of p22phox and cytosolic cytochrome C, two indicators of mitochondrial damage, revealed a similar manner of inflammation within the five groups.

Protein expressions of inflammation and oxidative stress in kidney tissues by 72 h after acute kidney IRI procedure. (A) Protein expression of phosphorylated nuclear factor (p-NF)-κB, * vs other groups with different symbols (†, ‡, §, ¶), P < 0.0001. (B) Protein expression of interleukin (IL)-1ß, * vs other groups with different symbols (†, ‡, §, ¶), P < 0.0001. (C) Protein expression of tumor necrosis factor (TNF)-α, * vs other groups with different symbols (†, ‡, §, ¶), P < 0.0001. (D) Protein expression of matrix metalloproteinase (MMP)-9, * vs other groups with different symbols (†, ‡, §, ¶), P < 0.0001. (E) Protein expression of p22phox, * vs other groups with different symbols (†, ‡, §, ¶), P < 0.001. (F) Protein expression of NOX-1, * vs other groups with different symbols (†, ‡, §, ¶), P < 0.0001. (G) Protein expression of NOX-2, * vs other groups with different symbols (†, ‡, §, ¶), P < 0.0001. (H) Protein expression of cytosolic cytochrome C (cyt-CytoC), * vs other groups with different symbols (†, ‡, §, ¶), P < 0.0001. (I) The oxidized protein expression, * vs other groups with different symbols (†, ‡, §, ¶), P < 0.001 (Note: the left and right lanes shown on the upper panel represent protein molecular weight marker and control oxidized molecular protein standard, respectively). All statistical analyses were performed by one-way ANOVA, followed by Bonferroni multiple comparison post hoc test (n = 6 for each group). Symbols (*, †, ‡, §, ¶) indicate significance for each other (at 0.05 level). ADMSCs: adipose tissue-derived mesenchymal stem cells; DNP: 1–3 dinitrophenylhydrazone; IRI: ischemia-reperfusion injury; M.W.: molecular weight; PRNP SIL-ADMSCs: silencing cellular prion protein in ADMSCs; PrPCOE-ADMSCs: overexpression of PrPC in ADMSCs; SC: sham-operated control.
Protein Levels of Apoptotic, Autophagic, and Fibrotic Biomarkers in Kidney Tissues by 72 h After Kidney IRI Procedure
The protein levels of c-caspase 3, c-PARP and mitochondrial Bax, three mediators of apoptosis, and protein levels of Smad3 and TGF-ß, two mediators of fibrosis, were lowest in group 1, highest in group 2, notably higher in group 5 than in groups 3 and 4, and notably higher in group 3 than in group 4 (Fig. 7). In addition, the protein level of beclin-1 and the ratio of LC3B-II to LC3B-I, two indices of autophagy, exhibited an identical manner of apoptosis within the five groups.
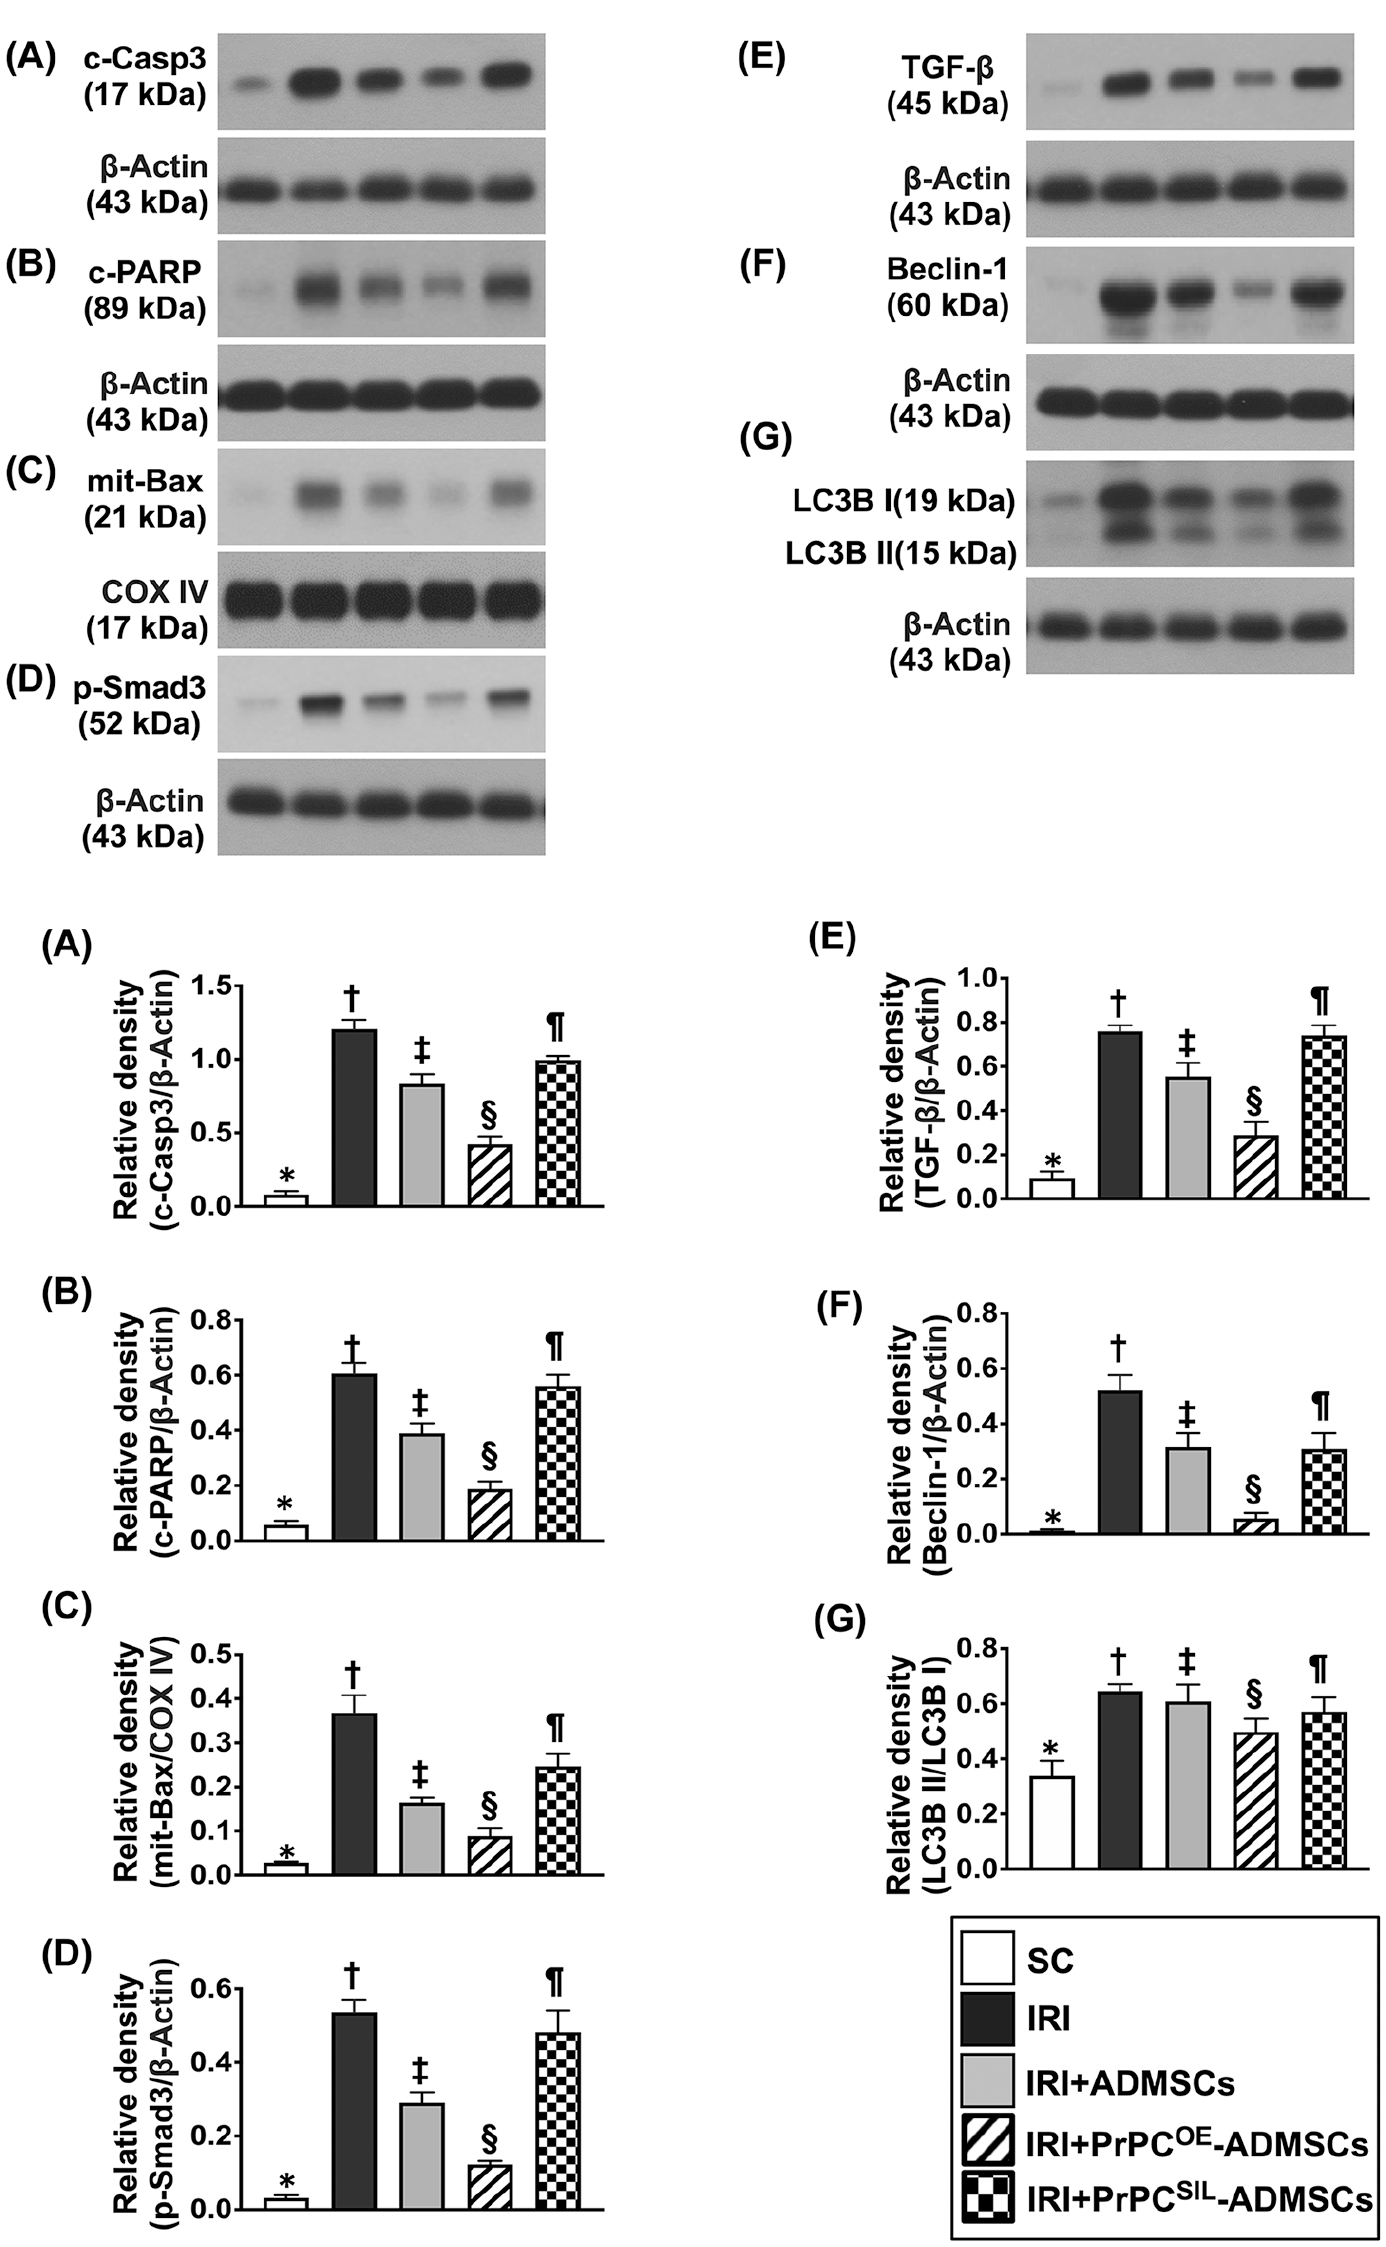
Protein expressions of apoptotic, autophagic, and fibrotic biomarkers in kidney tissues by 72 h after acute kidney IRI procedure. (A) Protein expression of cleaved caspase-3 (c-Casp3), * vs other groups with different symbols (†, ‡, §, ¶), P < 0.0001. (B) Protein expression of poly [adenosine diphosphate-ribose] polymerase (c-PARP) cleaved PARP, * vs other groups with different symbols (†, ‡, §, ¶), P < 0.0001. (C) Protein expression of mitochondrial Bax (mit-Bax) and Cytochrome c oxidase subunit IV, * vs other groups with different symbols (†, ‡, §, ¶), P < 0.0001. (D) Protein expression of phosphorylated (p)-Smad3, * vs other groups with different symbols (†, ‡, §, ¶), P < 0.0001. (E) Protein expression of transforming growth factor (TGF)-ß, * vs other groups with different symbols (†, ‡, §, ¶), P < 0.0001. (F) Protein expression of beclin-1, * vs other groups with different symbols (†, ‡, §, ¶), P < 0.0001. (G) The ratio of LC3B-II to LC3B-I protein expression, * vs other groups with different symbols (†, ‡, §, ¶), P < 0.0001. All statistical analyses were performed by one-way ANOVA, followed by Bonferroni multiple comparison post hoc test (n = 6 for each group). Symbols (*, †, ‡, §, ¶) indicate significance for each other (at 0.05 level). ADMSCs: adipose tissue-derived mesenchymal stem cells; ANOVA: analysis of variance; IRI: ischemia-reperfusion injury; PrPCOE-ADMSCs: overexpression of PrPC in ADMSCs; SC: sham-operated control.
Histopathological Assessment and Cellular Levels of Glomerulus and Renal Tubular Damaged Biomarkers by 72 h After Acute Kidney IR Procedure
After delineating the protein levels of molecular perturbations in acute kidney IR injury, we further investigated the expressions of cellular perturbations in glomerulus and renal tubular microstructures (Figs. 8–10). In this way, we first adopted microscope to clarify the severe degree of kidney parenchymal damage, that is, histopathological findings, in this study. The result revealed that the kidney injury score was lowest in group 1, highest in group 2, significantly higher in group 5 than in groups 3 and 4, and remarkably higher in group 3 than in group 4 (Fig. 8).

Histopathological assessment for kidney injury score by 72 h after acute kidney IR procedure. (A–E) Light microscopic findings (200×; H&E stain) showing remarkably increased loss of brush border in renal tubules (yellow arrows), tubular necrosis (green arrows), tubular dilatation (red asterisk), protein cast formation (black asterisk), and dilatation of Bowman’s capsule (blue arrows) in acute kidney IR group than in other groups. (F) Analytical result of kidney injury score, * vs other group with different symbols (†, ‡, §, ¶), P < 0.0001. Scale bars in right lower corner represent 50 µm. All statistical analyses were performed by one-way ANOVA, followed by Bonferroni multiple comparison post hoc test (n = 6 for each group). Symbols (*, †, ‡, §, ¶) indicate significance for each other (at 0.05 level). ADMSCs: adipose tissue-derived mesenchymal stem cells; ANOVA: analysis of variance; IRI: ischemia-reperfusion injury; PrPCOE-ADMSCs: overexpression of PrPC in ADMSCs; SC: sham-operated control.

Cellular expressions of podocyte component biomarkers by 72 h after acute kidney IR procedure. (A–E) Illustrating the immunofluorescent (IF) microscopic finding (200×) for identification of cellular expression of ZO-1 in glomeruli (green color). (F) Analytical result of the expression of ZO-1, * vs other group with different symbols (†, ‡, §, ¶), P < 0.0001. (G–K) Illustrating the IF microscopic finding (200×) for identification of cellular expression of synaptopodin in glomeruli (green color). (L) Analytical result of the expression of synaptopodin, * vs other group with different symbols (†, ‡, §, ¶), P < 0.0001. Scale bars in right lower corner represent 50 µm. All statistical analyses were performed by one-way ANOVA, followed by Bonferroni multiple comparison post hoc test (n = 7 for each group). Symbols (*, †, ‡, §, ¶) indicate significance for each other (at 0.05 level). ADMSCs: adipose tissue-derived mesenchymal stem cells; ANOVA: analysis of variance; IRI: ischemia-reperfusion injury; PrPCOE-ADMSCs: overexpression of PrPC in ADMSCs; SC: sham-operated control.

Cellular expressions of renal tubular damaged markers by 72 h after acute kidney IR induction. (A–E) Illustrating the immunohistochemical microscopic finding (200×) for identification of the expression of snail in tubular nuclei (gray color). (F) Analytical result of the expression of snail, * vs other group with different symbols (†, ‡, §, ¶), P < 0.0001. (G–K) Illustrating the immunofluorescent microscopic finding (200×) for identification of kidney injury molecule (KIM)-1 in renal tubules (green color). (L) Analytical result of the score expression of KIM-1, * vs other group with different symbols (†, ‡, §, ¶), P < 0.0001. Scale bars in right lower corner represent 50 µm. All statistical analyses were performed by one-way ANOVA, followed by Bonferroni multiple comparison post hoc test (n = 7 for each group). Symbols (*, †, ‡, §, ¶) indicate significance for each other (at 0.05 level). ADMSCs: adipose tissue-derived mesenchymal stem cells; ANOVA: analysis of variance; IRI: ischemia-reperfusion injury; PrPCOE-ADMSCs: overexpression of PrPC in ADMSCs; SC: sham-operated control.
Next, we utilized the IF microscope to evaluate fundamental cellular markers of ZO-1 and synaptopodin, two elements of podocytes, primarily localized in glomeruli. The cellular expressions of these two biomarkers were highest in group 1, lowest in group 2, substantially higher in group 4 than in groups 3 and 5, and notably higher in group 3 than in group 5 (Fig. 9).
Furthermore, microscopic analysis illustrated that the cellular expression of snail, primarily accumulated in the tubular nuclei, and KIM-1, a kidney injury biomarker, dominant exhibition in renal tubules, displayed an opposite manner of ZO-1 among the five groups (Fig. 10).
Oxygen Consumption Rate and Final Destination of the ADMSCs After Administration
In our supplementary data, we provided (1) the histological finding for identification of transfused ADMSCs, PrPCOE-ADMSCs or PRNPSIL-ADMSCs localized in kidney parenchyma and (2) the measurement of oxygen consumption rate (OCR) that reflected ADMSCs energy metabolism, respectively (Supplementary Figs. 1 and 2).
Discussion
This study which scrutinized the therapeutic potential of PrPCOE-ADMSCs on ensuring the functional and architectural intact of kidney against acute IR injury has begotten some noticeably connotations. First, the in vitro study proved that overexpression of PrPC in ADMSCs which was successfully conducted could enhance the cell viability, proliferation, and growth of the culturing ADMSCs. Second, as compared with that of the ADMSCs merely, PrPCOE-ADMSCs expressed notably higher ATP concentration and number of mitochondrial cytochrome C, implying that PrPCOE could rejuvenate the ADMSCs. Third, those of in vitro and in vivo investigations constantly found that overexpression of PrPC in ADMSCs would enhance the ADMSCs to have capacities of downregulating oxidative stress and inflammation. Finally, PrPCOE-ADMSCs were superior to ADMSCs for safeguarding the kidney function and renal parenchyma in setting of acute kidney IRI.
In fact, the idea for this study was derived from the discoveries of our recent two studies that PrPC played a fundamental role on conserving the residual kidney function in setting of CKD 28 and on augmenting the myocardial regeneration in setting of apical ballooning 29 . One cardinal finding in this study was that as compared with the ADMSCs, the PrPCOE-ADMSCs were identified to possess notably higher intracellular ATP concentration and mitochondrial cytochrome, that is, two sources of energy supply. Our findings, could at least in part, explain why the cell viability and cell proliferation/growth rate were notably upregulated in PrPCOE-ADMSCs than in those of ADMSCs only.
It is well recognized that MSCs have capacities of suppressing inflammation and oxidative stress16,17,23–27. The results from our in vitro examination revealed that not only the oxidative stress induced by p-Cresol but also the inflammation induced by LPS induced were remarkably inhibited by ADMSCs treatment. In such a manner, our results coincided with the results from previous investigations16,17,23–27. Of importance was that the in vitro study had even more revealed that PrPCOE-ADMSCs expressed more greater effect than in that of ADMSCs for inhibiting the inflammatory reaction and oxidative stress. Accordingly, our findings reinforcing the findings of the previous studies16,17,23–27.
The paramount finding in this study was that by 72 h after acute kidney IR induction, circulatory levels of BUN and creatinine and the RuPr/uCr (i.e., parameters for estimation of the renal functional impairment) along with the histopathological findings of kidney injury score (parameter for evaluation of the architectural damage) were enormously upregulated in IR group than in those of SC group. However, these parameters were notably reversed in IR animals treated by ADMSCs and further notably reversed in IR animals treated by PrPCOE-ADMSCs. Intriguingly, our previous investigation revealed that valsartan and melatonin treatment enhanced PrPC expression in ADMSCs, resulting in effectively saving the residual kidney function in setting of rodent CKD 28 . In this way, that is, through the manipulation of PrPC gene expression in ADMSCs, the results of this study supported and strengthened the finding of our previous report 28 . Interestingly, when we looked the results from the group 5 (i.e., IR + PRNP SIL-ADMSCs), we found that after silencing the PRNP gene in ADMSCs, the effect of ADMSCs treatment on ensuring the kidney against IR damage was markedly retrieved, once again supported that the PrPC could serve as the foremost role on safeguarding the kidney organ from IR damage.
Link between kidney IR injury and upregulation of inflammation, oxidative stress, cellular apoptosis, and mitochondrial damage has been widely discussed by previous studies16,17,23–27. The paramount findings in this study were that as compared with the SC group, these above-mentioned molecular perturbations along with the autophagic biomarkers were notably upregulated in the IR group. However, these molecular perturbations were significantly inverted in ADMSCs-treated and further significantly inverted in PrPCOE-ADMSCs-treated IR groups that were upregulated by PRNP SIL-ADMSCs treated IR animals. Our findings, in addition to extending the findings from previous investigations16,17,23–27, could, at least in part, account for why the kidney function and microstructures were conserved in IR animals after receiving ADMSCs and PrPCOE-ADMSCs treatments.
Our previous investigation has indicated that the cellular expressions of podocyte components were markedly damaged in acute kidney IR condition, resulting in large leakage of protein from glomeruli into the urine 25 . In addition, the renal tubular damaged markers were substantially augmented in acute kidney IR animals 25 . In this study, we also identified that the podocyte components of ZO-1 and synaptopodin were significantly downregulated, whereas the renal tubular damaged markers of snail and KIM-1 were remarkably upregulated in IR animals. Our findings corroborated with the findings of previous investigations16,17,23–27. Our distinctive finding was that ADMSCs treatment significantly suppressed and PrPCOE-ADMSCs treatment further significantly suppressed the renal tubular damaged markers and preserved the podocyte components in the glomeruli, explaining once more why the proteinuria and creatinine levels were remarkably suppressed among these IR animals.
In conclusion, PrPCOE-ADMSCs treatment offers great benefits on safeguarding the kidney against the IR in rodent through enhancing ATP/mitochondrial homeostasis and rejuvenating the ADMSCs.
Study Limitation
Our study comprised several limitations. First, although the results of the present study were promising, the study period was relative short, that is, merely 72 h. Thus, whether the long-term effects of these therapies remain promising is currently unclear. Second, although extended works were done in this study, the exactly underlying mechanism of these therapeutic regimens is currently not fully clear. Accordingly, we have provided a schematically proposed mechanism (i.e., Fig. 11) based on the results of our study for understanding the benefit of ADMSCs/PrPCOE-ADMSCs treatment on protecting the integrities of kidney parenchyma and renal function against acute kidney IR. Third, we merely measured the levels of proinflammatory cytokines in kidney specimen rather than in circulatory system, implicating that the impact of PrPC on regulating the release of cytokines from the cells to the circulation is currently unclear.

Schematically proposed underlying mechanism of PrPCOE-ADMSCs or ADMSCs treatment on protecting the kidney against IR injury. ADMSCs: adipose tissue-derived mesenchymal stem cells; ATP: adenosine triphosphate; BUN: blood urea nitrogen; DNA: deoxyribonucleic acid; IR: ischemia-reperfusion; KIM-1: kidney injury molecule 1; PrPCOE-DMSCs: overexpression of PrPC in ADMSCs.
Supplemental Material
sj-docx-1-cll-10.1177_09636897231211067 – Supplemental material for Prion Protein Overexpression in Adipose-Derived Mesenchymal Stem Cells (ADMSCs) Effectively Protected Rodent Kidney Against Ischemia-Reperfusion Injury Via Enhancing ATP/Mitochondrial Biogenesis—Role of ADMSC Rejuvenation and Proliferation
Supplemental material, sj-docx-1-cll-10.1177_09636897231211067 for Prion Protein Overexpression in Adipose-Derived Mesenchymal Stem Cells (ADMSCs) Effectively Protected Rodent Kidney Against Ischemia-Reperfusion Injury Via Enhancing ATP/Mitochondrial Biogenesis—Role of ADMSC Rejuvenation and Proliferation by Yen-Ta Chen, Chih-Chao Yang, John Y. Chiang, Pei-Hsun Sung, Pei-Lin Shao, Chi-Ruei Huang, Mel S. Lee and Hon-Kan Yip in Cell Transplantation
Supplemental Material
sj-jpg-2-cll-10.1177_09636897231211067 – Supplemental material for Prion Protein Overexpression in Adipose-Derived Mesenchymal Stem Cells (ADMSCs) Effectively Protected Rodent Kidney Against Ischemia-Reperfusion Injury Via Enhancing ATP/Mitochondrial Biogenesis—Role of ADMSC Rejuvenation and Proliferation
Supplemental material, sj-jpg-2-cll-10.1177_09636897231211067 for Prion Protein Overexpression in Adipose-Derived Mesenchymal Stem Cells (ADMSCs) Effectively Protected Rodent Kidney Against Ischemia-Reperfusion Injury Via Enhancing ATP/Mitochondrial Biogenesis—Role of ADMSC Rejuvenation and Proliferation by Yen-Ta Chen, Chih-Chao Yang, John Y. Chiang, Pei-Hsun Sung, Pei-Lin Shao, Chi-Ruei Huang, Mel S. Lee and Hon-Kan Yip in Cell Transplantation
Supplemental Material
sj-jpg-3-cll-10.1177_09636897231211067 – Supplemental material for Prion Protein Overexpression in Adipose-Derived Mesenchymal Stem Cells (ADMSCs) Effectively Protected Rodent Kidney Against Ischemia-Reperfusion Injury Via Enhancing ATP/Mitochondrial Biogenesis—Role of ADMSC Rejuvenation and Proliferation
Supplemental material, sj-jpg-3-cll-10.1177_09636897231211067 for Prion Protein Overexpression in Adipose-Derived Mesenchymal Stem Cells (ADMSCs) Effectively Protected Rodent Kidney Against Ischemia-Reperfusion Injury Via Enhancing ATP/Mitochondrial Biogenesis—Role of ADMSC Rejuvenation and Proliferation by Yen-Ta Chen, Chih-Chao Yang, John Y. Chiang, Pei-Hsun Sung, Pei-Lin Shao, Chi-Ruei Huang, Mel S. Lee and Hon-Kan Yip in Cell Transplantation
Footnotes
Author Contributions
Y.-T. C., C.-C. Y., and H.-K. Y. designed the study. Y.-T. C., C.-C. Y., P.-H. S., C.-R. H., and H.-K. Y curated data. Y.-T. C., C.-C. Y., P.-L. S., P.-H. S., M.-S. L., and H.-K. Y did formal analysis. Y.-T. C. was responsible for funding acquisition. Y.-T. C., C.-C. Y., P.-L. S., C.-R. H., and P.-H. S., investigated experiments. M.-S. L. and H.-K. Y. administered and supervised the project. Y.-T. C., C.-C. Y., J.-Y. C., and H.-K. Y. wrote the first draft of the manuscript and all named authors contributed in revising the manuscript. Y.-T.C. and C.-C.Y. contributed equally to this work.
Availability of Data and Material
The datasets of present study can be available from the corresponding author upon request.
Ethical Approval
This study was approved by our institutional review board.
Statement of Human and Animal Rights
This article does not contain any studies with human or animal subjects.
Statement of Informed Consent
There are no human subjects in this article and informed consent is not applicable.
Research Ethics and Patient Consent
All animal procedures were approved by the Institute of Animal Care and Use Committee at Kaohsiung Chang Gung Memorial Hospital (Affidavit of Approval of Animal Use Protocol No. 2020061701) and performed in accordance with the Guide for the Care and Use of Laboratory Animals.
Declaration of Conflicting Interests
The author(s) declared no potential conflicts of interest with respect to the research, authorship, and/or publication of this article.
Funding
The author(s) disclosed receipt of the following financial support for the research, authorship, and/or publication of this article: This study was supported by a program grant from Chang Gung Me-morial Hospital, Chang Gung University (CMRPG8K1541).
Supplemental Material
Supplemental material for this article is available online.
References
Supplementary Material
Please find the following supplemental material available below.
For Open Access articles published under a Creative Commons License, all supplemental material carries the same license as the article it is associated with.
For non-Open Access articles published, all supplemental material carries a non-exclusive license, and permission requests for re-use of supplemental material or any part of supplemental material shall be sent directly to the copyright owner as specified in the copyright notice associated with the article.