
Abstract
Autotransfusion refers to a blood transfusion method in which the blood or blood components of the patient are collected under certain conditions, returned to himself when the patient needs surgery or emergency after a series of storing and processing. Although autotransfusion can avoid blood-borne diseases and adverse reactions related to allogeneic blood transfusion, a series of structural and functional changes of erythrocytes will occur during extension of storage time, thus affecting the efficacy of clinical blood transfusion. Our research was aimed to explore the change of erythrocyte oxygen-carrying capacity in different storage time, such as effective oxygen uptake (Q), P50, 2,3-DPG, Na+-K+-ATPase, to detect membrane potential, the change of Ca2+, and reactive oxygen species (ROS) change of erythrocytes. At the same time, Western blot was used to detect the expression of Mitofusin 1 (Mfn1) and Mitofusin 2 (Mfn2) proteins on the cytomembrane, from the perspective of oxidative stress to explore the function change of erythrocytes after different storage time. This study is expected to provide experimental data for further clarifying the functional status of erythrocytes with different preservation time in patients with autotransfusion, achieving accurate infusion of erythrocytes and improving the therapeutic effect of autologous blood transfusion, which has important clinical application value.
Introduction
Blood transfusion is a common treatment in clinical practice, and it is also the most important means to save patients’ lives in case of massive blood loss 1 . However, blood transfusion has potentially dangerous, especially allogeneic blood transfusion, which mainly includes transfusion-related infectious diseases and transfusion-related adverse reactions 2 –4 . Autotransfusion refers to a blood transfusion method in which the blood or blood components of the patient are collected under certain conditions, stored and processed, and then returned to the patient when the patient needs surgery or emergency. Compared with allogeneic blood transfusion, autologous blood transfusion has the advantages of avoiding allogeneic rejection and transfusion-transmitted diseases, avoiding hemolysis, fever and allergic reaction caused by the immune reaction of antibody antigen produced by allogeneic blood transfusion, which greatly increases the safety of blood transfusion and alleviates the contradiction of blood source tension. However, autologous transfusion has its limitations, mainly because it needs to be stored at low temperature after collection in vitro. Some studies have shown that the structural and functional damage of erythrocytes in the process of blood preservation, namely the storage damage, which is the main problem affecting the safety of blood transfusion. At present, the function of 0–28 days erythrocytes in stock is still regarded as equal in clinical practice. This phenomenon ignores the effect of storage time on erythrocyte function and the effect of storage time on blood transfusion treatment 5,6 .
Erythrocyte transfusion is the most important part of blood transfusion, and it is also the blood component with the largest dosage. The main function of erythrocytes is to transport oxygen and carbon dioxide to tissues and organs of the body, which plays a crucial role in maintaining normal physiological functions 7 . The main purpose of transfusion of erythrocytes is to ensure the normal supply of oxygen to the organs and tissues of patients by using their oxygen carrying function, so as to relieve symptoms and save lives. Therefore, it is very important to evaluate the function of red blood cell transfusion. Erythrocytes have a life span of 120 days in vivo, which only 21–42 days in vitro. Erythrocytes are stored at low temperature in vitro. Even in this low-temperature environment, the metabolism of erythrocytes does not stop 8 . Due to the occurrence of erythrocyte storage injury, the number and function of erythrocytes with different storage days are continuously decreasing. The oxygen-carrying capability of erythrocytes is the key to its therapeutic effect. Therefore, it is of great significance to define the change rules of erythrocyte function during the process of the collection of erythrocytes for clinical blood transfusion. It has also be a hot and difficult point in clinical research to establish a more complete evaluation system for erythrocyte function, guide accurate blood transfusion and minimize the adverse reactions related to blood transfusion.
Our research was aimed to explore the change of erythrocyte oxygen-carrying capacity in different storage time. Six case of blood donors were collected as investigated subjects and this study is expected to provide experimental data for further clarifying the functional status of erythrocytes with different preservation time in patients with autotransfusion, achieving accurate infusion of erythrocytes and improving the therapeutic effect of autologous blood transfusion, which has important clinical application value.
Materials and Methods
Six case of blood donors who met the conditions for voluntary blood donation in China. 1 unit of red blood cells (200 mL/U) was collected from each blood donor to prepare suspended erythrocytes. Defoaming agent, DMEM, FBS, Trypsin, PBS were purchased from Themo Fisher. All the other chemicals were purchased from commercial supplier or Innochem. Oxygen, carbon dioxide and nitrogen bottles were purchased from Beijing beipu feilong gas company. 37 °C constant temperature water bath, low-speed automatic balancing centrifuge B120 purchased from American Hyclone Corporation. Add Sampler (Eppendorf, 200 μl, 1000 μl), 2,3-DPG detection kit, Na+-K+-ATP detection kit were purchased from Beyotime Biotechnology Research Institute. Fluorescence emission spectra and full wavelength absorption spectra were performed on Tecan Spark™ 10 M Multimode Microplate Reader. OD values were recorded in a 10 mm path quartz cell on a Metash UV-5100B spectrometer.
Determination of Effective Oxygen- Carrying Capacity (Q) and P50
10 mL blood was prepared suspended erythrocytes come from the 6 donors with a concentration of 3.5×10¹²/L final volume (3 mL). Defoaming agent (20 μL) was added into all tested samples. Simulation of arterial oxygen partial pressure, the test condition was set to: O2 = 16 mL/min, the CO2 = 3 mL/min, N2 = 120 mL/min, flow rate: 100 mL/min, 37 °C to sample inflatable 9 min. Finally, 1 mL of the sample was extracted for blood gas analysis 9 . The charging conditions were adjusted as O2 = 6 mL/min, CO2 = 3 mL/min, N2 = 160 mL/min, and the flow rate was 100 ml/min. Balance for 10 minutes, 37 °C to sample inflatable 6 min. Finally, 1 mL of the sample was also extracted for sexual blood gas analysis. According to the calculation formula of effective oxygen-carrying capacity of erythrocytes, Q = 20 × (S1-S2), the unit was mL. When the oxygen partial pressure rose to 100 mmHg (pulmonary arterial partial oxygen pressure) and stabilized, the oxygen saturation of Hb in the solution was measured and recorded as S1. When the oxygen partial pressure of mixed gas was 40 mmHg (oxygen partial pressure of pulmonary venous blood), the oxygen saturation of Hb was measured and recorded as S2. P50 value was obtained from the blood gas analysis results when the oxygen partial pressure reached 100 mm Hg.
Determination of 2,3-DPG and Na+-K+-ATPase
The whole blood was collected from 6 healthy donors, with each blood sample being 400 mL. The blood was treated by conventional anticoagulant and centrifuged for 10 min at 4 °C with the speed of 3300 rpm/min, then removed the plasma, erythrocyte preserve fluid (CPDA-1) was added into the suspended erythrocytes. Suspended erythrocytes will come from the same patient were divided into five portions, these six samples respectively in the preservation 1, 7, 14, 21, 28 day were detected according to the 2,3-DPG and Na+-K+-ATPase kit instructions 10 .
Observation of Erythrocyte Morphology
Erythrocytes in different storage times were collected and the morphology of erythrocyte was characterized on H7600 TEM (Hitachi, Japan) at 0, 7, 14, 21, 28 days after the storage of erythrocytes.
Membrane Potential Assessment of Erythrocytes
Suspended erythrocytes were resuspended in 0.5 mL JC-1 working liquid after centrifuging under 400 r/min for 5 min, upside down several times, then put into incubator at 37 °C for 20 min with 5% CO2. After 20 min, the cells were washed with pre-ice bath JC-1 buffer. Finally, added the normal medium and observed under the fluorescence microscope. The cells superposition of red fluorescence and green fluorescence could be recorded. The previous treatment was as follows, after encapsulating the probe 20 min, the JC-1 buffer was used to wash off the unloaded fluorescent probe. Finally, the fluorescence intensity was measured by Flow Cytometer 11 .
Determination of Ca2+ in Cytomembrane
Erythrocytes were collected after centrifuging at 1000 r/min for 5 min and washed twice with PBS, and then resuspended in PBS with a concentration of 1 × 10¹⁰ cells/mL 12 . The final concentration of 5 μmol/L Fluo-3/AM Ester and 0.0625% Pluronic F-127 were added into erythrocytes suspension. The mixture was cultured at 37 °C in 5% CO2 incubator for 45 min, and then washed with PBS for twice to remove the excess stain. The superposition of red fluorescence and green fluorescence could be recorded. The previous treatment was as follows, after encapsulating the probe 20 min, the JC-1 buffer was used to wash off the unloaded fluorescent probe. Finally, the fluorescence intensity was measured by Flow Cytometer.
Determination of Reactive Oxygen Species (ROS) in Red Blood Cells
Erythrocytes suspension 200 µL were centrifuged at 2 000 r/min for 5 min to discard supernatant 13 . Erythrocytes were gently washed with two times volume of normal saline, and centrifuged at 2 000 r/min for 5 min to discard supernatant. The erythrocytes were diluted 10 times by adding normal saline. 100 µL diluted cell suspension was centrifuged at 2 000 r/min for 5 min to discard supernatant. Diluted DCFH-DA (1:1 000 physiological saline) 200 µL was added for incubation at 37 °C for 30 min. The mixture was centrifuged at 2000 r/min for 5 min to discard the supernatant. Erythrocytes were washed three times with 200 µL normal saline. The cells were lysed with equal volume RIPA cell lysate liquid. The products of cell lysis were added to the 96-well black detection plate, and the fluorescence value was determined by a fluorescence enzyme standard (excitation wavelength 488 nm, emission wavelength 525 nm). 20 µL cell lysis product was extracted and the hemoglobin content was determined according to the kit instructions. The ROS content in erythrocytes was expressed by the ratio of fluorescence value to hemoglobin value.
Western Blot Assay
Western blot was used to detect the expressions of Mitofusin 1 (Mfn1) and Mitofusin 2 (Mfn2) proteins on the cytomembrane surface. The cells were added into cell lysis buffer, homogenized in an ice bath with a glass homogenizer, and the supernatant was collected by centrifugation, collected protein samples from cells were extracted with RIPA buffer, and a suitable amount of concentrated sodium dodecyl sulfate-polyacrylamide gel electrophoresis (SDS-PAGE) protein buffer solution was added, boiled for 5 min to make the protein denature and cooled down to room temperature. Protein samples were separated by 12% SDS-PAGE and transferred to NC membranes at 200 mA for 90 min. After blocking the membranes at room temperature for 2 h in 5% low-fat milk powder in Tris-buffered saline-Tween 20, the membranes were probed with primary antibodies and incubated at 4°C overnight. All of the primary antibodies were diluted 1:100. After washing, the membranes were incubated with the appropriate horseradish peroxidase-labeled secondary antibodies (diluted 1:8000) for 1 h at room temperature. Bound antibodies were visualized with enhanced chemiluminescence reagents. After a final wash with Tris-buffered saline-Tween 20, multiple images were obtained and the protein bands were quantified by using a Bio-Rad Chemi EQ densitometer and Bio-Rad Quantity One software.
Statistical Analysis
All experiments were replicated independently at least three times. The data were analyzed using one-way analysis of variance (ANOVA) and are presented as the mean ± standard deviation (SD). Statistical significance was defined as P < 0.05.
Results
Determination of Effective Oxygen- Carrying Capacity (Q) and P50
The Q value of oxygen-carrying capacity of erythrocytes in the storage period decreased with the number of days. Effective oxygen-carrying capacity decreased 12.0% after 7 days of storage, 24.0% after 14 days of storage, 31.0% after 21 days of storage, and 43.1% after 28 days of storage.
The oxygen affinity value (P50) of suspended erythrocytes showed a gradually decreasing trend in retention period, P50 significantly decreased in the first 2 weeks, and then the change was not obvious. 3.0% decreased after 7 days of storage; 3.4% decreased after 14 days of storage, the phenomenon was not obvious in the following weeks. The detailed results were shown in Table 1 and Fig. 1. The change of P50 reflected that the oxygen affinity of erythrocytes increased with the increase of preservation time, which was not conducive for hemoglobin to the release oxygen.
Changes of Erythrocyte Oxygen Carrying Capacity at Different Storage Time.
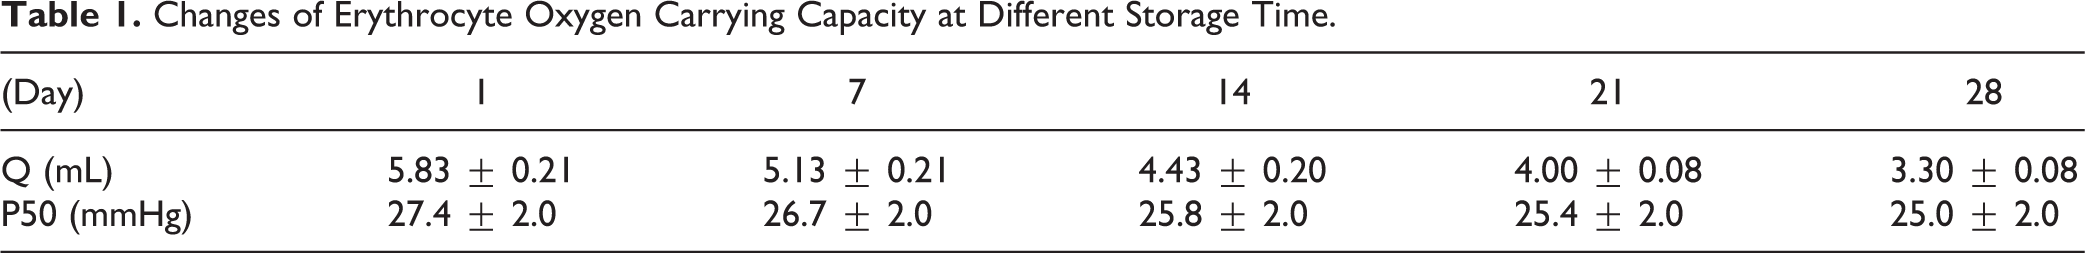
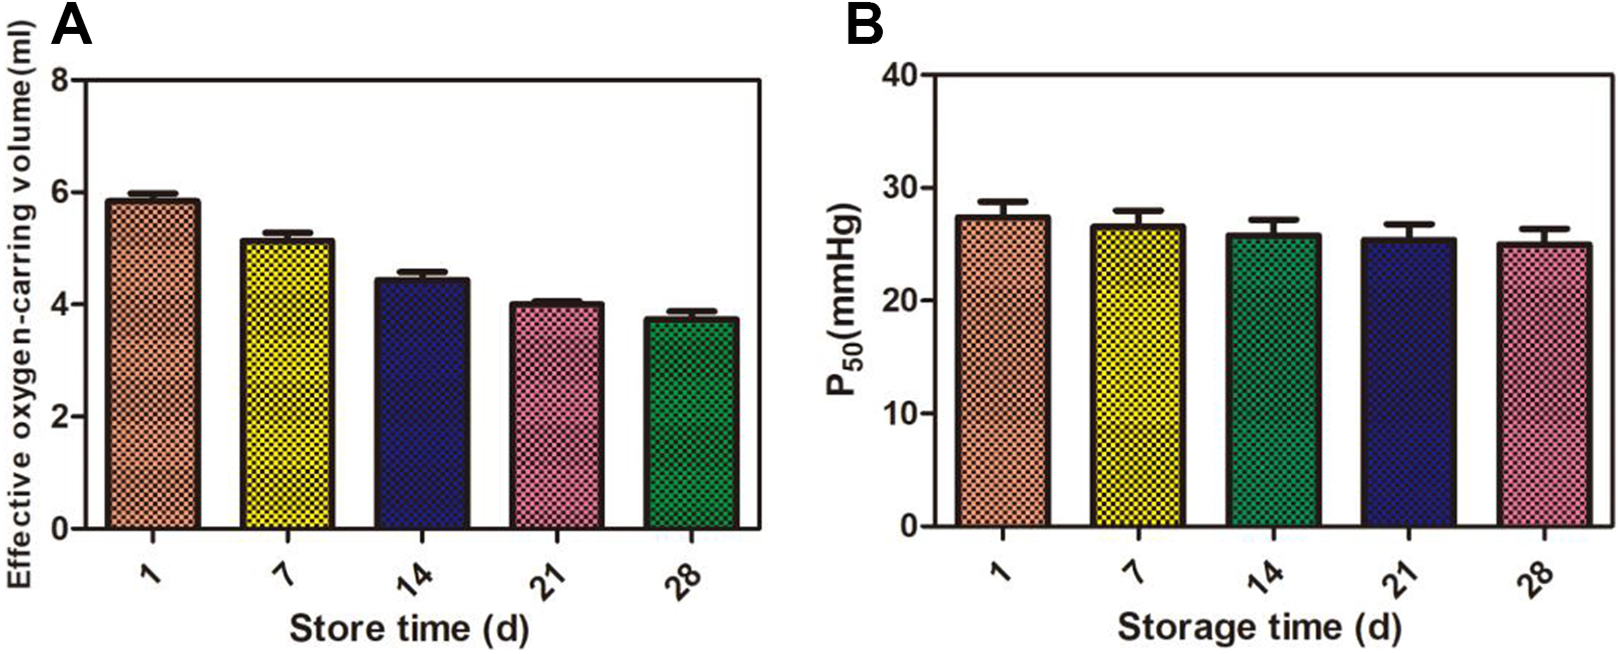
The changes of carrying oxygen capacity in erythrocytes at different store time. (A) Effective oxygen-carrying volume of erythrocytes suspension; (B) P50 (mmHg) in erythrocytes suspension.
2, 3-DPG, Na+-K+-ATP Were Detected and Analyzed Respectively
2,3-DPG decreases gradually with the increase of storage days, and decreased slowly after 21 days, the content of 2,3-DPG rapidly decreased of 25.1%. By the end of storage time, the content of 2,3-DPG was only 52.1% of 1 day erythrocytes. The content of Na+-K+-ATPase decreased gradually with the increase of the number of days in stock. The content of 2,3-DPG rapidly decreased of 46.1 before 7 days, and it come to be slowed down to 27.8%. At the end of storage time, the content of Na+-K+-ATPase decreased of 27.8% compared with 1 day. The detailed results were shown in Table 2 and Fig. 2.
Changes of Erythrocyte Oxygen Carrying Capacity at Different Storage Time.
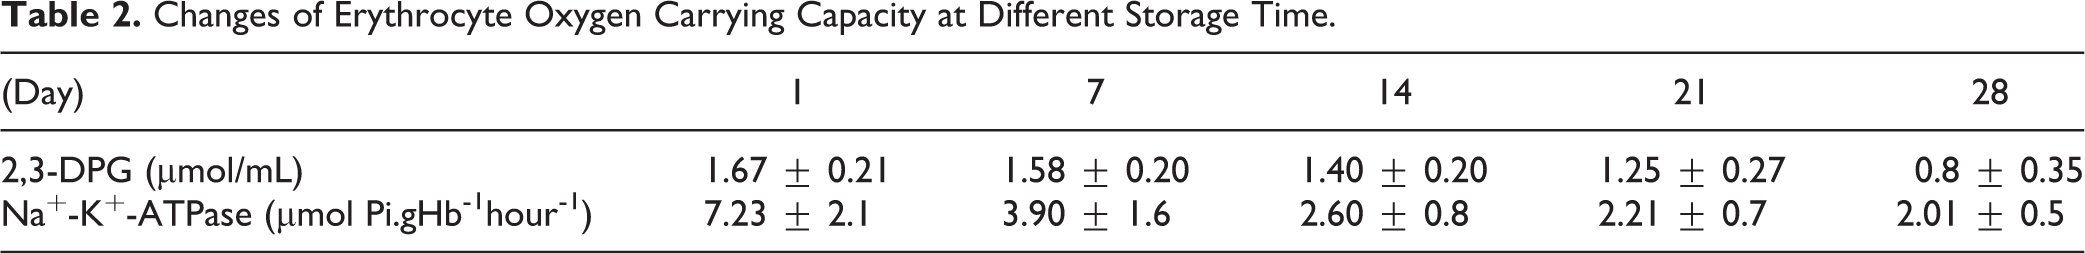
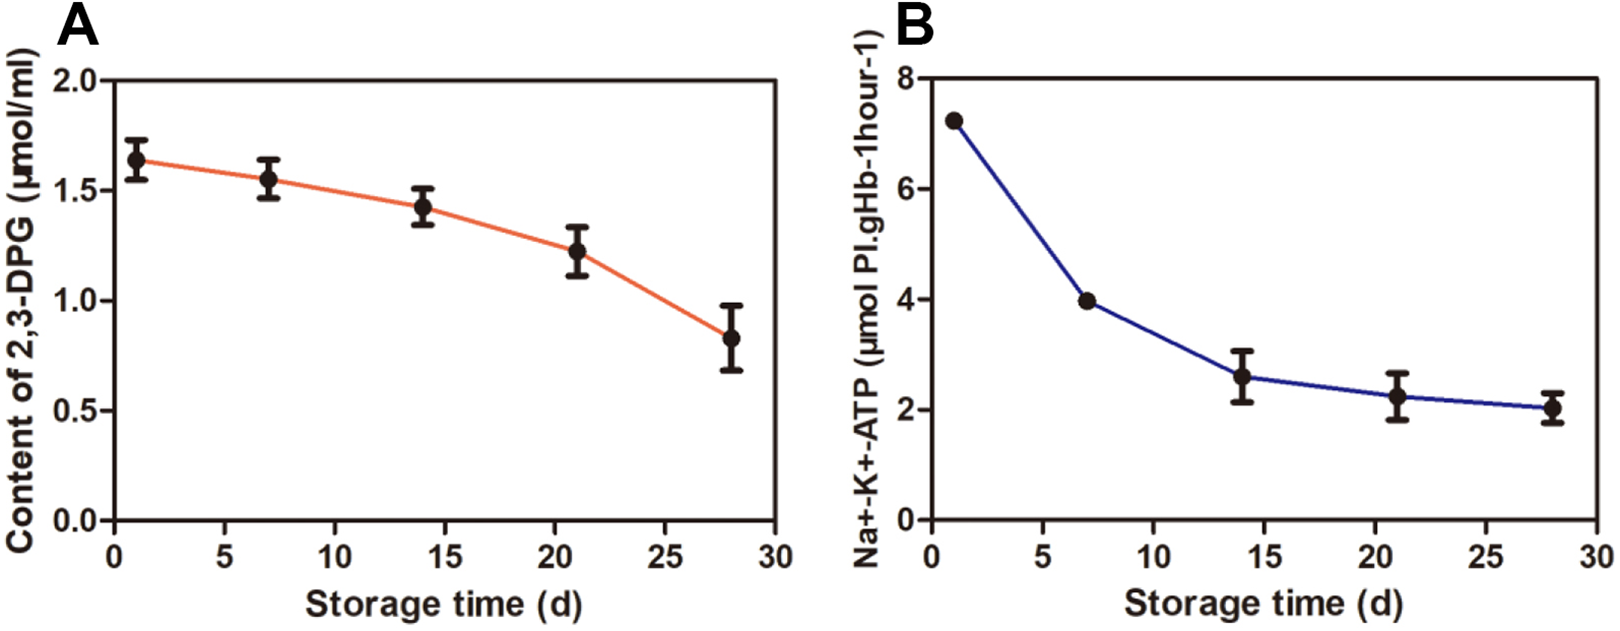
The changes of 2,3-DPG, Na+-K+-ATPase in red blood cells in different storage time. (A): The content of 2, 3-DPG (μmol/mL); (B): The content of Na+-K+-ATP (μmol Pi.gHb-1hour-1/mL).
The Morphology Change of Erythrocyte
The morphology of erythrocyte was observed under an electron microscope after erythrocytes storing for 1, 7, 14, 21, and 28 days, respectively. In the first 2 weeks, the erythrocytes were observed to be elliptical in shape, uniform and shiny, which indicated that the cells were well preserved. However, morphological map of the cells after 21 day showed that the cells were significantly sparse than those before 21 days, and even more sparse and irregular when they were stored until the 28th day. The detailed results were shown in Fig. 3.
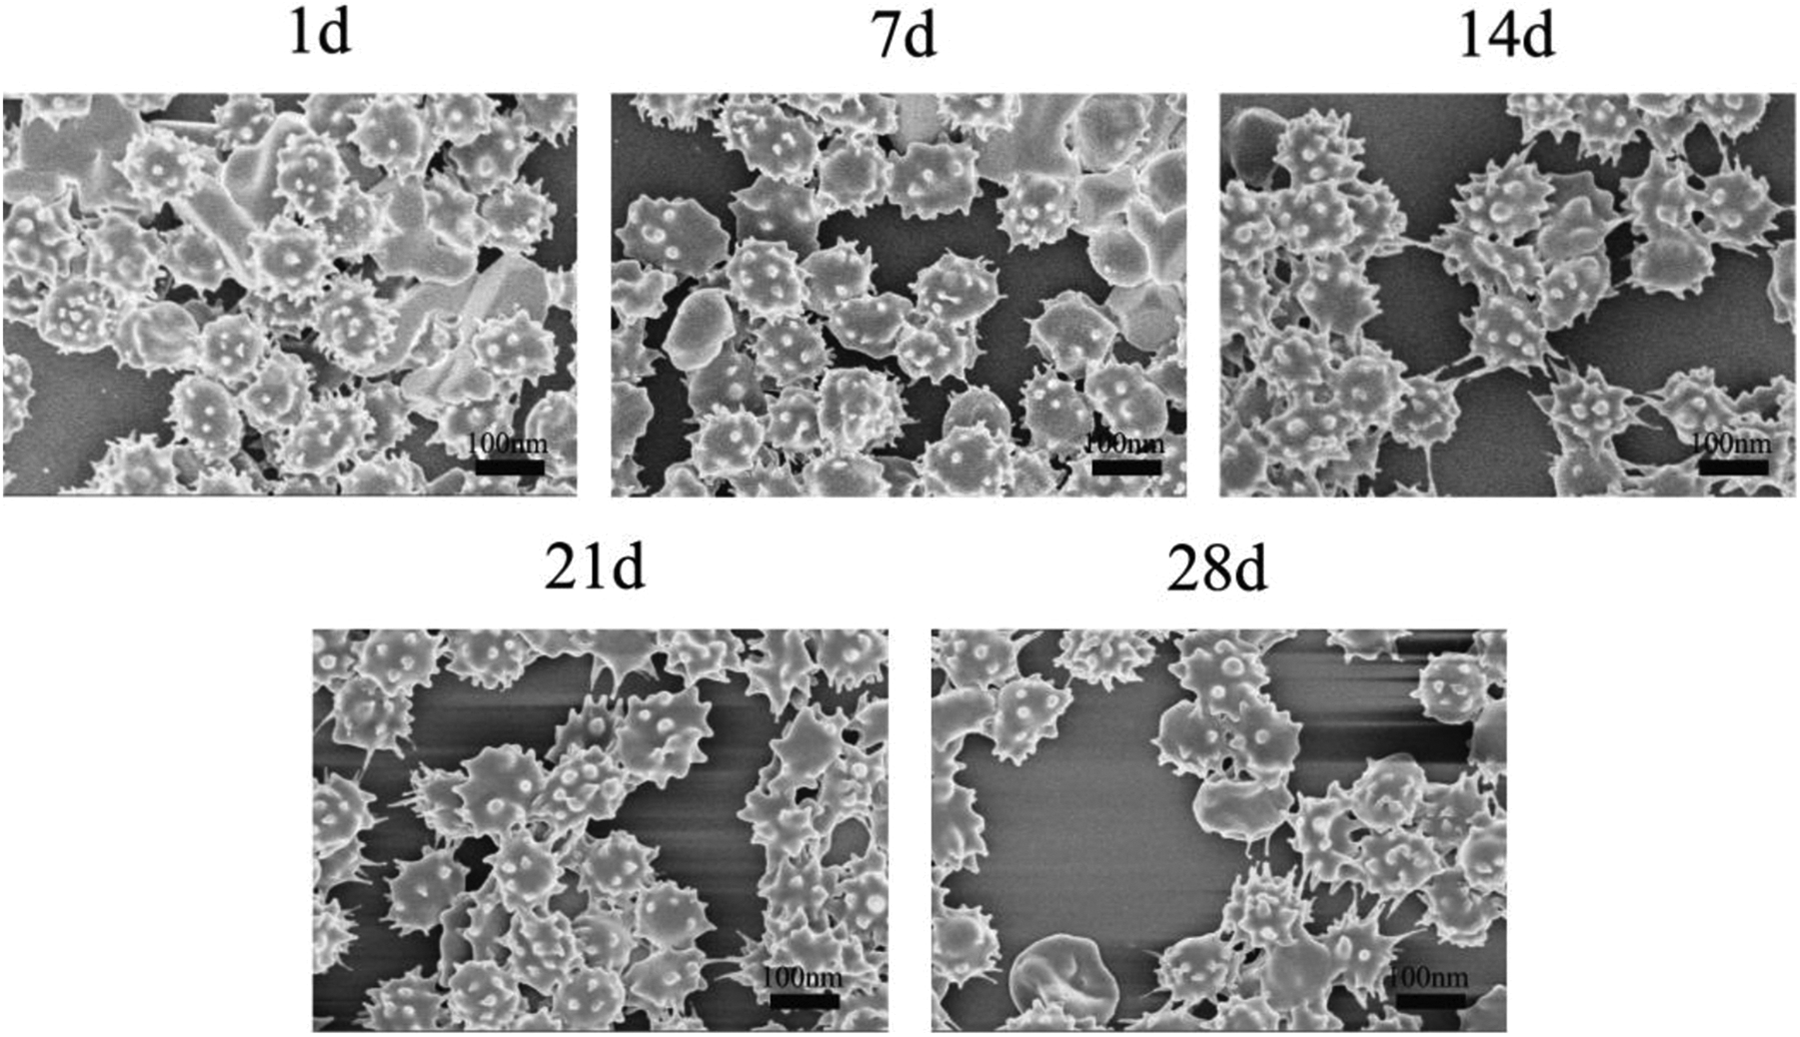
The change of erythrocyte morphological image in different storage time, from the 1 day to 28 day.
Membrane Potential Assessment of Erythrocytes
Cells were collected and stained with JC-1, then detected by flow cytometry. The cells with membrane potential in each group were shown in Fig. 4. 1 day was considered as an experimental control. Compared with the control group, the red fluorescence of JC-1 in cytomembrane of erythrocytes was significantly decreased after 7 days of storage, and the fluorescence intensity was not significantly changed after 14 days and 21 days, while significantly decreased after 28 days of storage.
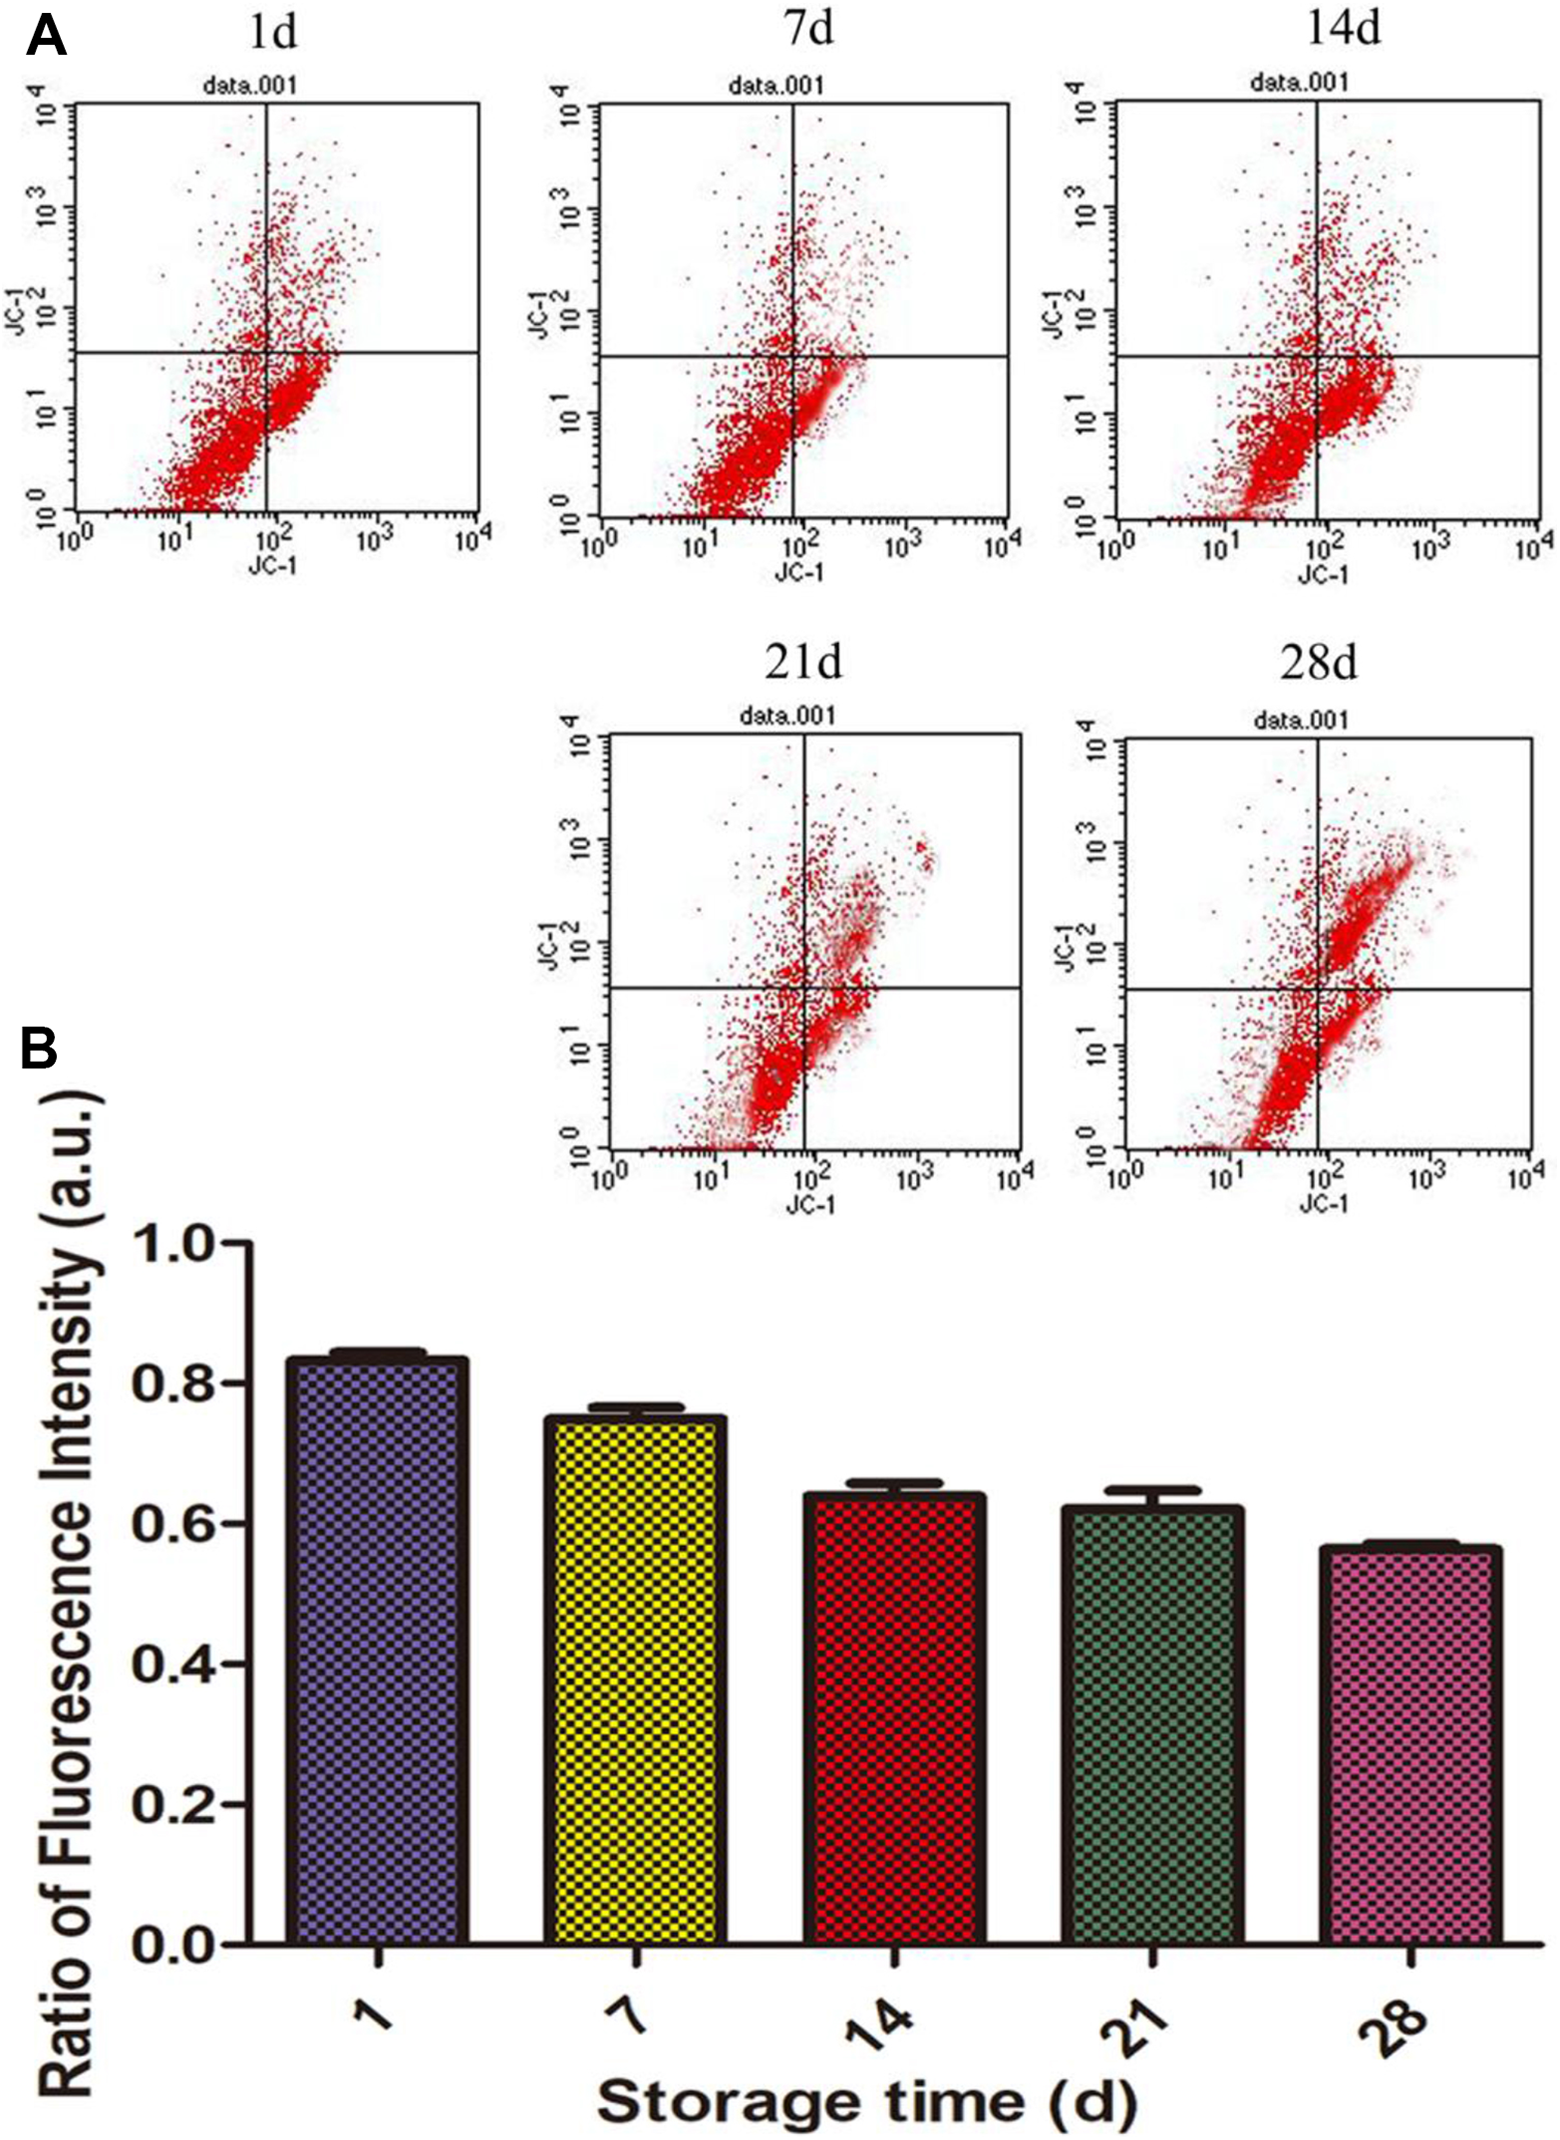
Membrane potential changes of cytomembrane of erythrocytes. (A): membrane potential changes were recorded by fluorescence microscopy; (B): the ratio of low membrane potential cells was recorded by flow cytometry.
Changes of Ca2+ in Mitochondria of Erythrocytes
The changes of Ca2+ in erythrocytes were analyzed by the Ca2+ detection kit. The results were shown in the Fig. 5. The changes of Ca2+ in the first 7 days were not obvious, the fluorescence intensity of Ca2+ was significantly increased in the 14th day. The changes of Ca2+ in erythrocytes were statistically significant at the 21st and 28th days, compared with the 1st, 7th and 14th days, P < 0.05.
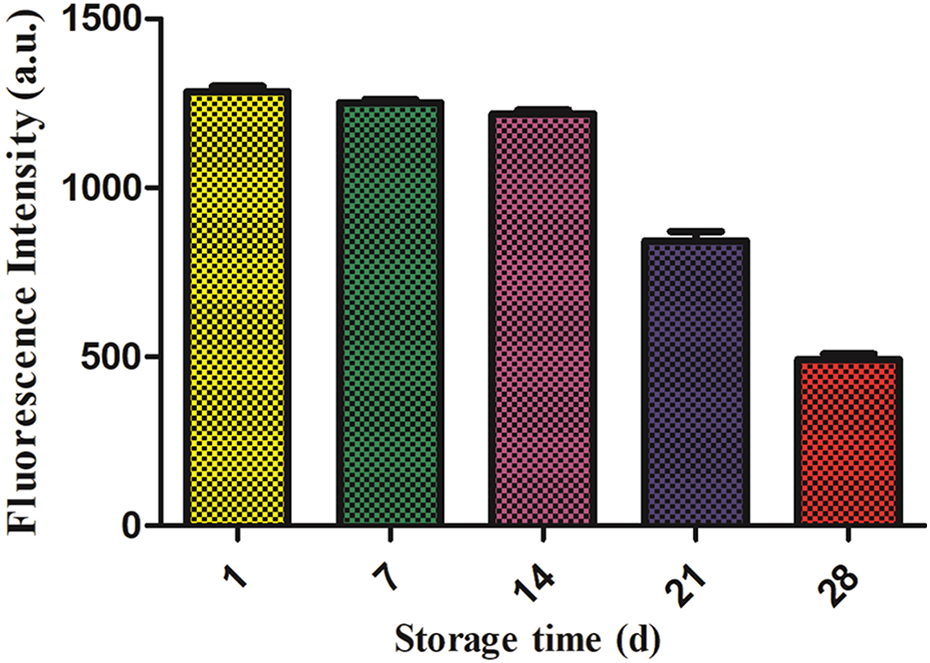
Fluorescence intensity of Ca2+ in mitochondria of red blood cells in different storage time.
Determination of ROS in Mitochondria of Erythrocytes
DCFH-DA fluorescent probe kit was used to detect the content of active oxygen (ROS) in erythrocytes. We have found that there is no or only a small amount of DCF green fluorescent before the storage of 14 days. Which indicated that less reactive oxygen species were produced. While the green fluorescence of DCF were significantly elevated after 14 days. The relative fluorescence intensity in 14 day was 4.5 times compared with the first day (P < 0.05), the relative fluorescence intensity at 21 days was 7.6 times higher than that on the first day, showing a significant difference (P < 0.05), while at 28 days that increased 31.3 times compared with that on the first day, at day 1, showing a significant difference (P < 0.01). The detailed results were shown in Fig. 6.
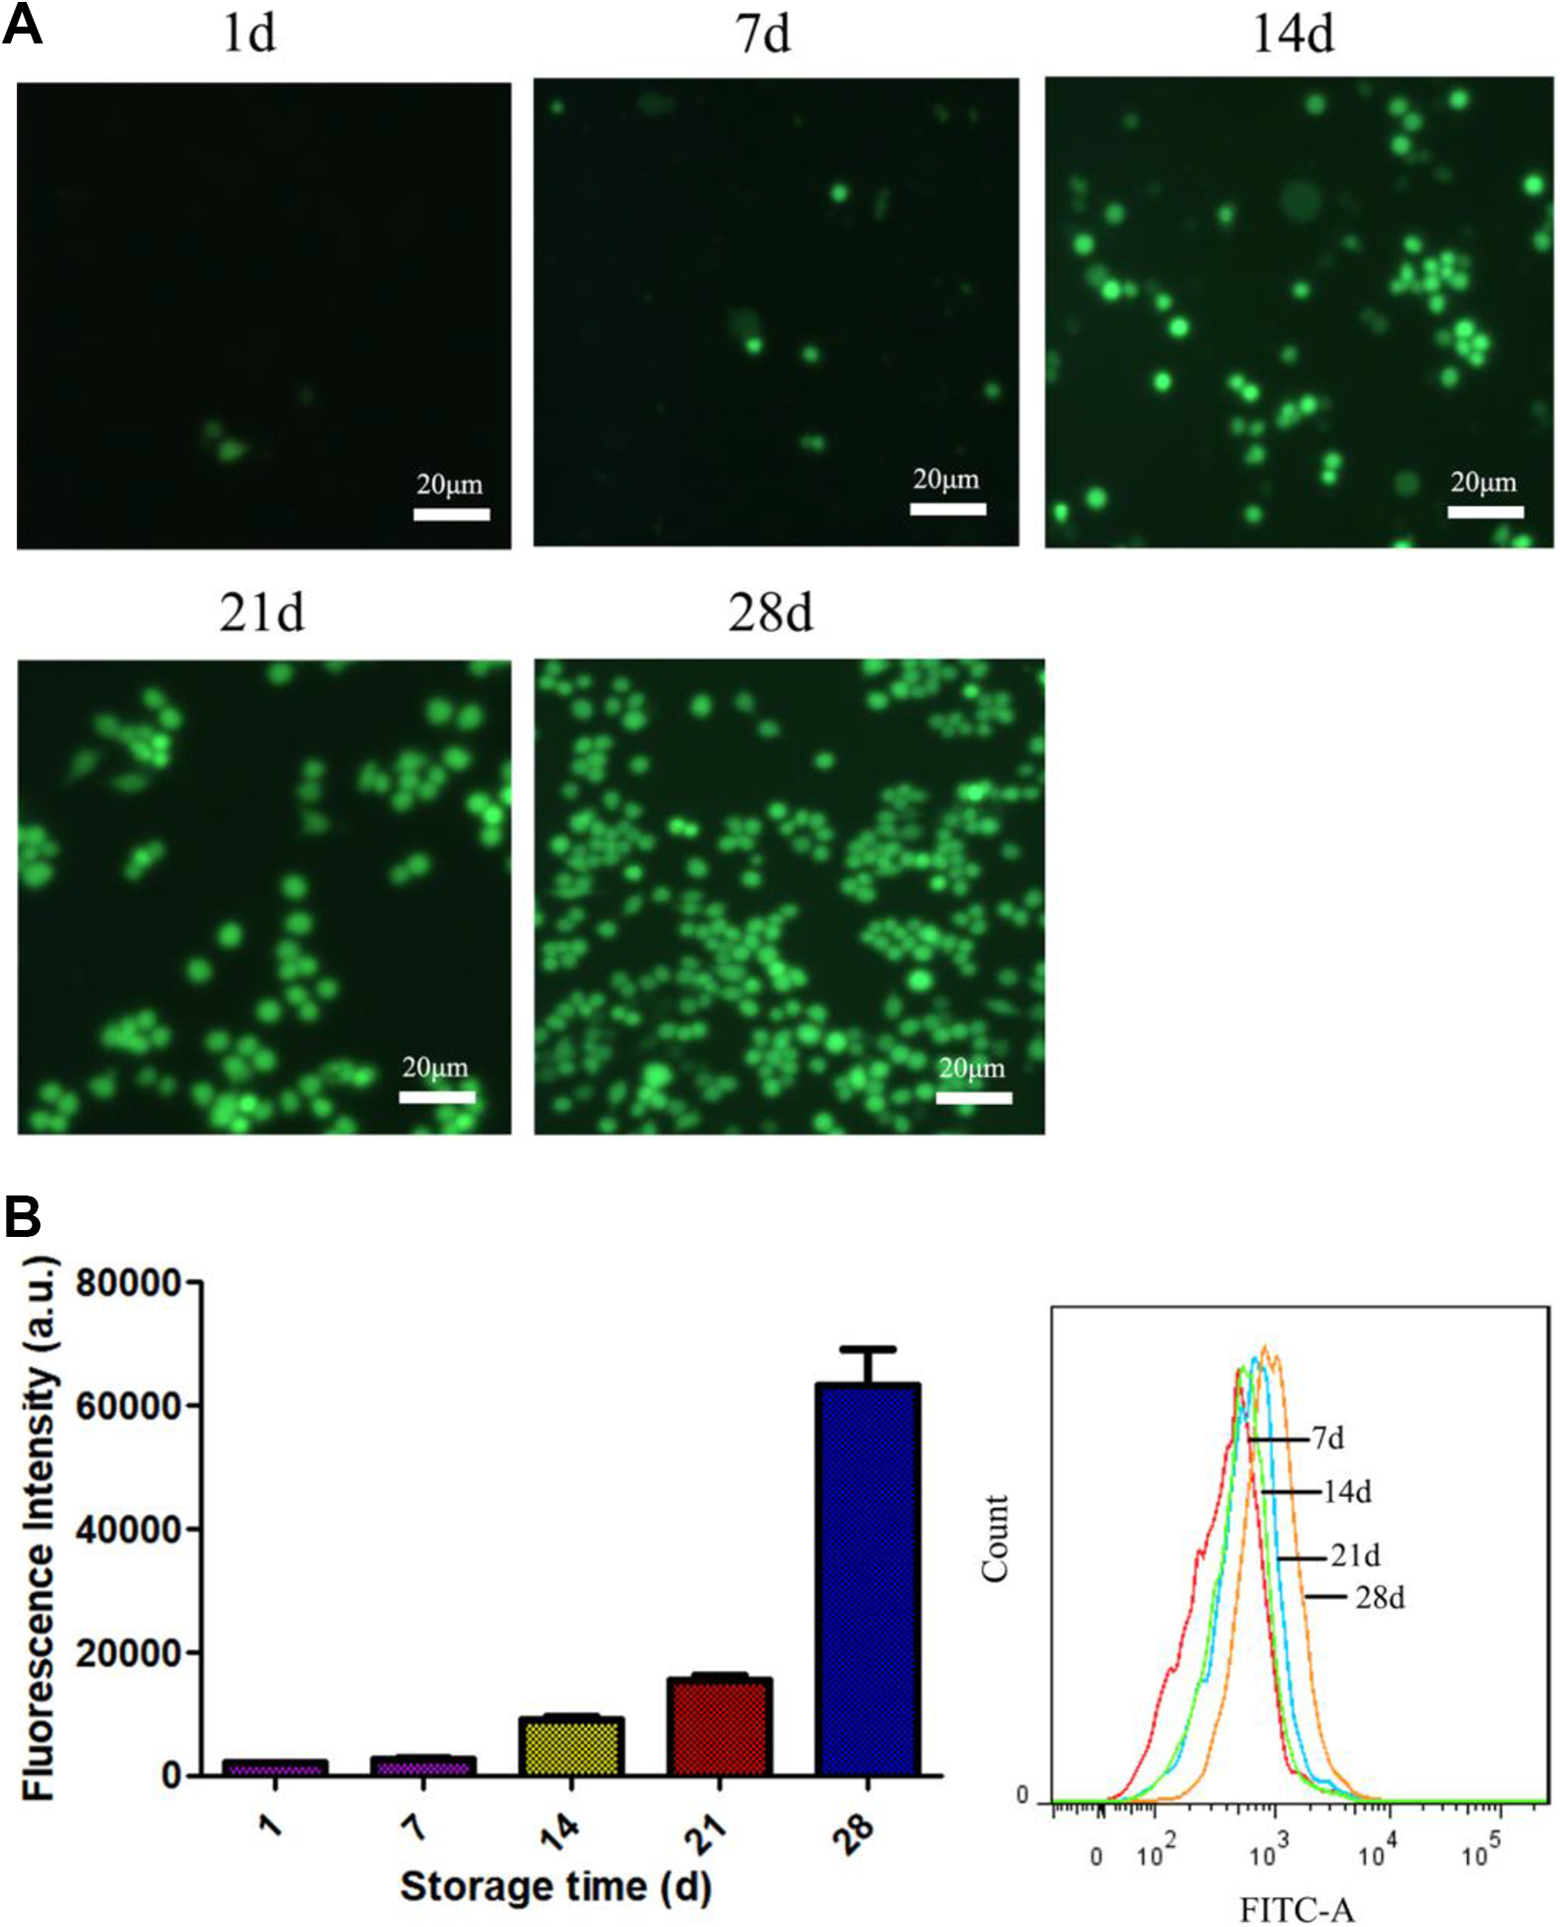
The level of ROS in blood cells detected with DCFH-DA probe. (A) Fluorescence imaging; (B): Fluorescence intensity of ROS in blood cells in different storage time. (n = 3).
Western Blot Assay
Western Blot was used to detect and analyzed the expression levels of Mitofusin 1 (Mfn1) and Mitofusin 2 (Mfn2) proteins on the cytomembrane. Results analysis showed that the expression levels of Mfn1 /Mfn2 were decreased compared with control group of erythrocytes storage of 7 days. There was a significant difference to be shown in Fig. 7.
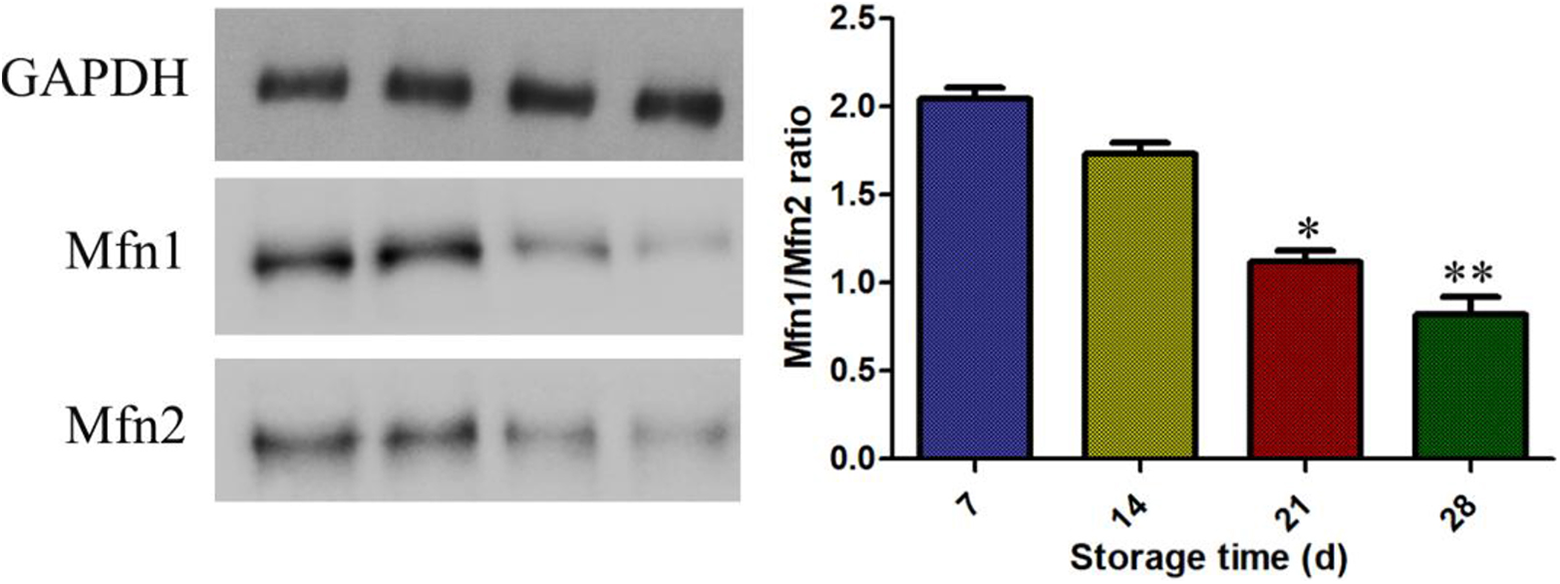
Western blot analysis of expression levels of Mitofusin 1 (Mfn1) and Mitofusin 2 (Mfn2) on the cytomembrane. ** P < 0.01 compared with the storage of 7 days.
Discussion
Effective oxygen-carrying capacity is the most intuitive indicator to evaluate the oxygen carrying capacity of erythrocytes. It refers to the number of oxygen milliliters that 100 mL of blood can actually be transported to the tissues after a blood circulation under normal physiological conditions and standard air pressure. The actual amount of oxygen transported by erythrocytes to various tissues is related to the partial oxygen pressure in arterial blood. Therefore, the effective oxygen carrying capacity of 100 mL blood of a person under normal physiological conditions is about 4-5 mL in fact 14 . According to the experimental results, the effective oxygen-carrying capacity of the erythrocytes in the first 14 days was within the normal range, but gradually decreased from 14 to 21 days. The detection result of Q at 28 days was 3.3 mL. With the increase of erythrocyte inventory time, the effective oxygen-carrying capacity decreased gradually, which was consistent with domestic and foreign literatures 15 . Therefore, it is necessary to pay more attention to the storage time during autotransfusion and timely remind patients of the poor quality of stored blood.
Currently, the main oxygen dissociation curve is used to detect the oxygen carrying function of erythrocytes, and its corresponding parameter is P50, which can be used to reflect the affinity between erythrocytes and oxygen 16 . P50 refers to partial saturated oxygen pressure in arterial blood. It is the partial oxygen pressure at 50% oxygen saturation of hemoglobin, which reflects the oxygen affinity of hemoglobin. The smaller the P50 value is, the greater the oxygen affinity is, and the stronger cell’s ability to bind oxygen is, which is not conducive to release oxygen. On the contrary, the smaller the oxygen affinity is, the weaker erythrocytes’ ability to bind oxygen is, and the easier releasing of oxygen is 17 . We have found that P50 decreased gradually with the extension of preservation time from the results, which indicated that the ability of red blood cells to release oxygen was decreased. Moreover, P50 is affected by blood pH, temperature, partial pressure of CO2, 2,3-DPG concentration 18,19 , Although the determination of P50 can largely reflect the oxygen carrying capacity of erythrocytes, the process of oxygen carrying function in erythrocytes is complex dynamic, and it is not comprehensive to evaluate the function of red blood cells only from the perspective of oxygen affinity.
The important role of 2,3-diphosphoglycerate (2,3-DPG) in erythrocytes is to regulate the oxygen-carrying function of hemoglobin. 2,3-DPG binds to deoxyhemoglobin, thereby reducing the affinity of hemoglobin to O2 and promoting the dissociation of O2 with hemoglobin. Especially when blood passes through tissues, the presence of 2,3-DPG in red blood cells can significantly increase the release of O2 for tissue needs. From the above results, it can be seen that with the increase of erythrocyte storage times, the concentration of 2,3-DPG gradually decreases, indicating that O2 is difficult to release 20 .
Erythrocytes adjusts the volume of cells mainly by regulating the contents of Na+ and K+ in the cells. These cation pumps are dependent on Na+-K+-ATPase on the membrane, which plays an important role in maintaining normal morphology of cells, and promoting the hydrolysis of ATP for all cells to survive 21 . However, the activity of Na+-K+-ATP decreased, which reduced the hydrolysis of ATP and affected the normal metabolism of erythrocytes. It is because the decrease of Na+-K+-ATP causing the release of K+ in the cells and the imbalance between the inside and outside ions in erythrocytes, thus affecting the oxygen carrying capacity of the red blood cells.
The production of reactive oxygen species (ROS) increased caused its antioxidant capacity decreased. ROS accumulated in the body which resulted in the opening of membrane permeability, enhanced intracellular oxidative stress and apoptosis 22,23 . Membrane and DNA are easily oxidized under the effect of ROS, which may lead to membrane rupture, gene mutation and fragment loss, and eventually lead to cell function pathological changes or aging of the body 24 .
The decreased expression of Mfn1/Mfn2 indicates that the cytomembrane fusion in erythrocytes is impaired and the division is strengthened, thus inducing the apoptosis of erythrocytes. The above experimental data showed that the decrease of Mfn1/Mfn2resulted in the imbalance of erythrocytes, which affected the morphology and function of erythrocytes, reduced ATP generation, decreased membrane potential, and increased apoptosis rate, thus affecting the dysfunction of erythrocytes 25 .
In a word, this study proposed by detecting some indicators of erythrocytes carry oxygen. To explore the apoptosis mechanism process from the changes of membrane potential and reactive oxygen species of erythrocytes in different storage days, and give a comprehensive evaluation of erythrocytes carry-oxygen function. Cellular mechanisms in detail as shown in Fig. 8. To observe the effect evaluation of erythrocyte infusion in clinical blood transfusion patients with different storage days, so as to provide experimental basis for the establishment of erythrocyte functional dose, standardize and rationalize the application of erythrocytes, and provide theoretical basis for improving the precise infusion of clinical erythrocytes.
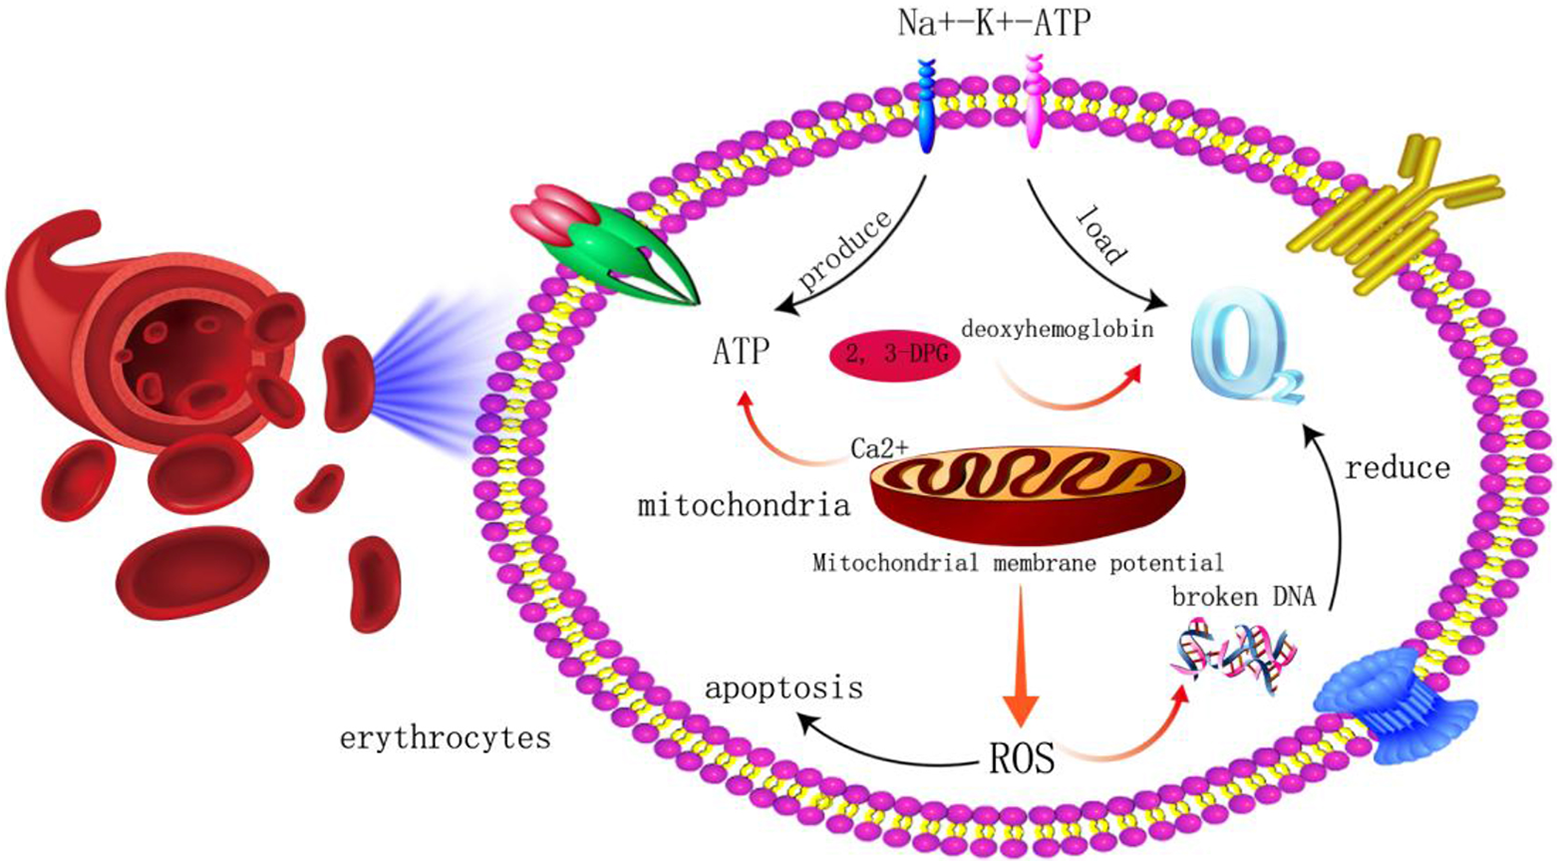
Schematic diagram of erythrocyte oxygen transport and apoptosis.
Conclusion
The change of erythrocyte oxygen-carrying capacity in different storage time, such as effective oxygen uptake (Q), P50, 2,3-DPG, Na+-K+-ATPase will affect membrane potential, the change of Ca2+, and reactive oxygen species (ROS) change of erythrocytes. The different storage time will improve generation of oxidative stress to produce ROS, and further damage the function of erythrocytes.
Footnotes
Authors Note
Zhen-Zhou Li and Dong-Lin Jia co-first author.
Zhen-Zhou Li and Dong-Lin Jia are authors contributed equally to this work.
Acknowledgement
We would like to acknowledge the reviewers for their helpful comments on this paper.
Authors Contribution
Each author has made an important scientific contribution to the study and has assisted with the drafting or revising of the manuscript.
Consent to Publish
All of the authors have Consented to publish this research.
Ethics,Consent and Permissions
Ethical approval was given by Gongli hospital, The Second Military Medical University.
Ethical Approval
Ethical approval was given by Shanghai Gongli Hospital, the Second Military Medical University, Shanghai, China.
Statement of Human and Animal Rights
All procedures in this study were conducted in accordance with Shanghai Gongli Hospital, the Second Military Medical University, Shanghai, China.
Statement of Informed Consent
Written informed consent was obtained from the patients for their anonymized information to be published in this article.
Declaration of Conflicting Interests
The author(s) declared no potential conflicts of interest with respect to the research, authorship, and/or publication of this article.
Funding
The author(s) disclosed receipt of the following financial support for the research, authorship, and/or publication of this article: This work is supported by Key Disciplines Group Construction Project of Pudong Health Bureau of Shanghai (No. PWZxq2017-10), and National Natural Science Foundation of China (No. 81870147).