
Abstract
The optic pathway glioma (OPG) is a slow-growing brain tumor that arises along the optic nerve or its downstream connections and causing vision to gradually worsen with time. This tumor forms in children with a genetic condition called neurofibromatosis type 1 (NF1), causing tumors to grow on nerves. In normal conditions, glial cells are there to support and protect nerve cells but, in NF1-OPG, glial cells have a genetic defect and grow out of control forming a tumor called a glioma. There are no rat models of NF1-OPG that can be used to explore various treatment options, and mouse models make interventional studies difficult due to their small eye size. We have created a model in which to study the progression of tumor growth in the optic nerve and establish the anatomical and functional consequences of the model and determine its suitability to serve as a surrogate for human disease. C6 rat glioma cells were injected into the optic nerve of Long-Evans rats and allowed to proliferate for 2 weeks. The eye clearly showed proptosis and lens opacity was observed, likely due to increased intraocular pressure caused by growing tumors. Hematoxylin–eosin staining showed marked cellularity, with hyperchromatism and pleomorphism. There was prominent area of necrosis with neoplastic cells palisading around the penumbra. Immunostaining with markers such as S100, β-tubulin III, Foxp3, CD45, Vimentin, and Ki67 confirmed low-grade tumor formation, with a mild immune response. Our results show the utility of a surgically induced rat model of OPG that may be used for exploring various treatment options for NF1 ocular tumors.
Introduction
Numerous inherited disorders can cause tumor in vision system including retinoblastoma that is caused by germline mutations in RB1 genes 1 , retinal hemangioblastoma in von Hippel-Lindau 2 , or neurofibromatosis 3 . Since diseases primarily affect the development of neural cells. The most common form is neurofibromatosis type 1, NF1 (also known as peripheral neurofibromatosis or Recklinghausen’s neurofibromatosis), with an incidence of approximately about 1 in 3500 per year 3 . It is known to occur due to a mutation in the NF1 gene located on chromosome 17. Compared to other high-grade tumors, very little is known about the genetics underlying the cause of pediatric low-grade tumors 4 . Young children affected by NF1 are prone to developing low-grade astrocytomas, which typically involve the optic nerves chiasm, and optic radiations and have been termed called optic pathway gliomas (OPG) 5 . The OPG grows near the vital sections of the brain involved in hormone secretion and homeostasis and therefore can interfere with the body’s endocrine functions, such as hormone production, salt and water balance, appetite, and sleep. Most of the optic gliomas in NF1-OPG children are grade 1 pilocytic astrocytomas, but there are also other types of low-grade gliomas that have been described 5 . Neurofibromatosis type 2, also known as bilateral acoustic neurofibromatosis, is an autosomal dominant disorder that is found in 1 in 50,000 births 3 . Both NF1 and NF2 grades exhibit low proliferative indices, usually less than <1%–2%, with infrequent nuclear atypia and locally invasive properties. Primary malignant tumors related to NF1 are known as malignant tumor of peripheral nerve sheath. This disorder causes tumor to grow in any part of nerve and any time point. There is no set time for tumor onset and no location in which tumors would be expected to cause increased morbidity 6 .
Even with its benign nature, young children with NF1-OPG develop optic nerve dysfunction resulting in vision loss or developmental symptoms due to hypothalamic involvement, requiring treatment. Presently, most patients are treated with either temozolomide or combined carboplatin and vincristine chemotherapy 7 . Although most patients respond well to this treatment, some advanced cases require additional therapy. Unlike other high-grade tumors in which many cell culture, xenografts, and genetic models are available to test and support extensive biological and clinical research, low-grade gliomas models are rare and considerably more challenging to study 8 . A major technical hurdle is establishing reliable low-grade glioma explant models.
Gliomas are tumors derived from the glial cells and the most common tumor of the central nervous system (CNS). C6 cells were developed in late 1960s in adult Wistar-Furth rat after animals were repeatedly exposed to N-nitroso-N-methylurea 9 . These cells lines are composed of pleomorphic cells with variably shaped nuclei. They overexpress the same gene that is found in human gliomas, the PDGF-β, epidermal growth factor receptor, insulin-like growth factor 1, and Erb3/Her3 precursor proteins. Like human gliomas that shows increased activity of genes controlling the Ras pathway, C6 cells also show upregulation of this pathway. Along with increased Ras, expression of TGFα has also been noted. The main histologic difference in the C6 cells is that they do not express glial fibrillary acidic protein (GFAP), while vimentin is variably expressed 10 . These cells are used for testing a wide range of agents for their tumoricidal activity and considered to be safe and highly desirable glioma models that can provide a good model of glioblastoma multiforme.
In order to develop a transplantation-based model of OPGs in a larger animal (vis-à-vis mouse), we have injected C6 cells in the optic nerve of Long-Evans rats. Two-week post-injection, eyes were enucleated and tested using different histology and immuno-staining to confirm formation of gliomas in the optic nerve. In this experiment, we have created a simple glioma model that can be used to test various tumoricidal agents that may serve as treatments for NF-1-OPG patients.
Materials and Methods
C6 Cell Culture
C6 cells were cultured based on the protocol provided by ATCC (culture method, CCL-107, USA). Briefly, confluent T75, fibronectin (Akron)-coated flask (surface 75 cm2, vented cap, sterile, Nunclon Delta, USA) were washed with Hank’s Balanced Salt Solution (HBSS, without calcium and magnesium, Thermo Fischer Scientific, USA) to remove any trace of serum before treating with 0.25% (w/v) trypsin–0.53 mM ethylenediaminetetraacetic acid (Sigma-Aldrich, USA). Flasks were observed under an inverted microscope and incubated for 5 min at 37°C to reach complete detachment of cells. Cells were then collected, centrifuged, and resuspended in 1 ml culture media containing F-12 K medium (ATCC-formulated, USA), 2.5% of fetal bovine serum (Sigma-Aldrich, USA), and 15% of horse serum (Sigma-Aldrich, USA). Appropriate amount of the cell suspension was seeded into new culture flasks (usually 2 × 10⁵ per flask). Once confluent cells were further detached with trypsin and frozen in 95% culture media and 5% dimethylsulfoxide (Sigma-Aldrich, USA) until further experiment. Cell number and viability were estimated, after each passage, using Trypan blue (Sigma-Aldrich, USA) and a hemocytometer (Countess™ II FL Automated Cell Counter, Thermo Fischer Scientific, USA). To prepare for injection, C6 cell suspension was prepared in HBSS at the 10,000 cells/μl.
Optic Nerve Injection in Long-Evans Rat
Twenty-four domestic rats of the Long-Evans strain (age 4 weeks with approximate weight of 150 g) were used as control and test recipients in the experiment. Rats were sedated using 2%–4% isoflurane (Abbott, Solna, Sweden), followed by intraperitoneal injection of ketamine (40–80 mg/kg) and xylazine (10 mg/kg) combination for anesthesia. A drop of lidocaine (Sigma-Aldrich, USA) was placed on surgical eye and artificial tears were used every 5 min to prevent dryness of eyes during the surgical procedure. Before starting rats were placed on stereotaxic frame with heating pad to keep them warm throughout the procedure.
A 1-inch incision was made in the skin overlying orbital ridge using size 12 scalpel. Skin was retracted exposing underlying fascia, which was carefully dissected away. Utmost care was taken to avoid blood vessel, which could cause excessive bleeding and cotton swab was used to maintain hemostasis during dissection of fascia. Furthermore, with light traction on the conjunctiva while pulling eye downward out of eye socket superior orbital, muscle was exposed. Using a fine tip needle the muscles were teased out, which gave complete access to the optic nerve fascia.
C6 cell suspension was prepared to contain 10,000 cells/µl and each test animal received 1 µl of injection using a glass micropipette of 105 µm diameter. The glass needle was mounted onto a micromanipulator attached to Hamilton syringe stand. After completion, the microneedle was retracted, and eyes were gently pushed back. The skin was sutured, and the animal was return to cage after full recovery.
The research protocol was reviewed and approved by the Schepens Eye Research Institute Animal Facility and was in accordance with the Association for Research in Vision Ophthalmology Statement for the Use of Animals in Ophthalmic and Vision Research.
Tissue Processing
Days 1, 5, and 12 were the time points to check the effect of C6 injection and its tumor formation ability. Both control and test animals were sacrificed by using CO2 suffocation, and secondary step of puncturing major organ was used to ensure death. Eyes were enucleated by dissecting from the superior orbital side to obtain part or complete optic nerve and placed in 4% paraformaldehyde for 12 h. Tissues were subsequently treated with sucrose in increasing concentration (5%, 10%, and 20%) containing Sorensen phosphate buffer. One day before dissection eyes were transferred into sucrose: Optimal cutting temperature (OCT) solution (1:1) and, before mounting, with compete OCT media. About 15 µm sections were collected in poly-
Histology and Immunohistochemistry
Both control and test slides were examined using different stains. For histology, Thermo Scientific Rapid-Chrome H&E staining kit was used. This was 18-step process that permanently stains cytology specimens. Slides were dipped into series of solution containing 95% alcohol, distilled water, hematoxylin, Bluing reagent, and Eosin-Y stain followed by series of wash before final fixing step. Slides were then mounted and observed under upright microscope (Leica DM2500).
Sections were stained with Luxol blue staining kit (Abcam ab150675, USA). Slides were washed with phosphate buffered saline (PBS) and incubated with Luxol blue solution for 2 h at 60°C, following which slides were rinsed with distilled water and differentiated by dipping into lithium carbonate solution. To develop further differentiation slides were dipped in alcohol reagent provided with the kit. For the final staining slides were dipped in Cresyl Echt Violet for 2–5 min following which rinsing and dehydration were performed before mounting the slides for visualization.
For immuno-histochemistry (IHC) staining, cryosections from Long-Evans rats’ left eyes were fixed with 4% paraformaldehyde in 0.1 M PBS (Irvine Scientific, USA) at room temperature for 20 min. These sections were blocked and permeabilized with a blocking solution [Tris-buffered saline (TBS), 0.3% Triton X-100, and 3% goat serum (Jackson Immunoresearch Laboratories, West Grove, PA, USA, http://www.jacksonimmuno.com)] for 15 min. Samples were then rinsed twice with 0.1 M TBS buffer for 15 min each time, mounted on polysine microscope slides and incubated with primary antibodies overnight at 4°C: S100-fluorescein isothiocyanate (FITC) (major protein expressed by C6 cells
11
), β-tubulin III-FITC (neurofibroma presence), Ki67-FITC (proliferation marker), Vimentin-antigen presenting cell (APC) (expressed by C6 cells
10
), and Foxp3-APC and CD45 (immune response markers). After overnight incubation, samples were rinsed three times with TBS for 15 min. Secondary antibodies [goat-derived anti-mouse and anti-rabbit, 4’,6-diamidino-2-phenylindole (DAPI)-VioBlue] staining was performed for 1 h at room temperature. Samples were then washed a final time with TBS before being mounted on poly-
Flow Cytometry Assay of C6 Cells
The phenotype of C6 cells was analyzed using flow cytometry with the MACSQuant flow cytometer (Miltenyi, San Diego, CA, USA). Cells were collected and fixed with Perm/Fix buffer (BD Biosciences, USA) at 4°C for 15 min. Cells were then washed in wash buffer (BD Biosciences, USA) and incubated, at room temperature, in blocking buffer (Pharmingen staining buffer with 2% goat serum) for 30 min. Blocked cells were seeded onto a flat bottom 96-well plate (polystyrene, Thomas Scientific, USA) and labeled overnight at room temperature with the following conjugated primary antibodies: S100-FITC, Vimentin-FTIC, CD45-APC, Ki67-APC, and GFAP-APC. Primary antibodies were diluted in 200 µl of antibody buffer (TBS, 0.3% Triton X-100, and 1% goat serum). After overnight incubation cells were washed three times for 15 min and incubated in secondary antibodies (goat-derived anti-rabbit and anti-mouse, DAPI-VioBlue), which were diluted 1:200 in antibody buffer (Jackson Immunoresearch Laboratory, USA). Incubation was performed at room temperature for 3 h. Forward and side scatter and fluorescence signals from each sample were measured using the MACSQuant (Miltenyi Biotech, Bergisch Gladbach, Germany) flow cytometer. The results were analyzed using the MACSQuantify software (https://www.miltenyibiotec.com). For each primary antibody the DAPI-positive single cell population was gated. The ratio of positive cells in the gated population was estimated in comparison with blank and species-specific isotype controls.
Image Processing and Analysis
Seven randomly selected images were taken for each sample. To statistically analyze the field of view, an image processing MATLAB code was created, based on Otsu’s method 12 (thresholding algorithm). For each image taken, the code calculates (with a tolerance of 0.01%) the surface covered by the cells of interest (in images taken with ×20 magnification). The number of colored pixels (green for FITC channel and red for APC channel) were counted and a percentage of cell surface coverage was created.
Statistical Analysis
All experiments were conducted in n = 5 set. Results and values are represented in all figures with mean ± standard error using GraphPad software. One-way ANOVA analysis of variance was used following Student’s t-test for statistical analysis. P < 0.005 was considered as significant difference.
Results
C6 Cells and Tumor Formation in the Optic Nerve
C6 cells were injected into the optic nerve anterior of the optic chiasm of the left eye (test) of each animal (right eye serving as control) as shown in Fig. 1A. Macroscopic examination (using a surgical microscope) was performed at days 1, 5, and 11 after surgery. At day 1 after C6 injection in the optic nerve, no visible difference was noted between the control and tumor injected test group. However, 11 days postinjection, upon macroscopic examination, significant lens opacity was observed, likely due to increased intraocular pressure (Fig. 1B). This along with slight proptosis that is typical of optic nerve glioma was only be observed in the test animals. Post-enucleation, large tumors were observed in the test animals, while control eyes showed normal sized optic nerve (Fig. 1B). The macroscopic examination suggests tumor evolution from day 1 to day 11 after tumor induction. Quantification of tumor size and formation at day 11 was performed by measuring the size of the tumor in each test eye and compare it with the healthy optic nerve in the control eye (n = 5). Tumor surface coverage analysis was performed using Student’s t-test and was significantly larger than control animals that did not receive any injections (Fig. 1C). The actual area measured for the control eyes corresponded to the area of the healthy optic nerve. This examination suggests the presence and formation of a large tumor, after 11 days post C6 cells injection in the optic nerve.
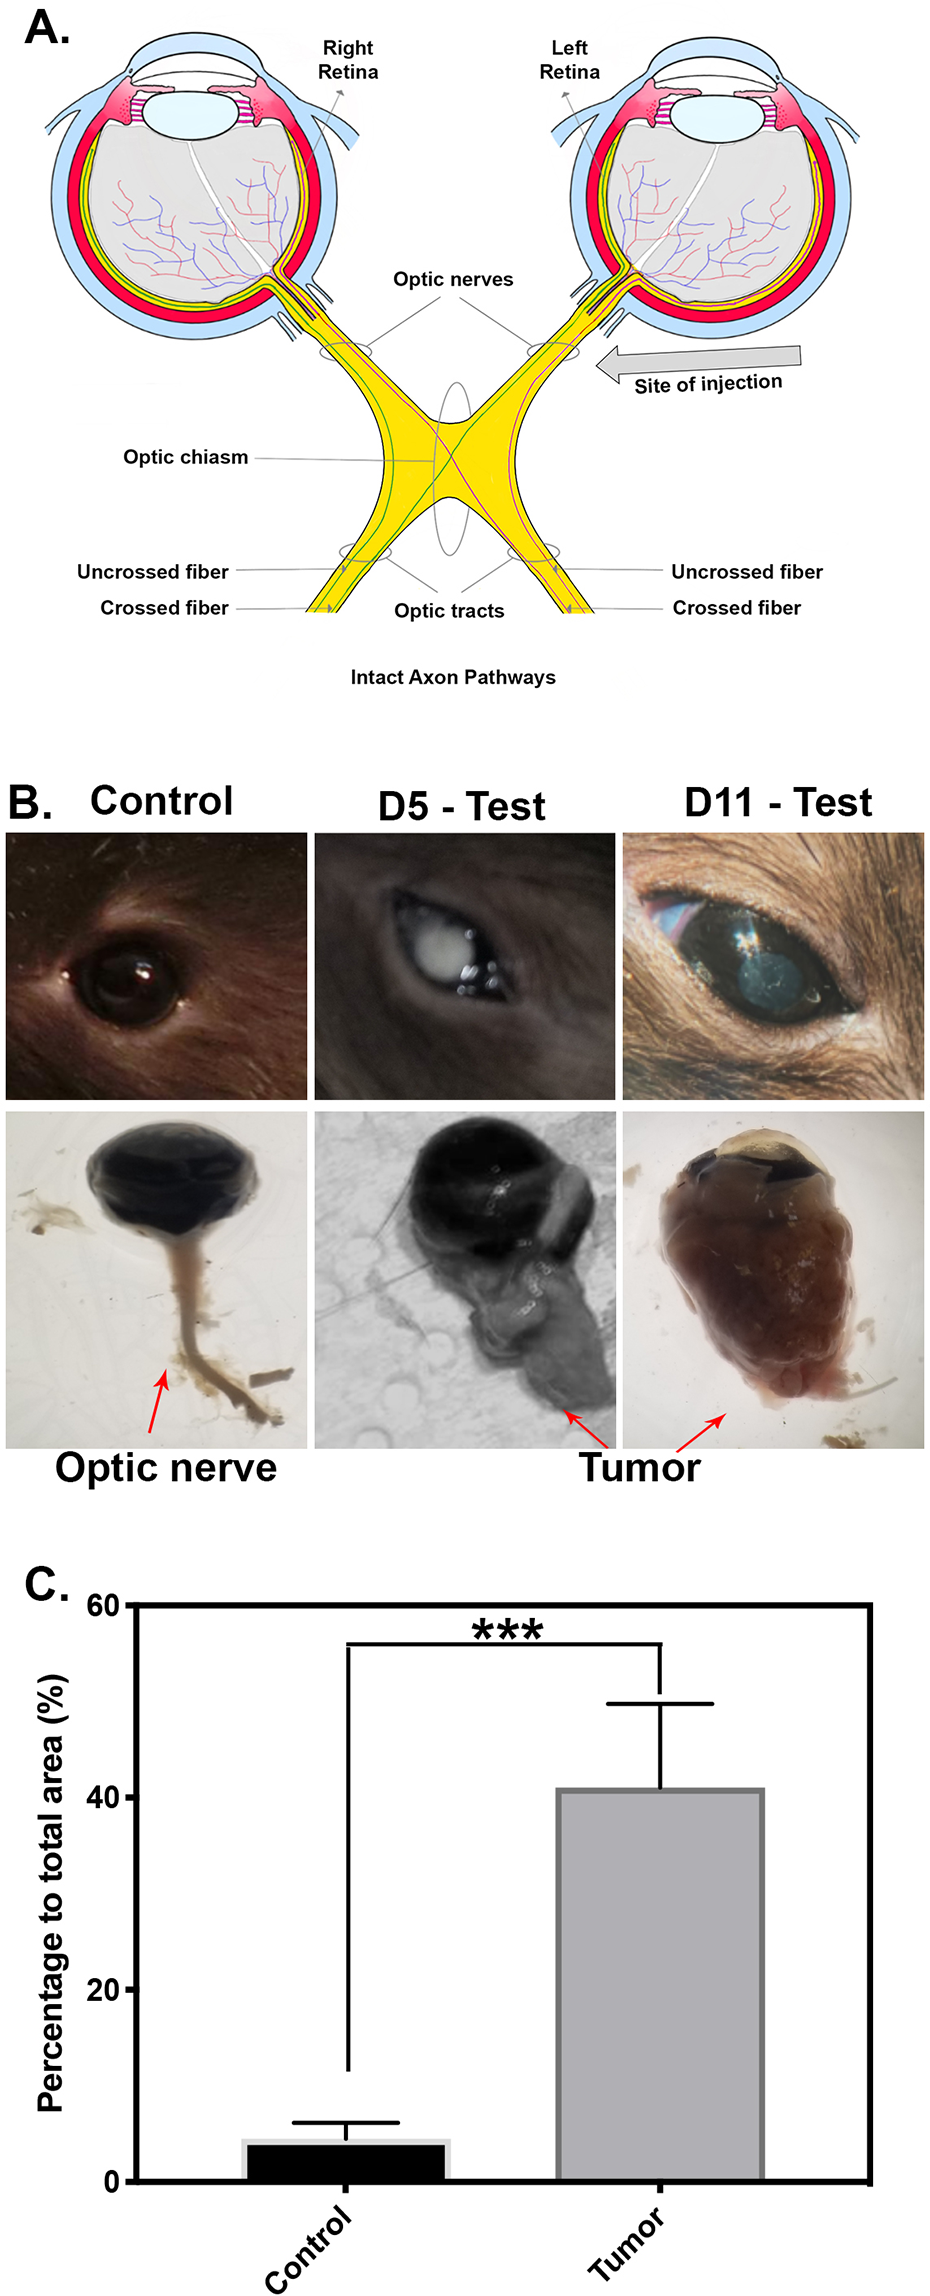
Macroscopic examination of optic nerve glioma (ONG) formation and statistical analysis. Control and test eyes were enucleated 2 weeks postsurgery and examined with surgical microscope under brightfield illumination at days 5 and 11. (A) Diagram of optic nerve anatomy and injection site of C6 cells. (B) Photography, in brightfield, of rat eye, optic nerve, and tumor for control eye and at days 5 and 11 postsurgery. (C) Analysis of tumor size by measure of visible area around the optic nerve. Statistically significant differences were observed in the size of the tumor between control and test group (P < 0.005).
Histological Analysis of Gliomas
Histological analysis was done using hematoxylin–eosin (H&E) and Luxol Fast Blue staining on control and test ocular tissue 11 days postinjection. H&E staining of the control tissue showed normal optic nerve fibrous structure with well-defined cell nuclei (Fig. 2A). The histopathology patterns of glioma tumors with diffused astrocytoma characterized by highly pleomorphic nuclei with low cell density were observed. Distinct areas of high cell density show clear protoplasmic area with round bland nuclei indicating few oligodendroglioma (Fig. 2B). Near the injection site, large irregular shaped neoplastic cells could be clearly seen (Fig. 2B, right panel). Prominent areas of necrosis around the injection site were visible with palisades of neoplastic cells nearby. This morphological analysis suggests the formation of a glioma in the optic nerve, near to the injection site, 11 days post C6 cells injection. H&E staining of retina was also performed to look at possible tumor formation in retinal layers; however, we have looked extensively at retina slices and tiling and did not find any tumor formation. Brightfield images of control (Fig. 3A) and injected tissue (Fig. 3B) show integrity in the retinal structure and ganglion cell layer showing sign of degeneration in test tissue. Luxol fast Blue staining (Fig. 3C) shows no sign of demyelination and the lamellar structure was found to be intact in control tissues. However, Luxol Fast Blue images of test tissues (Fig. 3D) show significant difference suggesting demyelination after C6 injection.

H&E staining and analysis of injected and control tissues. H&E staining was performed, and slides were observed under brightfield with upright microscope. Control tissue (A) shows healthy optic nerve with normal and uniformly distributed nuclei, while test tissue (B) suggests the presence of necrotic areas with neoplastic and infiltrating cells. H&E: hematoxylin–eosin.

Luxol Fast Blue/Cresyl Violet staining and analysis of injected and control tissues. Luxol Fast Blue staining was performed, and slides were observed under brightfield with upright microscope. Control tissue (A) and test tissue (B) images of retina show effect of C6 injection on retina with ganglion cell layer showing sign of degeneration in the test tissue (B). No tumor in the retina was observed in the test tissue for all animals. Optic nerves staining show increased cell infiltration in C6 injected rats (red arrow) (D), while none is observed in the staining ofcontrol rats (C). It also reveals an area of reduced luxol fast blue (LFB) staining indicating focal demyelination (top right inset arrows).
Immunostaining of Gliomas
Different stains were used to evaluate expression of tumor markers in resultant gliomas. The S100 protein family are useful as markers for certain tumors and epidermal differentiation. It can be found in melanomas, 100% of schwannomas, 100% of neurofibromas (weaker than schwannomas), 50% of malignant peripheral nerve sheath tumors (may be weak and/or focal), paraganglioma stromal cells, histiocytoma, and clear cell sarcomas 11 . S100 protein is secreted at high levels by glial tumors and was found to be highly expressed in the C6 injected test animals (Fig. 4B). Negative control eyes, which were not injected with C6 cells, showed no S100 expression. The macrophages, microglia, and immune surveillance cells of the CNS are largely quiescent in normal conditions but become activated in injured neural tissue and can be detected by antibodies directed against CD45 13 . CD45 staining of the test animals shows typical minimal staining usually seen in the rodent models in which resident microglial are not highly activated for low-grade tumors, while control eyes show no presence of CD45 expression (Fig. 4A). These staining suggest the formation of glial tumor next to the injection site with a minimal immune response. Foxp3 (forkhead box P3), also known as scurfin, is a protein involved in immune system responses. Foxp3 expression was not detected in the control eyes (Fig. 5A) while relatively high marker expression was found in test tissues. β-Tubulin III is a useful marker to corroborate neurofibroma diagnosis (Fig. 5B). Colocalization of Foxp3 and β-tubulin III was observer in the test eyes next to the injection site while control eyes were found negative for both markers. The expressions of these markers in the test group suggest the formation of neuroglioma with a low-level immune response. Quantitative analysis of S100 and Foxp3 was performed using Otsu’s method of image processing. Analysis of the surface coverage of each marker was performed for the test and control tissues (n = 7 fields of view, Fig. 6A). S100 surface coverage was significantly higher in the test tissue (16%) compared to the control test (1.4%). The same expression pattern was seen with Foxp3 (12% and 1.5%, respectively). These quantitative data confirm the immunostaining results found—C6 cells injection promotes tumor formation with a low-level immune reaction.
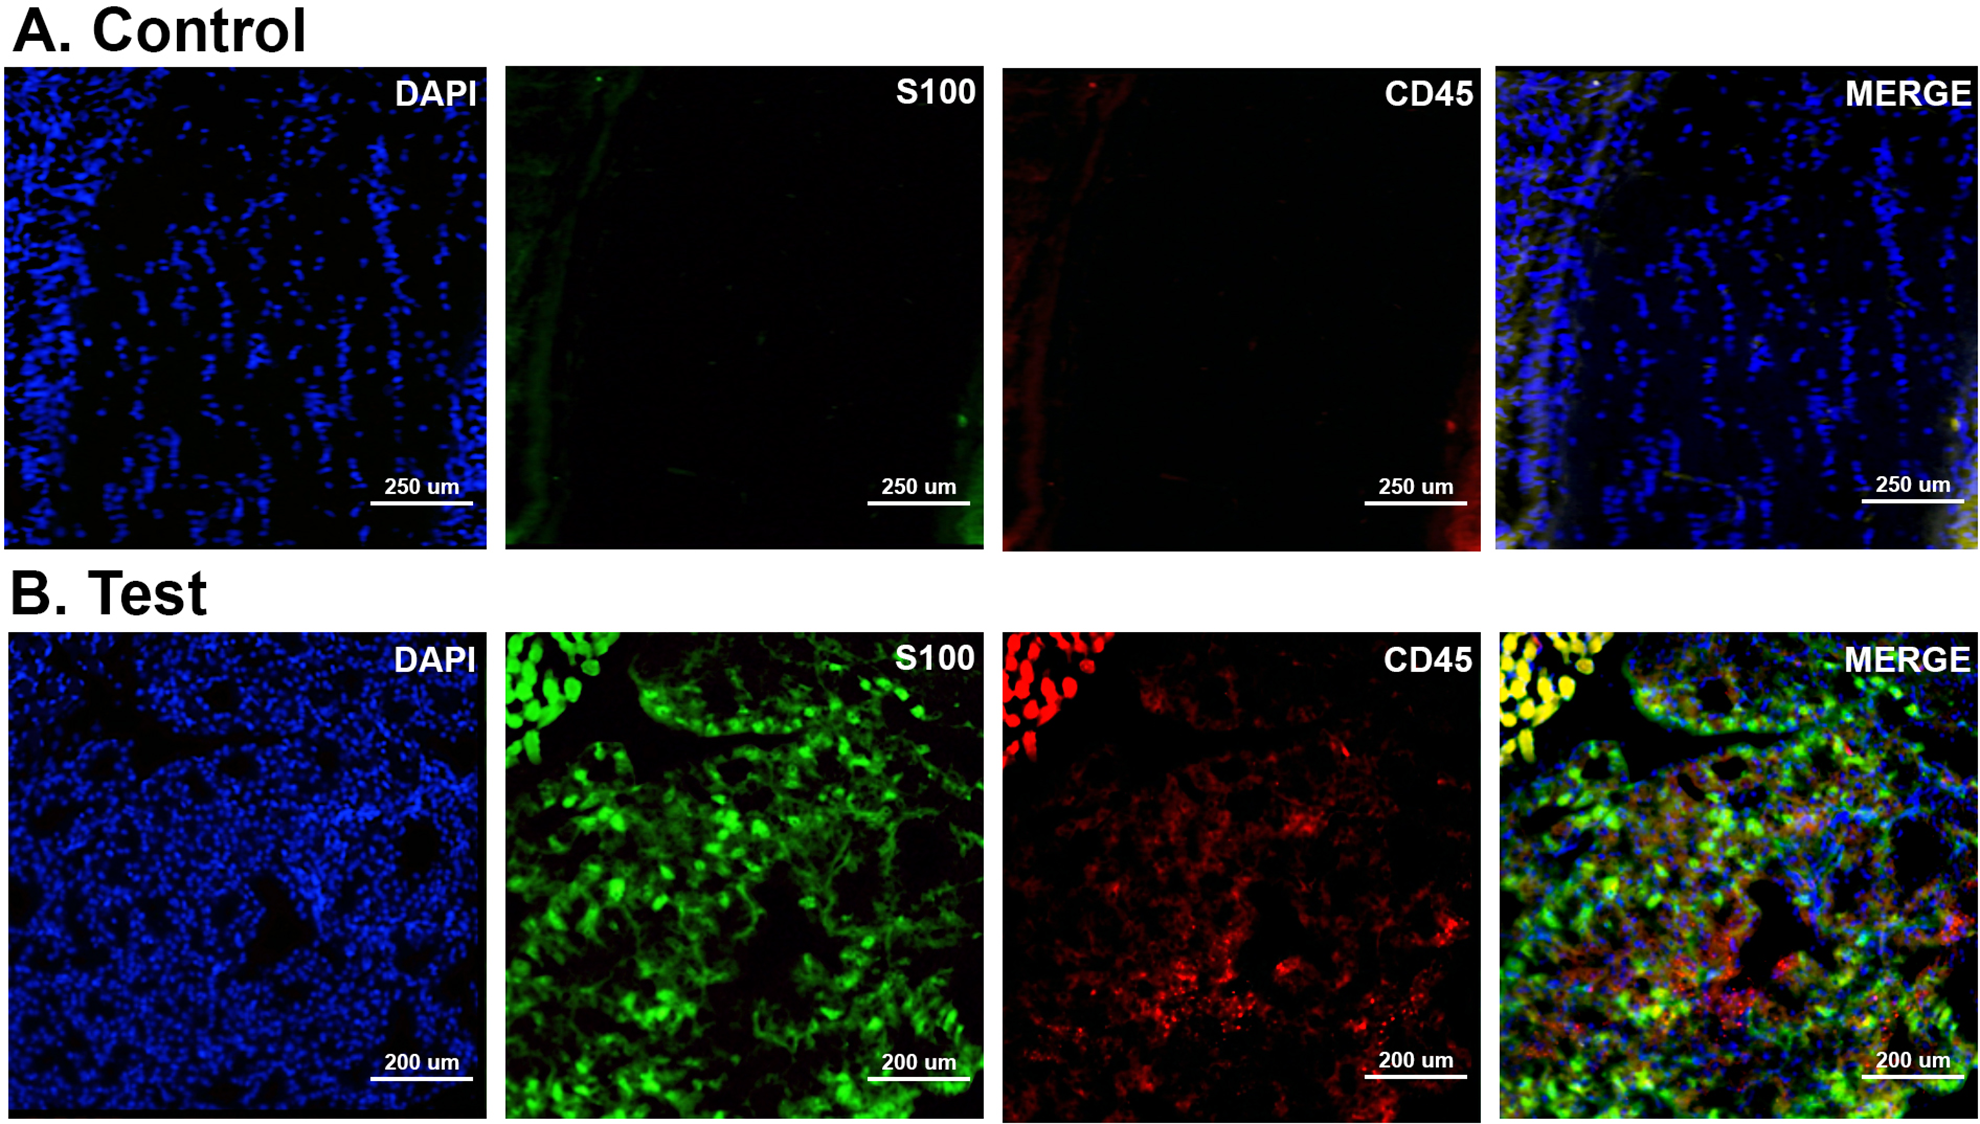
Immunostaining for optic nerve tumor presence (S100) and immunoreaction of the host (CD45). Images taken under fluorescence microscopy to assess presence of tumor and immune reaction due to injection of C6 cells. All images were taken at ×20 magnification. DAPI (VioBlue) staining was performed to show cell nuclei, S100 (FITC) staining suggests the presence of optic nerve tumor, and CD45 (APC) is a marker of host immune reaction. Control tissue (A) shows little to no immune reaction and no cells are positive for S100. However, in the regions of interest, test tissue (B) shows strong S100 staining. APC: antigen presenting cell; DAPI: 4’,6-diamidino-2-phenylindole; FITC: fluorescein isothiocyanate.
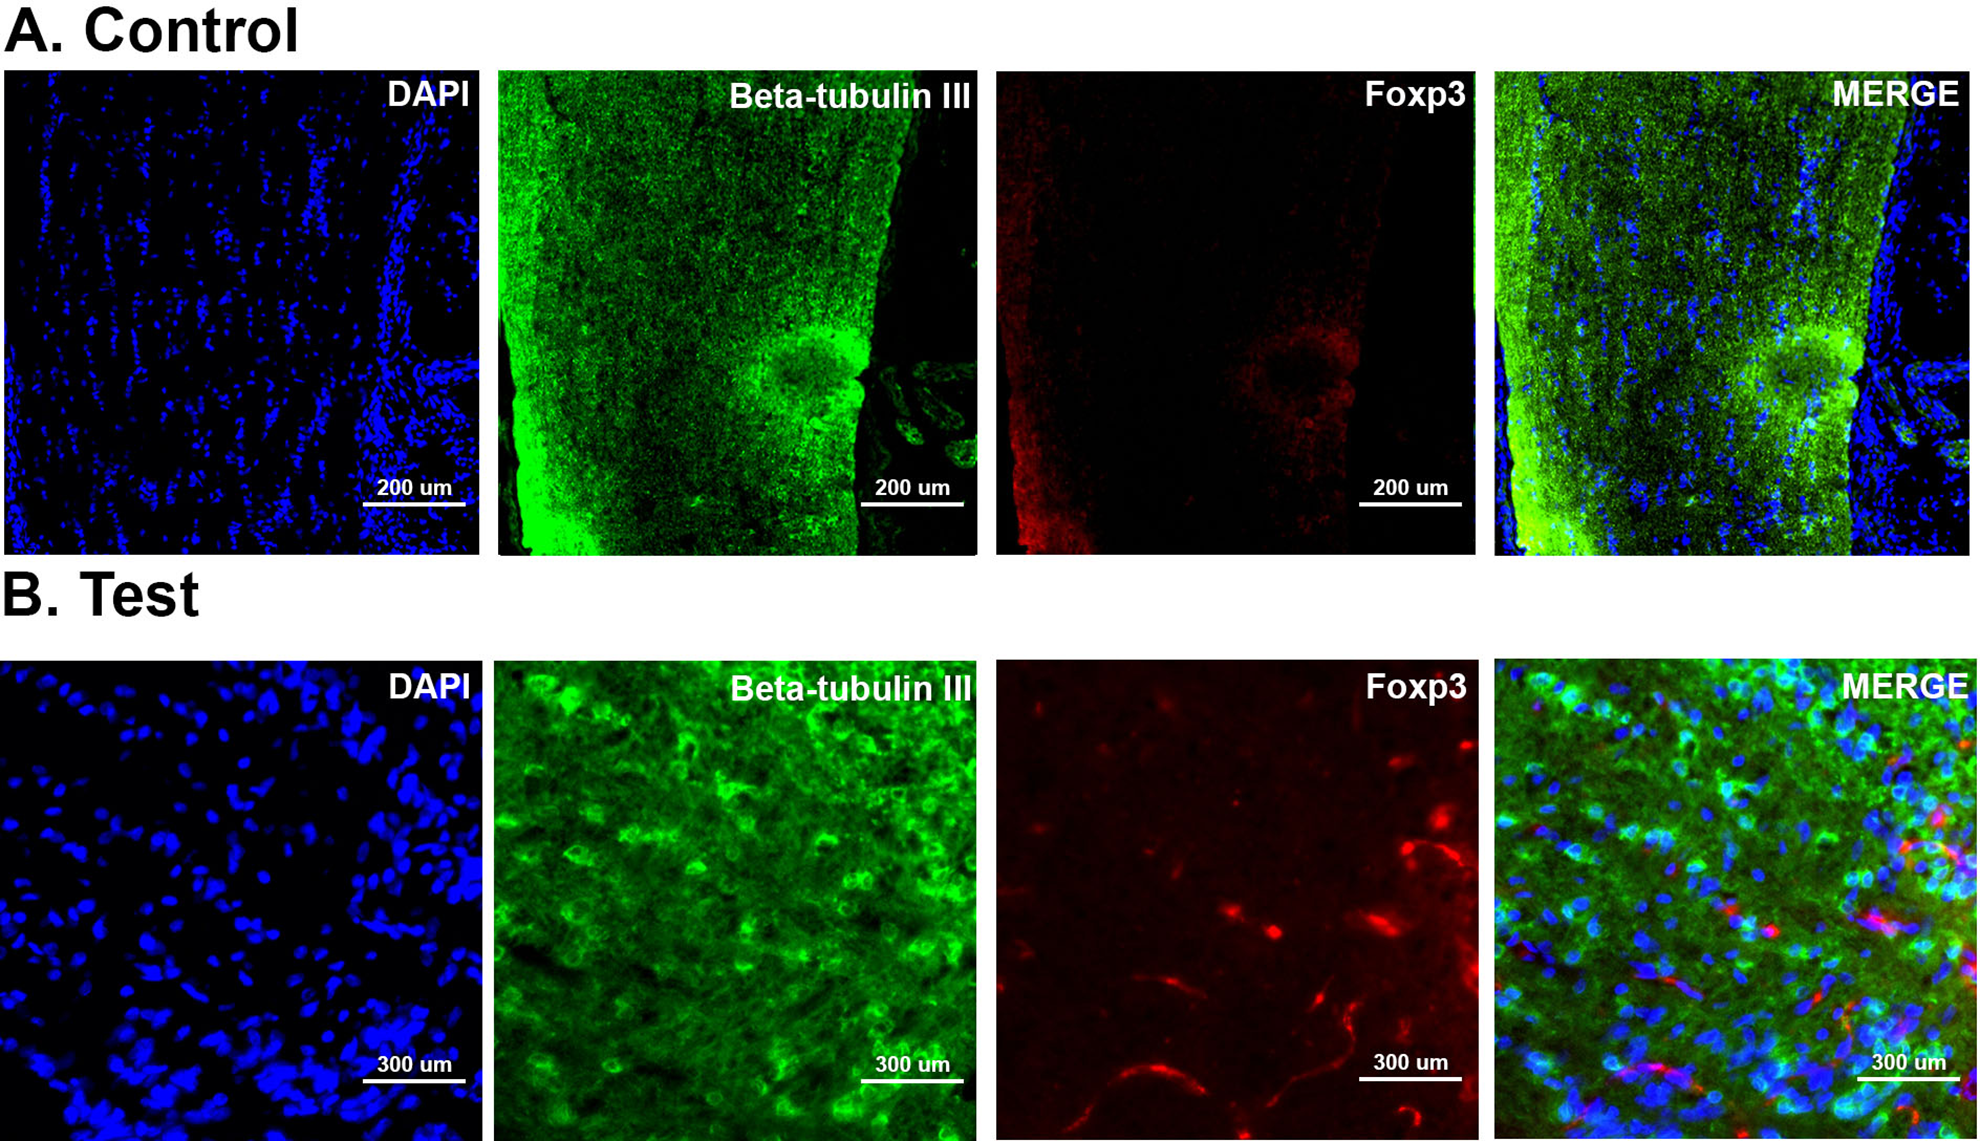
Immunostaining to confirm neurofibroma diagnosis. Images taken under fluorescence microscopy to assess immune response and neurofibroma presence. All images were taken at ×20 magnification. DAPI (VioBlue) staining was performed to show cell nuclei, β-tubulin (FITC) staining suggests the presence of neurofibroma, and Foxp3 (APC) is a marker of host immune reaction. Control tissue (A) shows little to no immune reaction and no cells are positive for Foxp3. However, in high cell density regions, test tissue (B) shows high Foxp3 response. APC: antigen presenting cell; DAPI: 4’,6-diamidino-2-phenylindole; FITC: fluorescein isothiocyanate.

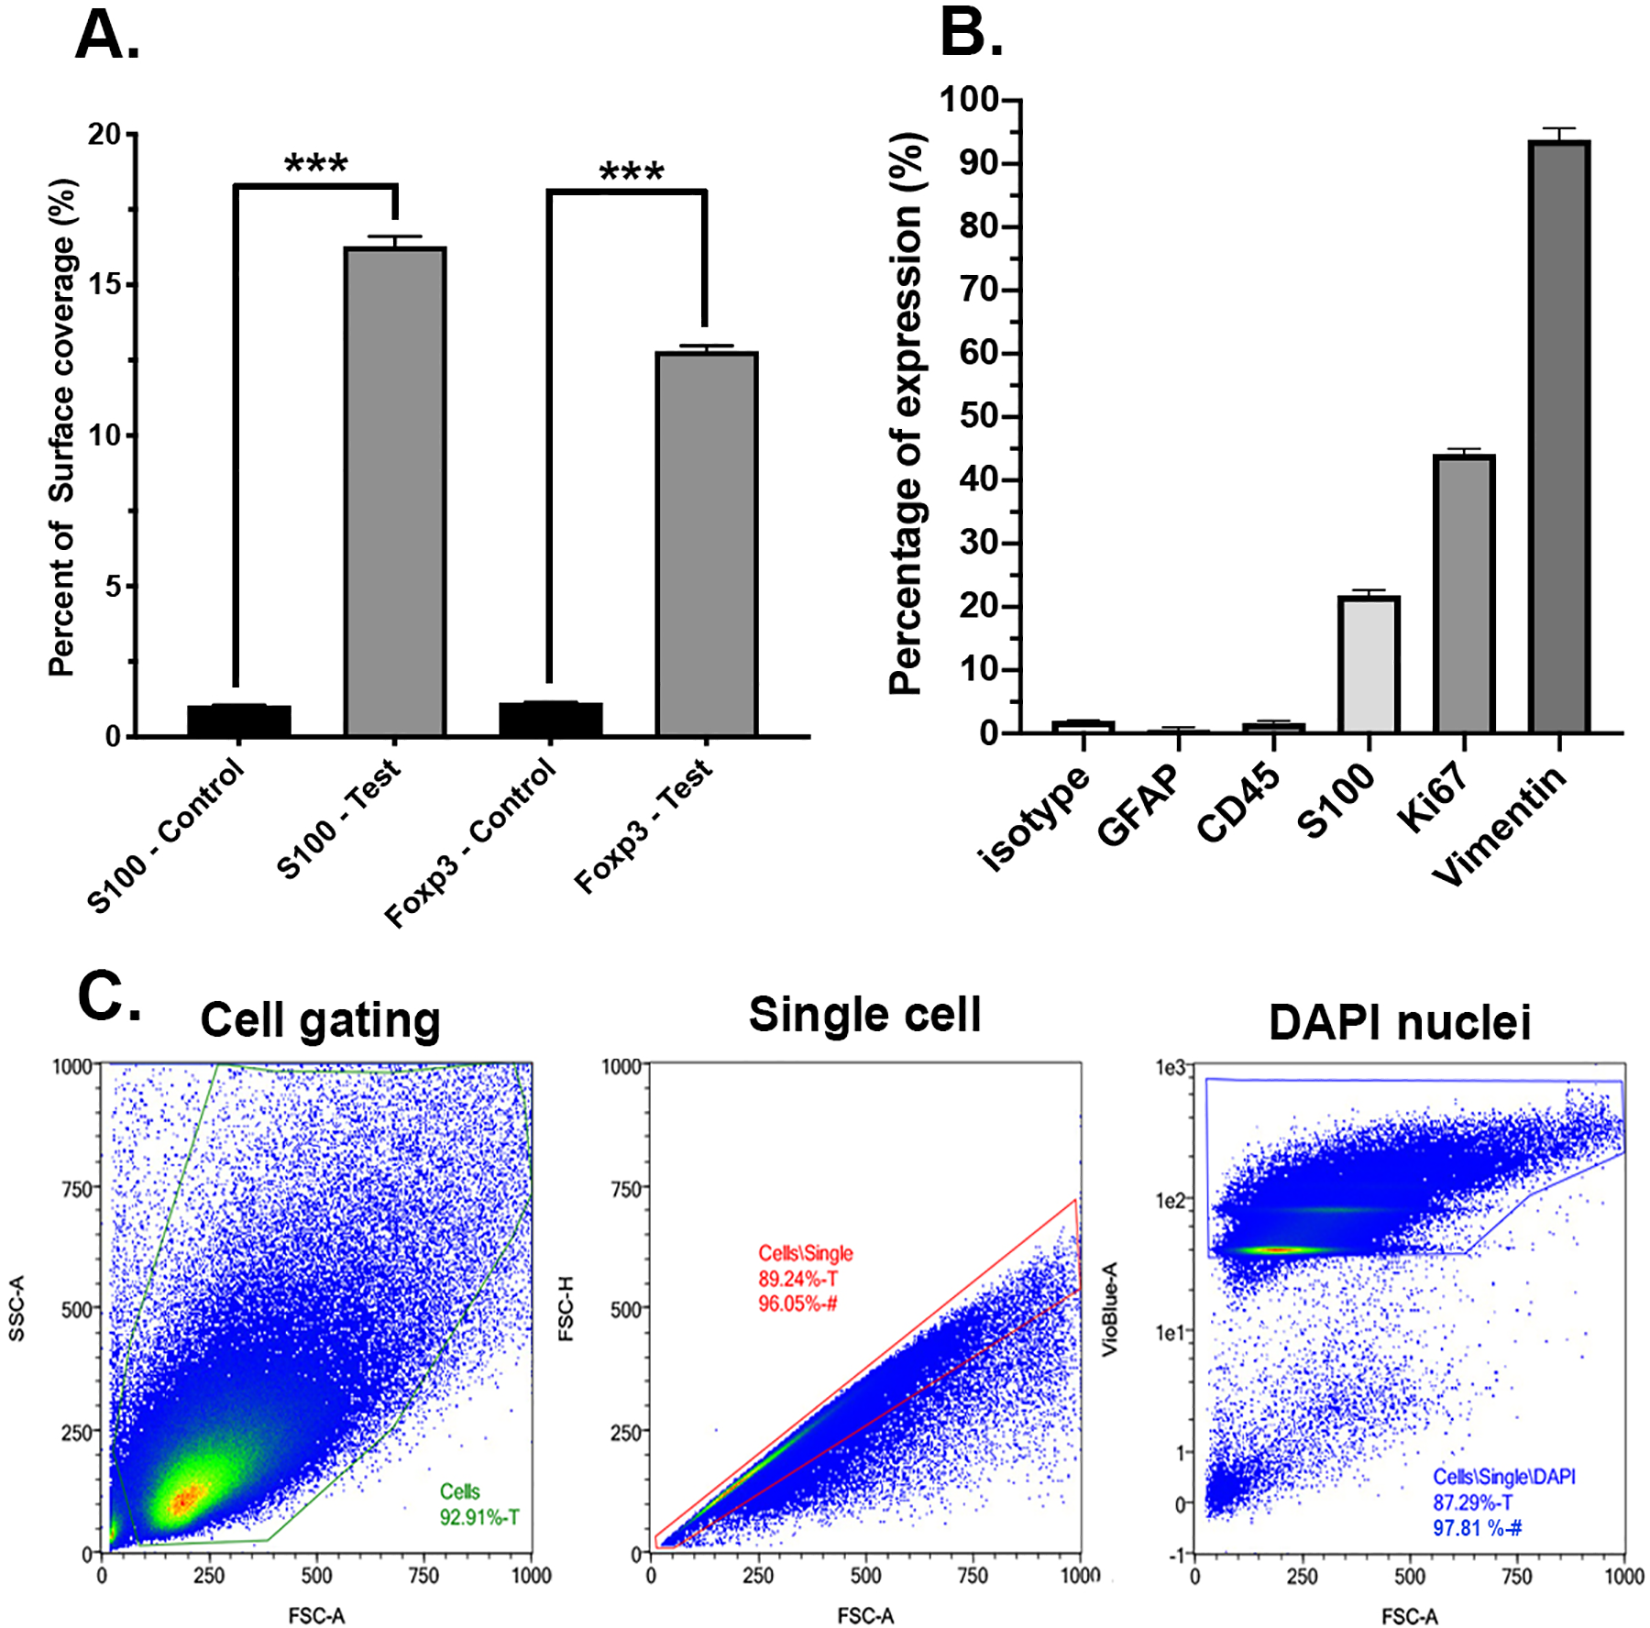
In vitro and in vivo phenotype assay of C6 cells. C6 cells were analyzed by flow cytometry using MACSQuantify software. (A) Surface coverage analysis of C6 cells in vivo for control and test group for S100 and Foxp3 markers. A MATLAB image processing algorithm based on Otsu’s method was used. Analysis was performed on images from Figs 3 and 4. High statistical difference was observed between control and test groups for both markers (P < 0.005). (B) In vitro phenotype analysis of C6 cells with flow cytometry. Markers analyzed: isotype control, GFAP, CD45, S100, Ki67, and Vimentin. (C) Cell, single cells, and DAPI gating for flow cytometry analysis. High number of events was observed in all population. DAPI: 4’,6-diamidino-2-phenylindole; GFAP: glial fibrillary acidic protein.
Finally, in order to determine if these effects were due to the injection of C6 cells in the optic nerve, we analyzed the proliferation and Vimentin (type II intermediate filament) expression near the injection site. Ki67, proliferation marker, expression was found to be high in the region near the injection site while being negative in the control eyes (Fig. 7A). Vimentin is highly expressed in C6 cell line 10 . Colocalization of proliferative and Vimentin positive cells was found in the test eyes (Fig. 7B), suggesting the presence of C6 cells creating a tumor near the injection site. The analysis on these multiple staining suggests the formation of neuroglioma in the tissue where C6 cells were injected. These results suggest that we created a short-term animal model able to simulate the Neurofibromatosis Type 1 Optic Pathway Glioma (NF1-OPG) environment.
In vivo immunostaining of C6 cells. Images taken under fluorescence microscopy to assess C6 cell proliferation and Vimentin expression. All images were taken at ×20 magnification. DAPI (VioBlue) staining was performed to show cell nuclei, Ki67 (FITC) staining shows proliferative cells, and Vimentin (APC) is a marker of Muller glia and C6 cells (as described in flow cytometry). Control tissue (A) shows no Ki67 positive cells and some Vimentin staining (being the results of Muller cell expressing Vimentin). However, test tissue (B) shows high Vimentin response with some C6 cells expressing Ki67. APC: antigen presenting cell; DAPI: 4’,6-diamidino-2-phenylindole; FITC: fluorescein isothiocyanate.
C6 Phenotype Characterization by Flow Cytometry Assay
We quantified C6 expression using flow cytometry to analyze up- or downregulation of key tumor and immune cell markers along with stemness markers (Fig. 6B). The absence of standard errors of the mean in Fig. 6 is due to the methodology of averaging events measured by the flow cytometer. The same gating strategy (i.e., the population of events, to be considered as positive) was applied for all markers: gating the cell population (FSC-A vs. SSC-A), gating the single cell population (FSC-A vs. FSC-H), and then gating the DAPI positive population (VioBlue-A vs. FSC-A), as seen in Fig. 6C. The single-cell DAPI-positive gate yielded the number of cells to be employed for comparison of all markers.
Both GFAP (an activated muller cell marker) and CD45 (immune cell marker) expressions were lower than the isotype control used. This finding indicates that, as seen in other studies 10 , C6 cells do not express GFAP nor immune cell markers. However, S100 (tumor cell markers) was expressed in about 25% of the population, indicating the expression of tumor markers in C6 cells, while Ki67 (proliferative marker) was expressed in 47% of the population, indicative of their ability to rapidly proliferate. Finally, Vimentin was found to be expressed in almost all C6 cells analyzed (98%), which is consistent with other studies stating the high expression of Vimentin in C6 cell population 10 .
Overall, the phenotype analysis of C6 cells suggest their ability to proliferate and their specific tumor cell phenotype, suggesting this cell line may be a suitable candidate for induction of optic nerve tumors through transplantation and creating a model for studying NF1-OPG conditions in a rat.
Discussion
Optic nerve glioma is termed as pilocytic astrocytoma WHO grade I 14 . These are extremely benign compared to other types of astrocytoma, with the most aggressive form reported being glioblastoma multiforme. OPG primarily involves and impacts astrocytes. Tumors are architecturally well defined and can be found at almost any site within the CNS. This is a gene abnormality that causes overproduction of astrocytes and can be linked to the malfunction of a gene that controls proteins in several cell proliferation pathways such as mTOR and MAPK 15 . This hereditary disorder is frequently associated with NF1 and its downstream product neurofibromin. Neurofibromin is a tumor suppressor and its suppression results in uncontrolled cell proliferation 16 . Most OPG cases present in first two decades of life and can form anywhere along the optic pathway including nerves, chiasm, and post-chiasmatic tracts (as seen in Fig. 1A). Depending upon the location of the tumor, signs and symptoms of the disease varies. OPG mostly results in unilateral proptosis, loss of visual acuity, defect in visual field, relative afferent pupillary defect, strabismus and optic disc edema (papilledema), or sometimes atrophy 17 . Tumors that occur in the optic tracts and optic radiation mostly exhibit visual acuity deficits along with other neurological symptoms depending upon the involvement of adjacent structures 18 .
Most of the OPG models in mice or rats have described C6 cells injection into the brain 19,20 ; however, to simulate the optic nerve glioma we have injected C6 directly into the optic nerve and allowed C6 cells to invade the host tissue. The growth characteristics resemble that of human glioma and these models can be readily made at lower cost and shorter time than comparable large animal models. Moreover, the larger size of the rat eye compared to mouse enables surgical and other interventional studies. This technique has advantages over brain inoculation, which often causes a degree of brain damage due to the surgical procedure and growth into adjacent structures.
In our experiment, 2 weeks postinjection, all animals showed formation of cataract and cloudy lens due to increase in the intraocular pressure 21 . Out of 30 rats injected, 27 showed varying form of proptosis. Upon enucleation, fusiform appearance is noted in the C6 injected rats, which is typically noted in optic nerve gliomas. Besides the gross examination, statistical analysis was performed to evaluate the surface coverage of tumors. In all the test animals the tumor was noted; however, in three animals, the size of tumor was smaller in diameter in comparison to the other test tissues. Postsectioning, H&E was performed and showed massive infiltration of cells with hyperchromatism and pleomorphism markers. The large multilobed, irregular nuclei showing neoplastic characteristics were observed. A prominent area of necrosis could also be seen in the test animals. Direct comparison between control and test optic nerves indicated alteration in lamellar structure. C6 cells are known to overexpress S100 protein, which is useful marker for certain types of tumors and epidermal differentiation 11 . Expression increases 10-fold when cells grow from low density toward confluency. This protein can be found in melanomas and schwannomas (100%) neurofibromas (100% usually lesser intensity than schwannomas), along with nerve sheath tumor (can be weak or focal). Staining of the test animals showed high S100 positive expression indicating highly proliferative C6 throughout the optic nerve.
Microglia, macrophages, and other immune surveillance cells are largely quiescent in normal CNS. These cells are major immune cells population that helps maintain retinal homeostasis. Recently, microglial have been identified as APCs of the CNS and any injury or insult to the neural tissue activates these cells. One of the most common markers to study the immune response is CD45 staining for infiltrating cells 13 . FOXP3 staining of the C6 injected animals showed high expression along the entire length of optic nerve. FOXP3 (forkhead box P3), also known as scurfin, is a protein involved in immune system responses. A member of the FOX protein family, FOXP3, functions as a master regulator for the regulatory pathway involved in development and function of regulatory T cells. These regulatory T cells generally turn the immune response down but in tumor/cancer, an excess of activity of these can prevent the immune system from destroying cancer cells 22 . In C6 injected tissues, vimentin positive areas colocalizing with ki67 positive cells were observed. In case of neurodegeneration, inflammation or trauma upregulation of cytoskeletal components like vimentin and GFAP can be seen 23 . Vimentin filament protein is often used as marker of tumor cell invasion. In this experiment, vimentin expression was negative in control eyes, whereas in area of tumor (test), necrosis vimentin staining was high suggesting initial phase of astrocyte activation.
In conclusion, the pathological mechanism of OPG development in NF1 is not completely understood and this has made the development of effective therapeutics difficult. One limitation is due to limited availability of biological samples due to low rate of surgery; therefore, patient-derived models for these tumors remain sparse. There is no one model that can fully recapitulate the NF-1 OPG phenotype, but a combination of animal models using patient derived or engineered cells can aid development of future translational science. Developing a rat model for NF-1 OPG is potentially useful as it provides a relatively small and rapidly developing target to test novel therapeutics. A preclinical model for this disease can help understand the pathophysiology and promote clinical trials for biological drugs and small molecules that are presently difficult to advance.
Our aim of this study is to create a simple and short-term animal model for drug screening. The NF-1 OPG is an extremely slow-growing tumor and we have tried to create a model that can replicate the disease progression in short duration that makes testing therapeutics more feasible.
Conclusion
In summary, we have created a rat experimental model presenting growing gliomas in the optic nerve. Since injecting cells into the optic never of mice is a highly delicate procedure, rats could be a better alternative and could be used for various preclinical studies. Injecting C6 cells directly into the optic nerve is a relatively rapid and simple procedure and could be a useful model for testing various treatment interventions without causing severe damage to the brain or axonal tissues, which is usually noted with intraventricular injections.
Footnotes
Data Accessibility
Data can be accessed by contacting first or corresponding author on demand.
Acknowledgments
PCD would like to acknowledge the funding for his PhD and his PhD advisor Dr. Myron Spector for his inputs throughout the project and DS would like to acknowledge “The Gilbert family foundation” for the support provided to complete this study.
Ethical Approval
This study was approved by institutional IACUC committee, Schepens Eye Research Institute, Boston, protocol no # S367-0316.
Statement of Human and Animal Rights
All of the experimental procedures involving animals were conducted in accordance with the guidelines from the institutional IACUC committee, Schepens Eye Research Institute, Boston, protocol no # S367-0316.
Statement of Informed Consent
There are no human subjects in this article and informed consent is not applicable.
Declaration of Conflicting Interests
The author(s) declared no potential conflicts of interest with respect to the research, authorship, and/or publication of this article.
Funding
The author(s) disclosed receipt of the following financial support for the research, authorship, and/or publication of this article: This project was funded and is part of a running grant from the Rosalinde and Arthur Gilbert Foundation, no: 571921.