
Abstract
Neuroblastoma, a malignant tumor of the sympathetic nervous system, is an aggressive extracranial tumor in childhood. Long noncoding RNAs (lncRNAs) have been discovered to play a key role in the eukaryotic regulatory gene network and be involved in a wide variety of biological processes. We observed that the expression of lncRNA nuclear-enriched abundant transcript-1 (NEAT1) was significantly decreased in human neuroblastoma tissues and cell lines, compared with the normal. We observed cell proliferation, migration, and invasion with Cell Counting Kit-8 assay, colony formation assay, and Transwell assay to investigate the effects of NEAT1, miR-183-5p, or FOXP1 on neuroblastoma cells. And we also used StarBase and luciferase reporter gene assay to predict and confirm the interaction of NEAT1, miR-183-5p, and FOXP1 in neuroblastoma cells. First, overexpression of NEAT1 suppressed cell proliferation and played a key role in cell migration and invasion. In addition, NEAT1 was demonstrated to directly interact with miR-183-5p and exerted its antioncogenic role in neuroblastoma by negatively regulating miR-183-5p expression. miR-183-5p suppressed the expression of FOXP1 and regulated cell proliferation and migration by directly targeting FOXP1 mRNA 3′-untranslated region. Moreover, FOXP1 antagonized the effect of miR-183-5p on the phosphorylation of extracellular-regulated kinase/protein kinase B (ERK/AKT), while FOXP1 siRNA increased the reduced phosphorylation of ERK/AKT caused by miR-183-5p inhibitor in neuroblastoma cells. Taken together, these data showed that NEAT1 negatively regulated cell proliferation and migration of neuroblastoma by the miR-183-5p/FOXP1 axis via suppression of the ERK/AKT pathway. Our findings may provide a new target for the study of pathogenesis and treatment of neuroblastoma.
Introduction
Neuroblastoma (NB), a malignant tumor of the sympathetic nervous system, is an aggressive childhood tumor accounting for 8% to 10% of childhood tumors 1 . Despite multimodal treatment regimen, children with high-risk clinical phenotypes still have poor prognosis and long-term survival rates of less than 40% 2 . While some favorable NBs are easy to treat, almost 50% of unfavorable NBs with widespread tumor dissemination and late recurrence exhibit very aggressive behaviors 3 . The signs and symptoms of NB vary widely, depending on age, primary tumor site, presence of metastases, and occasional on paraneoplastic syndrome 1 . The clinical manifestation of NB is heterogeneous and high-risk aggressive, with the most affected sites being bone, bone marrow, and lymph nodes 4 . Standard therapy for high-risk NB patients has at least four components: induction, local control, consolidation, and treatment of minimal disease with biologic agents. Among the current treatments for high-risk NB patients, novel diagnostic, prognostic, and therapeutic approaches are required to improve treatment outcomes.
Long noncoding RNAs (lncRNAs), a class of noncoding RNAs with more than 200 nucleotides, have been discovered to play a key role in the eukaryotic regulatory gene network 5 . A significant number of lncRNAs have been functionally involved in a wide variety of biological processes such as cell proliferation, invasion, and metastasis during cancer development. For example, lncRNA metastasis-associated lung adenocarcinoma transcript-1 (MALAT1) promoted glioblastoma (GBM) cell proliferation and progression in vitro and in vivo, and was negatively correlated with GBM patient survival 6 . MEG3/miR-21 axis influenced the proliferation and apoptosis of psoriasis keratinocyte 7 . Similar to other human cancers, it was reported that several lncRNAs played important roles in neurodegenerative diseases, including Parkinson’s disease, Alzheimer’s disease, and Huntington’s disease 8 . In addition, lncRNA nuclear-enriched abundant transcript-1 (NEAT1) contributed to many other human cancers. NEAT1 regulated the oxygen and glucose deprivation–reperfusion injury and neuroinflammation damage via the Wnt/β-catenin signaling pathway in cerebral microglial cells 9 . It was confirmed that serine/arginine-rich splicing factor 1 (SRSF1) targeted NEAT1 and implicated in gliomagenesis by regulating cell cycle 10 . It was also reported that NEAT1 was overexpressed in Parkinson’s disease substantia nigra and conferred drug-inducible neuroprotection from oxidative stress 11 . However, the role of lncRNA NEAT1 in NB remains unclear.
In this study, we investigated the expression of lncRNA NEAT1 in the human NB tissue samples and different NB cell lines. Then we observed cell proliferation, migration, and invasion with Cell Counting Kit-8 (CCK-8) assay, colony formation assay, and Transwell assay to investigate the effects of NEAT1 in NB cells.
Materials and Methods
Cell Culture and Tissue Samples
The tissue samples used in the present study were obtained from NB patients (stage Ⅰ, n = 5; stage Ⅱ, n = 12; stage Ⅲ, n = 9; stage Ⅳ, n = 4). The protocol was approved by the Ethics Committee of The Second Affiliated Hospital of Xi’an Jiaotong University (Xi’an, China). Human NB cell lines (SK-N-SH, SH-SY5Y, IMR-32, and SH-N-AS) and human umbilical vein endothelial cell line were purchased from ATCC (Manassas, VA, USA). All cells were resuspended in Dulbecco’s modified Eagle medium (Thermo Fisher Scientific, Waltham, MA, USA) mixture supplemented with 10% fetal bovine serum (FBS; Gibco, Carlsbad, CA, USA), 100 U/ml penicillin, and 100 μg/ml streptomycin (Thermo Fisher Scientific) in a humidified incubator containing 5% CO2 at 37°C.
Cell Transfection
To overexpress NEAT1, the NEAT1 genomic fragment was cloned by polymerase chain reaction (PCR) and then inserted into the pcDNA3.1 empty vector. Different cell lines of human NB cells were planted in six-well plates at about 70% confluence, and then transfected transiently with miR-183-3p mimic, miR-183-5p inhibitor, their negative control, siRNA against FOXP1 (si-FOXP1), and scrambled siRNA negative control (Lonza, Walkersville, MA, USA), following the manufacturer’s instructions.
RNA Extraction and Real-Time Quantitative Polymerase Chain Reaction Analysis
Total RNAs of tissue samples and human NB cells were extracted in accordance with the instruction of Trizol reagent (Thermo Fisher Scientific). The reverse transcription of mRNA was performed using the High-Capacity complementary DNA Reverse Transcription Kit (Thermo Fisher Scientific). The mRNA level was quantified by real-time quantitative polymerase chain reaction (RT-qPCR) using an SYBR Premix Ex Taq (TaKaRa Biotech, Dalian, China), and U6 RNA was used as the endogenous control. The experimental operation was repeated at least three times independently. The experiment used a 20-µl reaction system: cDNA (1 μl), specific primers (1 μl), SYBR Green Mix (10 μl), and ddH2O (7 μl). All PCR steps were performed on the ABI 7300 Real Time PCR System (Thermo Fisher Scientific) under the following conditions: 95°C for 1 min followed by 35 cycles of 95°C for 20 s, then 56°C for 10 s, and 72°C for 15 s and data were analyzed using the relative quantification 2-ΔΔCT method.
Cell Proliferation Assay
CCK8 (Dojindo, Kumamoto, Japan) method was used to measure the cell proliferation efficiency after transfection for 48 h. First, cells were grown at a rate of 5 × 10⁴ cells/well in 24-well plates containing 8 µl CCK-8 plus 100 µl FBS-free medium. We then measured the cell proliferation efficiency at 24, 48, 72, and 96 h and the absorbance was read at 450 nm. Cells were incubated in a humidified incubator containing 5% CO2 at 37°C.
Colony Formation Assay
To assess colony-forming ability, the transfected cells were suspended into agarose plates at 500 cells/well and cultured for 2 wk. The cells were then fixed and stained with 0.1% crystal violet in 4% methanol solution. Colonies were observed and counted under an inverted microscope.
Transwell assay
The migration and invasion of human NB cells were measured by Transwell assay. For cell migration, cells were suspended in 200 µl of serum-free medium and placed in the upper chamber of 24-well Transwell plates (Corning, NY, USA) after transfection. The lower chamber was filled with 500 µl of medium containing 20% FBS. After 24 h of incubation at 37°C, the residual cells remained on the upper surface of the filters. The migrated cells on the lower filter surface were fixed with 4% formaldehyde and stained with 0.1% crystal violet for visualization. The stained cells were counted under an optical microscope. Similar to the migration assay, excluded cells were seeded onto a Matrigel-coated upper chamber for the invasion assay.
Luciferase Reporter Gene Assay
Target gene analysis was performed using the online database of StarBase biological prediction website (http://starbase.sysu.edu.cn/). The full length of the 3′ untranslated region (3′-UTR) of the FOXP1 mRNA or full-length NEAT1 mRNA was cloned and amplified, then the PCR product was cloned into the polyclonal loci downstream of the pmir-GLO luciferase gene (Promega, Madison, WI, USA). Cells co-transfected were in HEK293 T cells (Shanghai, china), and the luciferase activity was measured using a Synergy 2 Multi-detector Microplate Reader (BioTek Instruments, Inc., Winooski, VT, USA). The experiment was independently repeated three times. Data were normalized for transfection efficiency by dividing firefly luciferase activity by Renilla luciferase activity.
Western Blot Analysis
PBS was used to wash the human NB cells twice, and the cells lysed using RIPA lysis buffer (CW Biotech, Beijing, China). Protein concentration was measured by BCA kit (KeyGEN, Nanjing, China) and adjusted to 3 μg/µl before conducting western blot. Ten microliters of boiled proteins per well with 5× loading buffer (Beyotime Biotechnology, China) were separated in 12% sodium dodecyl sulfate polyacrylamide gel electrophoresis at 70 V for 20 min and 100 V for 100 min. Samples were then transferred to polyvinylidene difluoride membranes (Millipore, Bedford, MA, USA) at 350 mA for 105 min. Then the membranes were blocked with 5% nonfat milk 2 h incubated with primary antibodies. The following antibodies were, respectively, used to incubate with the membrane at 4°C overnight: ERK antibody (1:500 dilution, ab176660, Abcam, Cambridge, UK), AKT antibody (1:400 dilution, ab142088, Abcam), S6 antibody (1: 300 dilution, ab70271, Abcam), FOXP1 antibody (1:600 dilution, ab16645, Abcam), and β-actin antibody (1:300 dilution, ab181602, Abcam). β-actin was set as the endogenous control. After three times washing with Tris-buffered saline-Tween (TBS-T), the following secondary antibodies were, respectively, used to incubate with the membrane for 1 h at room temperature: ERK antibody (1:1,200 dilution, ab205718, Abcam), AKT antibody (1:1,200 dilution, ab205718, Abcam), S6 antibody (1: 1,000 dilution, 205718, Abcam), FOXP1 antibody (1:1,500 dilution, ab205718, Abcam), and β-actin antibody (1:1,000 dilution, ab205718, Abcam). The enhanced chemiluminescence system was used to show the banding of proteins, and the optical density of the protein bands was quantified using Image J software (National Institutes of Health, Bethesda, MD, USA). Each experiment was performed three times to obtain a mean value. The relative expression level of the target gene was displayed as the fold change versus control group.
RNA Pull-Down Assay
HEK293 cells were transfected with biotinylated miRNA (200 nM) and harvested 24 h after transfection. Briefly, the cells were washed with PBS followed by brief vortex, and incubated in a lysis buffer on ice for 10 min. The lysates were precleared by centrifugation, and 50 µl of the samples were aliquoted for input. The remaining lysates were incubated with streptavidin magnetic beads (Thermo Fisher Scientific). After coated with RNase-free bovine serum albumin and yeast tRNA (both from Sigma), the beads were incubated at 4°C for 3 h, washed twice with ice-cold lysis buffer, three times with the low-salt buffer, and once with the high-salt buffer. The bound RNAs were purified using TRIzol and then for NEAT1 expression analysis by RT-qPCR.
Statistical Analysis
Data analysis was performed with SPSS version 22.0 software. Each measurement was obtained from at least three experiments and expressed as the mean ± standard error of mean. Statistical significance difference was set at P < 0.05 using one-way variation analysis followed by student’s t-test.
Results
NEAT1 was Downregulated in Human NB Tissues and Cell Lines
To explore the potential role of NEAT1 in human NB, we detected its expression in human NB tissues and different cell lines using RT-qPCR analysis. As presented in Fig. 1, expression of NEAT1 was significantly decreased (Fig. 1A–C) in human NB tissues compared with the adjacent normal tissues. We also observed different transcript levels in different NB stages, and expression of NEAT1 was the lowest in stage IV (Fig. 1B) and substantially decreased in patients older than 18 mo (Fig. 1C). To further confirm downregulation of NEAT1, we detected transcript levels in different NB cell lines, and the expression of NEAT1 was significantly downregulated (Fig. 1D).

Expression of NEAT1 in human neuroblastoma tissues and cell lines using real-time quantitative polymerase chain reaction analysis. (A) Expression of NEAT1 in human neuroblastoma tissues (n = 30) and normal tissues (n = 30). β-actin was used as an internal reference. (B) Expression of NEAT1 in different tumor stages (stage I, n = 5; stage II, n = 12; stage III, n = 9; stage IV, n = 4). (C) Expression of NEAT1 in different age groups (n < 18 mo and n > 18 mo). (D) Expression of NEAT1 in different cell lines. Statistical significance was determined using an independent-sample t-test. Values were expressed as mean ± standard error of mean, n = 3. *P < 0.05 and **P < 0.01 vs normal or control. NB: neuroblastoma; NEAT1: nuclear-enriched abundant transcript-1; HUVEC: human umbilical vein endothelial cell.
NEAT1 Overexpression Promoted the Cell Proliferation, Migration, and Invasion in NB Cells
To investigate the precise biological function of NEAT1 in NB, we performed gain-of-function experiments by overexpressing NEAT1. NEAT1 overexpression was achieved by transfecting different doses of the pcDNA-NEAT1 (1 or 2 μg/ml) into SK-N-SH or SH-SY5Y NB cell lines and its transfection efficiency was detected by RT-qPCR (Fig. 2A, B). Next, we examined the effect of NEAT1 overexpression on the cell proliferation, migration, and invasion in NB cell lines (SK-N-SH or SH-SY5Y). It was revealed using the colony formation assay that the upregulation of NEAT1 decreased the colony-forming ability of SK-N-SH or SH-SY5Y cells (Fig. 2C, D). The CCK-8 assay implied that overexpression of NEAT1 also significantly inhibited the proliferation of NB cells (Fig. 2E, F). In addition, the Transwell assay detected that the upregulation of NEAT1 significantly reduced the migrative and invasive abilities of NB cells (Fig. 2G–I). All of these results showed that transfection with 2μg/ml pcDNA-NEAT1 regulated the cell proliferation, migration, and invasion of NB more effectively . Collectively, these data showed that the upregulation of NEAT1 inhibited the cell proliferation, migration, and invasion in NB cells.

NEAT1 overexpression regulated the cell proliferation, migration, and invasion in neuroblastoma cells. (A, B) real-time quantitative polymerase chain reaction was performed to determine the expression of NEAT1 in SK-N-SH or SH-SY5Y neuroblastoma cells (1.0 × 10⁵/cm2) transfected with pcDNA3.1 (vector, 1 μg/ml), pcDNA-NEAT1 (1 or 2 μg/ml), or control. (C, D) The colony-forming ability was tested by using the colony formation assay. (E, F) Cell proliferation ability was tested by Cell Counting Kit-8. (G–I) The Transwell assay detected the migrative and invasive abilities in neuroblastoma cells. Neuroblastoma cells were transfected with pcDNA-NEAT1 for 48 h. Statistical significance was determined using an independent-sample t-test. Values were expressed as mean ± standard error of mean, n = 3. *P < 0.05 and **P < 0.01 vs vector or control. # P < 0.05 and ## P < 0.01 vs vector or control. NEAT1: nuclear-enriched abundant transcript-1.
Mir-183-5p MiR-183-5p Was a Target of NEAT1 and Was Upregulated in NB Cells
As known to all, one of the most typical regulatory mechanisms of lncRNAs is to negatively regulate the expression and activity of miRNAs as ceRNAs or molecular sponges of miRNAs. Bioinformatic analysis with online database of StarBase (http://starbase.sysu.edu.cn/) showed that NEAT1 directly bound to miR-183-5p (Fig. 3A). To test whether NEAT1 binds to miR-183-5p, we used the luciferase reporter gene assay to validate the binding of them. The results indicated that NEAT1 directly bound to miR-183-5p (Fig. 3B). HEK293 cells were transfected with biotinylated miR-183-5p or its mutant form, and then a biotin-based pull-down assay was performed to detect NEAT1 expression and normalized to a biotinylated mimic control by RT-qPCR (Fig. 3C). Moreover, we detected expression of miR-183-5p in human NB tissues and different cell lines by using RT-qPCR analysis. It was found that miR-183-5p was significantly upregulated in human NB tissues and different cell lines (Fig. 3D, E). As showed in Fig. 3, overexpression of NEAT1 significantly downregulated the expression of miR-183-5p in NB cell lines SK-N-SH or SH-SY5Y (Fig. 3F, G). These results demonstrated that NEAT1 negatively modulated miR-183-5p expression by binding to its 3′-UTR and might serve as a molecular sponge.

NEAT1 directly targeted miR-183-5p. (A) Online database StarBase showed sequence alignment between NEAT1 and miR-183-5p. (B) The luciferase reporter gene assay validated the binding of NEAT1 and miR-183-5p. Firefly and Renilla luciferase activities were determined. (C) HEK293 cells were transfected with biotinylated miR-183-5p (Bio-183-5p-wt) or its mutant form (Bio-183-5p-mut), and then a biotin-based pull-down assay was performed to detect NEAT1 expression and normalized to a biotinylated mimic control (Bio-NC) by RT-qPCR. (D) Expression of mir-183-5p in different cell lines. (E) Expression of miR-183-5p in human neuroblastoma tissues (n = 30) and normal tissues (n = 30). U6 was used as an internal reference. (F, G) Effect of NEAT1 overexpression on miR-183-5p in SK-N-SH or SH-SY5Y neuroblastoma cells. RT-qPCR was performed to determine the expression of mir-183-5p. Statistical significance was determined using an independent-sample t-test. Values were expressed as mean ± standard error of mean, n = 3. *P < 0.05 and **P < 0.01 vs normal or control. HUVEC: human umbilical vein endothelial cell; NB: neuroblastoma; NEAT1: nuclear-enriched abundant transcript-1; RT-qPCR: real-time quantitative polymerase chain reaction.
MiR-183-5p Promoted the Cell Proliferation, Migration, and Invasion in NB Cells
To study the effect of miR-183-5p on the biological function of NB, we transfected miR-183-5p mimic, inhibitor, and the corresponding negative control oligonucleotides, respectively, in NB cells. First, we tested the expression of miR-183-5p after transfection with different oligonucleotides to detect whether the transfection was successful. Expression of miR-183-5p was significantly upregulated after transfection with miR-183-5p mimic, while expression of miR-183-5p was significantly downregulated after transfection with miR-183-5p inhibitor in NB cell lines SK-N-SH or SH-SY5Y (Fig. 4A, E). Next, we examined the effect of transfection with miR-183-5p mimic or miR-183-5p inhibitor on the proliferation, migration, and invasion in SK-N-SH or SH-SY5Y. The colony formation assay indicated that miR-183-5p mimic promoted the colony-forming ability in SK-N-SH or SH-SY5Y cells, while miR-183-5p inhibitor decreased the colony-forming ability (Fig. 4B, F). Moreover, the Transwell assay detected that upregulation of miR-183-5p significantly promoted the migrative (Fig. 4C, G) and invasive abilities in NB cells (Fig. 4D, H), while downregulation of miR-183-5p decreased the migrative (Fig. 4C, G) and invasive abilities (Fig. 4D, H). These results indicated that miR-183-5p also significantly promoted the cell proliferation, migration, and invasion in NB cells.
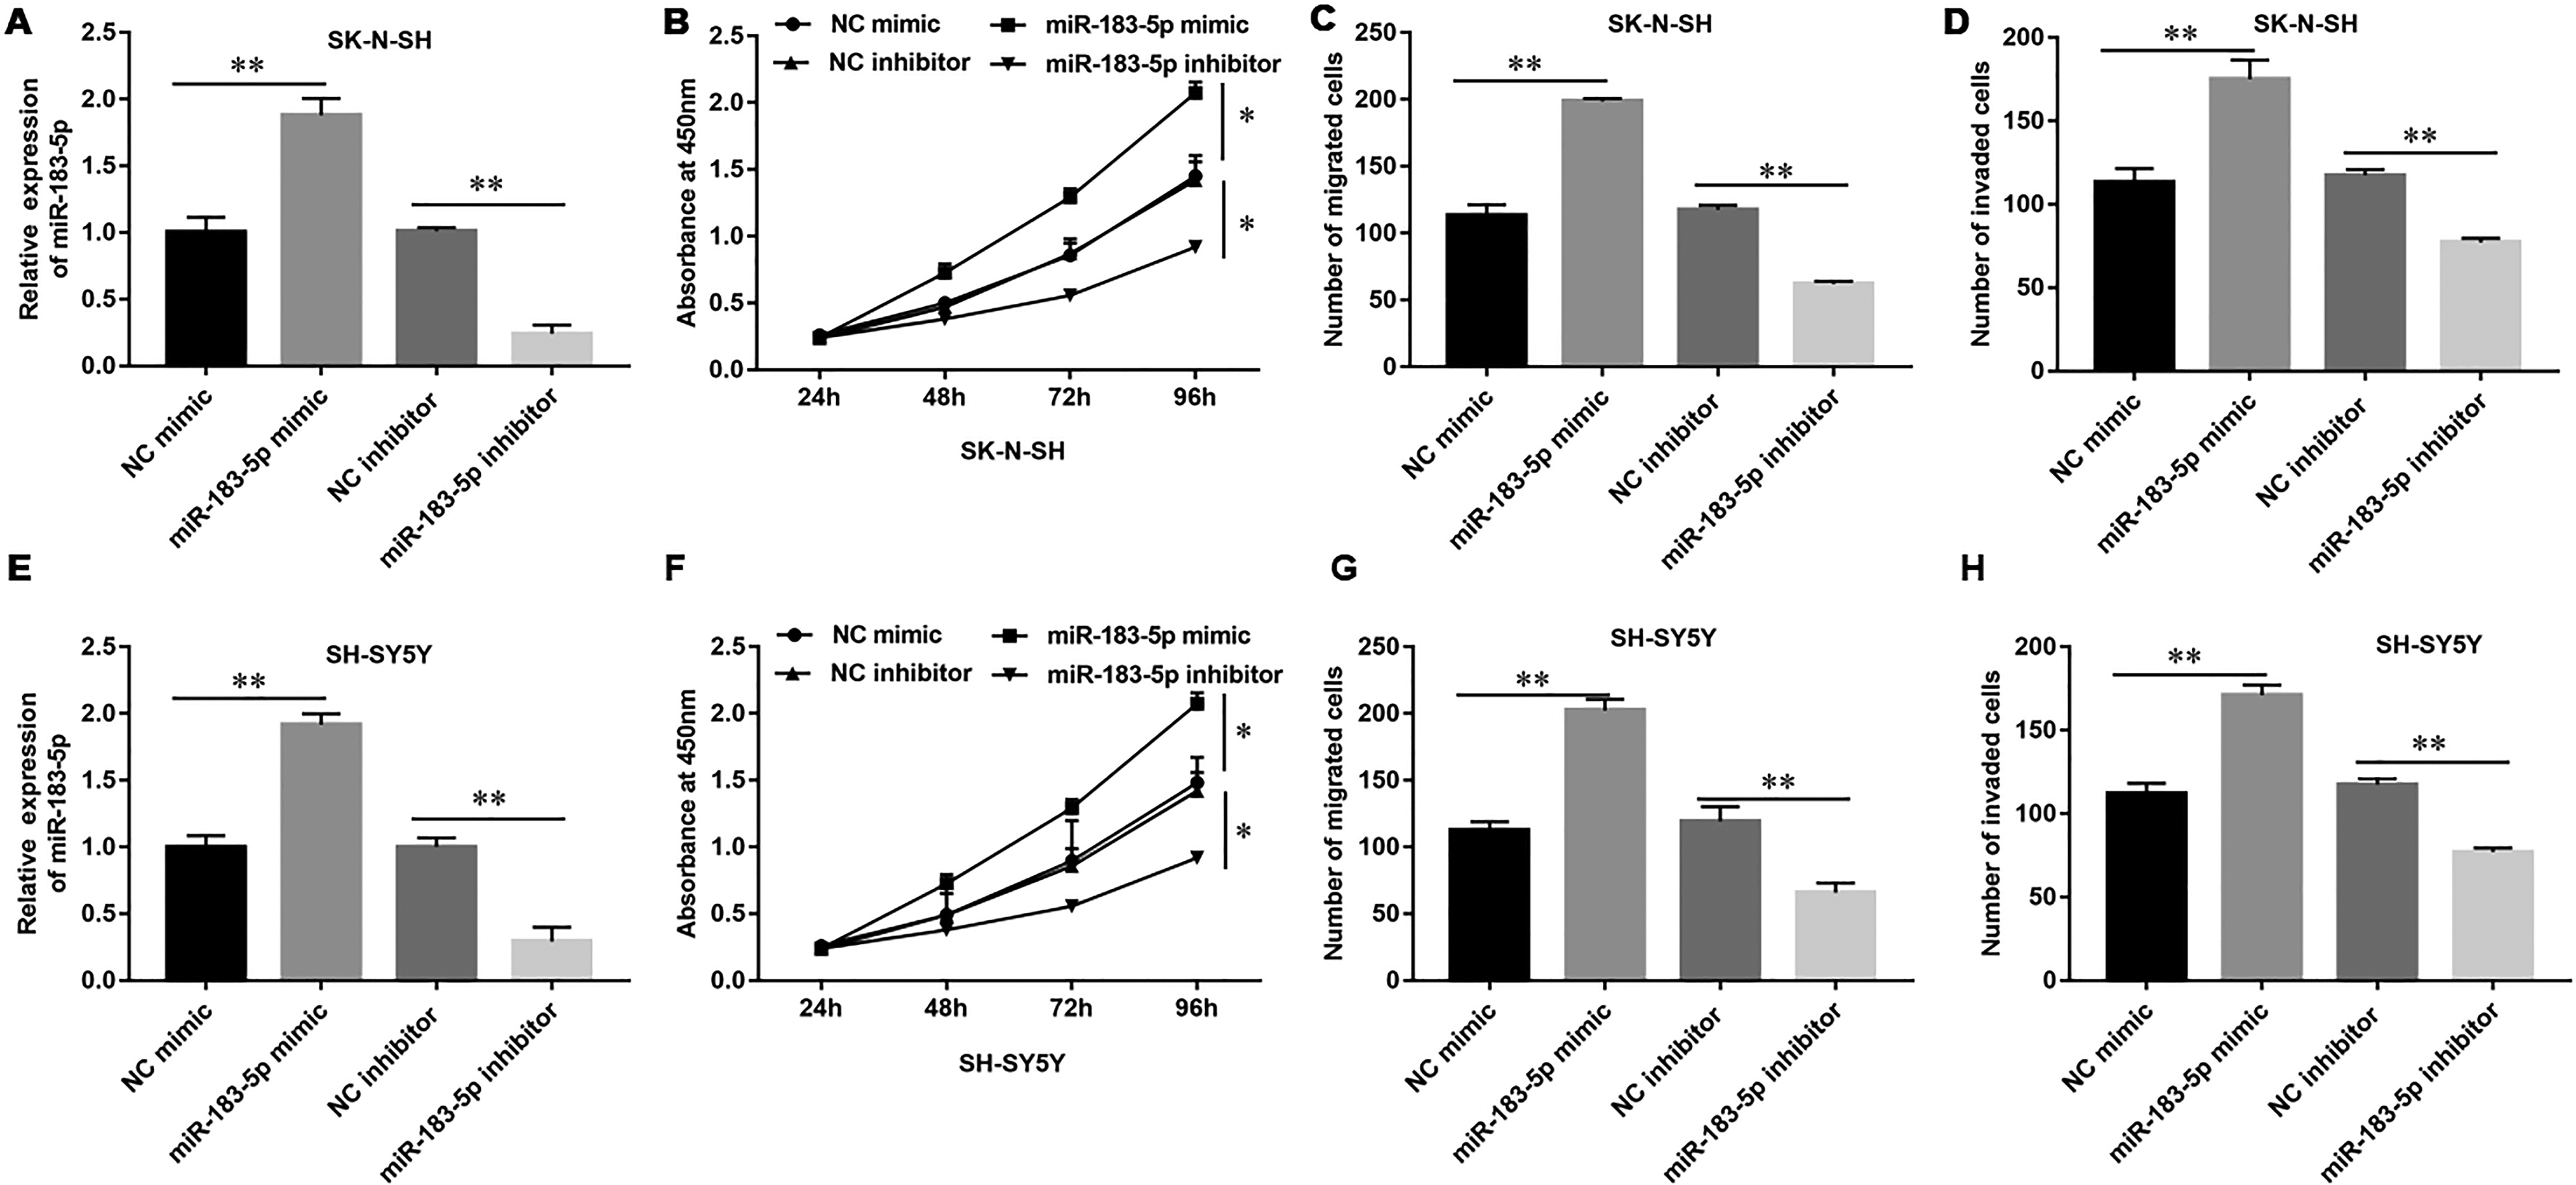
MiR-183-5p overexpression promoted the cell proliferation, migration, and invasion in neuroblastoma cells. SK-N-SH or SH-SY5Y neuroblastoma cells (1.0 × 10⁵/cm2) were transfected with NC mimic (20 nM), miR-183-5p mimic (20 nM), NC inhibitor (20 nM), and miR-183-5p inhibitor (20 nM) for 48 h. (A) Expression of miR-183-5p was transfected with miR-183-5p mimic, miR-183-5p inhibitor, and control (NC mimic and NC inhibitor) in SK-N-SH cells and (E) SH-SY5Y cells. (B) The capacity of cell proliferation was tested by Cell Counting Kit 8 in SK-N-SH cells and (F) SH-SY5Y cells. (C, D) Transwell assay detected the migrative and invasive abilities in SK-N-SH cells and (G, H) SH-SY5Y cells. Statistical significance was determined using an independent-sample t-test. Values were expressed as mean ± standard error of mean, n = 3. *P < 0.05 and **P < 0.01 vs NC mimic or NC inhibitor.
MiR-183-5p Overexpression Reversed the Effect of NEAT1 on Inhibiting Cell Proliferation and Migration in NB Cells
In order to further validate the correlation between NEAT1 and miR-183-5p, NB cells were co-transfected with pcDNA-NEAT1 (2 μg/ml) and miR-183-5p mimic. Mir-183-5p significantly reversed the inhibition of cell proliferation induced by pcDNA-NEAT1 (Fig. 5A, E). Next, we investigated the colony-forming, migrative, and invasive capacities under the same treatment with pcDNA-NEAT1 and miR-183-5p mimic. As shown in the figures, miR-183-5p could restore pcDNA-NEAT1-mediated inhibition of colony-forming (Fig. 5B, F), migrative (Fig. 5C, G), and invasive capacities (Fig. 5D, H). Collectively, these results suggested that NEAT1 overexpression inhibited cell proliferation, migration, and invasion in NB cells by targeting miR-183-5p.

MiR-183-5p overexpression reversed the effect of NEAT1 in neuroblastoma cells. SK-N-SH or SH-SY5Y neuroblastoma cells (1.0 × 10⁵/cm2) were co-transfected with pcDNA-NEAT1 (2 μg/ml) and miR-183-5p mimic (20 nM) for 48 h. (A) The capacity of cell proliferation was tested by Cell Counting Kit 8 in SK-N-SH cells and (E) SH-SY5Y cells. (B) The colony-forming capacity was tested by colony formation assay in SK-N-SH cells and (F) SH-SY5Y cells. (C, D) The Transwell assay detected the migrative and invasive abilities in SK-N-SH cells and (G, H) SH-SY5Y cells. Statistical significance was determined using an independent-sample t-test. Values were expressed as mean ± standard error of mean, n = 3. *P < 0.05 and **P < 0.01 vs control. NEAT1: nuclear-enriched abundant transcript-1.
MiR-183-5p Targeted FOXP1 in NB Cells
To investigate the mechanisms of miR-183-5p in NB cells, we used online database of StarBase (http://starbase.sysu.edu.cn/) to bioinformatic analysis. It showed that miR-183-5p directly binds to FOXP1 3′-UTR (Fig. 6A). To test whether miR-183-5p binds to FOXP1 3′-UTR, we used luciferase reporter gene assay to validate. As the results showed, miR-183-5p directly binds to FOXP1 3′-UTR (Fig. 6B). Then we detected the expression of FOXP1 in human NB tissues and different cell lines by western blot analysis (Fig. 6C). The results indicated that FOXP1 was significantly downregulated in human NB tissues and different cell lines (Fig. 6D, E). In order to assess the effect of miR-183-5p on FOXP1, we transfected with miR-183-5p mimic, miR-183-5p inhibitor, and corresponding negative control oligos in NB cells, respectively. These results showed that the expression of FOXP1 was significantly decreased after transfection with miR-183-5p mimic and upregulated after transfection with miR-183-5p inhibitor (Fig. 6F–H). It has been demonstrated that FOXP1 might participate in the phosphorylation of ERK and AKT, so we detected the phosphorylation of ERK, AKT, and pS6 in NB cells (Fig. 6I). Results showed that transfection with miR-183-5p mimic induced the phosphorylation, while miR-183-5p inhibitor suppressed the phosphorylation of ERK, AKT, and pS6 in NB cells (Fig. 6J–L). These results suggested that miR-183-5p/FOXP1 induced the ERK/AKT pathway.

MiR-183-5p directly targeted FOXP1. (A) Online database StarBase showed sequence alignment between miR-183-5p and FOXP1. (B) The luciferase reporter gene assay validated the binding of miR-183-5p and FOXP1. Firefly and Renilla luciferase activities were determined. (C) Expression of FOXP1 in different cell lines was tested by using western blot analysis. (D) The quantification of band intensity relative to β-actin intensity of (C) was quantified by MBF ImageJ software. (E) Expression of FOXP1 in human neuroblastoma tissues (n = 30) and normal tissues (n = 30). β-actin was used as an internal reference. (F) Effect of miR-183-5p on FOXP1 in SK-N-SH or (G) SH-SY5Y neuroblastoma cells and the quantification of band intensity relative to β-actin intensity of (F, G) was quantified by MBF ImageJ software. (H) Expression of FOXP1 in different cell lines was tested by using western blot analysis. (I) Western blot detected the phosphorylation of ERK, AKT, and pS6 in neuroblastoma cells. (J–L) The quantification of band intensity relative to β-actin intensity of (I) was quantified by MBF ImageJ software. Statistical significance was determined using an independent-sample t-test. Values were expressed as mean ± standard error of mean, n = 3. *P < 0.05 and **P < 0.01 vs normal or control.
MiR-183-5p Participated in the ERK/AKT Pathway by Targeting FOXP1
To further validate the correlation between miR-183-5p and FOXP1, the pcDNA-FOXP1 or/and miR-183-5p mimic were transfected in NB cells. FOXP1 siRNA or/and miR-183-5p inhibitor were also transfected in NB cells. Overexpression of FOXP1 significantly reversed the cell proliferation ability induced by miR-183-5p mimic (Fig. 7A, B), while knockdown of FOXP1 improved the inhibition of cell proliferation by miRNA inhibitor (Fig. 7C, D). Furthermore, we observed that the increased cell migration (Fig. 7E, F) and invasion (Fig. 7G, H) caused by miR-183-5p mimic was mitigated by transfection with pcDNA-FOXP1 in SK-N-SH or SH-SY5Y NB cells. Moreover, si-FOXP1 also attenuated the effect of miR-183-5p inhibitor decrease in cell migration and invasion (Fig. 7E–H). As shown in the figures, the results were demonstrated to be similar to the results of detection of cell proliferation. The pcDNA-FOXP1 significantly attenuated the downregulation of mRNA (Fig. 7I, J) and protein expression (Fig. 7K, L) of FOXP1 caused by miR-183-5p overexpression. It also showed that upregulation of FOXP1 transfected with miR-183-5p inhibitor was mitigated by transfection with si-FOXP1. Moreover, pcDNA-FOXP1 significantly mitigated the upregulation of miR-183-5p expression caused by miR-183-5p overexpression and si-FOXP1 also attenuated the downregulation of miR-183-5p expression caused by miR-183-5p inhibitor (Fig. 7M, N) in NB cells. Then we detected the phosphorylation of ERK and AKT in NB cells. Results showed that pcDNA-FOXP1 antagonized the effect of miR-183-5p on the phosphorylation of ERK/AKT. When transfected with FOXP1 siRNA, the downregulation of p-ERK and p-Akt induced by mir-183-5p inhibitor was partially restored (Fig. 7P, R). Collectively, these results suggested that NEAT1 negatively regulated cell proliferation and migration of NB by miR-183-5p/FOXP1 via the ERK/AKT pathway.
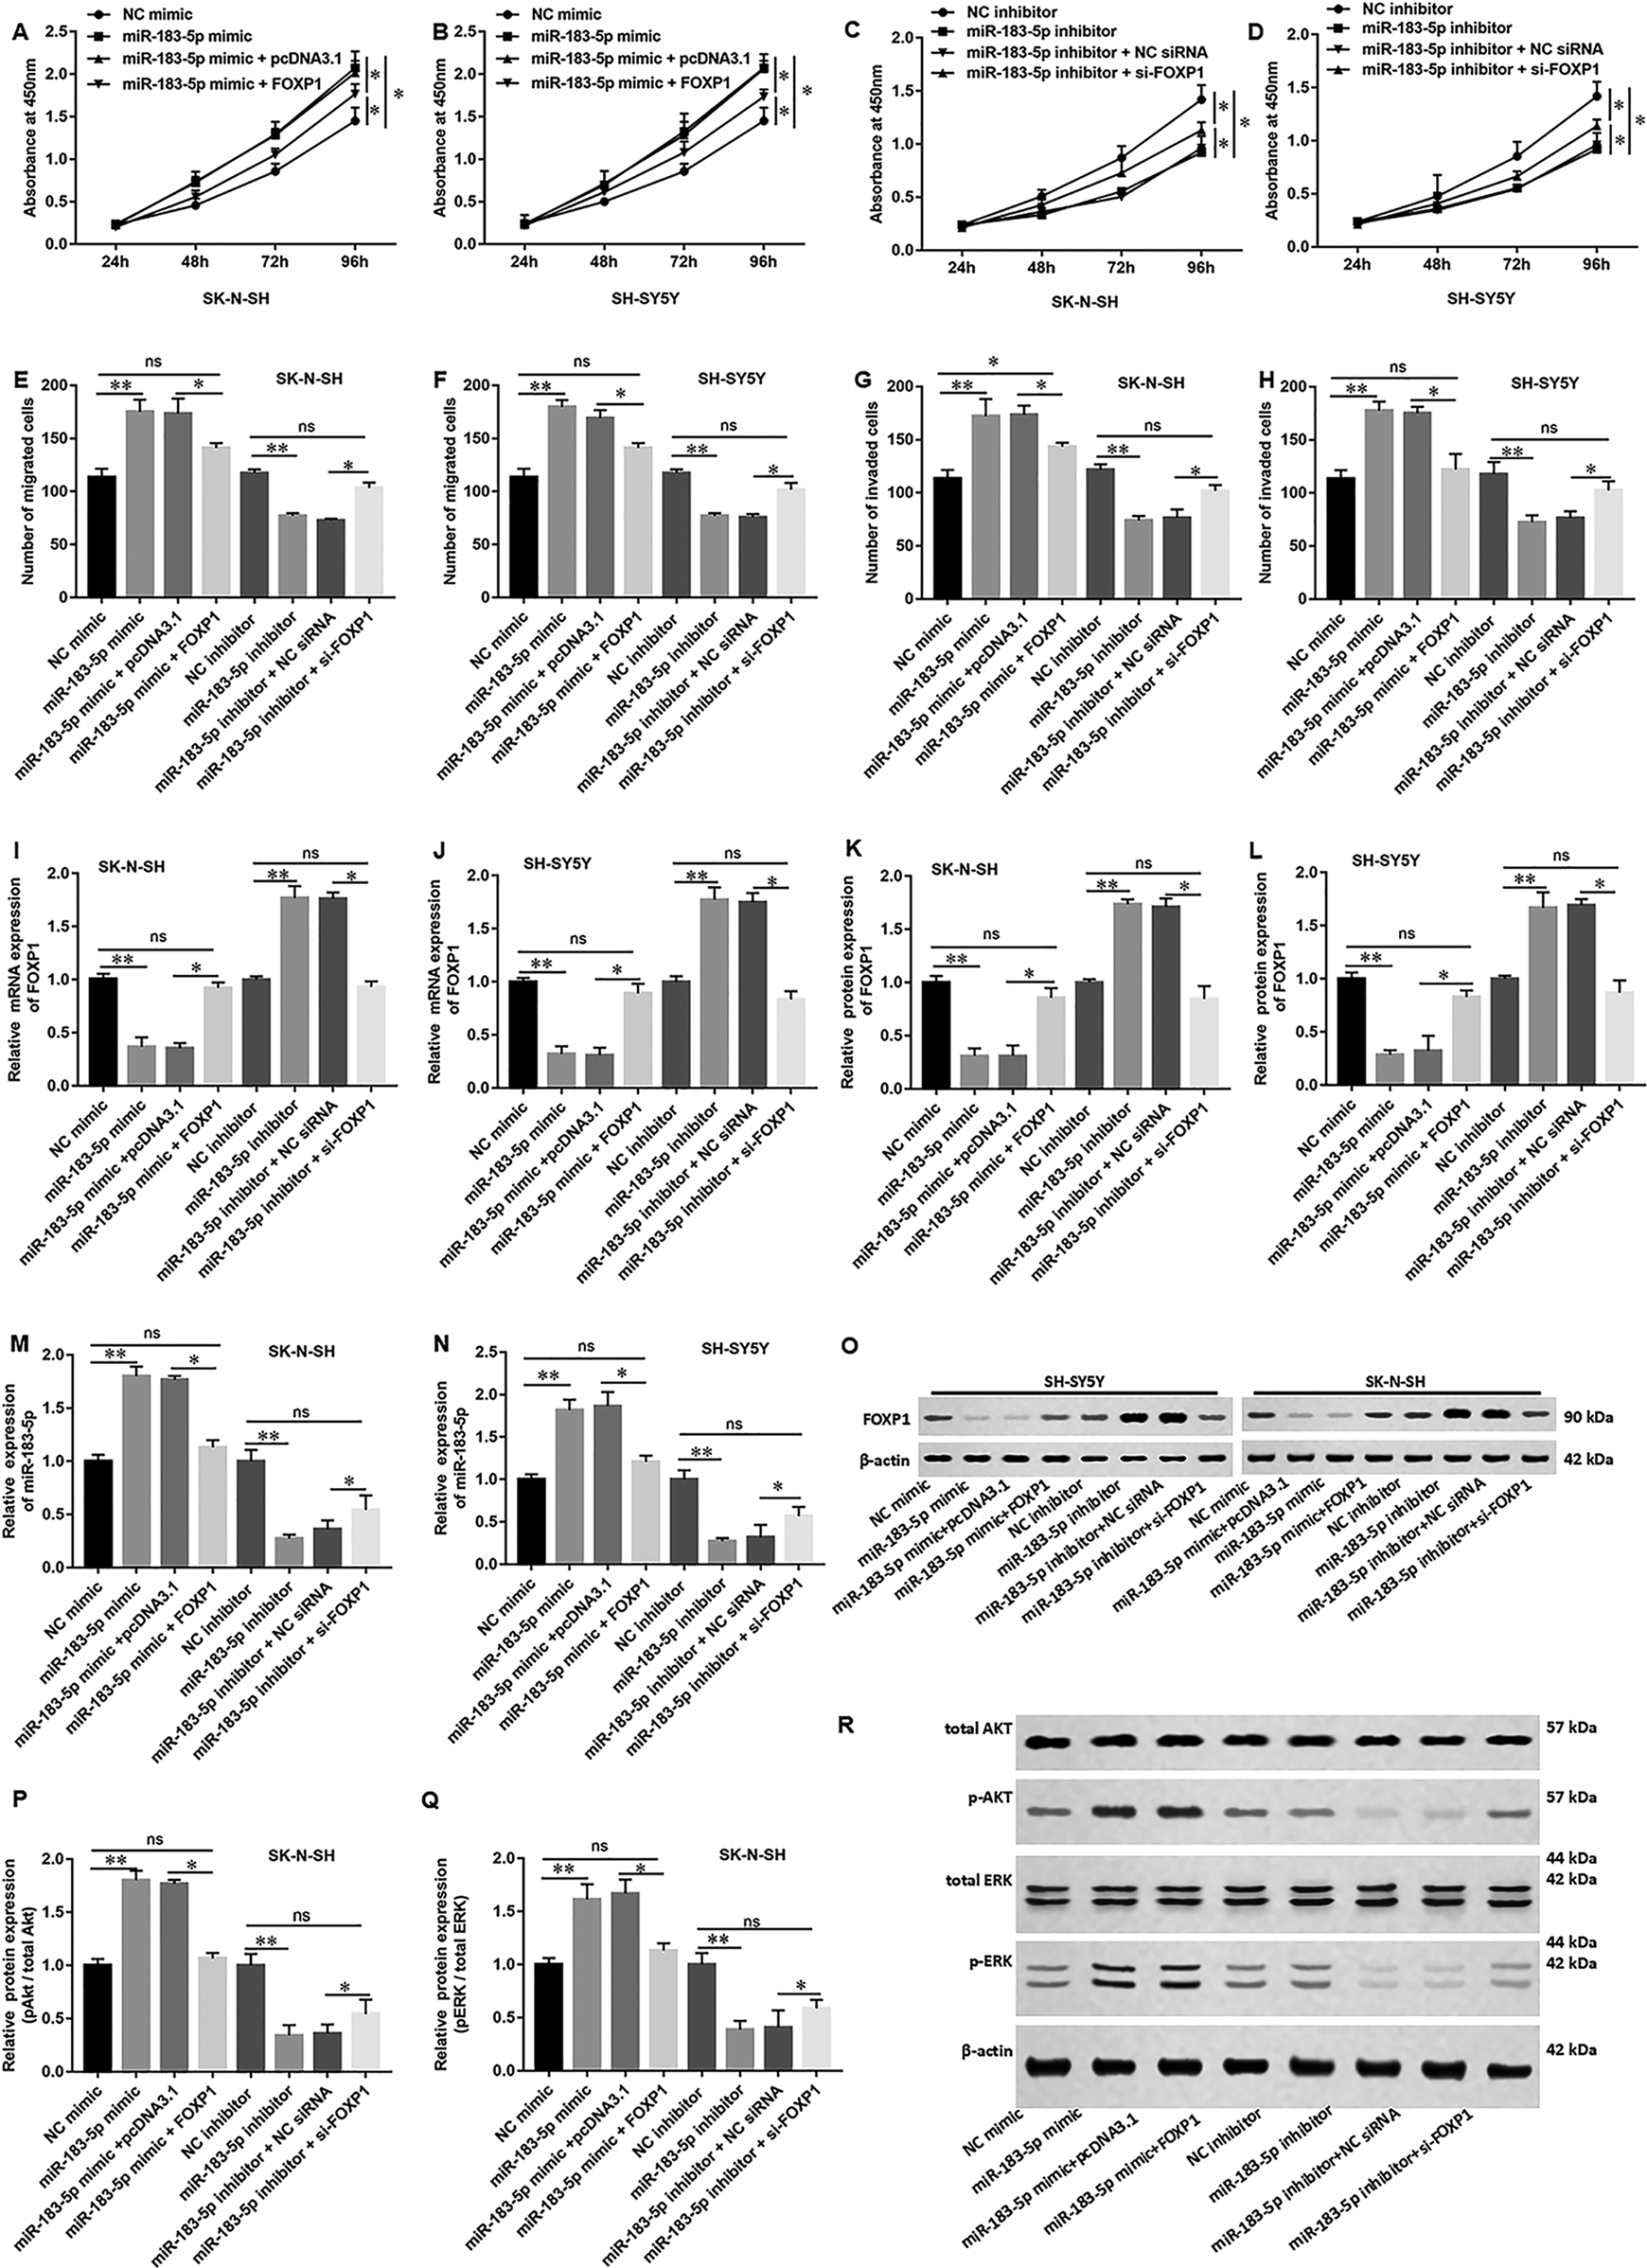
MiR-183-5p participates in the ERK/AKT pathway by targeting FOXP1. SK-N-SH or SH-SY5Y neuroblastoma cells (1.0 × 10⁵/cm2) were co-transfected with pcDNA-NEAT1 (2 μg/ml) and miR-183-5p mimic (20 nM), or co-transfected with FOXP1 siRNA (20 nM) and miR-183-5p inhibitor (20 nM) for 48 h. (A–D) The capacity of cell proliferation was tested by Cell Counting Kit 8 in SK-N-SH cells and SH-SY5Y cells. (E, G) The Transwell assay detected the migrative and invasive abilities in SK-N-SH cells and (F, H) SH-SY5Y cells. (I, J) Expression of FOXP1 mRNA and (K, L) protein in SK-N-SH or SH-SY5Y neuroblastoma cell lines. (M, N) Expression of miR-183-5p in different cell lines was tested by using RT-qPCR analysis. (O) The quantification of band intensity relative to β-actin intensity of (K, L) was quantified by MBF ImageJ software. (P) Western blot detected the phosphorylation of AKT and (Q) ERK in neuroblastoma cells. (R) The quantification of band intensity normalized to β-actin intensity of (P, Q) was quantified by MBF ImageJ software. Statistical significance was determined using an independent-sample t-test. Values were expressed as mean ± standard error of mean, n = 3. *P < 0.05 and **P < 0.01 vs normal or control.NEAT1: nuclear-enriched abundant transcript-1.
Discussion
LncRNAs play a pivotal role in many biologic processes and are implicated in the control of multiple molecular pathways leading to gene expression changes. During the past few years, a large body of evidence has shown that downregulation of lncRNAs expression is associated with the carcinogenesis and development of malignant tumors and is implicated in the control of cell proliferation, migration, and apoptosis 5 . Our studies focused on the involvement of NEAT1 in NB cells and it is a possible molecular mechanism. The results showed that NEAT1 was least expressed and it regulated cell proliferation and migration in NB cells. Moreover, NEAT1 partially attributed to its ability to serve as a molecular sponge of miR-183-5p, leading to upregulation of FOXP1. Therefore, this study elucidated the important role of the NEAT1/miR-183-5p/FOXP1 axis in NB, and also provided therapeutic targets for NB.
NEAT1, an important cancer-associated lncRNA, has been shown to be involved in numerous cellular processes including the control of cell proliferation, migration, and apoptosis in several cancers. For example, expression of NEAT1 was reduced in schizophrenia and it modulates oligodendrocytes transcription and differentiation 12 . But overexpression of NEAT1 promoted cell proliferation and suppressed apoptosis in ovarian cancer cells 13 . Researchers also found that downregulation of NEAT1 aggravated progression of osteoarthritis via modulating the miR-181a/GPD1 L axis 14 . As our results showed, NEAT1 was downregulated in NB tissues and cell lines, while upregulation of NEAT1 inhibited the cell proliferation, migration, and invasion in NB cells. Most interestingly, a previous study found that the expression of NEAT1 was downregulated more significantly in patients older than 18 mo and downregulated with the progression of the disease. In the current study, NEAT1 was sharply downregulated in the tumor tissue compared with the adjacent nontumor tissue, and it displayed significantly lower levels in patients with advanced NB. Moreover, we found that adult patients had a lower level of NEAT1 than the minor adolescent patients. These findings suggested that NB is possibly more detrimental for patients older than 18 mo with lower expression levels of NEAT1. Moreover, the luciferase reporter gene assay validated the binding of NEAT1 and miR-183-5p. Overexpression of miR-183-5p promoted NB cell proliferation, migration, and invasion, while downregulation of miR-183-5p decreased the cell proliferative, migrative, and invasive abilities. Furthermore, our experiments revealed that NEAT1 negatively regulated NB cell proliferation, migration, and invasion by sponging miR-183-5p.
To further understand the mechanism of miR-183-5p in NB, we used bioinformatic tools to predict the downstream targets of miR-183-5p. As expected, luciferase reporter gene assays showed the combination of miR-183-5p and FOXP1. Similar to our experimental results, miR-182-5p and miR-183-5p regulated expression of FOXO transcription factors in dopaminergic midbrain neurons 15 . As our results showed, expression of FOXP1 was significantly decreased after transfection with miR-183-5p mimic and upregulated after transfection with miR-183-5p inhibitor. MiR-183-5p has been reported in several cancers, such as glioma 16 and endometrial cancer 17 . In addition, miR-183-5p was dysregulated on cell biological performances, including viability, apoptosis, and autophagy of gastric cancer cell lines, such as SGC-7901, and may serve as a therapeutic target for gastric cancer 18 . Compared with osteosarcoma patients with high expression of miR-183-5p, those with low miR-183-5p had a higher rate of distant metastasis and lower overall survival. Next, there are four members comprising the FOXP subfamily of forkhead transcription factors and all of them have been shown to be involved in cancers.
Our results showed that FOXP1 and miR183-5p inhibited their mRNA or protein expression by each other. It showed that miR-183-5p directly binds to FOXP1 3′-UTR. When FOXP1 expression increased, there will be more opportunities to bind miR-183-5p, making the expression of miR-183-5p downregulated. Likewise, the increased expression of miR-183-5p in cells would provide more opportunities to bind to its target gene, making its expression downregulated. So, they have a negative regulation relationship with each other, and the upregulation of one side’s expression will significantly affect the expression of the other side. FOXP1 has been shown to play a key role in regulating cancers. For instance, FOXP1 is required to establish its function via the PI3K/AKT/p70S6 K signaling pathway in breast cancer 19 . Similarly, in GBM, suppression of miR-9 by mutant EGFR signaling upregulated FOXP1, which resulted in GBM tumorigenicity 20 . Finally, the relationship among NEAT1, miR-183-5p, and FOXP1 was explored, and it was found that NEAT1 regulated FOXP1 expression by sponging miR-183-5p. Overexpression of FOXP1 significantly reversed the cell proliferation, migration, and invasion abilities induced by miR-183-5p mimic, while knockdown FOXP1 rescued the inhibition of cell proliferation, migration, and invasion by miR-183-5p inhibitor. The ERK/AKT signaling pathway is an important signaling pathway for genetic signal changes in cancer development and is closely related to tumor growth, angiogenesis, patient prognosis, and treatment 21 –23 . In the occurrence and development of various cancers, there are interactions between different signaling pathways 24 . Chemokine receptor 7 targeted the vascular endothelial growth factor via the AKT/ERK pathway to regulate angiogenesis in colon cancer and the phosphorylation of AKT and ERK, as well as the expression of the vascular endothelial growth factor, which can be inhibited using the LY294002 and U0126 inhibitors 25 . Bakuchiol demonstrated significant bioactivity toward chondrocyte proliferation via the PI3K–AKT and ERK1/2 pathways mediated by estrogen receptor activation and exhibited enhanced promotion of the remodeling of injured cartilage 21 . In this study, we suspected that miR-183-5p might affect the activation of the ERK pathway by suppressing the expression of FOXP1. We found that overexpression of FOXP1 reversed the increased p-AKT and p-ERK levels in cells transfected with miR-183-5p mimic, while silencing of FOXP1 reversed the decreased p-AKT and p-ERK protein levels in cells transfected with miR-183-5p inhibitor.
In conclusion, these findings indicated that NEAT1 negatively regulated cell proliferation and migration of NB cells through miR-183-5p/FOXP1 axis. Therefore, NEAT1/miR-183-5p/FOXP1 axis plays a crucial role in the pathogenesis of NB, and it also provided a potential therapeutic target for NB patients.
Footnotes
Ethical Approval
This study was approved by the Ethics Committee at The Second Affiliated Hospital of Xi’an Jiaotong University (Xi’an, China).
Statement of Human and Animal Rights
All procedures in this study were conducted in accordance with The Second Affiliated Hospital of Xi’an Jiaotong University of Ethics Committee (Approval Number: 2020043)-approved protocols.
Statement of Informed Consent
Written informed consent was obtained from the patients for their anonymized information to be published in this article.
Declaration of Conflicting Interests
The author(s) declared no potential conflicts of interest with respect to the research, authorship, and/or publication of this article.
Funding
The author(s) disclosed receipt of the following financial support for the research, authorship, and/or publication of this article: This study was supported by the National Natural Science Foundation of China (No. 81701501, 81770513, 81741096).