
Abstract
Ten-eleven translocation 1 (TET1) is a member of the DNA demethylase family that regulates the methylation level of the genome. Dysregulation of TET1 in renal cell carcinoma (RCC) may be associated with RCC progression, but the mechanism of TET1 down-regulation in RCC is not yet known. MiR-183-5p is up-regulated in various tumor tissues and acts as an oncogene. We used Transwell and wound healing assays to test cell invasion and migration. To investigate DNA methylation, we used dot blot, which indicates TET1 enzyme activity. We verified the binding of miR-183-5p and TET1 3′-UTR (untranslated region) using dual-luciferase reporter assay. Our study demonstrated, for the first time, that miR-183-5p can directly repress TET1 expression in RCC. We observed a significant decrease in TET1 expression in RCC specimens, as reported in the literature, and a significant decrease in the concentration of 5hmC in RCC. By aligning the microRNA with a database and using the luciferase reporter gene method, we found that miR-183-5p can inhibit luciferase activity by binding to 453-459 bp of TET1 3′-UTR, leading to inhibition of TET1 expression. Furthermore, down-regulation of TET1 inhibited miR-200c expression and promoted RCC cell invasion and migration. Our findings suggest that in RCC, increased expression of miR-183-5p inhibits the expression of TET1, which in turn inhibits the expression of miR-200c and E-cadherin, both of which are associated with cell adhesion. This leads to the promotion of cell invasion and migration.
Introduction
Renal cell carcinoma (RCC) is a malignant tumor that originates from renal tubular epithelial cells. It is one of the most common malignant tumors in the urinary system, with over 400,000 new cases diagnosed worldwide each year.1–3 Unfortunately, RCC is often difficult to detect in its early stages, and 20%–30% of patients with RCC have already metastasized at the time of diagnosis. Patients with metastatic RCC have a poor prognosis and a low 5-year survival rate. Once RCC has metastasized, the chance of surgical resection is eliminated.
TET1 was initially identified as a DNA demethylase that catalyzes the conversion of 5 mC to 5hmC. 4 It plays a crucial role in embryonic development and disease development by regulating gene expression through demethylation. Dysregulation of TET1 has been observed in various tumor tissues, and its down-regulation promotes tumor development, making it a tumor suppressor.5–12 The main mechanisms of TET1 dysregulation include aberrant methylation of the promoter region, histone modifications, miRNAs, and transcription factors. Many studies have shown that abnormal hypermethylation of DNA mediates the down-regulation of TET1 in various tumor tissues.13–15 Additionally, studies on the regulation of TET1 by miRNAs are extensive. For example, Cheng et al. found that miR-21-5p regulates TET1 expression in colorectal cancer, 16 while Li et al. found that miR-4284 expression level was significantly elevated in gastric cancer tissues, and it can promote tumor cell proliferation, invasion, and migration by inhibiting the expression of TET1. 17 Morita et al. found that the miR-29 family can also regulate the expression level of TET1, 18 and Liu et al. found that miR-27a-3p can promote the malignant phenotypes of osteosarcoma by targeting TET1. 19 However, there are only a few studies on the expression level and mechanisms of TET1 in RCC, with limited literature available.20–22
MicroRNAs (miRNAs) are endogenous, non-coding, single-stranded small RNAs that are 20–22 bases in length. They are found in eukaryotes and can regulate gene expression at the post-transcriptional level. The mechanism by which miRNAs participate in the regulation of gene expression is by directly binding to the 3′-UTR of the target gene, resulting in the inhibition of gene expression. Numerous studies have found that miRNAs are involved in many biological processes related to RCC, including tumor development and metastasis. For example, Wang et al. found that miR-200c was significantly reduced in RCC, which increased the expression of cyclin-dependent kinase 2 (CDK2) and promoted tumor progression. 23 Chen et al. found that miR-141 was significantly reduced in RCC, and its downstream target gene erythropoietin-producing hepatocyte receptor A2 (EphA2) increased expression, promoting the growth and metastasis of RCC. 24 Additionally, miR-17-5p and miR-224 can promote the development and progression of RCC by targeting the tumor suppressor Von Hippel-Lindau (VHL). 25 Furthermore, some studies have shown that miRNA dysregulation is associated with the progression of survival, disease stage, tumor metastasis, and recurrence in RCC patients. For example, miR-106b is usually significantly decreased in patients with metastatic RCC and can be used as a marker for postoperative metastasis of renal cell carcinoma. 26 The expression of miR-21 is increased in RCC patients, and its expression level is negatively correlated with overall survival. 27 In conclusion, miRNAs have emerged as new targets for tumor therapy and have become a research hotspot in tumor diagnosis and molecular biological therapy.
In our previous study, we found that DNA methylation plays a key role in RCC.28,29 However, the role of TET1 in RCC progression is still not clear. Therefore, this study aims to investigate whether miRNAs are involved in the down-regulation of TET1 and provide an experimental basis for elucidating the regulatory network of TET1 expression in RCC.
Materials and method
Cell culture and patient tissues
The 786-O, 769-P and HEK293 cell lines were purchased from the Chinese Academy of Science Committee on type culture collection cell libraries. The 786-O and 769-P cell lines were cultured in 1640 medium (GIBCOTM, 31800-022) with 10% fetal bovine serum (Biological Industries), 1× penicillin/streptomycin (Hangzhou Keyi, CP011), and 1× sodium pyruvate (Sigma, S8636). HEK293 cell line was cultured in DMEM medium (CORNING, 19818003) with 10% fetal bovine serum (GIBCO) and 1× penicillin/streptomycin (Hangzhou Keyi, CP011). All cells were maintained in a 37° C, 5% CO2 cell culture incubator.
The paired RCC samples were provided by the Specimen Bank of Zhejiang Cancer Hospital (Hangzhou) and were approved for use by the Zhejiang Cancer Hospital Ethics Committee (IRB-2017-02). Patients' clinical information is shown in Supplementary Table 1. Nos. 1–20 were used for mRNA expression detection, Nos. 4–8 were used for protein detection, and Nos. 4–7 were used for dot blot.
RNA extraction and quantitative real-time PCR
Tissue total RNA was extracted using the RNAsimple total RNA extraction kit (TIANGEN, DP419), and cellular total RNA was isolated with the Axygen Total RNA Extraction Kit (Axygen, APMN -MS-RNA- 250). Then 500 ng of total RNA was reverse transcribed to cDNA with PrimeScript® RT Master Mix (DRR036 A, Takara) for mRNA analysis and PrimeScript® RT Master Mix (DRR037 A, Takara) for miRNAs analysis. Quantitative real-time PCR was performed for gene expression analysis using the SYBR Premix EX Taq (Takara, DRR420 A). mRNA expression level was normalized to GAPDH and miRNA expression level was normalized to U6. The primers used are listed in Supplementary Table 2. The data was analyzed by Microsoft Excel using the 2-△△ ct met.
Western blot
Protein was extracted with RIPA lysate (Beyotime Biotechnology, P0013 B) and the protein concentration was determined by BCA kit (Beyotime Biotechnology, P0010), and then the equal amounts of protein extracts were subjected to SDS-PAGE analysis and then and then transferred to polyvinylidene fluoride (PVDF) membranes. The concentrations of separation gel and concentrated gel were 10% and 5%, respectively. The PVDF membranes were blocked with 5% non-fat milk for 2 h at room temperature and incubated with primary antibodies overnight at 4°C, and the second antibody was incubated for 2 h at room temperature. Finally, the PVDF membranes were visualized in G-BOX gel imaging system (Chemi XR 5, Syngene). Antibodies were used as follows: anti-TET1 antibody (Gene Tex, GT465), anti-E-cadherin antibody (abcam, ab133597), anti-GAPDH antibody (MULTI SCIENCES, Mab5465), and anti-beta-actin antibody (MULTI SCIENCES, ab-40009-100).
Dot blot
Tissue and cellular DNA extraction was performed using the Tiangen Blood/tissue/cell genome extraction kit (TIANGEN, DP304) and the concentration was detected by NanoDrop. The extracted DNA was diluted to the same concentration with ddH2O, and 4 M NaOH solution was added to a final concentration of 0.4 M, then maintained in 95°C water bath 10 min after thoroughly mixed. 1 μL DNA sample was spotted on a nylon membrane, and then irradiated for 15 min for cross-linking by UV lamp. The cross-linked nylon membrane was blocked in 5% non-fat milk for 1 h at room temperature and incubated with primary antibodies overnight at 4°C, and the second antibody was incubated for 2 h at room temperature. Finally, the nylon membrane was visualized in G-BOX gel imaging system (Chemi XR 5, Syngene). anti-5hmC antibody was purchased from active motif.
Invasion assay
Invasion assays were carried out as described. 30 Briefly, the 8.0 μm pore size Transwell chambers (CORNING, 3422) were used for invasion assays. Transwell chambers were coated with Matrigel (CORNING, 356,234), 10,000 cells per well were seeded in a Transwell chamber after the matrigel solidification and cultured in blank 1640 medium. 1640 medium supplemented with 10% fetal bovine serum (Biological Industries), 1×penicillin/streptomycin (Hangzhou Keyi, CP011), and 1×sodium pyruvate (Sigma, S8636) was added to the 24-well plates. The cells were maintained in a 37°C, 5% CO2 cell culture incubator for 24 h. Then non-invading cells on the upper surface of membranes were wiped out by cotton swab, and invading cells on the underside were stained with crystal violet. The photograph was taken with a microscope equipped with a Nikon digital camera. Image J was used for cell counting.
In vitro wound healing assay
Wound healing assays were carried out as described. 31 Briefly, cells were seeded in 6-well plates and scratched with a 200 μL pipette tip, and then washed 3 times with PBS to remove the cellular debris. The wounds were photographed at 0 and 24 h with a microscope equipped with a Nikon digital camera. The scratch area was measured by image J software.
Transfection
siRNA transfection. Transient transfections of siRNAs were performed using Lipofectamine 3000 (Thermo Fisher, 1,946,890). Briefly, the cells were seeded in a culture plate at a density of 50%. 30 nM siRNA and Lipofectamine 3000 was diluted with a blank medium, respectively, then mixed by pipetting and incubated in room temperature for 15 min, and added to the cell culture plate. Cells were harvested 48 h after transfection.
Reporter gene transfection
TET1 3′-UTR/TET1 3′-UTR-mutant plasmid and miRNAs transfection amount were 1 ng per well and 50 pmol per well, respectively. Transient transfections of siRNAs were performed using Lipofectamine 3000 (Thermo Fisher, 1,946,890). Briefly, the HEK293 cells were seeded in a culture plate at a density of 50%. Reporter gene plasmid mixed with P3000 firstly, and then miRNAs were added, and finally Lipofectamine 3000 was added. After 15 min incubating at room temperature, the mixture was added to the cell culture plate. The luciferase assay was carried out after 48 h of transfection.
All siRNAs and miRNAs sequence are provided in Supplementary Tables 3 and 4.
Plasmid construction
The psiCHECK2 plasmid (Youbao Bio, VT1400) was used as the vector plasmid, and the DNA of normal kidney tissue was used as a template to construct the TET1 3′-UTR reporter plasmid. Wild type or mutated TET1 3′-UTR were combined to psiCHECK2 vector plasmid. The upstream of TET1 3′-UTR was inserted to Xho I restriction site, and the downstream of TET1 3′-UTR was inserted to Not I restriction site. PCR primers listed in Supplemental Material x. Site-directed mutagenesis were carried out by overlap extension PCR. The binding sequence of miR-183-5p was GUGCCA, at 453 to 459 bp of TET1 3′-UTR. The G in the sequence was mutated to C, C is mutated to G, and TET1 3′-UTR-mutant reporter plasmid was constructed. PCR primers are listed in Supplementary Table 2.
Dual-luciferase reporter assay
Luciferase reporter plasmids and miRNAs were transiently transfected into HEK293 cells using Lipofectamine 3000. Luciferase assay was performed using Dual-Luciferase® Reporter Assay System (Promega, E1910). Briefly, 24 h after transfection, HEK293 cells were harvested and subjected to luciferase assay. The renilla luciferase activity was used to normalize firefly luciferase activity, to correct for transfection efficiency.
Bioinformatics analysis
The binding of TET1 3′-UTR and microRNAs were predicted using TargetScan (https://www.targetscan.org/vert_80/) and MiRDB (http://mirdb.org/mirdb/index.html) as described.32,33 Filter by ‘Conserved sites' was applied for prediction. The Kaplan–Meier plotter was used for Kaplan–Meier curves as described. 34
Statistical analysis
Statistical analysis was performed using GraphPad Prism 8. Image J was used to measure the scratch area of wound healing assay and Transwell assay. Statistical comparisons were performed using the Mann–Whitney test in GraphPad Prism 8, and p values <0.05 were considered statistically significant.
Results
Down-regulation of TET1 in RCC
The expression of TET1 was examined in 36 pairs of RCC tissues and their adjacent paracancerous tissues using RT-qPCR. A two-tailed paired t test was performed to compare the expression of TET1 in paired cancer and paracancerous tissues. The results showed that the mRNA level of TET1 in RCC was significantly lower than that in adjacent tissues, with a statistically significant difference (p < 0.001) (Figure 1(a)). At the protein level, TET1 was also found to be decreased in RCC tissues compared to their matched paracancerous tissues (Figure 1(b)). As TET1 acts as a DNA demethylase and 5hmC is its catalytic product, the concentration of 5hmC was further tested in four pairs of RCC tissues and their matched paracancerous tissues using dot blot (Figure 1(c)). The results showed that the concentration of 5hmC was significantly lower in RCC tissues than in adjacent tissues. The mRNA and protein level of TET1 were decreased in renal carcinoma tissues, and *** represents p < 0.001. (a) RT-qPCR analysis revealed that TET1 level was down-regulated in renal carcinoma tissues compared with paired tumor-adjacent tissues, and the expression level was normalized to GAPDH. Significant repression of TET1 gene expression was found in renal carcinoma tissues compared with paired tumor-adjacent tissues by two-tailed paired t test. (b) Western blot analysis revealed that TET1 level was decreased in renal carcinoma tissues compared with paired tumor-adjacent tissues, and β-actin as internal reference protein. (c) Dot blot analysis revealed that 5hmC was decreased in renal carcinoma tissues compared with paired tumor-adjacent tissues.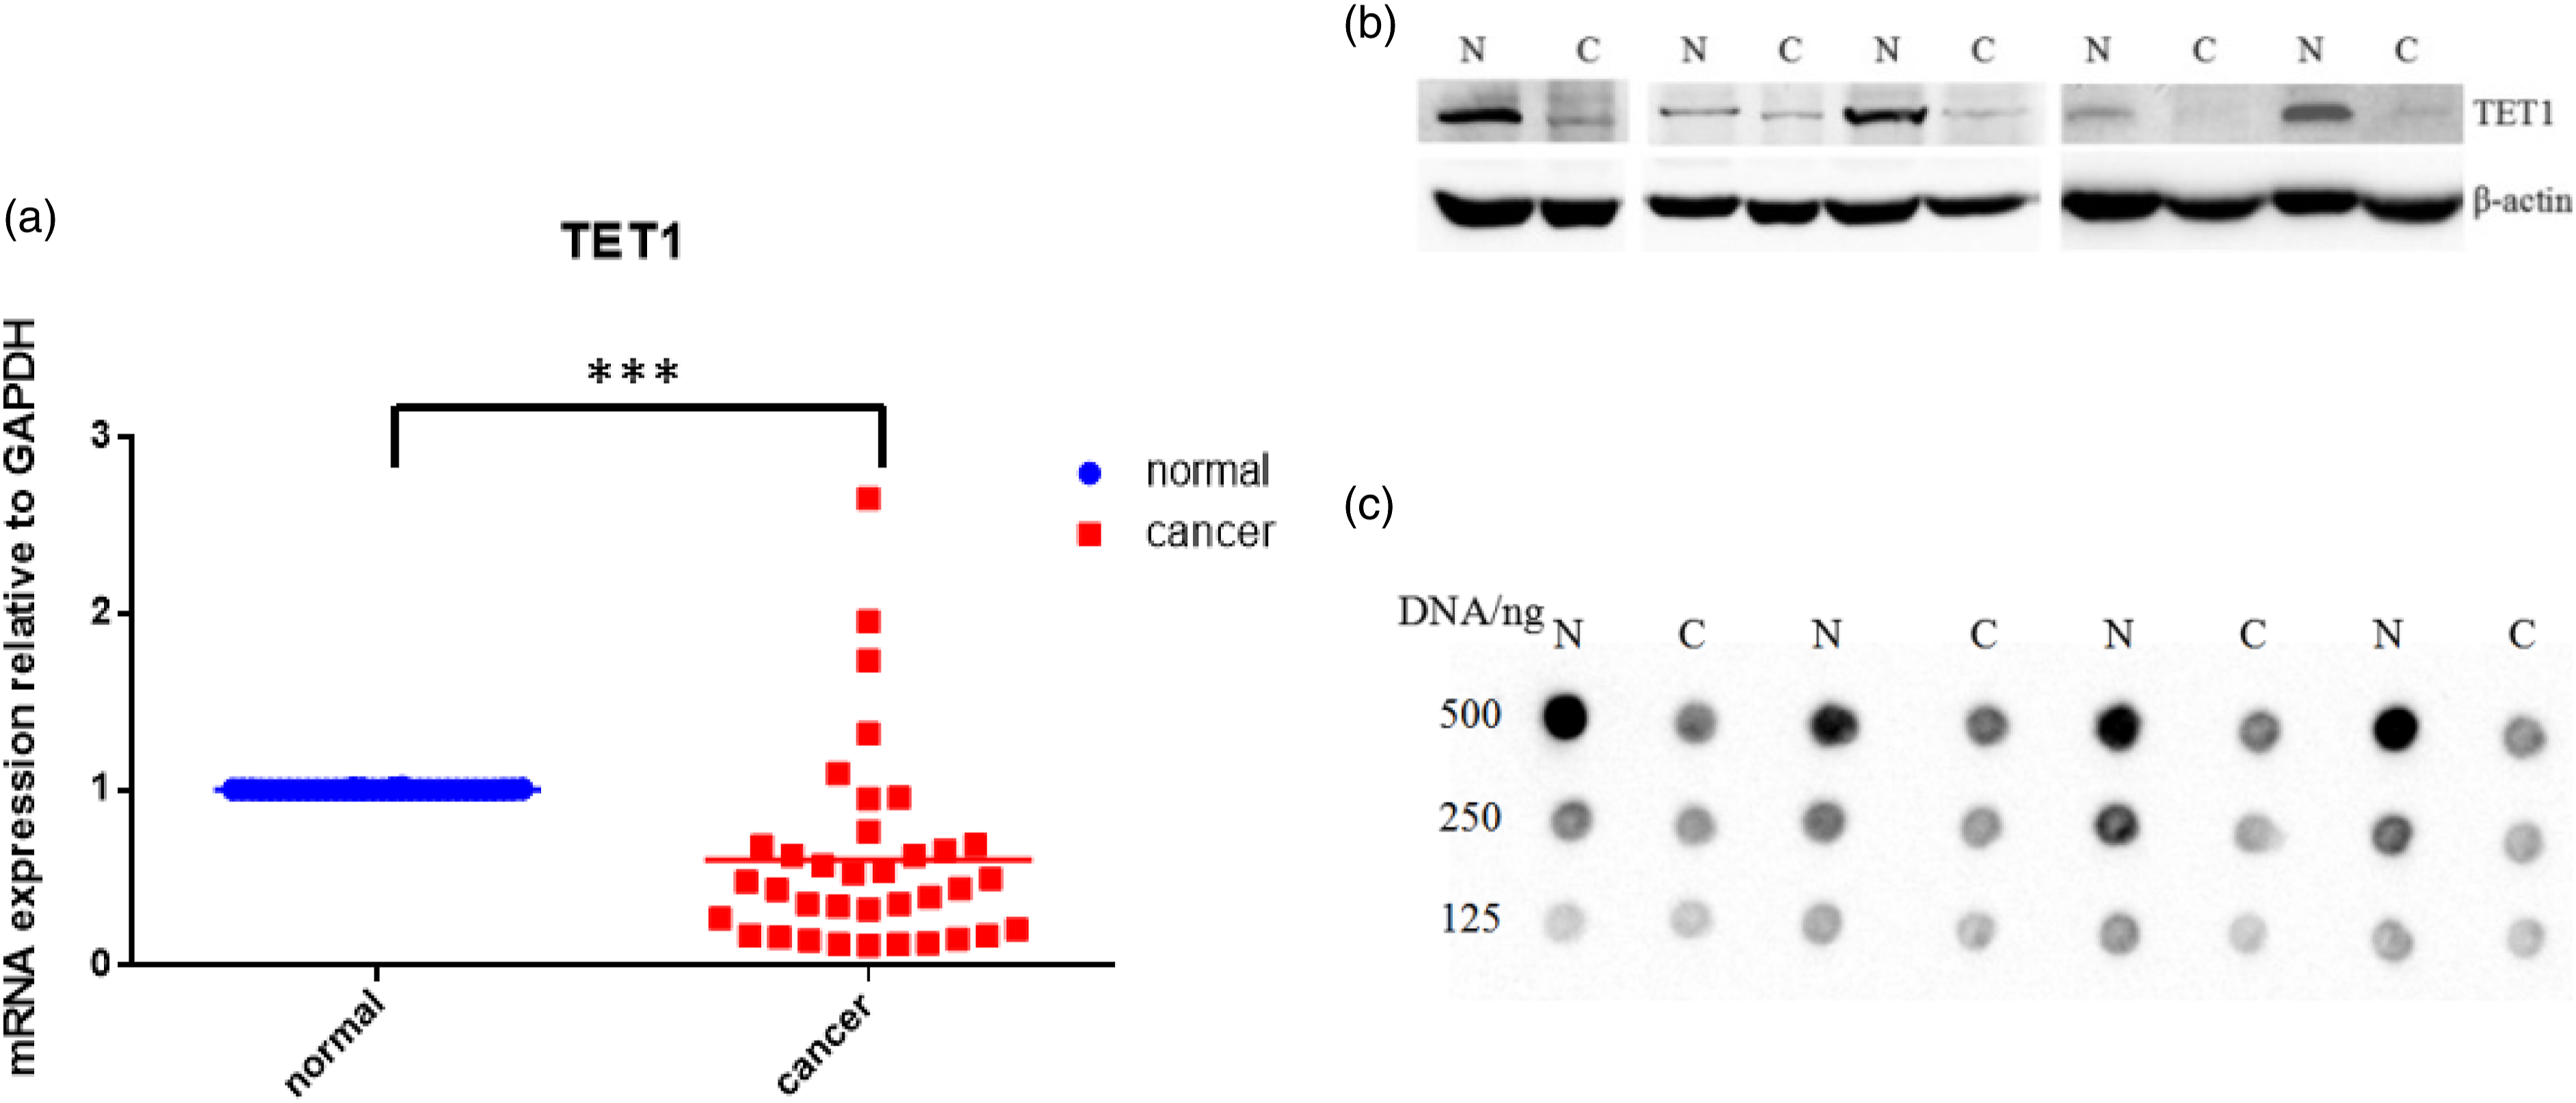
TET1 is the target gene of miR-183-5p
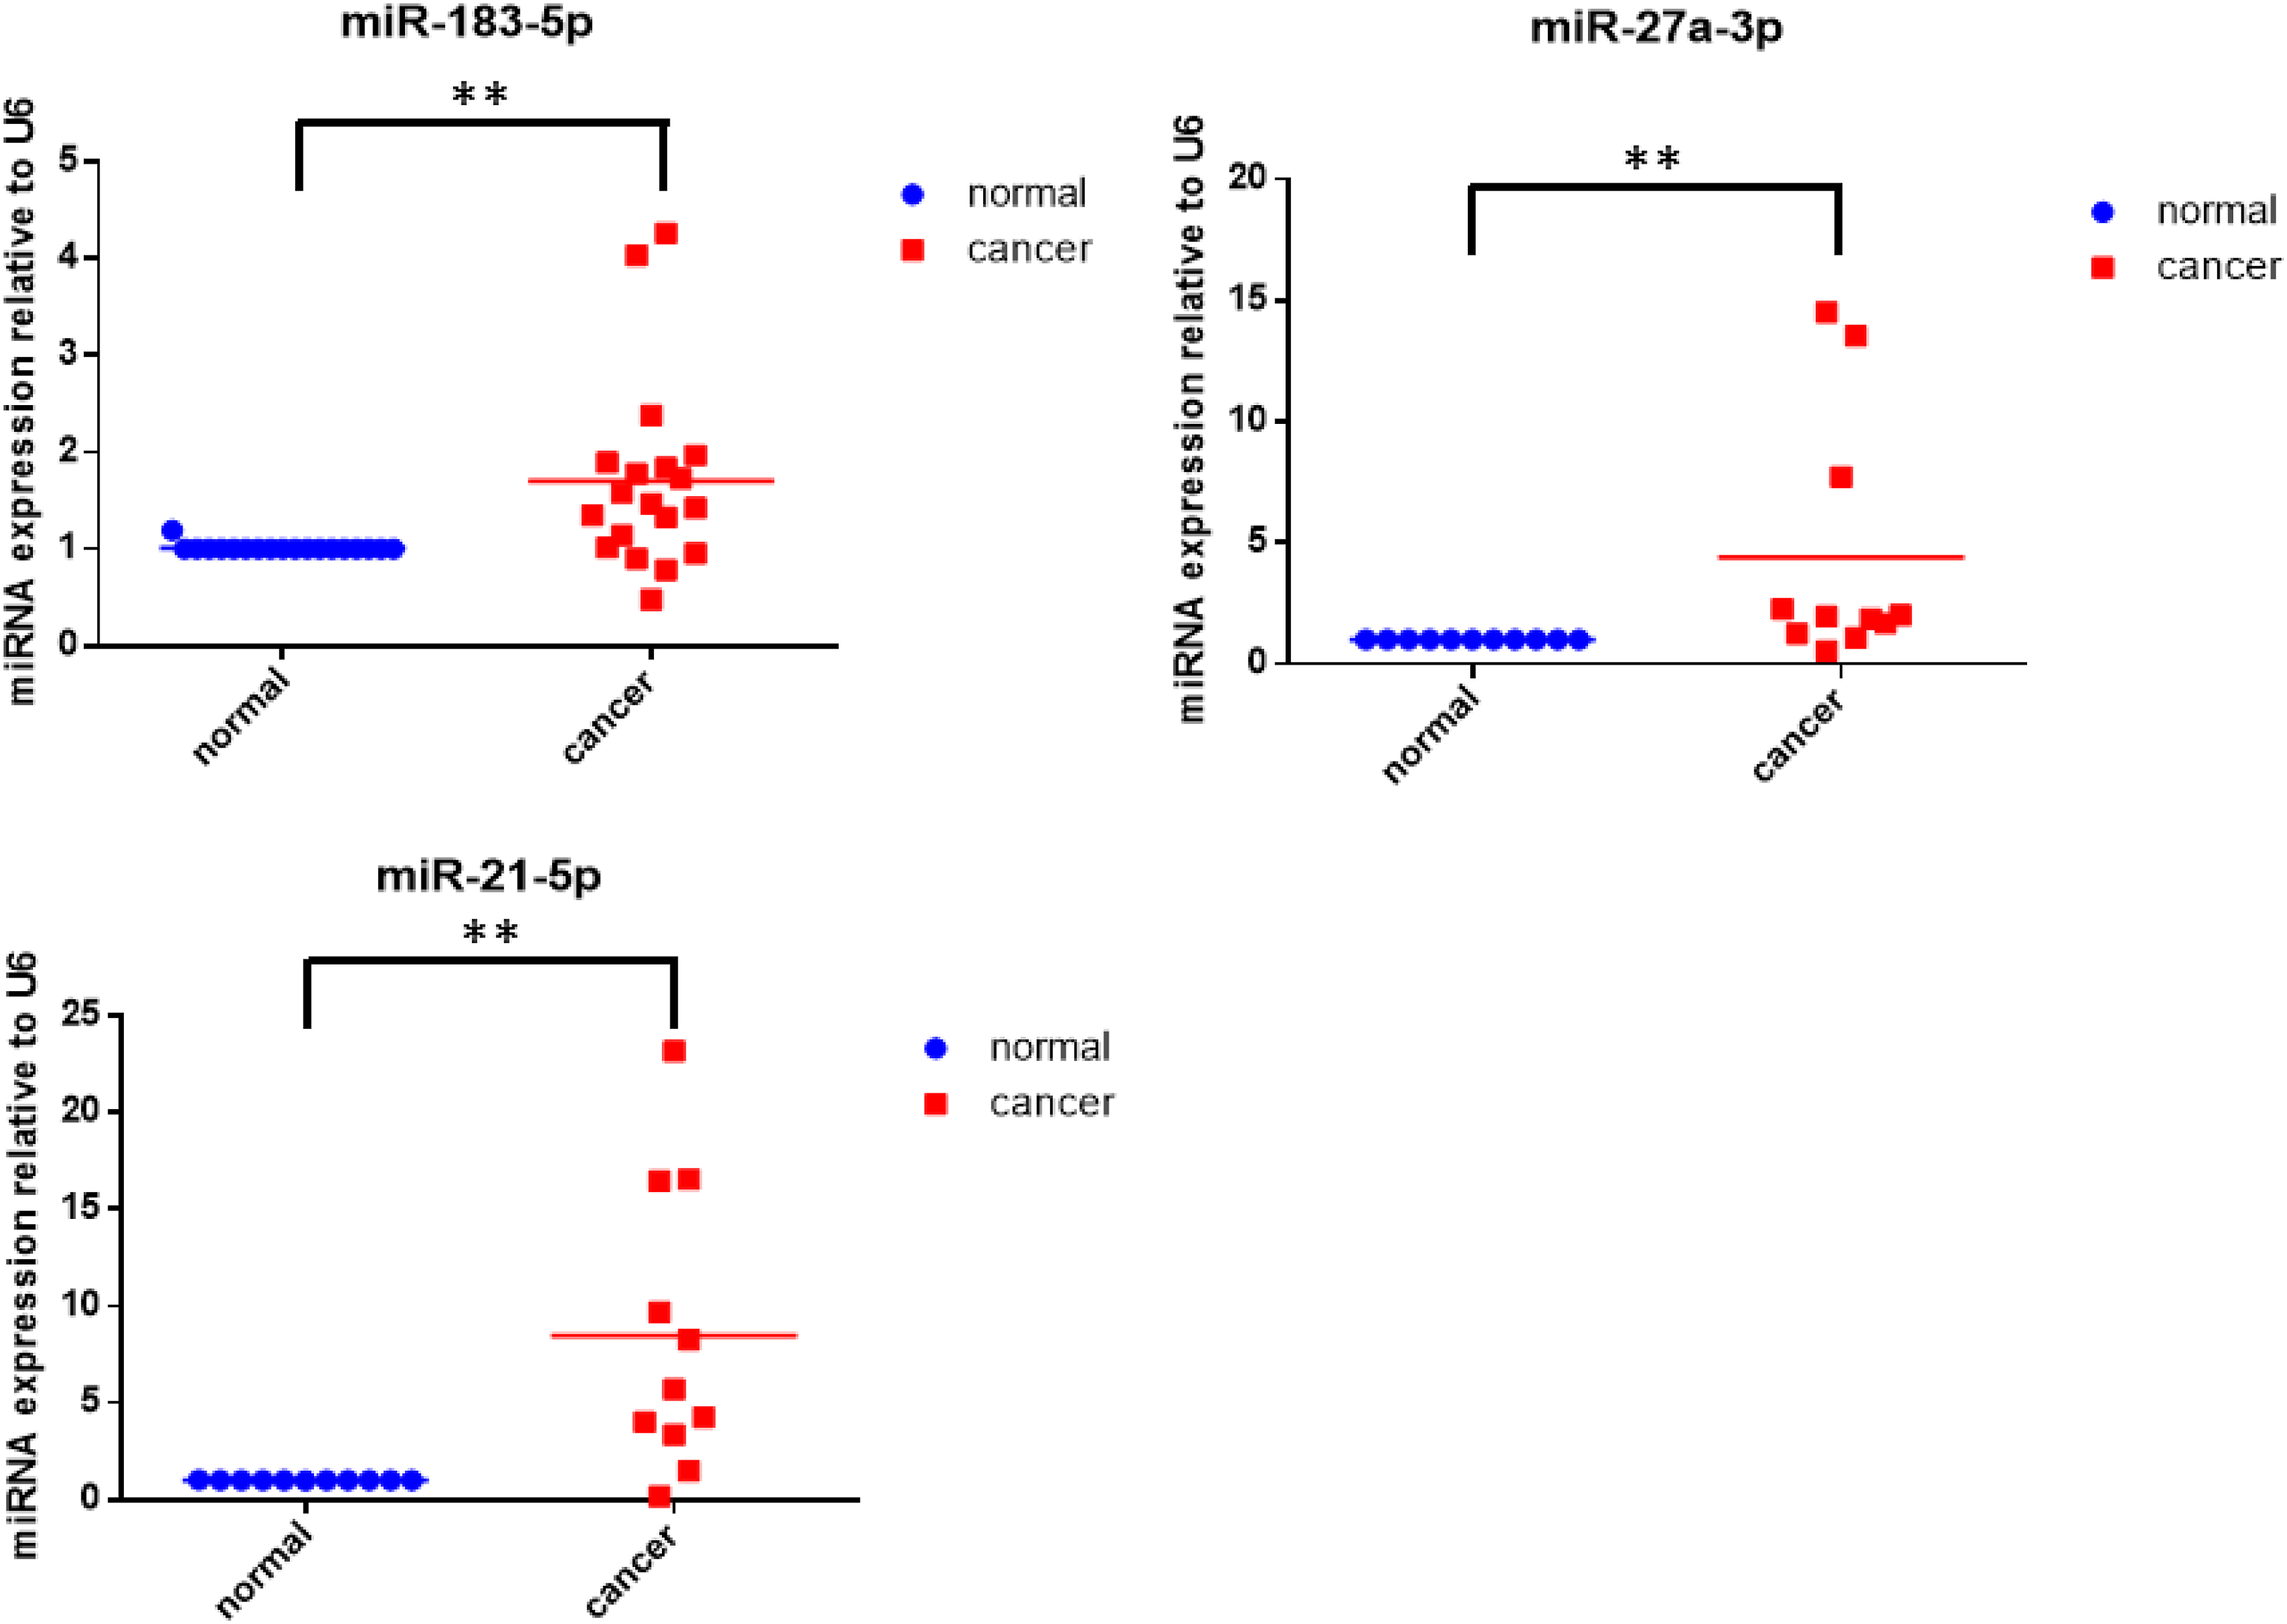
To investigate whether miRNAs are involved in the down-regulation of TET1, we analyzed the TET1 3′-UTR using TargetScan and MiRDB (Figure 2). Although several miRNAs were predicted to target TET1, only three miRNAs, miR-183-5p, miR-27a, and miR-21, were found to be up-regulated in RCC (Figure 3). Previous studies have reported that miR-27a and miR-21 can regulate the expression of TET1, while the regulatory effect of miR-183-5p on TET1 remains ambiguous.35,36 Therefore, we focused on investigating the potential role of miR-183-5p in the subsequent study. Prediction of mircoRNAs and TET1 3′UTR binding by TargetScan. RT-qPCR analysis revealed that miR-27a-3p, miR-21-5p and miR-183-5p were up-regulated in renal carcinoma tissues compared with paired tumor-adjacent tissues, and the expression level was normalized to U6. ** represents p < 0.01.
miR-183-5p target TET1 via direct binding to TET1C 3′-UTR in vitro
In the next step, we aimed to verify whether miR-183-5p can bind to TET1 3′-UTR using a dual-luciferase reporter assay, as described previously.
37
If miR-183-5p can bind to TET1 3′-UTR, it will inhibit the expression of firefly luciferase, leading to a decrease in firefly luciferase activity, while the Renilla luciferase activity will remain almost unchanged as an internal reference. This will result in a decrease in the firefly luciferase activity/Renilla luciferase activity ratio. In the dual-luciferase reporter assay, we found that when HEK293 cells were transfected with TET1 3′-UTR reporter gene plasmid and miR-183-5p, the fluorescence value ratio was significantly lower than that of cells transfected with TET1 3′-UTR reporter plasmid and miR-NC, indicating that miR-183-5p can indeed bind to TET1 3′-UTR. However, due to the low expression level of miR-183-5p in HEK293 cells, the inhibitory effect was not significant after transfection of miR-183-5p inhibitor alone. Therefore, in this experiment, we first overexpressed miR-183-5p in HEK293 cells, and then co-transfected TET1 3′-UTR and miR-183-5p inhibitor after 24 h. The results showed that when HEK293 cells were transfected with TET1 3′-UTR reporter gene plasmid and miR-183-5p mimic, the fluorescence value ratio was significantly decreased. Conversely, after transfection of miR-183-5p inhibitor, the fluorescence value ratio was significantly increased, further indicating that miR-183-5p can affect luciferase activity by binding to TET1 3′-UTR (Figure 4(a)). Dual-luciferase reporter gene assay indicated that miR-183-5p could combined with TET1 3′-UTR in HEK293 cell, **** represents p < 0.0001, ns represents p > 0.1. (a) The HEK293 was transfected with miR-183-5p mimic/inhibitor and reporter gene plasmid. Dual-luciferase reporter gene assay revealed that miR-183-5p could combine with TET1 3′-UTR. (b)The putative miR-183-5p target sites are present in TET1 3′-UTR. (c) The HEK293 was transfected with miRNAs mimics and wild/mutant reporter gene plasmid. Dual-luciferase reporter gene assay revealed that only wild reporter gene plasmid could combine with miR-183-5p, p < 0.0001.
We predicted that miR-183-5p has a possible binding site, referred to as the “seed region,” at 453-459 bp of TET1 3′-UTR using TargetScan and microRNA databases (Figure 4(b)). To confirm this, we constructed a reporter gene plasmid with a mutation in the 453-459 bp sequence of TET1 3′-UTR, where G was mutated to C and C was mutated to G. We co-transfected the miR-183-5p and the TET1 3′-UTR-mutant reporter plasmid into HEK293 cells using Lipofectamine 3000 reagent, and luciferase activity was measured 48 h later. The results, as shown in Figure 4(c), demonstrated that when we mutated the “seed region,” miR-183-5p was unable to reduce the relative luciferase activity. Therefore, we concluded that miR-183-5p can indeed bind to the sequence at 453-459 bp of the TET1 3′-UTR.
MiR-183-5p negatively regulates TET1 expression in 786-O and 769-P
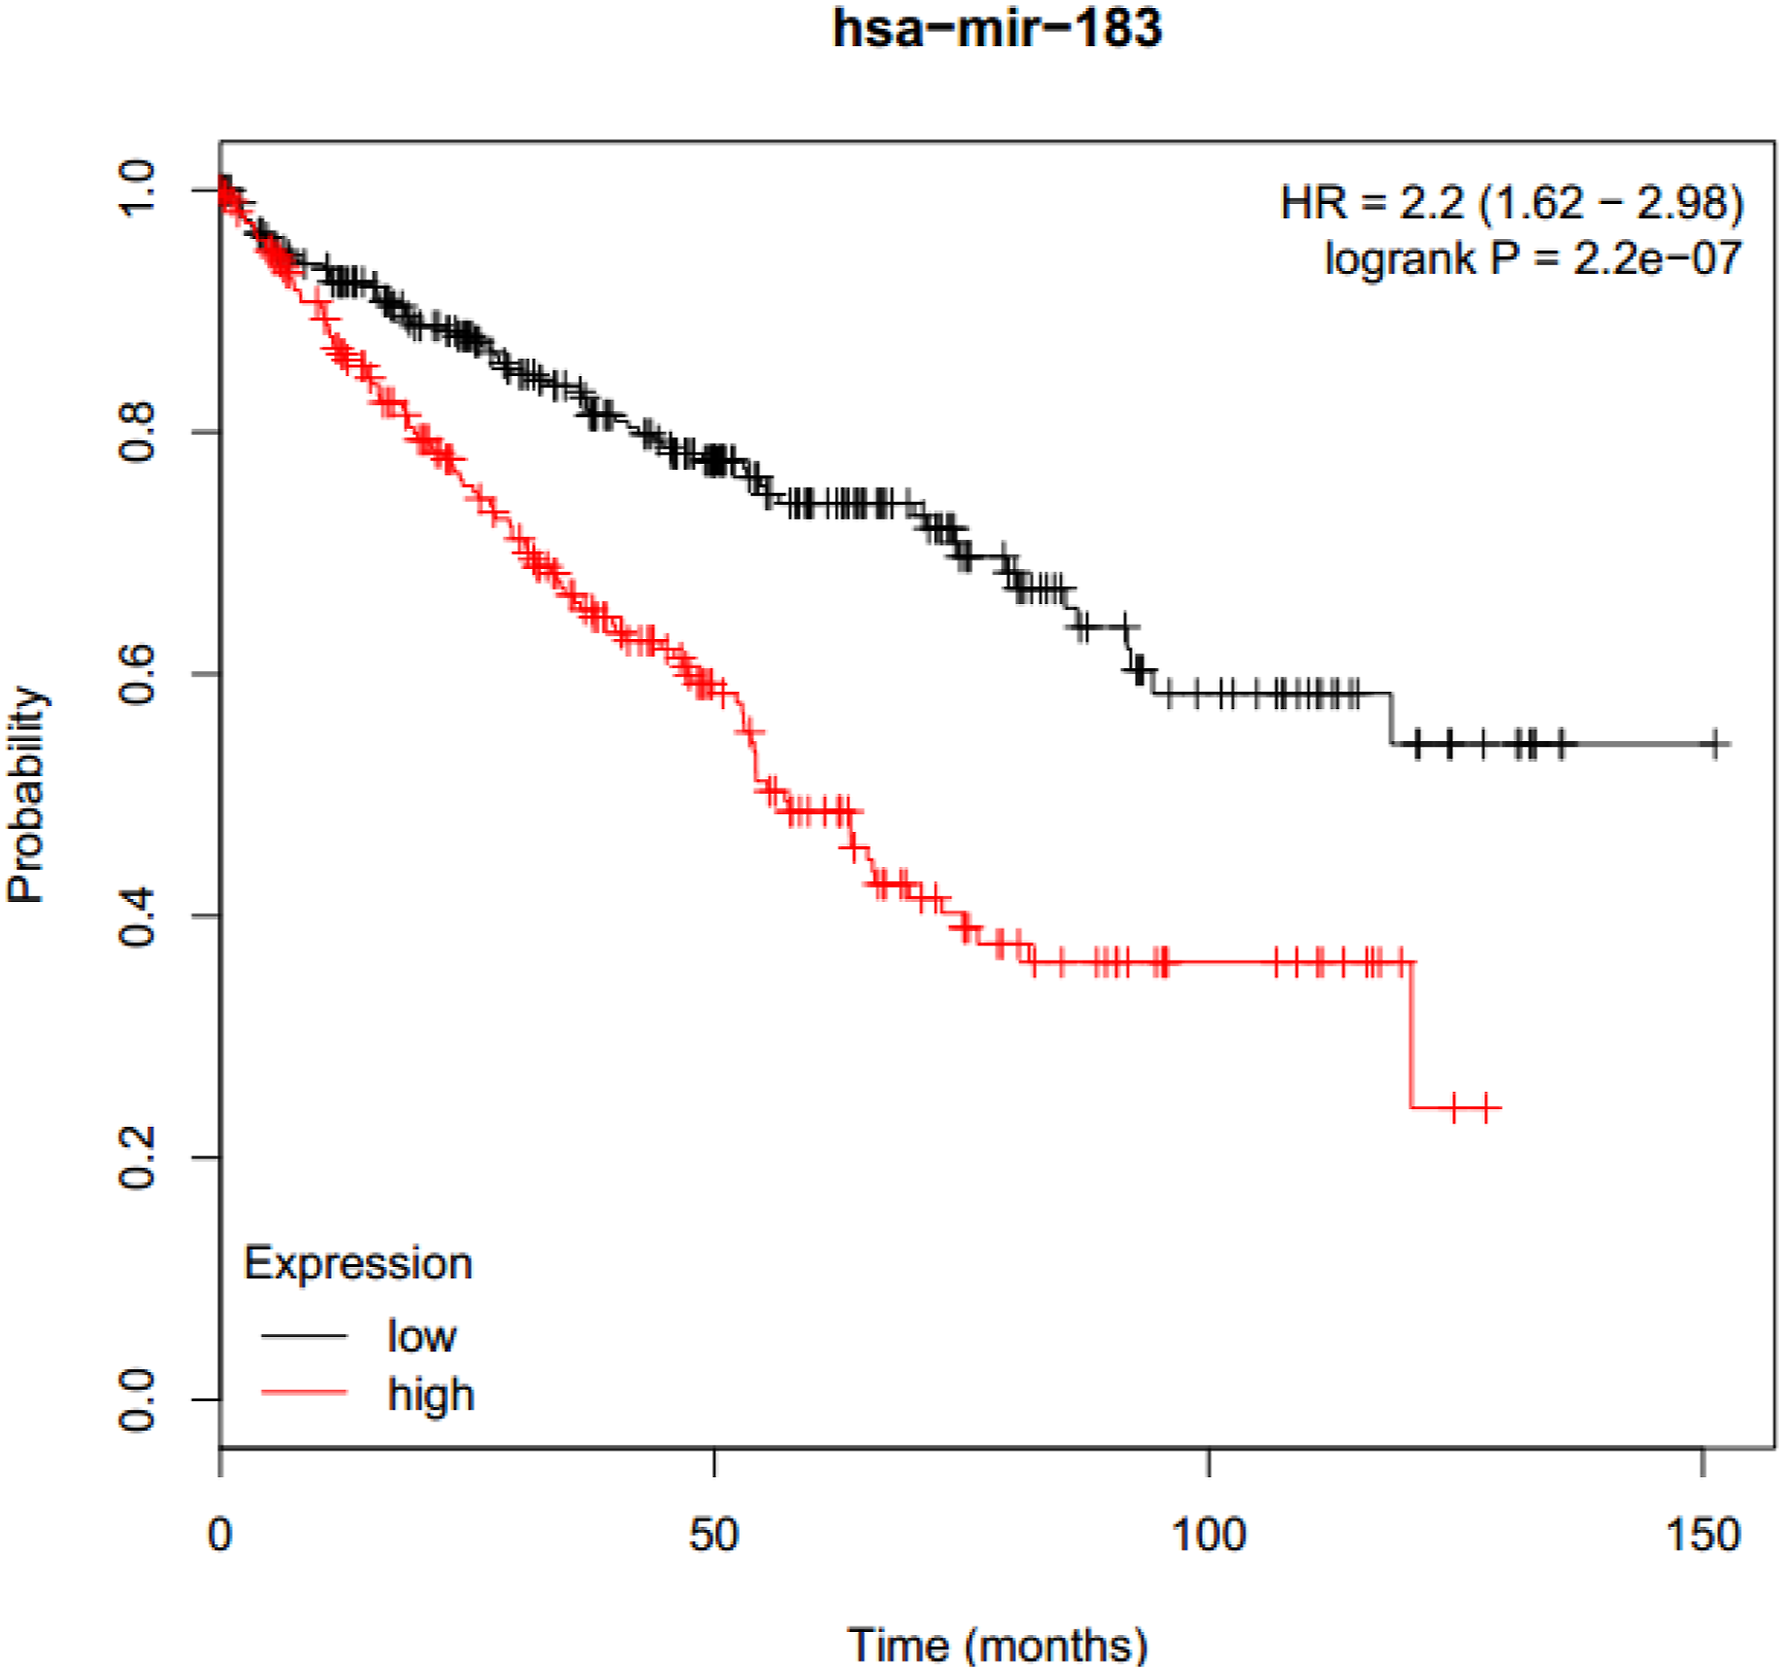
Using dual-luciferase reporter assays, we demonstrated that miR-183-5p can indeed bind to the 453-459 bp sequence of TET1 3′-UTR. We then investigated whether miR-183-5p is functionally involved in the regulation of TET1 expression. As shown in Figure 5, after transfection of miR-183-5p, the TET1 mRNA level was significantly down-regulated, and the protein level and concentration of 5hmC were also decreased. These results suggest that miR-183-5p can inhibit the expression of TET1 by directly binding to TET1 3′-UTR. Given that the expression level of TET1 is significantly decreased and miR-183-5p is significantly increased in RCC and adjacent tissues, we concluded that the abnormally up-regulated miR-183-5p in RCC is one of the mechanisms responsible for TET1 down-regulation. Furthermore, the high expression of miR-183-5p in RCC is associated with poor prognosis in the KM plotter database, further demonstrating its oncogenic role in renal cell carcinoma (as shown in Figure 6). Among all cancer types, miR-183-5p has one of the highest correlation coefficients with patient survival in RCC, but it has been relatively less studied. miR-183-5p could inhibit TET1 expression in 786-O and 769-P cells. * represents p < 0.1, ** represents p < 0.01, and ns represents p > 0.1. (a) RT-qPCR analysis revealed that TET1 mRNA expression level was down-regulated by miR-183-5p. (b) Western blot analysis revealed that TET1 protein expression level was decreased by miR-183-5p. (c) Dot blot analysis revealed that TET1 enzyme activity was significantly inhibited by miR-183-5p. Kaplan–Meier curves were used to determine the survival probability. High miR-183-5p expression indicated poor prognosis in kidney renal clear cell carcinoma (p = 2.2 × 10⁻⁷).
TET1 down-regulation promoted cell invasion and migration
The results of the Transwell experiments showed that TET1 down-regulation significantly enhanced the invasive ability of RCC cells (Figure 7(a)). Similarly, the wound healing assay demonstrated that the migration ability of RCC cells was also significantly enhanced after TET1 knockdown (Figure 7(b)). Furthermore, the expression of E-cadherin, which is associated with cell adhesion, was decreased after TET1 knockdown (Figure 7(c)). This reduction in E-cadherin expression can weaken cell adhesion and promote cell invasion and migration. Therefore, the decreased expression of TET1 can enhance the invasion and migration ability of RCC cells, leading to an increase in the malignant phenotypes of renal cancer. Effect of TET1 on 786-O and 769-P cells invasion and migration ability. * represents p < 0.05 and ** represents p < 0.01. (a) Transwell assay showed that down-regulation of TET1 can increase the invasion ability of 786-O and 769-P cells. (b) Wound healing assay showed that down-regulation of TET1 can increase the migration ability of 786-O and 769-P cells. (c) Western blot analysis revealed that E-cadherin was decreased after TET1 knockdown.
MiR-200c is closely associated with cell invasion and migration and is regulated by DNA methylation.38–41 Overexpression of miR-200c can inhibit the invasion and migration of RCC cells, and E-cadherin is a downstream gene of miR-200c.
42
MiR-200c is significantly inhibited in RCC compared to adjacent tissues. We found that down-regulation of TET1 can inhibit the expression of miR-200c (as shown in Figure 8). The DNA demethylating drug decitabine can significantly increase the expression of miR-200c in 786-O and 769-P cells by 25-fold and 17-fold, respectively, and the expression of E-cadherin is also up-regulated. Therefore, TET1 can regulate the expression of miR-200c and increase the invasion and migration of RCC cells. RT-qPCR analysis revealed that miR-200c expression level was down-regulated by TET1 knockdown.
Discussion
Binding site prediction.

TET1 has the ability to catalyze genomic DNA 5 mC hydroxylation, which can alter gene expression. However, due to its non-specificity, identifying downstream targets responsible for cancer progression has been a challenge. While most TET1 studies focus on its regulation of proteins, our study has revealed that TET1 can also regulate miR-200c, which in turn increases the invasion and migration of RCC cells.7,9,21
Numerous studies have demonstrated that miR-183-5p is up-regulated in various tumor tissues and consistently acts as an oncogene. For instance, Wang et al. found that elevated expression of miR-183-5p in malignant gliomas can enhance tumor cell proliferation, invasion, and migration by targeting neurofilament light polypeptide (NEFL). 43 Similarly, Fan et al. reported that miR-183-5p expression in malignant glioma can promote chemoresistance by inhibiting immunoglobulin-like domain protein 1 (LRIG1). 44 In endometrial cancer, Xiong et al. found that miR-183-5p promotes the EMT process by targeting cytoplasmic polyadenylation element binding protein 1 (CPEB1). 45 In renal cancer, researchers have reported that miR-183-5p is elevated in RCC tissues, and it promotes RCC cell proliferation, invasion, and migration by inhibiting the expression of protein phosphatase 2A (PP2A). 46 In our study, we confirmed that miR-183-5p is also elevated in RCC tissue and promotes the invasion and migration of RCC cells by targeting TET1.
While some studies have shown that miR-183-5p plays an important role in the progression of other cancers, such as breast cancer, its expression is not related to patient survival, making those results less applicable to clinical studies.47–49 Additionally, some studies have focused on cancer pathways, which can be more complicated in clinical cases and lead to poor repeatability in clinical research.50–52 In comparison, our study focused on RCC and TET1, which are more likely to be applicable to clinical practice.
This study found that miR-183-5p can affect the metastatic ability of renal cell carcinoma by regulating TET1, but it is unclear why miR-183 expression is up-regulated in renal cell carcinoma. For clinical specimen, the scale is limited, particularly metastasis tumor samples, so the analysis results may not be comprehensive enough. In addition, only cell models were used in this experiment, and animal models are needed to further enhance the credibility of the experimental data.
Conclusion
Our study showed that up-regulation of miR-183-5p mediated the inhibition of TET1 in RCC. In RCC patients, increased expression of miR-183-5p inhibits the expression of TET1, and then the expression of miR-200c and E-cadherin associated with cell adhesion is inhibited, which promoting cell invasion and migration (Figure 9). Mechanism of miR-183-5p regulating TET1 expression.
Supplemental Material
Supplemental Material - MiR-183-5p promotes renal cell carcinoma metastasis by targeting TET1
Supplemental Material for MiR-183-5p promotes renal cell carcinoma metastasis by targeting TET1 by Shengnan Jin, Lu Chen, Mengjiao Chen, Hua Wang, Haihong Hu, Lushan Yu and Su Zeng in International Journal of Immunopathology and Pharmacology.
Footnotes
Declaration of conflicting interests
The author(s) declared no potential conflicts of interest with respect to the research, authorship, and/or publication of this article.
Funding
The author(s) disclosed receipt of the following financial support for the research, authorship, and/or publication of this article: This work was supported by Natural Science Foundation of China (#81773817) and Zhejiang Provincial Natural Science Foundation of China (LQ21H310003).
Correction (November 2023):
Co-corresponding author Su Zeng was added post publication of the article.
Ethical approval
The ethics approval was approved for use by the Zhejiang Cancer Hospital Ethics Committee (IRB-2017-02).
Supplemental Material
Supplemental material for this article is available online.
References
Supplementary Material
Please find the following supplemental material available below.
For Open Access articles published under a Creative Commons License, all supplemental material carries the same license as the article it is associated with.
For non-Open Access articles published, all supplemental material carries a non-exclusive license, and permission requests for re-use of supplemental material or any part of supplemental material shall be sent directly to the copyright owner as specified in the copyright notice associated with the article.