
Abstract
Stroke is the leading cause of disability in adults. After the very narrow time frame during which treatment by thrombolysis and mechanical thrombectomy is possible, cell therapy has huge potential for enhancing stroke recovery. Accurate analysis of the response to new therapy using imaging biomarkers is needed to assess therapeutic efficacy. The aim of this study was to compare 2 analysis techniques: the parametric response map (PRM), a voxel-based technique, and the standard whole-lesion approach. These 2 analyses were performed on data collected at 4 time points in a transient middle cerebral artery occlusion (MCAo) model, which was treated with human mesenchymal stem cells (hMSCs). The apparent diffusion coefficient (ADC), cerebral blood volume (CBV), and vessel size index (VSI) were mapped using magnetic resonance imaging (MRI). Two groups of rats received an intravenous injection of either 1 mL phosphate-buffered saline (PBS)-glutamine (MCAo-PBS, n = 10) or 3 million hMSCs (MCAo-hMSC, n = 10). One sham group was given PBS-glutamine (sham, n = 12). Each MRI parameter was analyzed by both the PRM and the whole-lesion approach. At day 9, 1 d after grafting, PRM revealed that hMSCs had reduced the fraction of decreased ADC (PRMADC −: MCAo-PBS 6.7% ± 1.7% vs. MCAo-hMSC 3.3% ± 2.4%), abolished the fraction of increased CBV (PRMCBV+: MCAo-PBS 16.1% ± 3.7% vs. MCAo-hMSC 6.4% ± 2.6%), and delayed the fraction of increased VSI (PRMVSI+: MCAo-PBS 17.5% ± 6.3% vs. MCAo-hMSC 5.4% ± 2.6%). The whole-lesion approach was, however, insensitive to these early modifications. PRM thus appears to be a promising technique for the detection of early brain changes following treatments such as cell therapy.
Keywords
Introduction
Stroke is the leading neurological cause of disability in adults. Ischemic stroke (about 80% of all cases) occurs when arterial blood flow is interrupted. Currently, thrombolysis with tissue plasminogen activator (tPA) and mechanical thrombectomy are employed as clinical treatments. Unfortunately, only around 5% of patients are treated with tPA/thrombectomy, due to the very narrow therapeutic time window. Thus, most patients suffering from stroke receive only supportive care and rehabilitation to improve recovery. 1 The development of other therapeutic strategies, which may be effective beyond this time window, is therefore critical for patients.
Multiple therapeutic approaches have been developed in preclinical studies in rodent models of cerebral ischemia. To this end, there is a strong interest in the potential of cell transplantation. 2,3 Among the cell populations currently available, human mesenchymal stem cells (hMSCs), derived from bone marrow, seem to have definite therapeutic potential due to their low immunogenicity under either autologous or allogeneic conditions, 3 –5 although potential complications including cell clotting and cell-induced microembolism might impair their therapeutic safety and efficacy. 6 Their responses to the particular pathological microenvironments of cerebral ischemia make hMSCs exert multiple therapeutic effects at various sites and times within the stroke lesion by preventing neural cell death and improving neurological function. 7 Although the underlying mechanisms by which transplanted hMSCs ameliorate stroke prognosis are still poorly understood, reduction in immune cell infiltration and demyelination, the secretion of growth and/or trophic factors, and the promotion of angiogenesis could be primarily responsible. 7 –9 Enhancement of the differentiation of stem cells into the original cell lineages of the damaged tissue or selective migration of cells to ischemic regions to support plasticity may eventually improve functional recovery after ischemia. 10,11 Moreover, among all the administration routes available (intracerebral, intrathecal, intraarterial, and intravenous [IV]), the less invasive IV administration appears today safer and easier than the local brain grafting following stroke in the clinical setting and allows cell distribution into vascularized and viable areas of the lesion. 12 A clinical trial already demonstrated that IV delivery of hMSCs is feasible and safe for stroke patients. 13
Today, multiparametric magnetic resonance imaging (MRI), including diffusion-weighted imaging (DWI) and perfusion-weighted imaging, has become the gold standard to characterize stroke lesions. 14 An MRI also plays an important role in the identification, evaluation, and monitoring of cerebral tissue undergoing stroke from the acute to the recovery phase. 15 However, the spatial heterogeneity of a stroke lesion, well visible on MRI maps, remains a challenge for current image analysis techniques. 16,17 An analysis of the mean value across a large region of interest (ROI) by manual delineation can easily mask focal changes in intralesional tissue properties. Thus, to evaluate the therapeutic effects that contribute to stroke recovery, the lesion heterogeneity in space and time needs to be accounted for by the image analysis. Histogram-based techniques provide an evaluation of lesion heterogeneity but fail to provide spatial information. An alternative is the parametric response map (PRM), a voxel-based analysis technique, which has been used in the analysis of multiple brain diseases including glioma and primary intracerebral hemorrhage. PRM, which has been established as a promising tool to investigate parametric changes of heterogeneous lesions over time at the voxel level, is well suited to evaluate a therapeutic response or to make a prognosis. 18 –20
Recently, Moisan et al. reported that an IV injection of hMSCs modifies the expression of several angiogenic factors such as angiopoietin 2 (Ang2), Ang1, or tyrosine-protein kinase receptor as soon as 1 d postinjection in a rat model of stroke 21 and, in the long-term, improves the behavioral tests of the lesioned animals. However, in this study no microvascular changes were detected by the associated multiparametric MRI protocol at the early times points following hMSC injection. 21
To reduce the delay between underlying biological changes induced by the stem cells and corresponding MRI changes, we evaluated new imaging biomarkers in our study. We kept all the animals that were longitudinally followed in the microvascular study by Moisan et al. 21 Furthermore, from that study a part of the MRI data set were reprocessed using the PRM approach. To obtain enough animals per time point, we kept the data from all time points except the last one of the Moisan et al.’s study. 21 The 2 main methodological goals of this study were to (i) characterize the evolution of the heterogeneity of stroke lesions in a rodent model using in vivo multiparametric MRI and a PRM analysis and (ii) evaluate the PRM potential to describe the impact of a cell therapy on the stroke lesion.
Materials and Methods
All animal procedures were carried out in accordance with the French guidelines on the use of animals in scientific investigations (permits 381106 for A.M., 380820 for C.R., and A3851610008 for experimental and animal cares facilities), with the approval of the “Grenoble Institut des Neurosciences” ethical committee (agreement 004). For all procedures, anesthesia was induced by inhalation of 5% isoflurane (Abbott Scandinavia AB, Solna, Sweden) in 30% O2 in air and was maintained throughout all surgical and imaging protocols with 2% to 2.5% isoflurane through a facial mask. Rectal temperature was monitored and maintained at 37.0 ± 0.5 °C.
Transient Middle Cerebral Artery Occlusion (MCAo) Model
A total of 32 rats were used in this study. Twenty Sprague Dawley male rats (weighing 250 to 300 g; Janvier Labs, Genest Saint Isle, France) underwent transient focal cerebral ischemia surgery at day (D) 0, as described by Moisan et al. 4 Briefly, after isolating the right carotid arterial tree, a commercially available silicon rubber–coated monofilament (diameter 0.37 mm; Doccol Corporation, Redlands, CA, USA) was advanced from the lumen of the external carotid artery into the internal carotid artery, up to 5 mm beyond the external skull base. After 90 min of occlusion, rats were reanaesthetized and the thread was removed. A further 12 rats underwent the same surgery without occlusion (sham group).
Experimental Groups and IV Administration of hMSCs
The 20 MCAo rats were stratified randomly into 2 groups (10 rats per group). At D8, the 2 groups received an injection of either 1 mL phosphate-buffered saline (PBS)-glutamine (MCAo-PBS) or 3 million hMSCs (MCAo-hMSC) via the tail vein. As the MCAo-PBS group, the sham group also received the same PBS-glutamine injection (Fig. 1A).
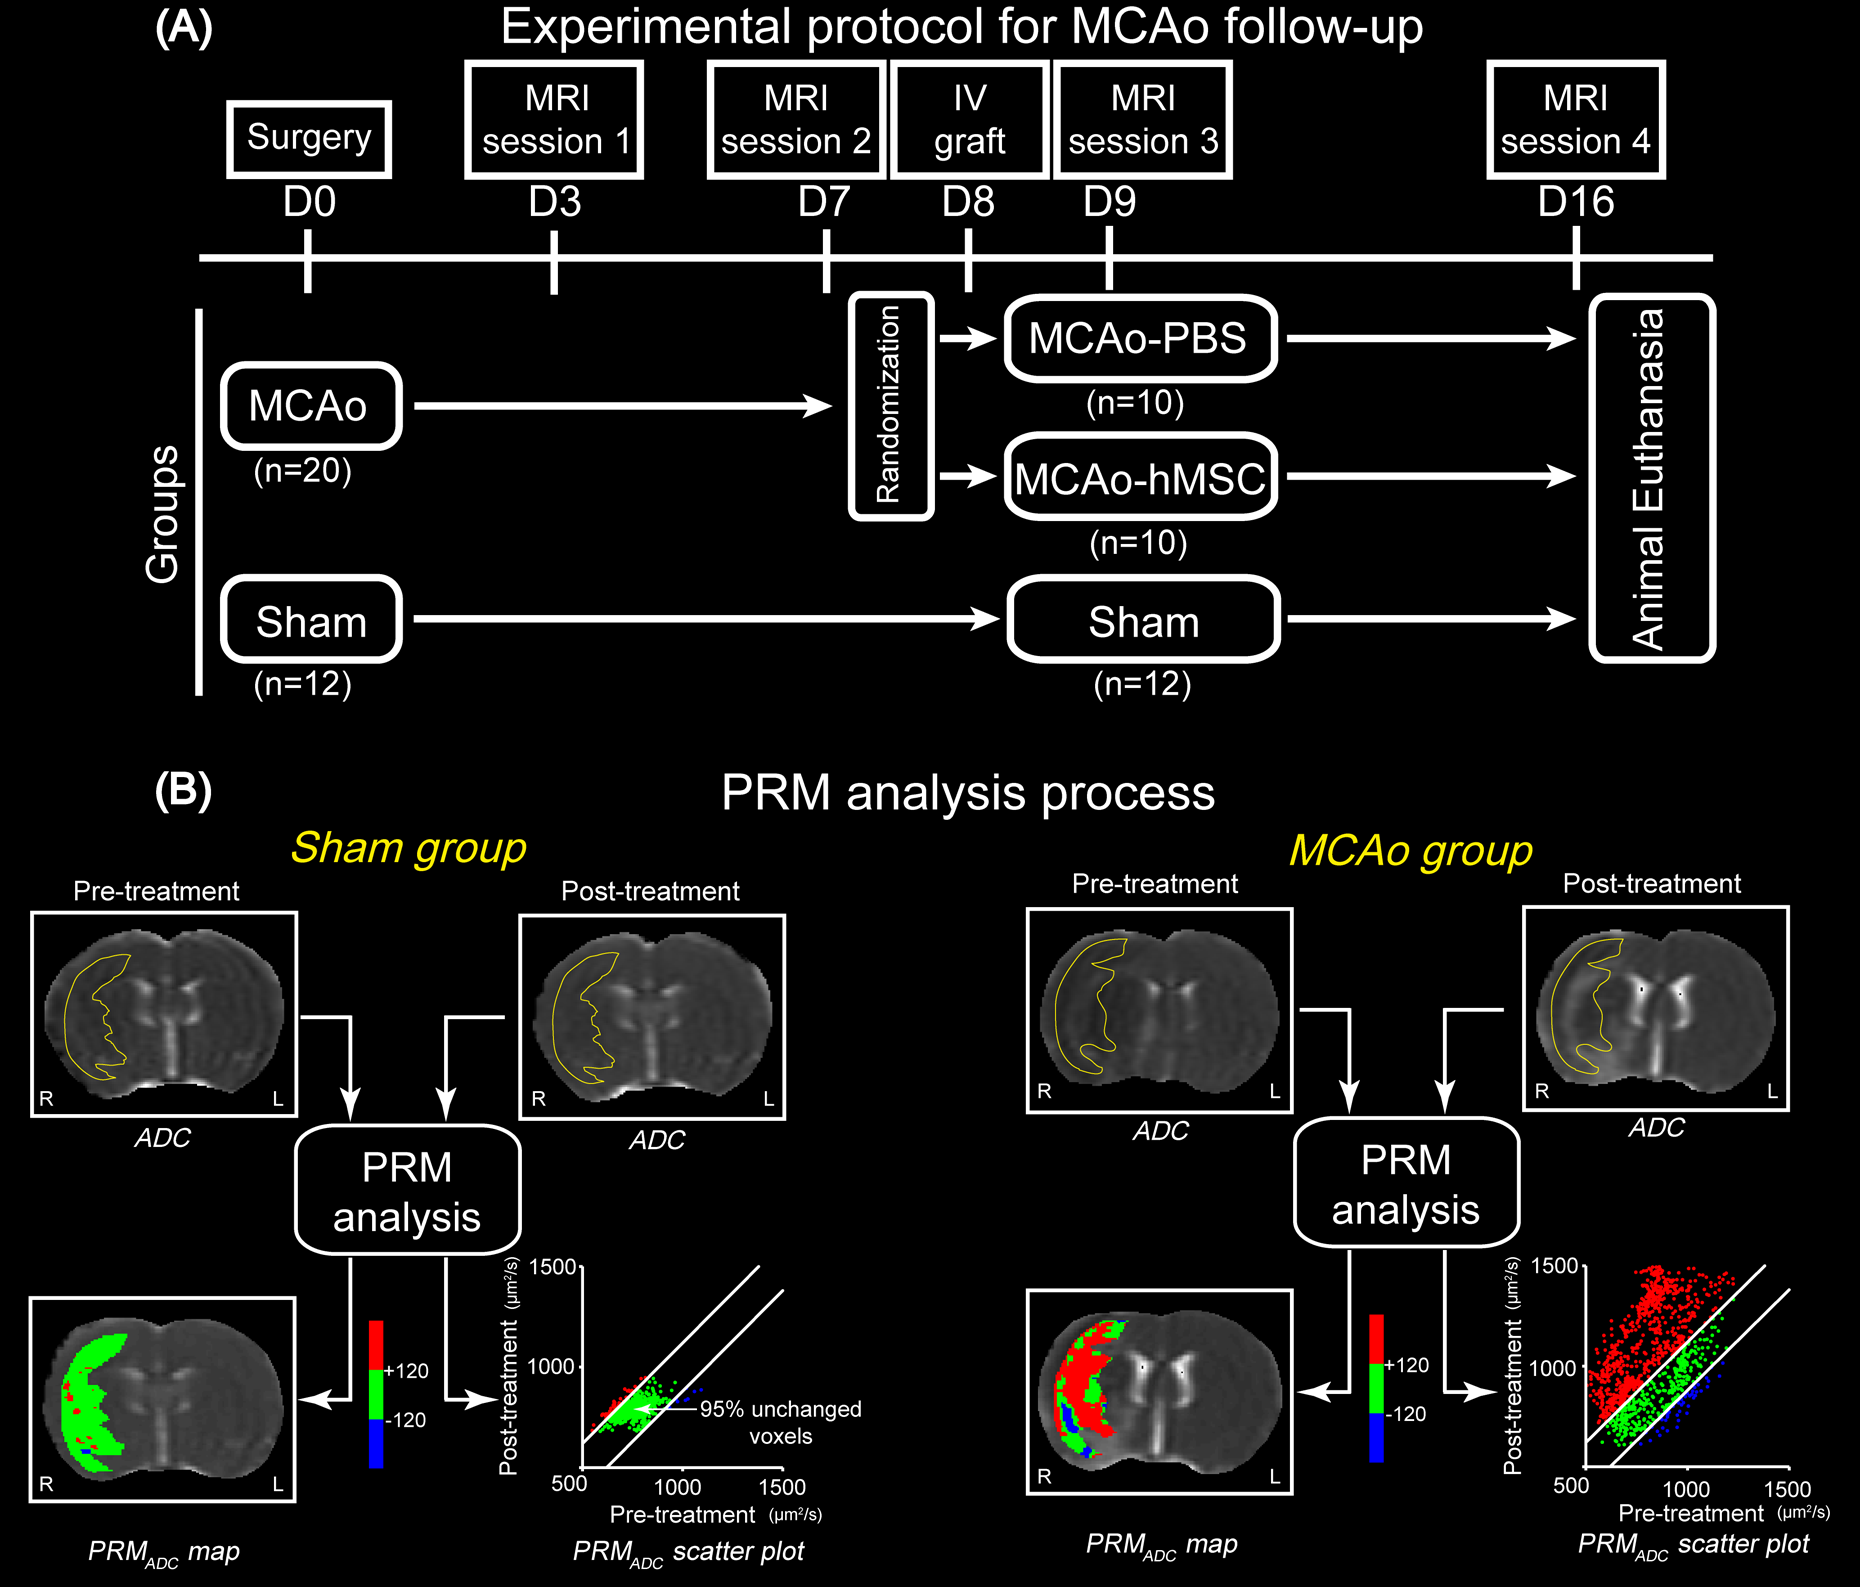
Study design and parametric response map (PRM) analysis process. (A) Experimental protocol. (B) Description of the PRM analysis. PRMADC maps appear as color-coded overlays on the apparent diffusion coefficient (ADC) maps. Areas with unchanged ADC values are in green, increased ADC are in red, and decreased ADC are in blue. The scatterplot represents the 2 coordinates of a spot and are the ADC values of the same pixel at 2 time points. CI, confidence interval; L, left hemisphere; R, right hemisphere.
The hMSCs were used to be consistent with an ongoing clinical trial (NCT00875654). The hMSCs were isolated from bone marrow aspirated from healthy, consenting donors and cultured at 37 °C in a humidified atmosphere containing 5% CO2. Minimum essential medium with α modification supplemented with 100 μg/mL penicillin, 100 μg/mL streptomycin, and 10% fetal bovine serum was used for culturing (all reagents are from Invitrogen, Pontoise, France).
MRI Experiments: Acquisition
Each rat was analyzed by MRI (7T, Avance III console; Bruker, Ettlingen, Germany at the Grenoble MRI facility IRMaGE) for 3 wk (D3, D7, D9, and D16 after transient MCAo or sham surgery). The following sequences were performed: (i) T2-weighted images (repetition time [TR]/echo time [TE] = 2,500/60 ms, voxel = 234 × 234 × 1,000 μm3, 16 slices, 2 averages), (ii) DWI (spin echo planar imaging; TR/TE = 3,000/29 ms; voxel = 234 × 234 × 1,000 μm3; 7 slices) for 3 principal directions, and (iii) multigradient echo and spin echo (MGESE) images (TR/TE = 4,000/40 ms; 7 echoes from 2.3 to 15.6 ms, voxel = 234 × 234 × 1,000 μm3; 7 slices; 2 averages) acquired before (MGESE-pre) and 2 min after IV injection (MGESE-post) of ultrasmall superparamagnetic iron oxide particles (USPIO; P904®, Guerbet, Roissy, France; 200 μmol iron/kg body weight).
MRI Experiments: Data Processing
The apparent diffusion coefficient (ADC) map was calculated by Equation 1:
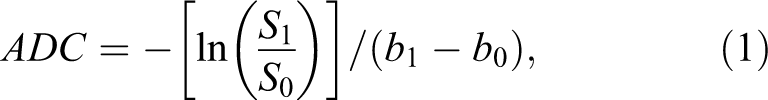
where S1 is the signal intensity (SI) of the voxel obtained through 3 orthogonally oriented DWI or diffusion trace images. S0 is the SI of the voxel obtained through reference T2-weighted images. b1 is the gradient b factor with a value of 900 s/mm2. b0 is the gradient b factor with a value of 0 s/mm2.
Cerebral blood volume (CBV) and vessel size index (VSI) maps were obtained using a steady-state approach and computed using an in-house software developed within Matlab (Version 2016b, MathWorks, Natick, MA, USA), according to Tropres et al.
22
CBV was derived from the

where γ is the gyromagnetic ratio of the proton.
VSI was derived using Equation 3, according to Tropres et al., 22 and represents the mean vessel diameter in each voxel:

Within the map of each time point, voxels for which the analysis could not be performed, for example, voxels with nonconverging fits or voxels with values outside the range of validity of the method used to measure parameters (ADC > 3,500 µm2/s; CBV > 17%; VSI > 50 µm) were identified and excluded from the analysis (fractions of all excluded voxels of each map were 12.8% for ADC, 17.5% for CBV, and 19.8% for VSI). It must be noted that the microvascular parameters (CBV and VSI) only reflect the functional vessels (i.e., those perfused by the contrast agent).
Data Analysis
ROIs
For each rat and MRI session, the whole stroke lesion, identified as the hyperintense region on the T2-weighted images, was manually delineated and subsequently checked for concordance on the ADC maps to avoid ventricles. Each lesion was delineated on all slices where it was visible4 by a blind operator. Lesion volumes were computed by calculating the sum of lesion areas on each slice. In the sham group, an ROI was delineated on the right hemisphere, which had a contour and a size similar to that of the stroke lesions observed in the MCAo groups at D0. ROIs were then transferred onto the ADC, CBV, and VSI parametric maps.
Whole-Lesion Analysis
For rat at each time point, ADC, CBV, and VSI values were measured in each ROI and are presented as mean ± standard deviation (SD).
PRM Analysis
All images were coregistered onto T2-weighted images of D3 using a fully automated, affine, mutual information–based, simplex optimization algorithm (coregistration function in SPM12 free software, distributed under the terms of the GNU General Public License as published by the Free Software Foundation; http://www.fil.ion.ucl.ac.uk/spm/software/spm12/). Changes in ADC, CBV, and VSI maps were analyzed voxel wise by PRM for each rat at different time points. For the purpose of clarity, PRM analyses on ADC maps will be described in detail (Fig. 1B). We first computed the 95% confidence interval (CI) for the classification of ADC values, as previously described. 23 Briefly, we empirically calculated, in the sham animals, the threshold that yields a significant change in ADC value for each voxel between D3 and D7. The ADC threshold (120 µm2/s) was determined by the 95% unchanged CI resulting from linear least squares analysis on the data combined from all 12 rats of the sham group (data not shown). Then, PRMADC maps were determined by calculating the difference between ADC within the stroke lesion at D3 and at the following time points (D7, D9, and D16). Red voxels represent voxels within each lesion with an increase in the ADC value (beyond the CI of 120 µm2/s; see above), blue voxels represent voxels with a decrease in the ADC value (below the CI), and green voxels represent voxels within each lesion with an unchanged ADC value (the absolute value of ΔADC varies less than the CI). Therefore, all voxels within the lesion volume were segmented into 3 fractions: PRMADC+ (increased ADC denoted red), PRMADC− (decreased ADC denoted blue), and PRMADC0 (unchanged ADC, denoted green). The same analytic procedure was applied to the CBV and VSI maps. After determining each CI (2.5% for PRMCBV and 5.8 µm for PRMVSI), PRMCBV and PRMVSI maps were obtained at D7, D9, and D16 by comparison with the data acquired at D3.
Statistical Analysis
Between-group comparison was performed using unpaired t tests after checking the variance homogeneity (Levene’s test). In cases of variance inhomogeneity, a Mann–Whitney test was used. To evaluate the PRM changes, we performed a 3-group (MCAo-PBS, MCAo-hMSC, and sham) and 3-time-point (D7, D9, and D16) mixed-design analysis of variance (ANOVA), using a Bonferroni correction for multiple comparisons. Results are expressed as mean ± standard deviation (SD). All statistical analyses were conducted with a statistical software package (SPSS; SPSS, Inc., Chicago, IL, USA). Results were declared statistically significant at the 2-sided 5% comparison-wise significance level (P < 0.05).
Results
Evolution of Lesion Volume
At each time point, the mean lesion volumes of the 2 MCAo groups were comparable (MCAo-PBS vs. MCAo-hMSC: D3: 67.5 ± 15.7 mm3 vs. 83.9 ± 24.6 mm3, D7: 91.5 ± 39.1 mm3 vs. 70.0 ± 14.3 mm3, D9: 89.3 ± 33.8 mm3 vs. 97.6 ± 9.2 mm3, and D16: 92.8 ± 24.6 mm3 vs. 107.2 ± 9.2 mm3; Fig. 2A).

In vivo magnetic resonance imaging estimated parameters: whole-lesion approach. (A) Mean lesion volume over time in the middle cerebral artery occlusion (MCAo) model, which was treated with placebo (MCAo-PBS) or human mesenchymal stem cell (MCAo-hMSC) groups and representative T2-weighted images of each group and each time point. (B) Evolution of the apparent diffusion coefficient, (C) cerebral blood volume, and (D) vessel size index maps. Data are presented as mean ± SD. For each parameter, each group and each time point, a representative map is displayed. Region of interests are delineated by a black solid line. *P < 0.05, **P <0.01: MCAo versus sham; $P < 0.05: MCAo-PBS versus MCAo-hMSC. L, left hemisphere; R, right hemisphere; PBS, phosphate-buffered saline.
Evolution of ADC
The whole-lesion approach showed that the ADC in the MCAo and sham groups were comparable at D3 and D7 and differed at D9 and D16; the mean ADC values in the lesions were increased in both MCAo groups (MCAo-PBS and MCAo-hMSC) when compared to the sham condition (D9: 1,151 ± 166 μm2/s and 1,142 ± 144 μm2/s vs.736 ± 189 μm2/s, D16: 1,582 ± 415 μm2/s and 1,753 ± 145 μm2/s vs. 789 ± 32 μm2/s; P < 0.05, respectively; Fig. 2B). Moreover, the intralesional heterogeneity in both MCAo groups was 2 times higher at D3 than that in the sham group (mean of the SD values was 127 ± 23 μm2/s and 129 ± 37 μm2/s vs. 65 ± 17 μm2/s for MCAo-PBS, MCAo-hMSC, and sham groups, respectively; Fig. 2B). This intralesional heterogeneity increased over time to reach a mean of the SD about 7 times higher in both MCAo groups than that in the sham group (mean of the SD values was 435 ± 198 μm2/s, 472 ± 121 μm2/s vs. 64 ± 31 μm2/s for MCAo-PBS, MCAo-hMSC, and sham groups, respectively; Fig. 2B).
The PRM approach showed that most of the pixels in the lesion ROIs exhibited increased ADC values in the stroke animals. At the periphery of the lesion ROIs, areas with a stable or decreased ADC were also observed at each time point (Fig. 3). A visual inspection of the maps also suggested that the PRMADC maps were relatively stable over time. The fractions of voxels with an increased (PRMADC+) or decreased (PRMADC−) ADC over time in both MCAo groups differed from those of the sham group. The PRMADC+ fractions were larger in the MCAo groups (MCAo-PBS and MCAo-hMSC) than that in the sham group at D7 (62.7% ± 12.1% and 71.9% ± 14.2% vs. 4.0% ± 3.3%, P < 0.01), D9 (68.7% ± 9.1% and 77.1 ± 9.4% vs. 2.9% ± 2.3%, P < 0.01), and D16 (78.7% ± 13.1% and 83.8% ± 8.2% vs. 3.7% ± 3.0%, P < 0.01; Fig. 4). The PRMADC− fraction was larger in the MCAo-PBS group than that in the sham group at D7 (6.1% ± 2.4% vs. 3.0% ± 2.6%, P < 0.01), D9 (6.7% ± 1.7% vs. 3.2% ± 2.6%, P < 0.01), and D16 (5.7% ± 1.7% vs. 3.0% ± 1.9%, P < 0.01). The PRMADC− fraction was larger in the MCAo-hMSC group than that in the sham group only before treatment (D7: 6.3% ± 2.3% vs. 3.0% ± 2.6%, P < 0.01). Moreover, the PRMADC− fraction decreased in the MCAo-hMSC group, in comparison to the MCAo-PBS group, after treatment (D9: 3.3% ± 2.4% vs. 6.7% ± 1.7% and D16: 3.3% ± 1.0% vs. 5.7% ± 1.7%; P < 0.01, respectively; Fig. 4). The ANOVA showed a significant increase in PRMADC+ at D7, D9, and D16 in both MCAo groups when compared to the sham group. At D3, PRMADC− was higher in both MCAo groups than that in the sham group. At D9 and D16, PRMADC− was higher in the MCAo-PBS group than that in MCAo-hMSC and sham groups, while no significant interaction was observed between the latter 2 groups.

Parametric response map of the apparent diffusion coefficient (PRMADC), cerebral blood volume (PRMCBV), and vessel size index (PRMVSI) color-coded maps overlay on ADC, CBV, and VSI maps for 2 middle cerebral artery occlusion animals. Each map corresponds to the comparison of D7, D9, and D16 with the reference point of D3. At D9, we observe a reduction of the proportion of the lesion that exhibits a decrease in ADC (less blue ADC voxels) and an increase in CBV and VSI (less red CBV and VSI voxels) in the human mesenchymal stem cell treated (hMSCs treated) rat as compare to the phosphate-buffered saline (PBS)-injected animal. At D16, we observe a reduction in the proportion of the lesion that exhibit a decrease in ADC (less blue ADC voxels) and an increase in the proportion of the lesion that exhibits and a decrease in VSI (more blue VSI voxels) in the hMSCs-treated rat as compare to the PBS-injected animal. L, left hemisphere; R, right hemisphere.
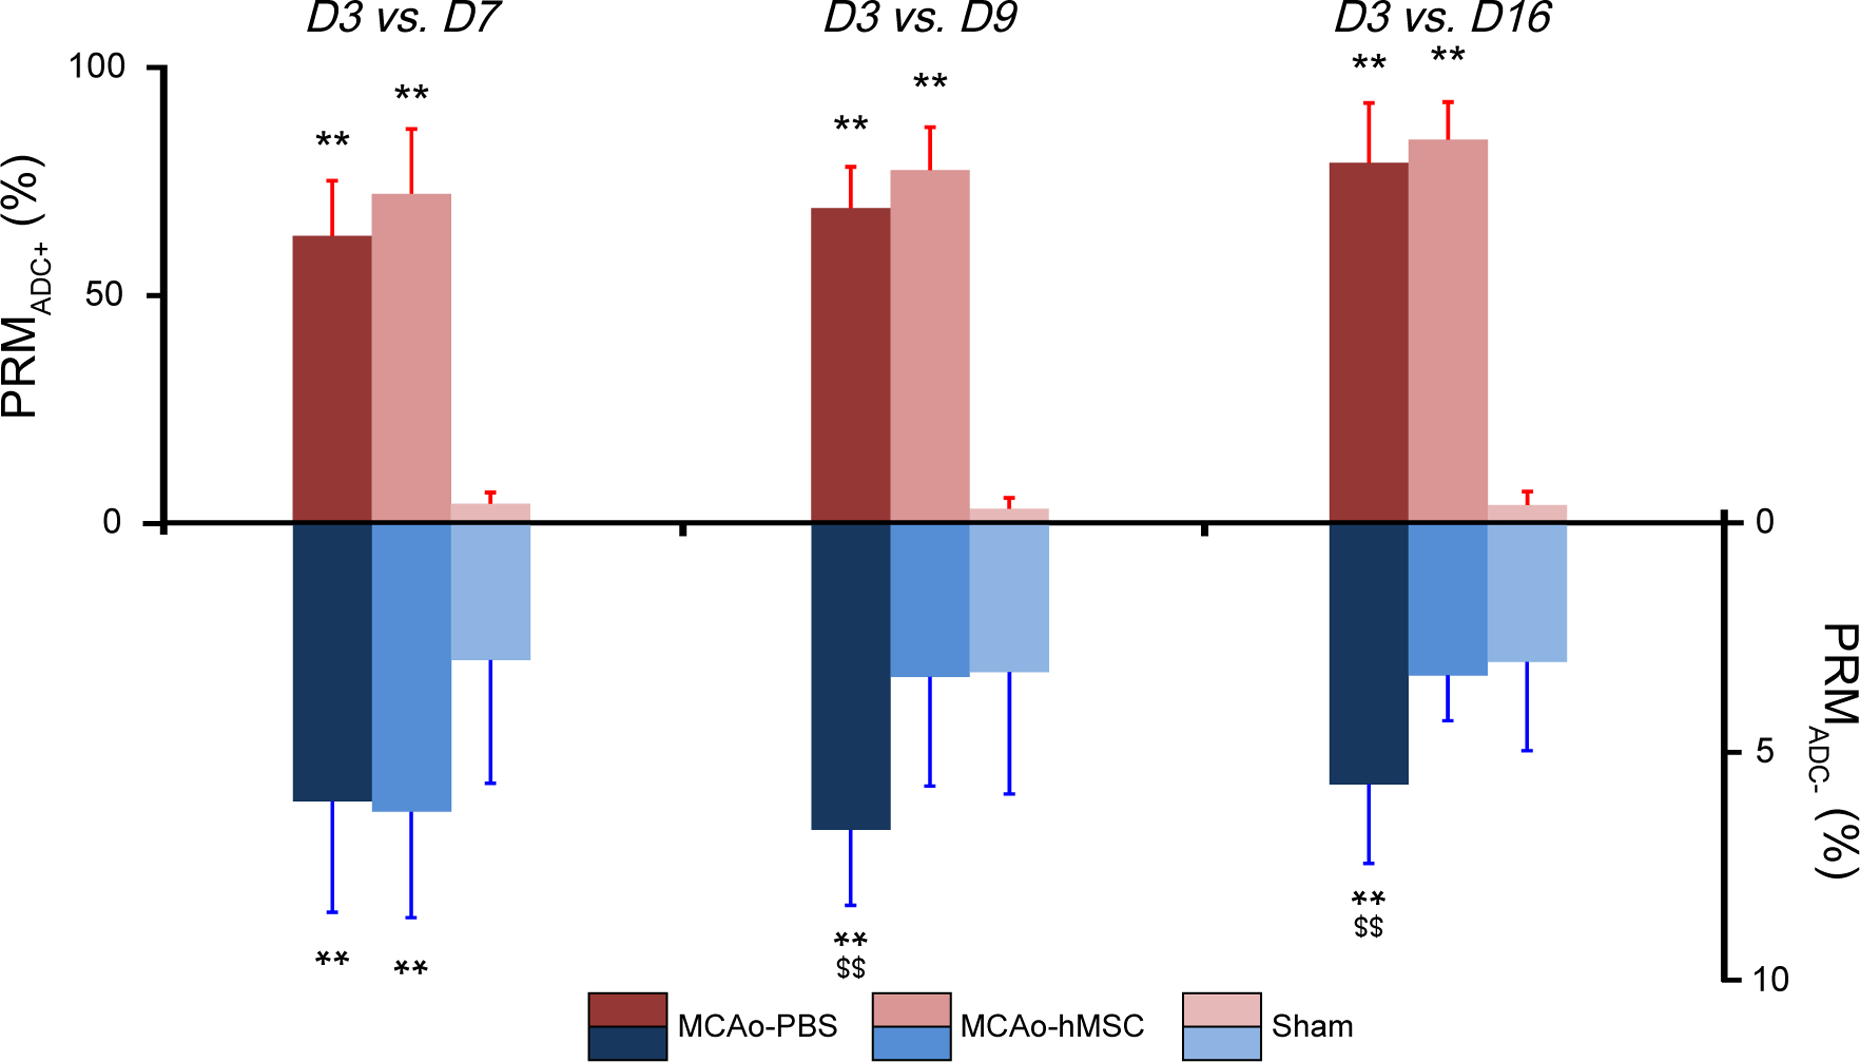
Histogram of the percentage change in parametric response map of apparent diffusion coefficient (PRMADC) values. PRMADC+ and PRMADC− over time in the middle cerebral artery occlusion (MCAo) model, which was treated with placebo (MCAo-PBS) or human mesenchymal stem cell (MCAo-hMSC) and sham groups in the right hemisphere (mean ± SD). **P < 0.01: MCAo versus sham; $$P < 0.01: MCAo-PBS versus MCAo-hMSC. PBS, phosphate-buffered saline.
Evolution of CBV
The whole-lesion approach showed that no significant CBV difference was observed between the 2 MCAo groups at each time point, but the mean CBV values in the lesions were significantly increased in both MCAo groups (MCAo-PBS and MCAo-hMSC) compared to the sham group (D3: 4.1% ± 0.4% and 4.5% ± 0.3% vs. 2.7% ± 0.7%, D7: 3.8% ± 0.3% and 4.2% ± 0.3% vs. 2.5% ± 0.6%, D9: 4.3% ± 0.4% and 4.4% ± 0.4% vs. 2.7% ± 0.3%, and D16: 4.4% ± 0.4% and 4.5% ± 0.4% vs. 2.5% ± 0.4%, P < 0.05, respectively; Fig. 2C). Moreover, lesions were more heterogeneous in both MCAo groups than that in the sham group and the difference was stable over time (mean of the SD values across time points was 2.6% ± 0.4% and 2.7% ± 0.4% vs. 1.8% ± 0.3% for MCAo-PBS, MCAo-hMSC, and sham groups, respectively; Fig. 2C).
The PRM approach yielded PRMCBV maps with a large fraction of stable CBV values. Small areas with either decreased or increased CBV appeared throughout each lesion and the positions of these modified CBV areas evolved with time (Fig. 3). The fraction of voxels with an increased (PRMCBV+) and decreased (PRMCBV−) CBV over time in the 2 MCAo groups differed from that of the sham group. The PRMCBV+ fraction was larger in the MCAo groups (MCAo-PBS and MCAo-hMSC) than that in the sham group at D7 (15.4% ± 2.4% and 16.4% ± 4.7% vs. 2.9% ± 2.3%, P < 0.01, respectively), D9 (16.1% ± 3.7% and 6.4% ± 2.6% vs. 3.9% ± 2.3%, P < 0.01 and P < 0.05, respectively), and D16 (23.7% ± 2.8% and 20.6% ± 5.0% vs. 3.5 ± 2.3%, P < 0.01, respectively). Moreover, the PRMCBV+ fraction was higher in the MCAo-PBS group than that in the MCAo-hMSC group at D9 (16.1% ± 3.7% vs. 6.4% ± 2.6%, P < 0.01; Fig. 5). The PRMCBV− fraction was larger in the MCAo groups (MCAo-PBS and MCAo-hMSC) than that in the sham group at D7 (24.1% ± 9.5% and 25.5% ± 7.5% vs. 4.8% ± 2.9%, P < 0.01, respectively), D9 (16.5% ± 6.0% and 23.5% ± 12.2% vs. 4.2% ± 2.5%, P < 0.01, respectively), and D16 (15.5% ± 4.8% and 17.9% ± 5.6% vs. 3.4% ± 1.9%, P < 0.01, respectively; Fig. 5). The ANOVA showed a significant increase in PRMCBV+ and PRMCBV− at D7, D9, and D16 in both MCAo groups when compared to the sham group. At D9, PRMCBV+ was significantly higher in the MCAo-PBS group than that in the MCAo-hMSC group.

Histogram of the percentage change in the parametric response map of the cerebral blood volume (PRMCBV) values. PRMCBV+ and PRMCBV− over time in the middle cerebral artery occlusion (MCAo) model, which was treated with placebo (MCAo-PBS) or human mesenchymal stem cell (MCAo-hMSC), and sham groups in the right hemisphere (mean ± SD). *P < 0.05, **P < 0.01: MCAo versus sham; $$P < 0.01: MCAo-PBS versus MCAo-hMSC. PBS, phosphate-buffered saline.
Evolution of VSI
The whole-lesion approach showed that the VSI value measured in each lesion was higher in both MCAo groups (MCAo-PBS and MCAo-hMSC) than that in the sham group at D3 (11.2 ± 0.6 μm and 11.9 ± 0.2 μm vs. 5.6 ± 0.6 μm, P < 0.05, respectively), D7 (10.3 ± 0.5 μm and 10.0 ± 0.1 μm vs. 5.0 ± 0.3 μm, P < 0.05, respectively), D9 (10.0 ± 0.3 μm and 10.2 ± 0.3 μm vs. 5.2 ± 0.2 μm, P < 0.05, respectively), and D16 (9.4 ± 0.5 μm and 7.6 ± 0.4 μm vs. 5.1 ± 0.6 μm, P < 0.05, respectively; Fig. 2D). Moreover, no difference in VSI was observed between the MCAo groups (MCAo-PBS and MCAo-hMSC) at D3, D7, and D9. However, at D16, the mean VSI value was higher in the MCAo-PBS group than that in the MCAo-hMSC group (9.4 ± 0.5 μm vs. 7.6 ± 0.4 μm, P = 0.047). Moreover, the intralesional heterogeneity in both MCAo groups was higher and stable over time as compared to the sham group (mean of the SD values across time point was 4.8 ± 0.5 and 4.8 ± 0.5 vs. 3.3 ± 0.6 μm for MCAo-PBS, MCAo-hMSC, and sham groups, respectively; Fig. 2D).
With the PRM approach, PRMVSI maps exhibited patterns similar to those of PRMCBV: A large unchanged VSI fraction with small areas of modified VSI distributed throughout each lesion, the positions of which varied with time (Fig. 3). The fraction of voxels with increased (PRMVSI+) and decreased (PRMVSI−) VSI, over time, in both MCAo groups differed from that of the sham group. The PRMVSI+ fraction was larger in the MCAo groups (MCAo-PBS and MCAo-hMSC) than that in the sham group at D7 (12.3% ± 2.9% and 14.3% ± 3.6% vs. 4.0% ± 2.4%, P < 0.01, respectively) and D16 (24.4% ± 5.4% and 21.0% ± 5.7% vs. 5.0% ± 2.9%, P < 0.01, respectively). Moreover, the PRMVSI+ fraction at D9 was higher in the MCAo-PBS group than that in either the MCAo-hMSC or sham groups (17.5% ± 6.3% vs. 5.4% ± 2.6% and 4.7% ± 2.5%, P < 0.01, respectively; Fig. 6). The PRMVSI− fraction was larger in the MCAo groups (MCAo-PBS and MCAo-hMSC) than that in the sham group at D7 (17.7% ± 8.3% and 18.5% ± 4.4% vs. 4.7% ± 2.7%, P < 0.01, respectively), D9 (19.6% ± 8.2% and 21.2% ± 8.7% vs. 4.7% ± 2.4%, P < 0.01, respectively), and D16 (13.6% ± 4.9% and 18.3% ± 4.9% vs. 4.3% ± 2.1%, P < 0.01, respectively). Moreover, the PRMVSI− fraction at D16 was lower in the MCAo-PBS group than that in the MCAo-hMSC group (13.6% ± 4.9% vs. 18.3% ± 4.9%, P < 0.01; Fig. 6). The ANOVA showed a significant increase in PRMVSI− at D7, D9, and D16 in both MCAo groups when compared to the sham group. At D16, PRMVSI− was significantly higher in the MCAo-hMSC group than that in the MCAo-PBS group. At D7 and D16, PRMVSI+ was significantly higher in both MCAo groups than that in the sham group. At D9, PRMVSI+ was significantly higher in the MCAo-PBS group than that in MCAo-hMSC and sham groups, while no significant difference was observed between the latter 2 groups.
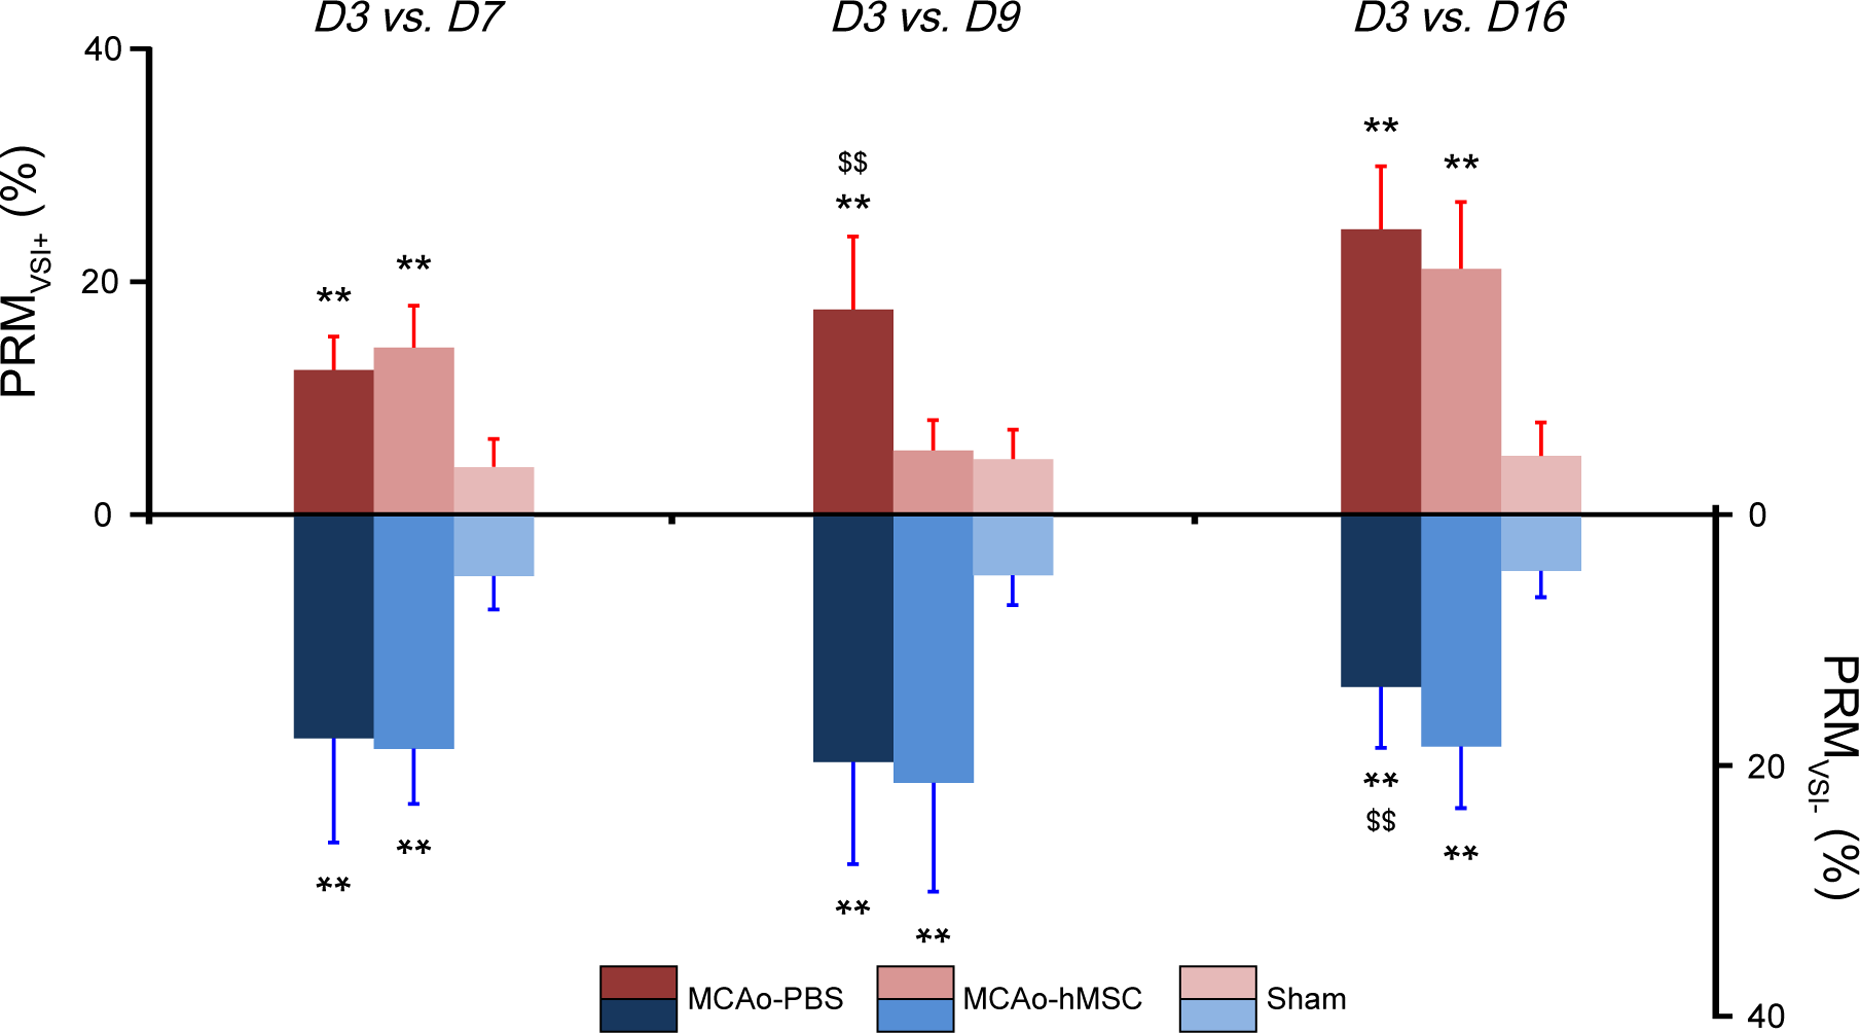
Histogram of the percent changes of the parametric response map of the vessel size index (PRMVSI) values. PRMVSI+ and PRMVSI− over time in the middle cerebral artery occlusion (MCAo) model, which was treated with placebo (MCAo-PBS) or human mesenchymal stem cell (MCAo-hMSC) and sham groups in the right hemisphere (mean ± SD). **P < 0.01: MCAo versus sham; $$P < 0.01: MCAo-PBS versus MCAo-hMSC. PBS, phosphate-buffered saline.
Discussion
In this study, we analyzed MRI data collected from a stroke model undergoing cell therapy. Two analysis techniques were compared: the whole-lesion approach, which yields a mean estimate of the entire lesion for each MRI parameter, and PRM, a voxel-based approach, which describes the fraction of voxels that evolves beyond a given threshold for each parameter. As expected, we observed a large heterogeneity in the stroke lesion in the ADC, CBV, and VSI maps. Furthermore, our results show that the IV injection of hMSCs induced microvascular modification in the stroke lesion, assessed by MRI, and analyzed by PRM. The microvascular MRI results are in agreement with previously reported biological data obtained in the same experimental conditions (release of angiogenic factors such as Ang2, Ang1, stromal cell–derived factor 1 (SDF-1), and transforming growth factor β1 (TGF)). 21 The early therapeutic response (D9, 1 d after treatment) was easily observed and quantified by the PRM analysis, whereas the whole-lesion approach remained blind to these changes due to the heterogeneity of stroke lesions (Table 1).
Quantitative Measures of 2 Analytic Approaches between MCAo Groups Analyzed by the Whole-Stroke Mean and PRM Approaches.

Note. Parametric values are expressed as mean ± standard deviation. MCAo, middle cerebral artery occlusion; PBS, phosphate-buffered saline; hMSC, human mesenchymal stem cell; ADC, apparent diffusion coefficient; CBV, cerebral blood volume; VSI, vessel size index; PRM, parametric response map; D, day.
*P < 0.05 and **P < <0.01 indicate a statistically significant difference between MCAo-PBS and MCAo-hMSC.
As expected for a transient ischemic stroke model, ADC values calculated for each lesion by the whole-lesion approach were significantly larger in the MCAo groups than that in the sham group from D9. 24,25 However, unlike the PRM approach, the increase in ADC observed with the whole-lesion approach failed to account for some small areas where ADC remained lower than normal in both MCAo groups at D7. This fraction of voxels with a reduced ADC is reduced by the hMSC treatment at D9. In this case, the PRM highlights the effect of therapy that was not revealed by the whole-lesion approach.
We also monitored microvascular remodeling by assessing CBV and VSI, which are established methods of characterizing the changes elicited by stroke therapy. 4,22,26 The therapeutic effect for these 2 parameters was spatially distributed among small regions with varying microvascular parameters. Moreover, focal changes were detected by PRM in both the VSI and CBV maps at both D9 (1 d after treatment) and D16. These focal changes could not be detected by the whole-lesion approach, except for VSI at the last time point (D16). We also observed that the changes in VSI and CBV throughout the whole lesion changed positions over time. To further understand the complex and heterogeneous evolution of the lesion, one needs new analysis tools to explore how different subregions in the lesion evolve over time. Research on stem cells injected either directly into the lesions 4 or IV, as this study 21 has been conducted by our group. It is especially noteworthy that a recent previous study under the same experimental conditions including an MCAo model and stem cell type showed a therapeutic effect upon the microvascular characteristics assessed by in vivo MRI. If the biological effects of hMSC therapy in stroke lesions are indeed beyond the scope of the general methodology of MRI analysis in that study, PRM appears to be a suitable tool to guide the ex vivo biological analysis toward areas that have undergone physiological changes.
Adverse events such as respiration and circulation impairments due to cell therapy depend on various factors including delivery route, velocity, and cell characteristics. 27,28 In our case, previous preclinical studies using the same experimental procedure indicate that the observed effects are not related to lung embolism or transient vessel clotting; none of these side effects was observed either by respiration monitoring or by brain histology. 12,21 However, as PRM may highlight small areas undergoing microvascular changes between sessions, we expect that the PRM approach would be sensitive to the occurrence of a local microvascular clot and thereby serve as a safety monitoring tool.
Too few hMSCs reached the lesion (about 1/10,000 injected cells) to have a local impact, suggesting that systemic effects rather than local effects contribute during the treatment. Interestingly, Moisan et al. showed that the injection of hMSCs has late behavioral benefits (about 7 wk after injection) in addition to the previously mentioned early angiogenic effect (9 d after injection). 21 Altogether, this suggests that an early angiogenic effect could be a marker of improved long-term recovery. The proposed MRI approach could help evaluate the causal nature of this potential link. Moreover, the intralesional regions identified by PRM may help guide future tissue sampling and lead to new histological and molecular analysis and findings (PRM-guided biological analysis).
Overall, IV-injected hMSCs affected only a fraction of lesions. Both increases and decreases in MRI parameters were observable throughout the lesions and over time. Given the initial heterogeneity of the lesions and the underlying brain tissue, these findings are not surprising. This also suggests that longitudinal imaging data from previous clinical trials such as neuroprotective drug trials should be reanalyzed to evaluate if some negative results could be ascribed, at least in part, to the coarse analysis approach employed.
Conclusion
This study describes the application of PRM analysis to multiparametric MRI maps (ADC, CBV, and VSI) after a delayed IV injection of hMSCs in a transient stroke model. One day after treatment, the PRM analysis was able to highlight changes induced by hMSCs on cellular edema, microvascular plasticity, and vasodilation, whereas the classic whole-lesion approach was unable to assess these early therapeutic effects. The PRM approach also indicated that changes occur at different locations within the lesion and at different time points. For longitudinal studies, PRM analysis thus appears to be a promising technique for the early detection of heterogeneous changes induced by cell therapies in heterogeneous lesions, such as those which characterize ischemic stroke.
Footnotes
Acknowledgments
We thank the Grenoble MRI Facility (IRMaGe) and the Departments of Neurology and Neuroradiology and MRI of the University Hospital of Grenoble for their valuable technical support. We are also grateful to the E-Cell France platform (French network for regenerative medicine) for providing clinical grade stem cells.
Ethical Approval
This study was approved by the “Grenoble Institut des Neurosciences” ethical committee (agreement 004).
Statement of Human and Animal Rights
All animal procedures were carried out in accordance with the French guidelines on the use of animals in scientific investigations (permits 381106 for A.M., 380820 for C.R., and A3851610008 for experimental and animal cares facilities).
Statement of Informed Consent
There are no human subjects in this article and informed consent is not applicable.
Declaration of Conflicting Interests
The author(s) declared no potential conflicts of interest with respect to the research, authorship, and/or publication of this article.
Funding
The author(s) disclosed receipt of the following financial support for the research, authorship, and/or publication of this article: IRMaGe is partly funded by the French program “Investissement d’Avenir” run by French National Research Agency, grant “Infrastructure d’avenir en Biologie Santé”—ANR-11-INBS-0005.