
Abstract
Because of the worldwide shortage of renal grafts, kidney transplantation (KTx) from donors after cardiac death (DCD) is an alternative way to obtain KTx from brain-dead donors. Although the prognosis of DCD KTx is gradually improving, the graft often undergoes delayed graft function (DGF), rendering the control of DGF essential for post-KTx patient care. In an attempt to characterize etiology of DGF, genome-wide gene expression profiling was performed using renal biopsy samples performed at 1 h after KTx from DCD and the data were compared with those of KTx from living donors (LD). A total of 526 genes were differentially expressed between them. Genes involved in acute inflammation were activated, while metabolic pathways were consistently downregulated in DCD. These findings imply the inferior performance of the DCD grafts relative to LD grafts. Several genes were identified where the expression levels were correlated well with parameters indicating short- and long-term prognosis of the DCD patients. In addition, several genes encoding secretory proteins were identified that might reflect the performance of the graft and be potential noninvasive biomarkers. These data provide a good source for candidates of biomarkers that are potentially useful for the control of DGF.
Introduction
Kidney transplantation (KTx) is one of the options for treatment of end-stage renal diseases. During the past several decades, and particularly in recent years, the outcome of KTx has improved progressively because of a better understanding of the mechanism of organ failure, improvements in surgical and perioperative management, greater insight into the process of organ rejection, and the development of better immunosuppression protocols (1). Deceased donor kidneys, mainly from brain-dead donors, are generally used although the outcomes are less satisfactory over both the short and long term than those of grafting from living donors (LD) (1). However, because of a worldwide shortage of renal grafts, transplantation from donors after cardiac death (DCD) is becoming an alternative method to that from brain-dead donors (15,22,23). In addition, because legal and ethical problems preclude brain-dead donors, most of the cadaveric kidneys used over the past 3 decades in Japan have been derived from DCD. Since April 1979, 486 kidneys were retrieved from DCD at our single center, representing approximately 10% of all kidneys procured in Japan. Although they were often transplanted in suboptimal conditions, an in situ regional cooling technique preserved excellent renal function and good long-term graft survival (6,10,11).
KTx of DCD grafts are still associated with a high incidence of delayed graft function (DGF) and/or primary nonfunction (PNF) during the early posttransplantation period. The incidence of PNF is as small as 5%, but the majority of grafts undergo some degree of DGF (6,10,11). DGF predisposes the graft to both acute and chronic rejection, thus indicating that DGF is a crucial risk factor for the short- and long-term survival of the graft and prognosis of the recipients (2,4,5,12,17–20, 24). These situations, particularly in Japan, prompted the attempt to understand the etiology of DGF and to establish highly sensitive prognostic markers for DGF in KTx from DCD. This study examined the genome-wide expression profile of the transplanted kidney using an oligonucleotide microarray. One-hour biopsy samples from DCD KTx were analyzed and we compared the data with those from LD to achieve a better understanding of the molecular pathway for DGF and to identify novel biomarkers that are potentially used as an indicator of the recovery of graft function.
Materials and Methods
Study Design
This investigation was approved by the Institutional Review Boards of this center. Written informed consent was obtained from each patient or their legal guardian before enrollment. Patients undergoing either a living (n = 15) or DCD KTx (n = 14) at this center were prospectively enrolled. The immunosuppressive regimen was similar in all patients, consisting of basiliximab, tacrolimus, or cyclosporine with prednisone and mycophenolate mofetil.
The clinical characteristics of the patients undergoing KTx from DCD are shown in Table 1. Kidney grafts were procured at this center using an in situ regional cooling technique from DCD. All donors after cardiac death from this hospital were classified as type IV in this study. The cause of donor death was cerebrovascular disease in all cases. Although most of those cases required hemodialysis (HD: 0–22 days) after KTx because of DGF, the function of all of transplanted kidneys eventually recovered. All kidney grafts from LD were procured by an open nephrectomy in this study.
Patient Characteristics: Donation After Cardiac Death (DCD)

CVA, cerebrovascular attacks; FK, tacrolimus; CsA, cyclosporine; MMF, mycophenolate mofetil.
One-Hour Biopsy and RNA Extraction
Graft biopsies were performed 1 h after reperfusion during the kidney transplant operation using biopsy needles. Biopsy samples were stored immediately in RNA later (Applied Biosystems). Total cellular RNA was extracted from frozen samples using RNeasy (Qiagen, Valencia, CA, USA).
Microarray Analysis
For DNA microarray experiments, 200-ng aliquots of total RNA were labeled using the Agilent Low RNA Input Fluorescent Linear Amplification Kit (Agilent Technologies, CA) according to the manufacturer's instructions. RNA purified from each kidney graft was used for microarray analysis (Cy5 labeled), with pooled RNA derived from normal kidneys (Homan Kidney Total RNA #636529 BD, Franklin Lakes, NJ, USA) as a template control (Cy3 labeled). After checking the labeling efficiency, 1 μg aliquots of Cy3-labeled normal control RNA and Cy5-labeled RNA from individual grafts were mixed, and then hybridized to Agilent Human 1A (Ver. 2) Microarrays (Product No. G4110B) according to the manufacturer's hybridization protocol. After washing, the microarray slides were analyzed with an Agilent Microarray scanner and software (scanner model G2565BA). Data analysis was performed using Agilent Feature Extraction software (Ver. A.7.1.1), and Excel 2007 (Microsoft).
The data were imported into GeneSpring GX 7.3.1 (Silicon Genetics, Redwood City, CA), and per spot, per chip, and then intensity dependent (lowess) normalization was applied for each array. To avoid any false-positive signals, genes for which the signal levels of the normal reference sample were below 20 were excluded. The ratio of the normalized channels (Cy5/Cy3) was used to assess the level of expression among the samples. The GeneSpring software was also used to perform gene ontology (GO) analysis, in which genes were organized into hierarchical categories based on biological process and molecular function. The data were also transferred to the Ingenuity Pathway Analysis (v. 5.1.1; Ingenuity, Redwood City, CA), a web-based application that assists biologists to discover, visualize, and explore networks relevant to their gene expression array data sets. Primary microarray data are available at Fujita Health University Microarray Database (http://www.fujita-hu.ac.jp/~genome/ma/index.html) and the Gene Expression Omnibus (GEO; accession number GSE10419).
Reverse Transcriptase Polymerase Chain Reaction (RT-PCR)
For the preparation of cDNAs, 4 μg of heat-denatured RNA was used in a reverse transcription (RT) reaction. The reaction mixture (total volume, 20 μl) contained 4 μg of RNA, 0.5 mM of each dNTP, 6 μg of random primers (Invitrogen, Japan), 10 U of RNase inhibitor, and 4 U of reverse transcriptase with the appropriate buffer from the Omniscript RT Kit (Qiagen, Japan) according to the manufacturer's instructions. The solution was incubated for 60 min at 37°C and then was boiled at 95°C for 5 min to arrest the reaction.
A real-time PCR analysis was performed with a LightCycler apparatus (Roche Diagnostics, Tokyo, Japan). The primers and probes were designed with the assistance of the Oligo 4.0 computer program (National Biosciences, Plymouth, MN), and the primer and probe sequences for the genes are displayed in Table 2. For construction of the plasmid calibrators, the PCR products of each gene were cloned into pGEM T Easy Vector (Promega, Tokyo, Japan) and sequenced. Standard curves were generated using serially diluted solutions of each plasmid clone. The sensitivity was usually in the range of 101 to 1010 copies/μl.
Probes, Primers, and PCR Conditions

FW, forward; RV, reverse; Flu, fluorescein probe; LC, LC Red probe.
Statistical Analyses
The results are expressed as the mean ± SEM. Statistical comparison between groups was performed by Student's t-test and one-way analysis of variance (ANOVA, Multiple Testing Correction using Westfall and Young Permutation in the GeneSpring software), and differences were considered to be significant at p < 0.05. Correlations were evaluated with linear straight-line regression. In significant difference tests, p-values were calculated with the ζ conversion of Fisher's r. Values of p < 0.05 were also considered statistically significant.
Results
Analysis of Gene Expression Profiles
A microarray analysis was done on two groups of 1-h biopsy samples of KTx: 15 kidneys from LD KTx and 14 kidneys from DCD KTx. A total of 29 samples were examined for the expression of all 20,173 genes in the array. After the exclusion of certain genes with low signals from analysis, a total of 17,498 genes were subjected to further analysis. To understand the etiology of the DGF that inevitably arises in DCD KTx, data from the DCD group were compared with those from LD group and select genes that showed significantly different expression levels between the two groups (p < 0.05). A total of 526 genes were found to show significantly different expression profiles between the two groups. There were 122 upregulated genes, while 404 genes were downregulated relative to the normal kidney. In the 526 genes, the expression of 117 genes was greater than that of LD, while that of 409 genes was smaller. The genes significantly upregulated in the DCD group and that were at least twofold changes than that of normal kidneys are shown in Table 3.
The Significantly Upregulated Genes in the DCD Kidneys

All data were sorted by the fold change of DCD.
Molecular Functions and Biological Processes of the Differentially Expressed Genes
To further elucidate the biological processes of DGF that are specifically activated in kidney grafts from DCD, a GO analysis of the 526 genes that were expressed differentially between 1-h biopsy samples from DCD and LD was conducted. These genes were assigned to six functional categories for biological processes and nine further categories corresponding to molecular function (Fig. 1). The most significant GO biological process category was found to be “metabolism” followed by “cell growth and/or maintenance.” For the molecular function category, “transporter activity” was high on the list, while “chaperon activity” was also on the list.
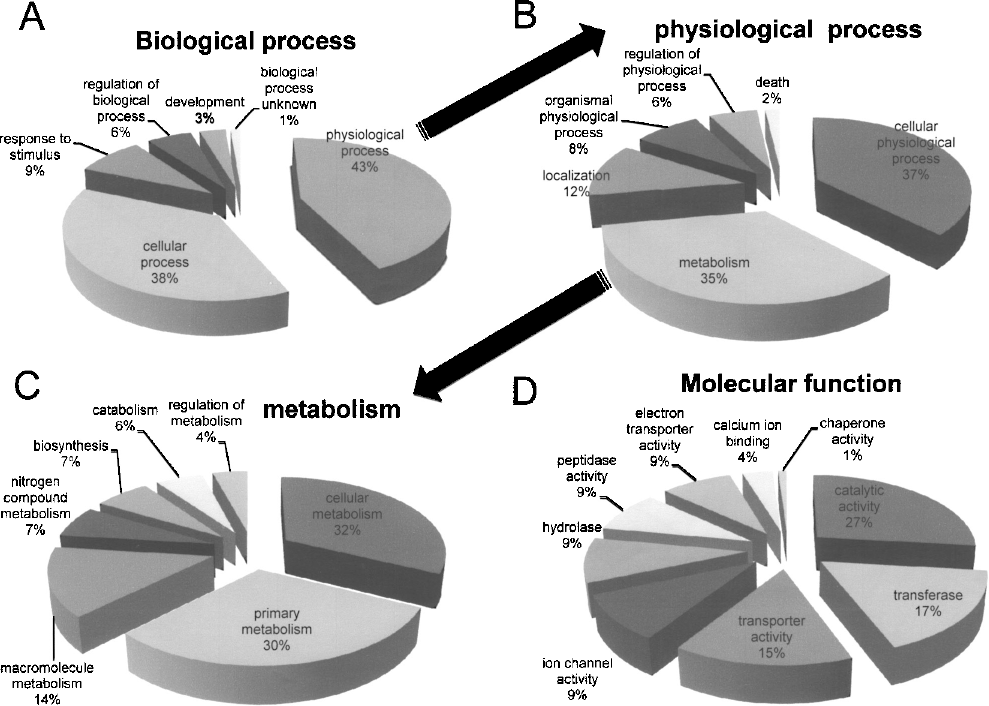
The biological process and molecular function of the 526 genes that were up- or downregulated significantly in kidneys from DCD compared with those from LD. (A) Category classified with biological process. (B) Subcategory within the physiological process among the biological processes. (C) Subcategory within the metabolism among the physiological process. (D) Category classified with molecular function.
The biological processes involved in the activated genes in kidney grafts from DCD were further investigated, based upon the gene expression data, by performing an IPA analysis of the genes differentially expressed between the groups. First, the selected 526 genes were imported to the IPA database including the molecular pathways that were formally acknowledged (Canonical Pathways). Pyruvate metabolism, valine, leucine, and isoleucine degeneration, β-alanine metabolism, fatty acid metabolism, glycerolipid metabolism, butanoate metabolism, xenobiotic metabolism signaling, and tryptophan metabolism pathways as well as the complement and coagulation cascades were the most significant for the gene data set and high up on the list. Most of these top 10 pathways are associated with metabolism, which is consistent with the findings of the GO analysis. Notably, almost all of the genes identified on these pathways were downregulated in the DCD group and upregulated in the LD group relative to the normal kidney (Fig. 2). In contrast, in the complement and coagulation cascades, almost all of the genes focused on this cascade were upregulated in the DCD group and downregulated in the LD group (Fig. 2B).

Molecular pathway involved in DGF. (A) Fatty acid metabolism and (B) complement pathways were shown with the networks of genes. Red indicates upregulated genes relative to normal kidneys, while green shows downregulated genes. The genes indicated by a dark color were found to show significant differences in the expression between DCD and LD. Genes with lower p-value are indicated in bold. Boxes: secretory proteins; ovals: transcription factors; diamonds: enzymes; circles: others. The numbers indicate Enzyme Commission numbers.
Several noncanonical networks were also generated from the imported gene sets (Table 4). Along with the pathways involving inflammation or metabolism, pathways for cellular compromise or cell death were high up on the list. The network focus genes of this pathway included the heat shock proteins as well as caspase, which are associated with apoptosis.
Genetic Networks Affected by DCD

Pathways with a score greater than 4 (p < 0.0001) were combined to form a composite network representing the underlying biology of the process.
Novel Biological Markers
To identify novel biomarkers that might provide an indication of the prognosis of the DCD recipients, the expression levels of each gene was correlated with the parameters that reflect prognosis of the patients. The length of dialysis post-DCD KTx was used as a parameter indicating short-term prognosis. When the expression levels of the 526 genes were examined for any correlation with the length of dialysis post-KTx, two genes, FTHL17 (ferritin, heavy polypeptide-like 17) and GLA (galactosidase, alpha), were found to be significant (p < 0.05) (Fig. 3A). On the other hand, for a long-term prognosis, the lowest serum creatinine levels during 1-year post-KTx were used. The expression levels of two genes, GJA12 (gap junction protein, alpha 12) and PSMB10 (proteasome prosome, macropain, subunit, beta type, 10), were found to be correlated with the serum creatinine values (Fig. 3B).

Correlation between the expression levels at a 1-h biopsy and short- and long-term prognosis. (A) Correlation between the expression levels and the length of dialysis post-KTx. (B) Correlation between the expression levels and the lowest serum creatinine levels. Regression lines are shown in each figure with correlation coefficients (R2) and p-values.
It was obviously expected that soluble factors secreted into the blood or urine could be used to establish a diagnostic or prognostic system. The 526 genes were surveyed to identify genes encoding proteins with signaling sequences. The identified genes included REG1A (regenerating islet-derived 1 alpha), TIMP1 (tissue inhibitor of metalloproteinase 1), SLPI (secretory leukocyte protease inhibitor), and LTF (lactotransferrin), which are not known to be associated with renal transplantation graft failures. The validation of the microarray experiments was performed by real-time PCR (Fig. 4). All four genes were upregulated significantly in the DCD group relative to the LD group (p < 0.05). The encoded proteins are potential noninvasive indicators of the presence or absence of DGF.

Quantitative RT-PCR for secretory proteins. (A) TIMP-1, (B) REG1A, (C) lactotransferrin, and (D) SLPI. All of these genes were upregulated in the kidneys from DCD relative to a normal kidney, and they were also significantly upregulated in comparison to those from LD (*p < 0.05).
Discussion
To obtain information about a transplanted kidney, a biopsy is routinely performed 1 h after transplantation. This is used to check for preexisting lesions in the donor kidney, but it has not been helpful as an indicator for therapeutic intervention. Indeed, the efficacy of a 0-h biopsy has also been discussed (3). The interpretation of the data from a 0-h biopsy samples is simple because it reflects solely donor factors that were believed to affect the performance of transplanted organ. However, recent findings suggest the importance of recipient factors in addition to the donor factors (21). Therefore, to estimate the performance of a transplanted organ, it is reasonable to examine the information obtained from the 1-h biopsy samples that should reflect both donor and recipient factors, although the interpretation of the data requires a comprehensive analysis because multiple factors are involved. In fact, the previous data obtained from a rat KTx model system demonstrated that the expression profile of the kidney samples were dramatically changed between the samples obtained at 0 h and 1 h post-KTx (8).
In this study, one of the goals is better understanding of etiology of the DGF that exerts a profound influence on outcome of a DCD KTx. The pathways for complement and coagulation are activated, suggesting the presence of an acute inflammatory reaction. It is unlikely the consequence of a donor–recipient immunological interaction but the effect of systemic inflammation of the cadaveric organ donors (16). Cytokines as well as chemokines are also high up on the list possibly for a similar reason (9). On the other hand, genes involved in cellular metabolism were mostly downregulated, as were transporter genes. This suggests that the influence of ischemia/reperfusion damage may reduce either the organ metabolism or transporter activity, thus leading to compromised homeostasis of the grafts in DCD KTx. Because this finding has never been reported in the expression profile for kidneys from brain-dead donors, a DCD kidney might be unlikely to show comparable performance to that from brain-dead donors (7). These findings imply the inferior performance of the DCD grafts relative to LD. In addition, genes encoding molecular chaperons such as Hsp70 or Hsp90 are upregulated. This upregulation may prevent the deterioration of the DCD kidneys for an acute postoperative period, although the protective activity of heat shock proteins to DCD grafts remains controversial (9,14).
Another of the goals was to identify novel biomarkers that might provide information for the prognosis or the proper timing for therapeutic intervention. These genes should reflect the level of DGF that indicates the prognosis after DCD KTx. The length of dialysis post-KTx and the lowest serum creatinine levels during 1-year post-KTx were used as parameters indicating the short-term and long-term prognosis, respectively. Two genes (FTHL17 and GLA) associated with the short-term indicator and two (GJA12 and PSMB10) genes associated with the long-term indicator were identified. Although the four proteins encoded by these genes would be undetectable in serum or urine from the patients, they can be measured by quantitative RT-PCR using 1-h biopsy samples. A more thorough analysis using a larger sample population would reinforce the validity of these markers.
Other differentially expressed genes in 1-h biopsy specimens should reflect the transplanted organ performance and can also be used as a marker indicating the levels for DGF. Although determination of the expression levels in RNA isolated from blood or urine of the patients can be a target for noninvasive diagnosis (13), estimation of secretory proteins levels may be better biomarkers for evaluation of transplanted organ performance. Four genes were identified that encoded secretory proteins (TIMP-1, REG1A, Lactotransferrin, and SLPI). The serum or urine levels of these proteins will be determined to establish an evaluation system for DCD KTx.