
Abstract
In single-arm trials with a predefined subgroup based on baseline biomarkers, it is often assumed that a biomarker defined subgroup, the biomarker positive subgroup, has the same or higher response to treatment compared to its complement, the biomarker negative subgroup. The goal is to determine if the treatment is effective in each of the subgroups or in the biomarker positive subgroup only or not effective at all. We propose the isotonic stratified design for this problem. The design has a joint set of decision rules for biomarker positive and negative subjects and utilizes joint estimation of response probabilities using assumed monotonicity of response between the biomarker negative and positive subgroups. The new design reduces the sample size requirement when compared to running two Simon's designs in each biomarker positive and negative. For example, the new design requires 23%–35% fewer patients than running two Simon's designs for scenarios we considered. Alternatively, the new design allows evaluating the response probability in both biomarker negative and biomarker positive subgroups using only 40% more patients needed for running Simon's design in the biomarker positive subgroup only.
Introduction
Recent advances in cancer biology and genomics are shifting the focus of anti-cancer treatment development to therapies that are tailored to a particular subset of patients. There is a need to develop efficient phase 2 biomarker-guided clinical trial designs that evaluate the efficacy of a new therapy in biomarker negative and positive patients. 1 A biomarker is predictive if the treatment effect in a biomarker-defined subgroup, often referred to as the biomarker positive subgroup, is higher than the treatment effect in its complement, the biomarker negative subgroup. A prognostic biomarker is associated with response to treatment but does not necessarily modify the treatment effect. A two-arm trial is needed to evaluate a predictive biomarker. In oncology, an initial evaluation of therapies is usually done in a single-arm trial. Differential response to treatment in biomarker positive and negative patients in a single-arm study indicates that the biomarker is prognostic or predictive or both. Existing data regarding response to standard therapy is often available. Availability of such historical control data allows for predictive biomarkers to be evaluated in a single-arm trial.
The goal of an initial evaluation of targeted therapy is to make one of these potential conclusions: to continue the development of the new therapy in both biomarker positive and biomarker negative patients, to continue the development in biomarker positive patients only, or to stop the development all together. This is achieved by testing the null hypotheses about response to treatment in the biomarker positive subgroup and in the biomarker negative subgroup. This requirement guarantees that a biomarker negative subgroup is not incorrectly recommended for future development of the therapy if the therapy is ineffective in biomarker negative patients. Phase 3 trials with biomarkers often have a different goal, the goal of showing that response to treatment is significantly different from a control in the biomarker positive subgroup or in the overall population of combined biomarker negative and positive subgroups.2–4
Two-stage designs with futility stopping are widely used in single-arm phase 2 trials in oncology. 5 Simon's design 6 allows stopping an ineffective therapy early. Jones and Holmgren 7 described the simplest approach to the problem of treatment evaluation in the biomarker positive and negative subgroups, running two sub-trials with Simon's design in each biomarker-defined subgroup. The type I error rate is controlled by dividing α between the two trials. Jones and Holmgren 7 and Berry et al. 8 suggested that a biomarker stratified design is more efficient than running two independent sub-trials. A stratified design is essentially two sub-trials, one in each biomarker subgroup, with joint decision rules at the interim and final analyses. During the interim analysis, a stratified design might allow for patient enrichment to restrict the second stage enrollment to the biomarker positive subgroup. Tournoux-Facon et al. 9 considered a stratified design with efficacy stopping at the interim analysis. Freidlin and Korn 10 proposed a two-stage design with fixed order testing where the biomarker positive subgroup is tested first, and, if significant, the biomarker negative subgroup is tested. Parashar et al. 11 formalized the type I and II error rate considerations in a stratified design and tabulated decision rules for an optimal stratified Simon's design to yield the smallest expected sample size under the null hypothesis.
Stratified designs have been used in practice to evaluate targeted therapies. Andre et al. 12 evaluated trastuzumab with HER-2 overexpression as a biomarker using two Simon's designs. The trial started with a Simon's design in the combined population. If the futility boundary is crossed in the unselected population at the interim analysis, a second Simon's design is initiated in the biomarker positive subgroup only. More recently, a single-arm phase 2 “CirCe T-DM1” trial 13 evaluated the efficacy of trastuzumab-emtansine in HER2-negative metastatic breast cancer patients with HER2-positive circulating tumor cells (CTCs). The design from Tournoux-Facon et al. 9 with CTC count as a potential predictive biomarker was used in this trial.
In this article, we explore the use of isotonic estimation 14 in biomarker-guided designs. We use the assumption that the response probability in the biomarker positive subgroup is the same or higher compared to that of the biomarker negative subgroup. Isotonic estimates are the maximum likelihood estimates of response probabilities in the biomarker positive and negative subgroups under the isotonic restriction. 15 If the observed data in the biomarker positive and negative subgroups contradict the isotonic assumption, the data from the two subgroups are pooled in order to estimate the response probabilities. We show that isotonic estimation combined with joint decision rules increases the efficiency of the stratified Simon's design. We tabulate designs that minimize the expected sample size under the null hypothesis, and designs that minimize the weighted average of the expected sample sizes under the null and alternative hypotheses. We compare our proposed approach with the design of Parashar et al. 11 and with running two independent sub-trials in biomarker positive and negative subgroups using Simon's design.
The rest of the article is organized as follows. In Section 2, we describe our proposed isotonic stratified design. In Sections 3 and 4, the new design is compared with existing approaches. Our findings are summarized in Section 5.
The isotonic stratified design
Define the true response rates for the biomarker negative, B − subgroup, and the biomarker positive, B + subgroup, as
We assume a monotonic non-decreasing relationship for true response rates in the two biomarker subgroups,
The isotonic stratified design is described as follows:
Enroll Let If If If Final analysis. Let If If If Otherwise, the treatment is not effective for any population.
The flowchart of the isotonic stratified design is shown in Figure 1.
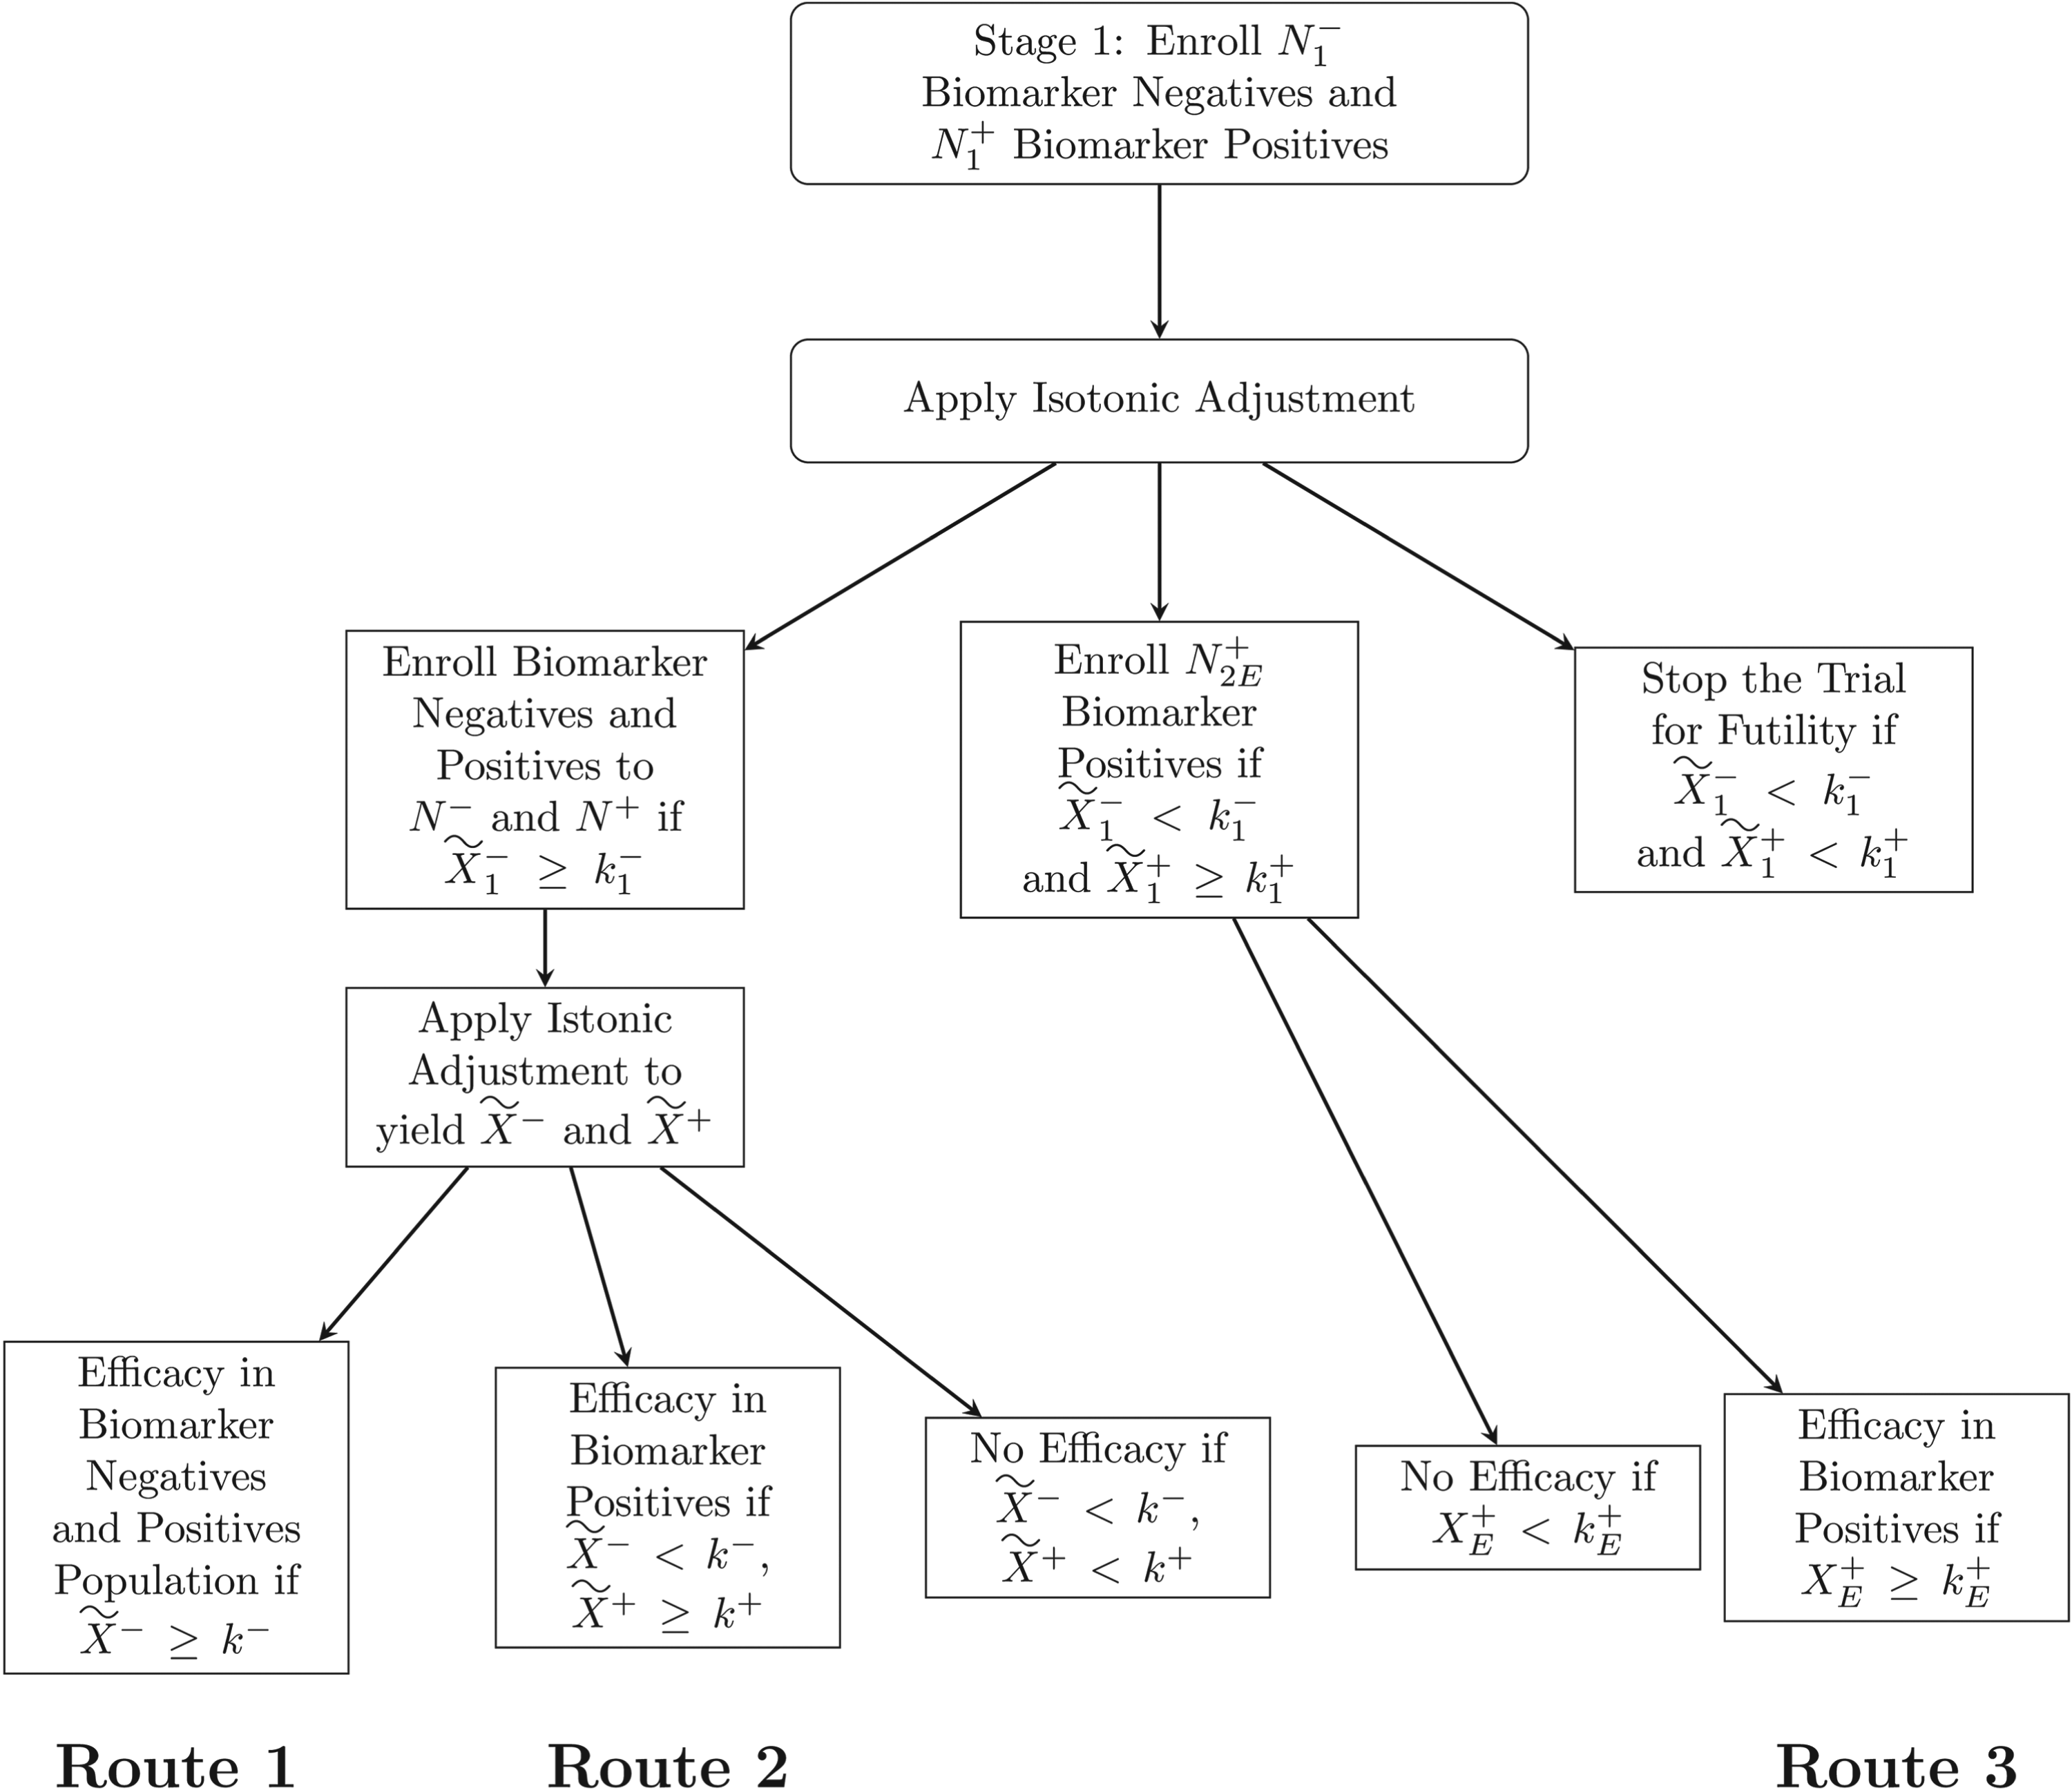
Flowchart of the isotonic stratified design.
Consider three potential scenarios for the true response probabilities in B− and B+,
Similar to the criteria proposed by Parashar et al.,
11
we aim to control the type I error in the scenario where there is no activity in B − and B + . To achieve that, we need to impose the following constraints:


We assume that the response is immediate, or the trial is paused to wait for results of the interim analysis. All the probabilities can be calculated exactly. If the trial stops for futility in both subgroups, the sample size is
Denote the expected sample size when the true response probabilities are

We compared the isotonic stratified design with two Simon's designs, in B − and B +, with joint decision rules, a stratified Simon's design from Parashar et al.,
11
the PBSWM − design or PBSWM −, and a similar design where testing starts with B+, PBSWM + . The two Simon's designs have a set of joint decision rules at the final analysis: if
The difference between PBSWM − and PBSWM + lies in the decision when the observed data is indicating efficacy in B − but no efficacy in B + . In this case, PBSWM + does not reject any null hypotheses while PBSWM − rejects both hypotheses. The isotonic stratified design pools the data observed in B − and B + and the decision is made based on the pooled estimate.
Parashar et al. 11 considered early stopping for efficacy in the PBSWM − design. We did not include early efficacy stopping in our simulation to make all designs comparable and because it is often desirable to get more experience with a new therapy in a phase 2 trial.
The two Simon's optimal designs have the type I error rate of
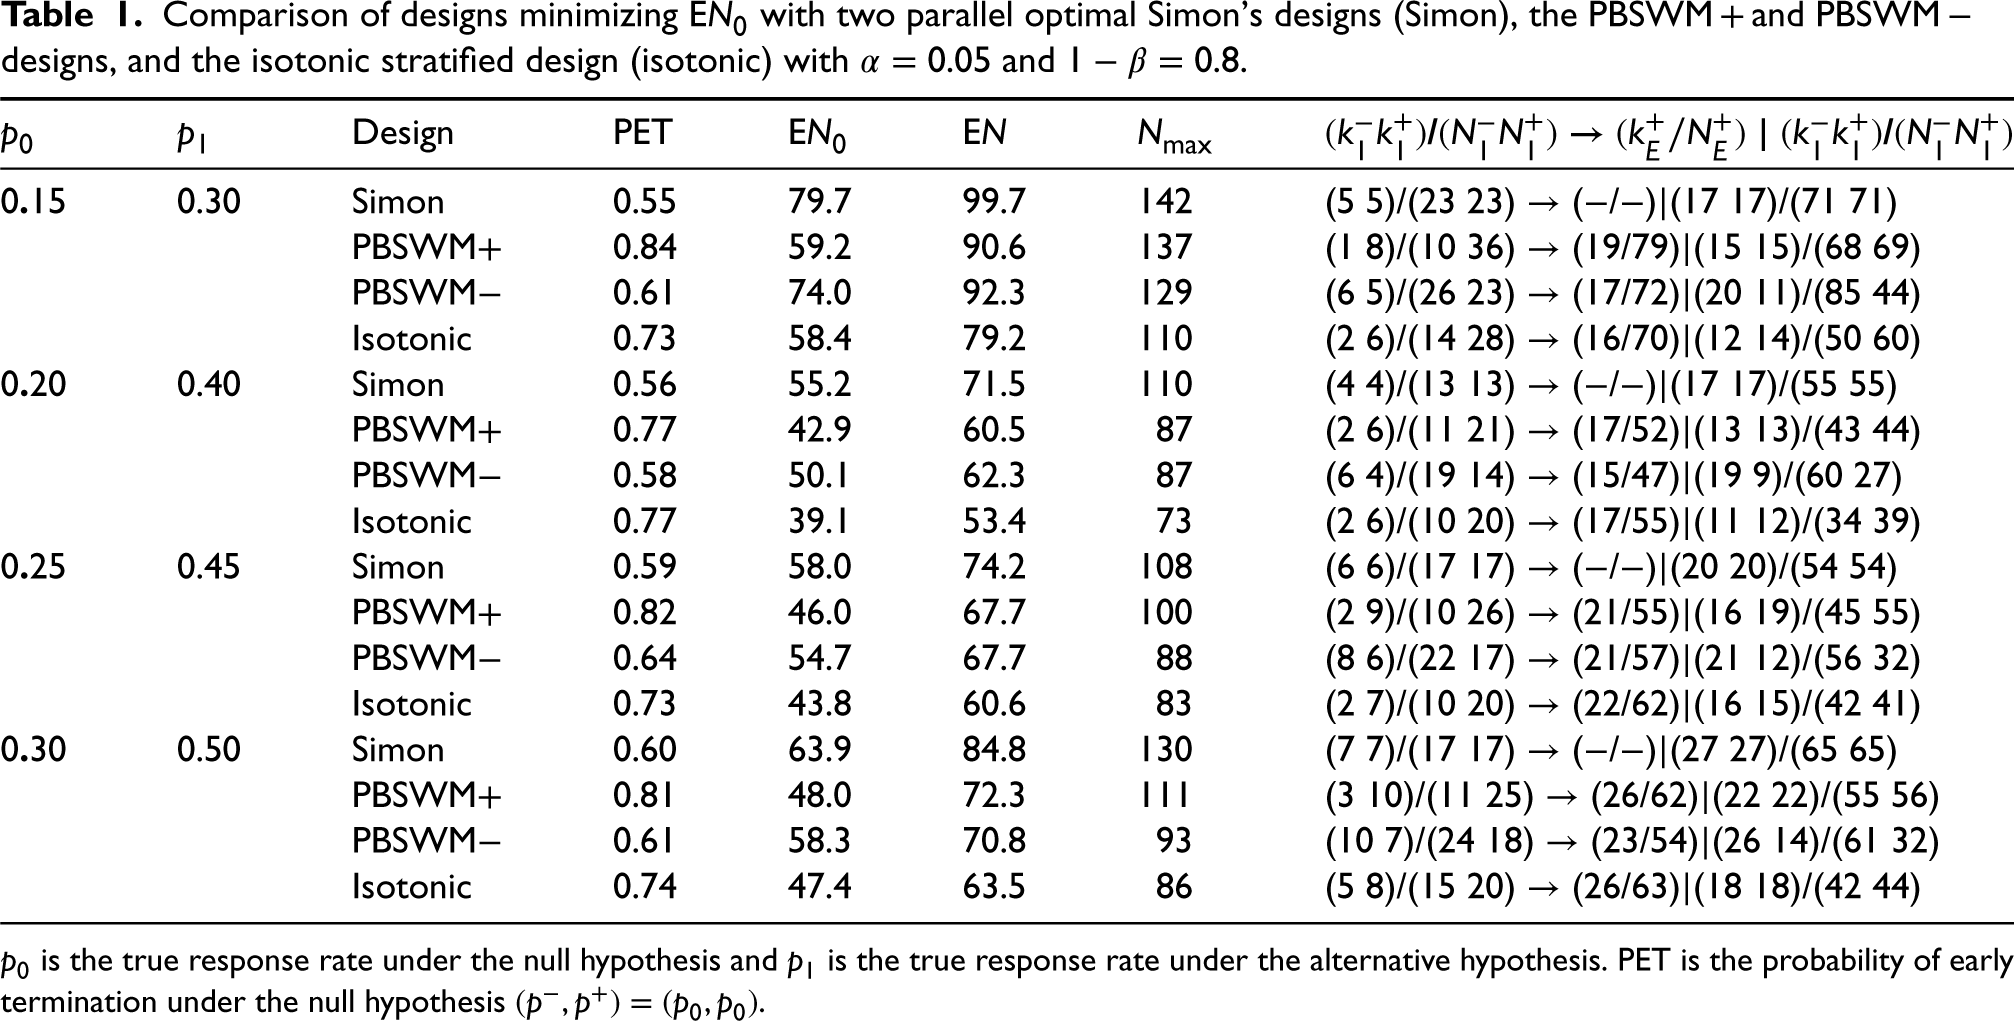
Table 1 shows the designs that optimize EN0. The isotonic stratified design minimizing EN0 significantly reduces the expected number of subjects under the null hypothesis, EN0, compared to other designs while maintaining the same or lower total sample size. Two independent Simon's optimal designs do not perform well compared to stratified designs because interim decision rules do not reflect the isotonic assumption. The PBSWM + design has the highest probability of stopping the trial early for futility. However, the isotonic stratified design yields about the same EN0 as PBSWM + because the isotonic stratified design requires a much smaller total sample size Nmax. The isotonic stratified design has the best EN (Table 1) and performs better overall compared to both PBSWM − and PBSWM + .
Comparison of designs minimizing EN0 with two parallel optimal Simon's designs (Simon), the PBSWM + and PBSWM − designs, and the isotonic stratified design (isotonic) with
and
.
Comparison of designs minimizing EN0 with two parallel optimal Simon's designs (Simon), the PBSWM + and PBSWM − designs, and the isotonic stratified design (isotonic) with
A disadvantage of PBSWM − is that it oversamples B −. Oversampling B − by the PBSWM − is expected as the design heavily relies on testing the B − subgroup. Similarly, B + is oversampled for PBSWM +. Though the sequence of decision rules in the isotonic stratified design is like in PBSWM −, the isotonic adjustment leads to both data from B − and B + influencing the decision and to the probability of rejecting the null hypothesis is calculated similarly to PBSWM + (see Supplemental Material). To summarize, the new isotonic stratified design minimizing EN0 yields the smallest maximum sample size, smallest EN0, and, unlike PBSWM −, oversamples B +.
Table 2 tabulates the designs that minimize EN. For the two Simon's designs, we selected the Simon's design that minimizes the weighted average of EN0 and the maximum total sample size with weight 0.5.
17
As before the one-sided type I error rate for each of the Simon's designs is
Comparison of the designs minimizing EN with two parallel Simon's designs (Simon), the PBSWM + and PBSWM − design, and the isotonic stratified design (isotonic) with
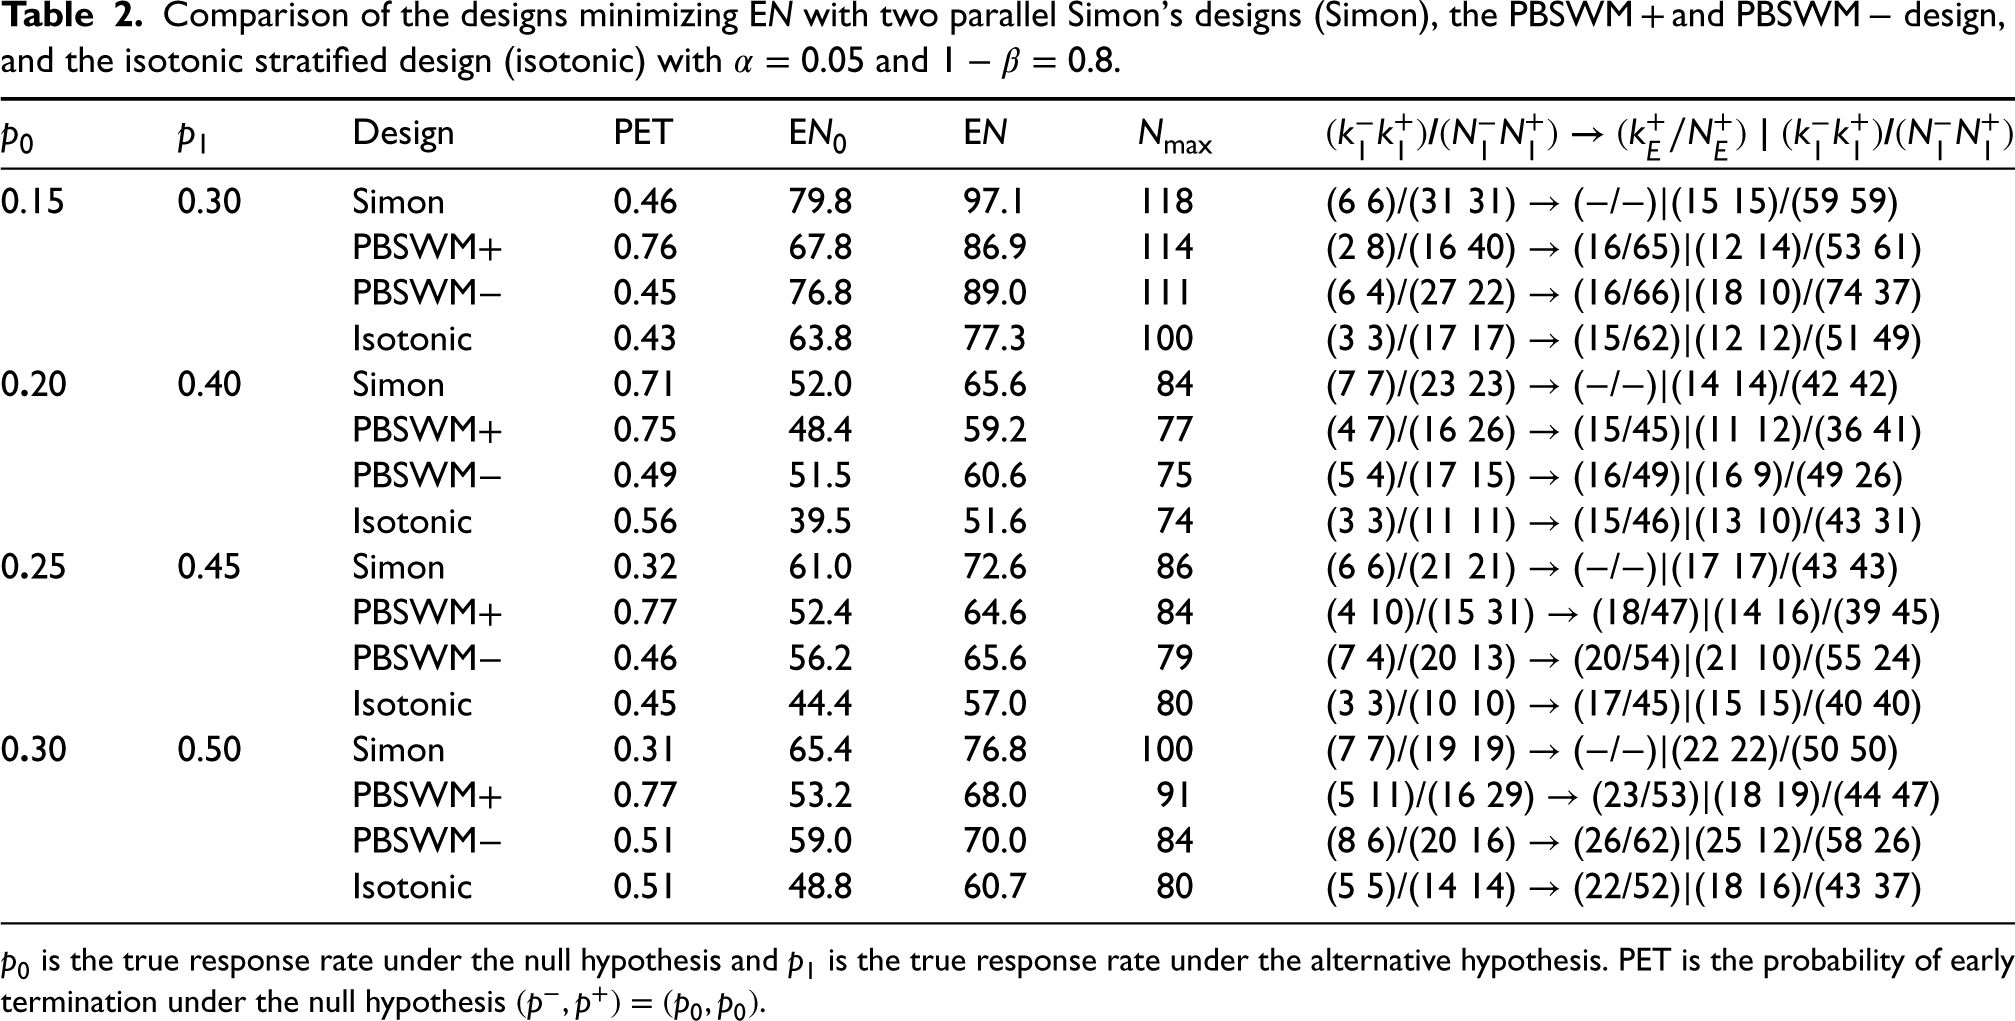
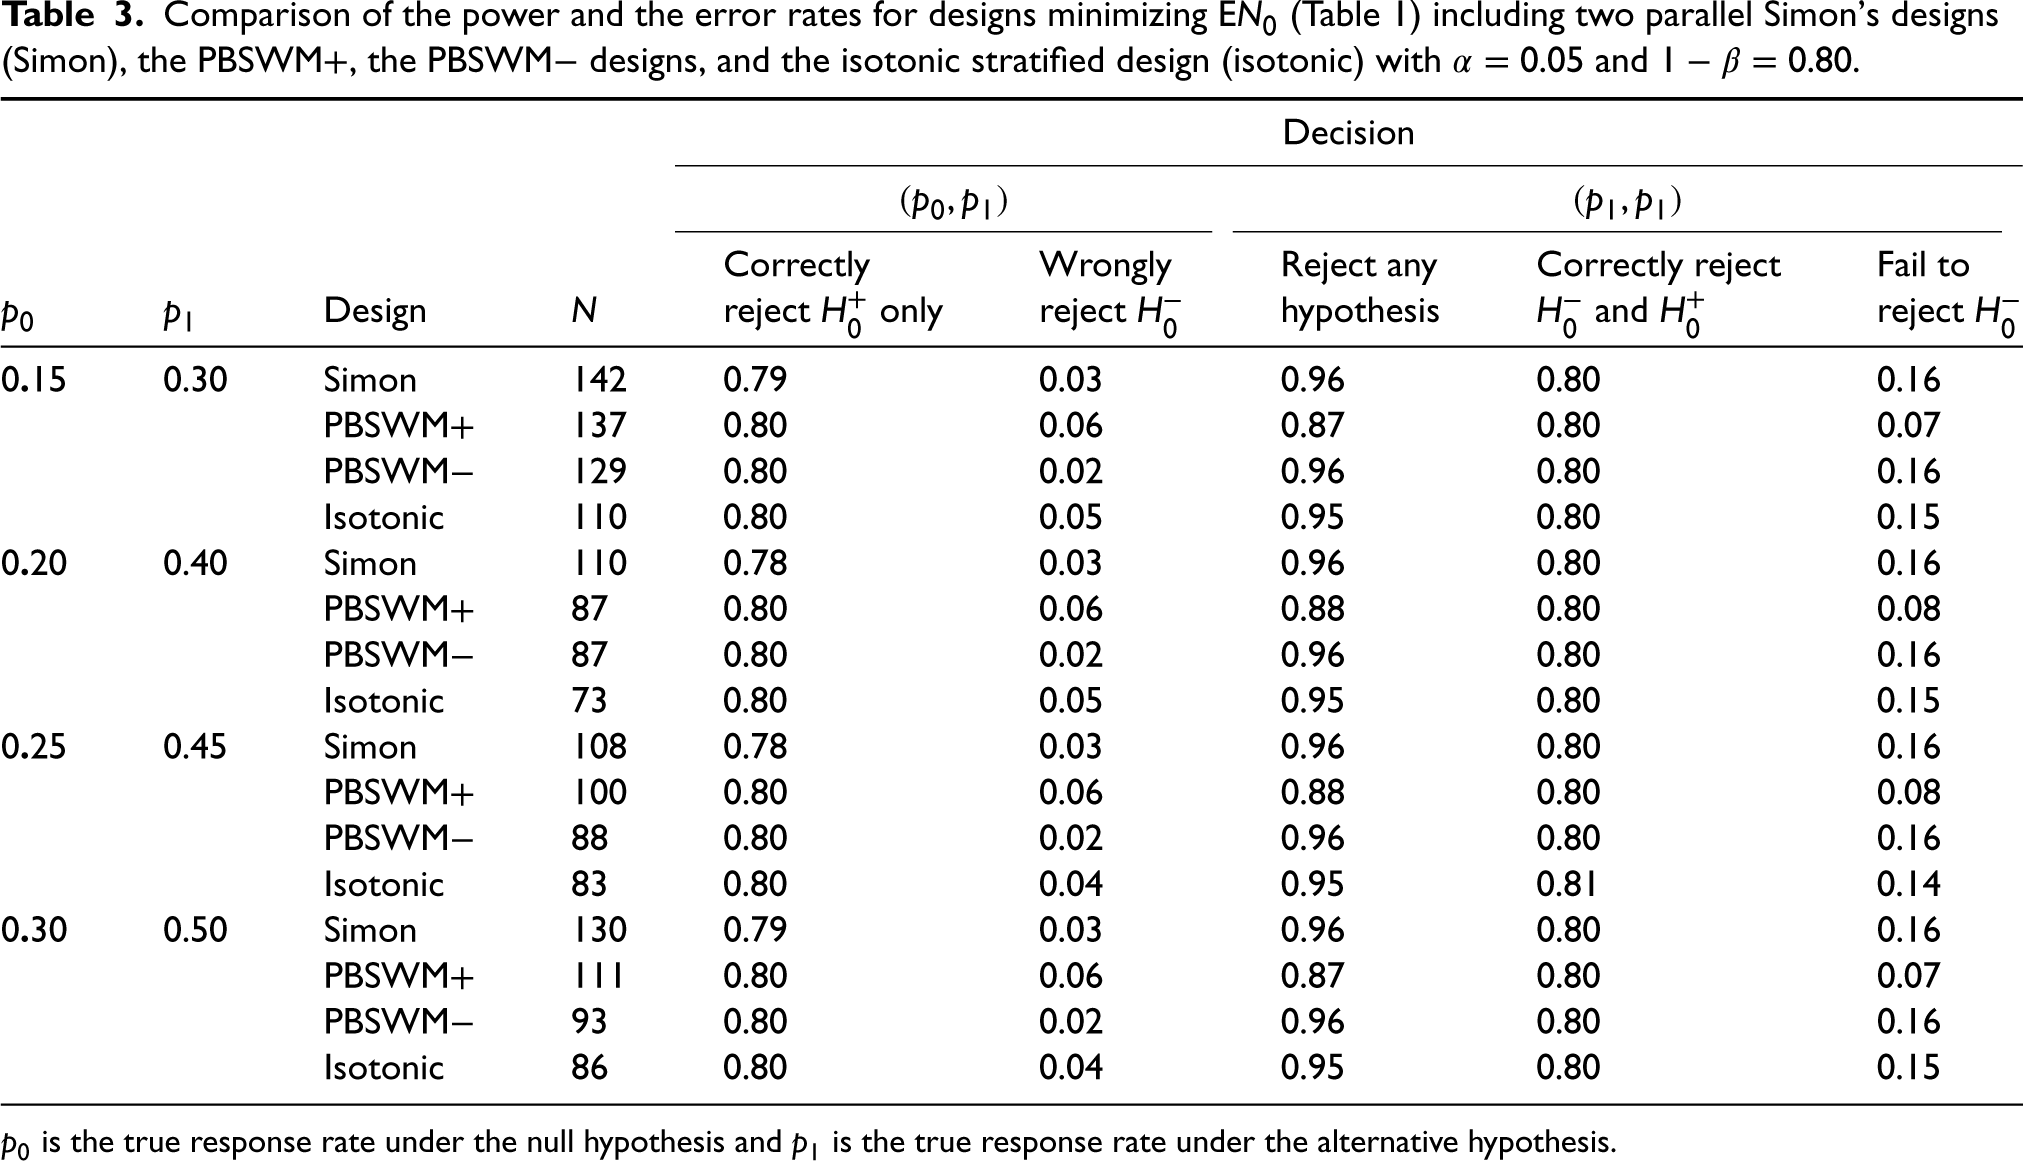
Table 3 compares the power and the error rates of the designs from Table 1. The rates were computed based on the binomial distribution (see Supplemental Appendix 1).
Comparison of the power and the error rates for designs minimizing EN0 (Table 1) including two parallel Simon's designs (Simon), the PBSWM+, the PBSWM− designs, and the isotonic stratified design (isotonic) with
and
.
Comparison of the power and the error rates for designs minimizing EN0 (Table 1) including two parallel Simon's designs (Simon), the PBSWM+, the PBSWM− designs, and the isotonic stratified design (isotonic) with
The probability of rejecting any hypothesis under
We evaluated the design performance when the monotonicity of the response probabilities in B − and B + does not hold by considering a scenario
We describe an isotonic stratified design for phase 2 clinical trials to evaluate the efficacy of a new therapy in biomarker-positive and negative patients. Some existing approaches7,9,11 used the assumption of monotonicity between response probabilities in the biomarker negative and positive subgroups in constructing the sequence of decision rules. We use this assumption not only to test the null hypotheses but also to estimate the response probabilities in B − and B +. If the observed response probability in the biomarker-negative subgroup is higher than in the biomarker-positive subgroup, we estimate the response rate in both subgroups from the combined sample.
Compared with the required sample size to run two optimal Simon's designs in each biomarker subgroup, 2N, our proposed design yields up to a 30% smaller total sample size, or 1.4N, and a 22% smaller expected sample size under the null hypothesis. That is, we can evaluate the response probability in both B − and B + with the isotonic stratified design using only 40% more patients needed to test B + only using Simon's design. Compared to the PBSWM − design, our proposed design yields up to a 10% smaller total maximum sample size and about a 22% smaller expected sample size under the null hypothesis. Another desirable property of our design compared to the PBSWM – design is that the optimal allocation proportion to B + is generally higher than 0.5. It is more ethical to oversample B + in a biomarker-stratified trial since patients in B + are believed to be more likely to benefit from the experimental treatment. In fact, the optimal allocation proportion to B − in the PBSWM − design is as low as 0.40 when minimizing for EN0 and 0.30 when minimizing for EN.
When choosing a design to use, one can minimize EN0, EN, or Nmax. The choice of optimization criterion is similar to the one in selecting optimal or minimax Simon's designs.
6
Biomarker stratified designs optimizing Nmax (see Table A1 of Supplemental Appendix 2) yield the smallest total maximum sample size while designs minimizing EN0 optimize for the case where it is believed that the treatment is unlikely to work. When response heterogeneity is expected, we recommend using the EN criterion as it considers all three scenarios
There are three possible conclusions at the end of the trial: reject both null hypotheses, recommend both subgroups for further development; accept the null hypothesis
Phase 2 trials often use tumor response as the primary endpoint, while the primary endpoint in phase 3 trials is progression-free or overall survival. These time-to-event endpoints might not correlate well with tumor response. For this reason, if a biomarker-stratified phase 2 trial is successful with respect to tumor response in both subgroups, it might be wise to consider a biomarker-stratified design for the next trial rather than conducting subsequent trials in an unstratified population.
Supplemental Material
sj-pdf-1-smm-10.1177_09622802241238978 - Supplemental material for Isotonic design for single-arm biomarker stratified trials
Supplemental material, sj-pdf-1-smm-10.1177_09622802241238978 for Isotonic design for single-arm biomarker stratified trials by Lang Li and Anastasia Ivanova in Statistical Methods in Medical Research
Footnotes
Declaration of conflicting interests
The author(s) declared no potential conflicts of interest with respect to the research, authorship, and/or publication of this article.
Funding
The author(s) disclosed receipt of the following financial support for the research, authorship, and/or publication of this article: This work was supported in part by the NIH Grant U24 HL138998.
Supplemental material
Supplemental material for this article is available online.
References
Supplementary Material
Please find the following supplemental material available below.
For Open Access articles published under a Creative Commons License, all supplemental material carries the same license as the article it is associated with.
For non-Open Access articles published, all supplemental material carries a non-exclusive license, and permission requests for re-use of supplemental material or any part of supplemental material shall be sent directly to the copyright owner as specified in the copyright notice associated with the article.