
Abstract
Dengue, Zika, and chikungunya are arboviral diseases (AVD) transmitted mainly by Aedes aegypti. Rio de Janeiro city, Brazil, has been endemic for dengue for over 30 years, and experienced the first joint epidemic of the three diseases between 2015-2016. They present similar symptoms and only a small proportion of cases are laboratory-confirmed. These facts lead to potential misdiagnosis and, consequently, uncertainty in the registration of the cases. We have available the number of cases of each disease for the
Keywords
Motivation
In the last decade, the abundant presence of Aedes mosquitoes and the high human mobility allowed the rapid establishment and spread of emerging arboviruses in several tropical countries. In Brazil, for more than 30 years the public actions were insufficient to control dengue, an arboviral disease that caused over 1.5 million probable cases and 782 confirmed deaths in 2019 (Ministério da Saúde and Secretaria de Vigilância em Saúde, 2020). Between 2015 and 2016, Zika and chikungunya viruses, also transmitted by Aedes mosquitoes, caused epidemics in the country, alongside with a dengue one, in a phenomenon that has been called “triple epidemic”. 1 Any suspected case of dengue, Zika or chikungunya, assisted in health care facilities, has to be reported to the Brazilian Notifiable Diseases Information System (SINAN – Sistema de Informação de Agravos de Notificação), with a specification of the probable diagnosis. However, because the three diseases share similar symptoms, the correct diagnosis is hindered without laboratory exams, while only a small proportion of the cases are actually tested (418,572 in 1,543,665, or 27.1%, dengue cases were laboratory-confirmed in 2019). Therefore, for most cases the diagnosis is based solely on clinical-epidemiological criteria. Because misdiagnosis is common, especially in a scenario of co-circulation such as the triple epidemic, there is an uncertainty associated with the registered cases.2,3 Taking this into account, we propose a Poisson model for the total number of cases of arboviral diseases and, conditioned on the total number of cases, we assume a multinomial model for the number of cases of the three diseases. The model is motivated by data from the city of Rio de Janeiro, Brazil, which experienced a triple epidemic between 2015 and 2016.
Rio is the main tourist destination in Brazil and has a long history of fighting dengue. With nearly 6.3 million inhabitants, Rio’s territory presents different environmental and socioeconomic characteristics that are involved in the spatial distribution of Aedes-borne diseases.
4
Aedes aegypti - dengue, Zika and chikungunya main vector in Brazil - is highly adapted to urban settings. In fact, more urbanized locations favors the ecology of the mosquito.5,6 Additionally, poorer sanitary conditions are associated with the presence of potential breeding sites for the mosquito, such as containers filled with rain water that can be found in inadequate garbage disposal.7,8 For this analysis, we have available the proportion of green area (which is inversely associated with the level of urbanization in Rio), the social development index (an index that includes different socioeconomic indicators, including some related with sanitary conditions and level of income) and the population density. The population density is associated with the number of arboviral diseases cases, with higher density favouring the contact between the mosquito and the human host.
7
Our goal is to investigate how these covariates are associated with the spatial distribution of cases of dengue, Zika and chikungunya during the triple epidemic. Figure 1 shows the distribution of the available covariates across the
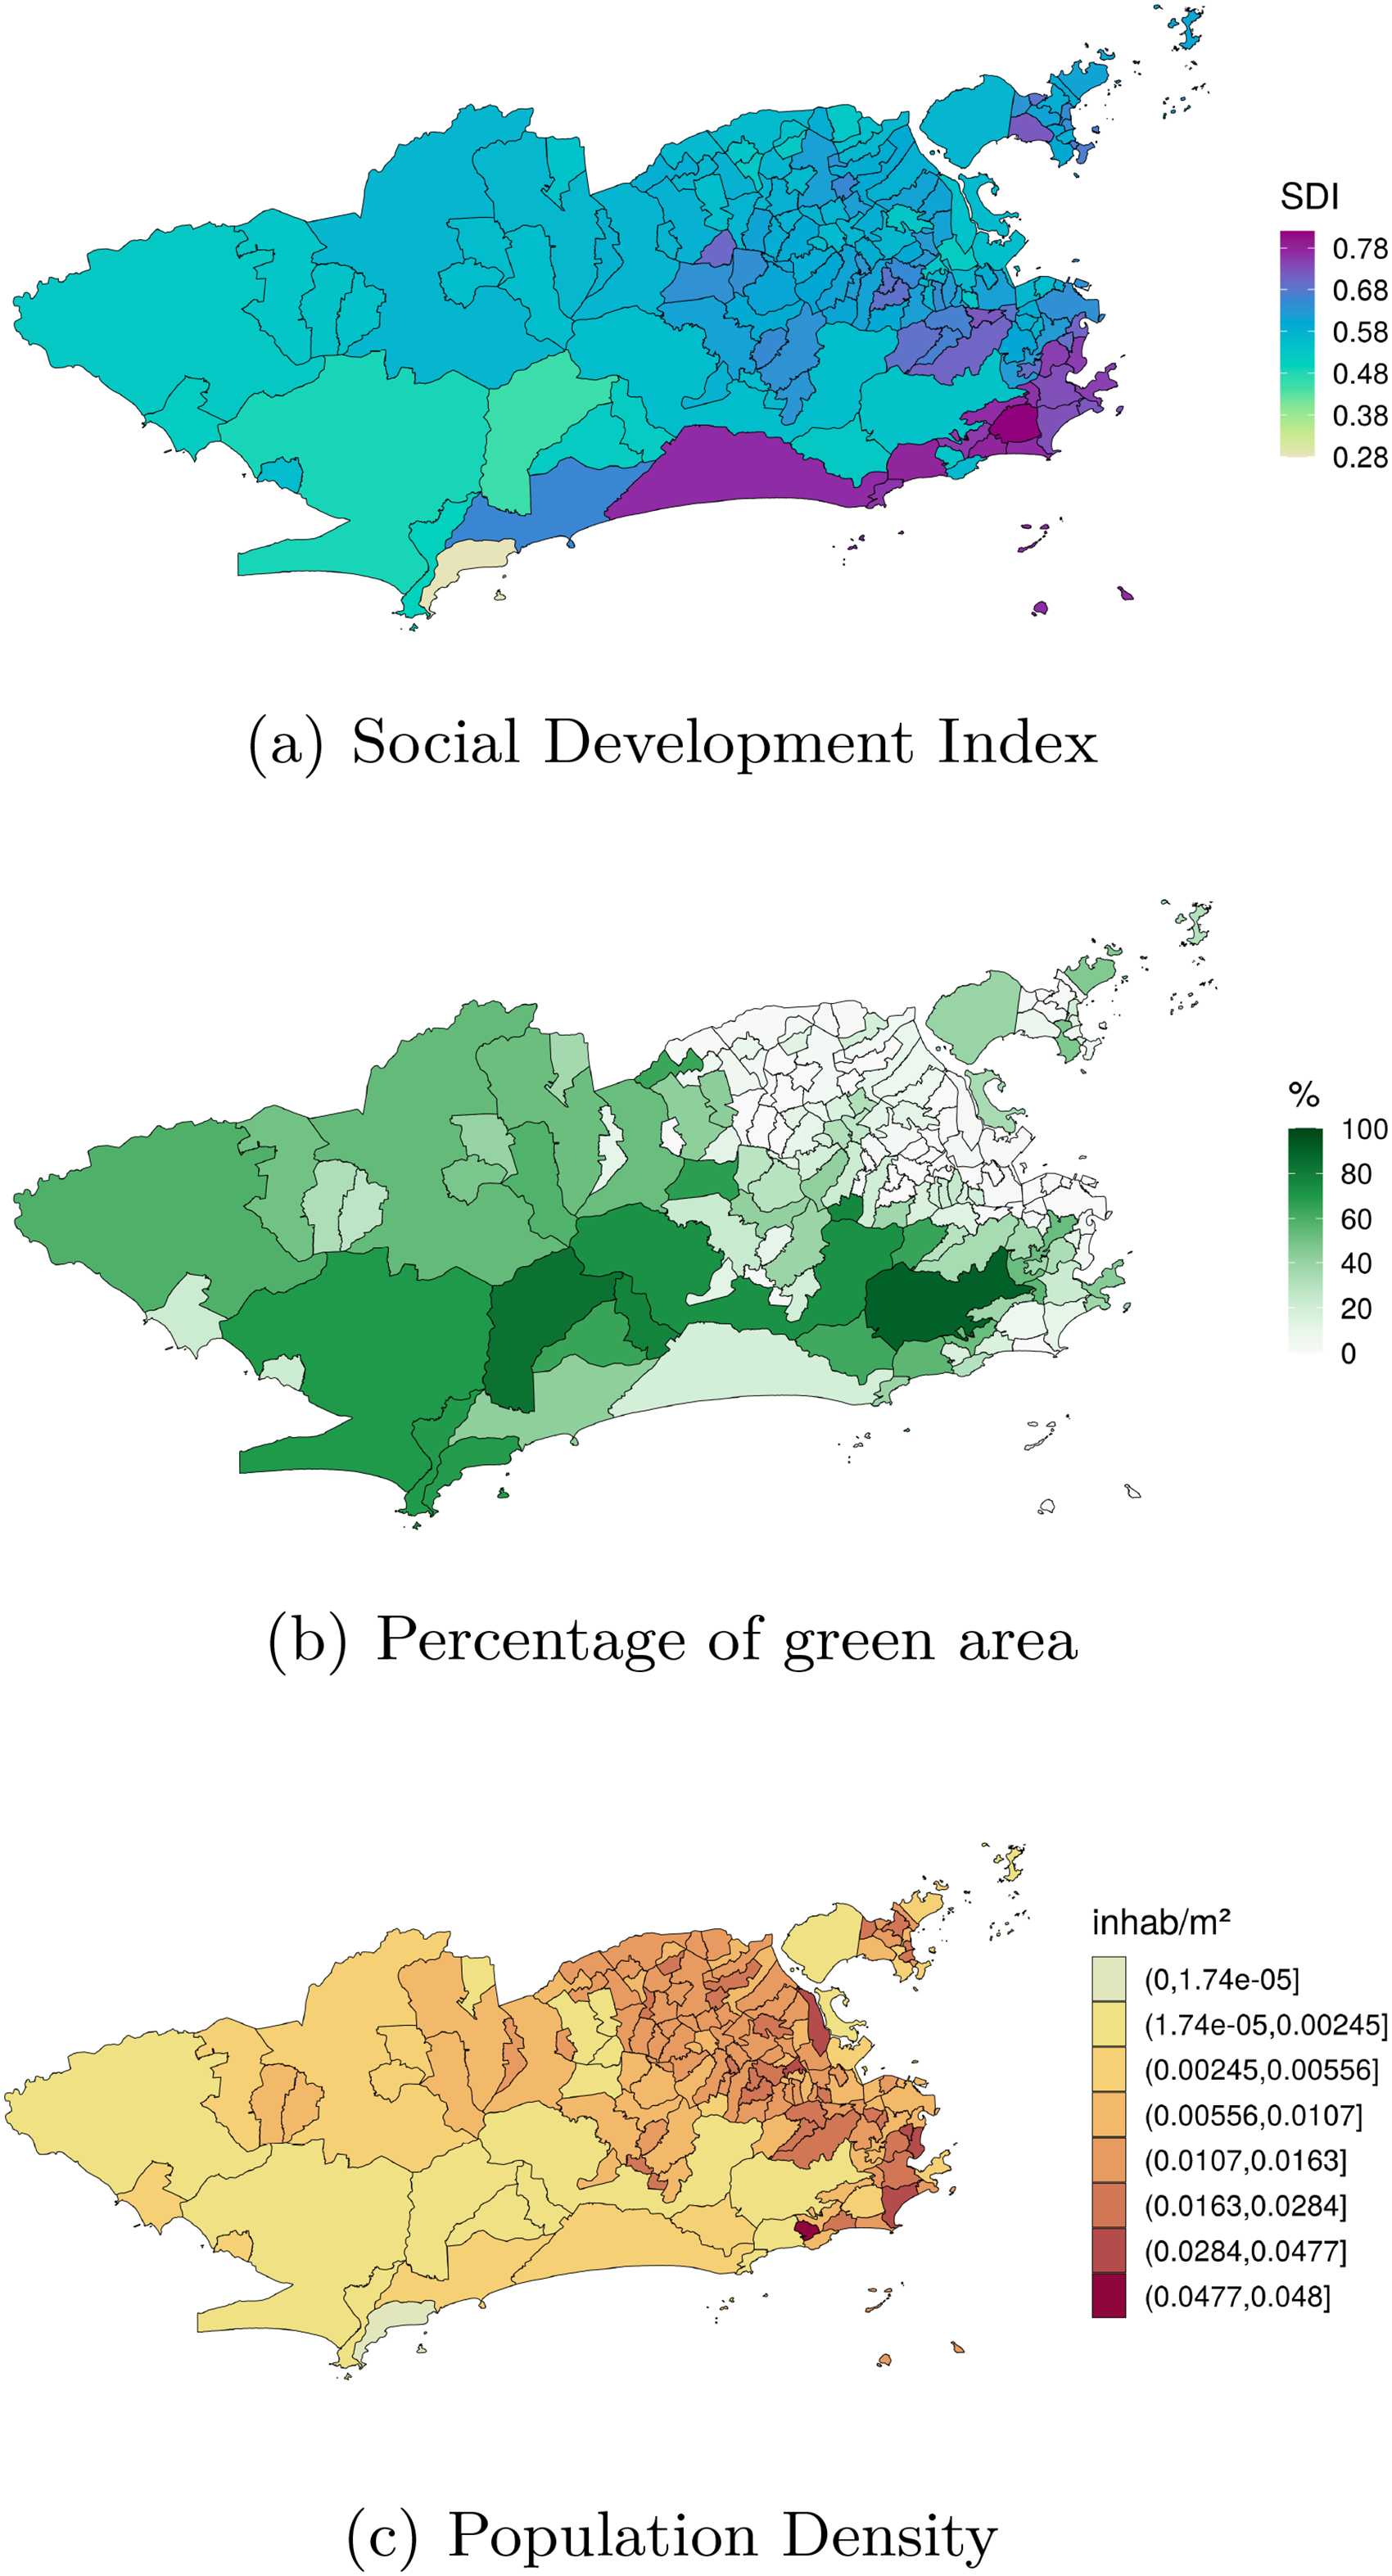
Spatial distribution of the (a) levels of the social development index (SDI) in 2010, (b) observed percentage of green area in 2015, and (c) the population density (inhab/
The modelling of observed counts of multiple diseases across a spatial region has experienced an enormous growth in the last three decades. Assume that the number of registered cases of each of the diseases is available for each of the neighborhoods of Rio. A typical approach is to assume that each of the disease counts follow conditionally independent Poisson distributions whose mean is described by the product of an offset and the relative risk associated with each disease. In the case of multiple diseases, it is common practice to decompose the log-relative risk as the sum of fixed effects and some latent, multivariate, spatially structured random effect. Commonly, this latent component follows a multivariate conditional autoregressive model (MCAR). 9 There are different proposals in the literature on how to parametrize the MCAR component. See Banerjee 10 for a review of multivariate spatial models for areal data.
In Section 2 we propose an alternative approach to the one described above for modelling counts related to multiple diseases observed across the neighborhoods of a city. We have available observations associated with diseases transmitted by the same vectors that share some similar symptoms. It is of interest to health authorities to model the number of cases of each of the diseases, together with the total number of cases of the three diseases across the neighborhoods of Rio de Janeiro. Understanding how the total number of cases was distributed across the city during this first joint epidemic is important as it allows the identification of areas that were hit hardest and may also be at-risk for future emerging Aedes-borne diseases outbreaks. In particular, we propose a Poisson model for the total number of cases of urban Aedes-borne diseases for each neighborhood of the city, and conditional on the total number of cases, we model the probability of presence of cases of dengue, Zika and chikungunya for each neighborhood.
The idea of combining a model for the total cases and, conditioned on the total, model the components of the sum that make up the total is not new. Terza and Wilson 11 propose a mixed Poisson-multinomial approach to jointly predict households’ choices among types of trips and frequency of trips. In particular, they propose a multinomial Poisson-hurdle model (MPH). As they point out, the advantage of the MPH model over the multinomial Poisson model is that if the multinomial probabilities are modelled as multinomial logit, the latter reduces to the product of conditionally independent Poisson distributions. We discuss the parametrization issue of the unknowns in the Poisson and multinomial distributions in detail in Sections 2.1 and 2.2. Baker 12 discusses advantages of the multinomial-Poisson transformation to simplify maximum likelihood estimation. Illian et al. 13 approximate a Poisson point process model through the number of occurrences of plants on a grid cell, and conditioned on this observed number of occurrences, they let the number of plants categorized as being healthy, or not, in a given grid cell, follow a binomial distribution. In a sense, our proposed approach to model the cases of the three Aedes-borne diseases extends the model of Illian et al. 13 by considering three possible categories (the different diseases) for the allocation of the total cases.
Using a multinomial distribution to model multivariate counts of diseases has been proposed before. Knorr-Held et al. 14 model cumulative probabilities of disease risk; in particular they model the probability that a person is diagnosed with the disease in a specific stage given that they are diagnosed in this or in a higher stage. Dreassi 15 proposes a polytomous logit model, wherein the counts of oral cavity, larynx and lung cancers observed across municipalities of the Region of Tuscany are modelled as following a multinomial distribution. Different from our proposed approach, the resultant covariance structure imposed by this assumption is not discussed, and the total number of cases of the three diseases at each municipality is assumed known.
This paper is organized as follows. Section 2 discusses the proposed model for the total of cases, and the distribution of the total across the different Aedes-borne diseases: dengue, Zika and chikungunya. We discuss different parametrizations for the probability of each of the diseases within a neighborhood in the city. Then Section 3 starts by briefly describing the results of a simulation study (see Section D of the Supplementary Material) performed to make sure that we are able to estimate the parameters of the proposed model; then it focuses on the analysis of cases related to the first joint epidemic of dengue, Zika and chikungunya in Rio de Janeiro. Section 4 concludes by discussing our findings and pointing out future avenues of research.
Proposed Model
Let


Note that the assumption of a multinomial distribution for
For the relative risk (

For


Modelling
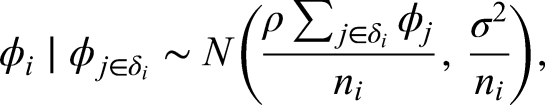
The components

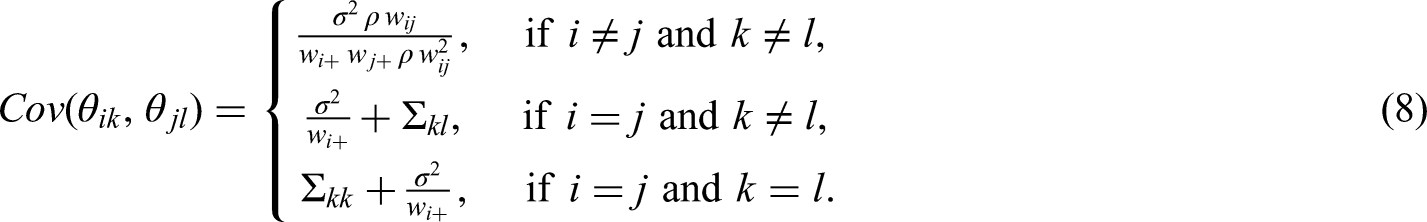
To understand the correlation structure induced by this prior specification of the
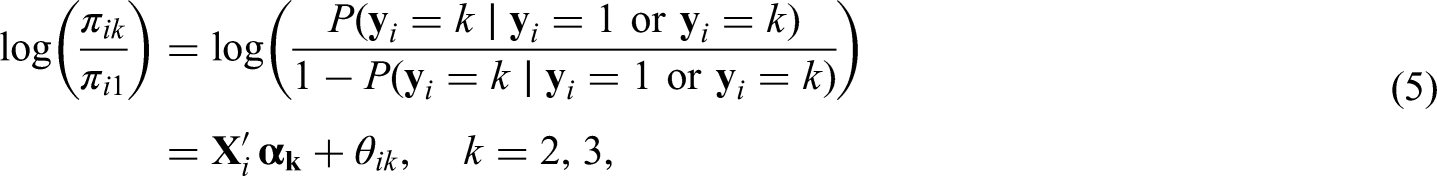
As suggested by a reviewer, we compare the proposed parametrization of
When cases of different diseases are available across the neighborhoods of a city, a straightforward way to proceed is to assume that each of the counts are conditionally independent realizations from a Poisson distribution (see e.g., Jin et al.
22
), that is,


Next we show that this approach is equivalent to a particular parametrization of the proposed model for the total cases of Aedes-borne diseases and the distribution of counts of cases,

Let
In the following Section we fit different models to the data and we use three model comparison criteria to compare the fitted models: the widely available information criterion (WAIC), 27 the logarithm Score (logS) 28 and the energy score (es). 29 Section B of the Supplementary Material describes in more detail these three criteria.
Before fitting the proposed model to the dataset described in Section 1 we performed a simulation study to check if we were able to recover the true values of the parameters that are used to generate the data. The results of the simulation study are shown in Section D of the Supplementary Material. They suggest that we recover both the coefficients of the covariates in equations (4) and (5) as well as the random effects
We now proceed with the analysis of the data for the number of cases of dengue, Zika, and chikungunya for each neighborhood of the city of Rio de Janeiro. As described in Section 1, the available covariates are the social development index, the proportion of green area of each neighborhood, and the population density, such that in the fitted models we consider
Note that the parameters
Model M0 assumes that after adjusting for the covariates, whatever is left in equations (4) and (5) is the same and varies only per neighborhood. Model M1, on the other hand, assumes that
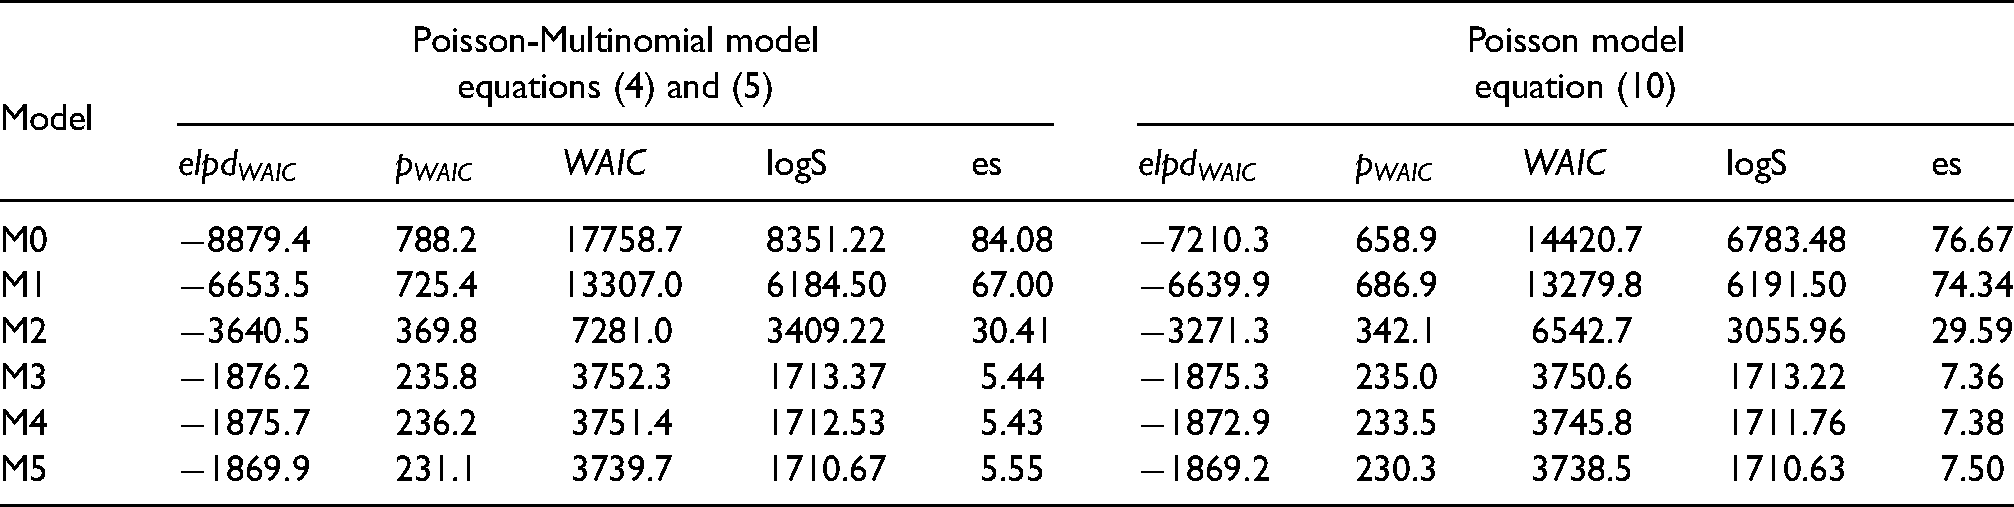
Table 1 shows the values of WAIC and its components together with the logarithm Score (logS) and the energy score (es) under each of the fitted models. Regarding WAIC, the smallest value is attained by model M5 under the multivariate Poisson parametrization followed very closely by M5 under the Poisson-Multinomial parametrization, suggesting that, according to WAIC, there is not much evidence of one parametrization in favor of the other. When the logS is used for comparison, models M3, M4, and M5 also result in very similar values under both parametrizations. The energy score, however, suggests some difference between the parametrizations and results in smaller values under the Poisson-Multinomial parametrization when compared to the multivariate Poisson one. As the energy score better differentiates both parametrizations when compared to WAIC and the log Score, we now focus on the discussion of the results provided by models M4 under the Poisson-Multinomial parametrization and M3 under the multivariate Poisson parametrization, as these models resulted in the smallest values of the energy score.
Model comparison based on the Widely Applicable Information Criterion (WAIC), the logarithm Score (logS) and the energy score (es). For all three criteria, smaller values indicate better fitting models.
Columns of Table 2 show the posterior summary (mean and limits of the 95% credible interval) of the relative risk (column for the total) and odds ratio (columns “Zika-dengue”, “chik.-dengue” and “chik.-Zika”) of the Poisson-Multinomial model under model M4. Focusing on the column for the total, the overall relative risk for the total of cases of Aedes-borne diseases in the city of Rio de Janeiro during this period is 0.928. Clearly the relative risk of the total of Aedes-borne diseases decreases by, approximately, 28% with a standard deviation increase of SDI when the other covariates are held fixed. On the other hand, percentage of green area and population density do not seem to influence the relative risk of the total number of cases as
Posterior summary (mean and 95% credible intervals in brackets) of the relative risks associated with each of the covariates in equation (4) for the relative risk of the total number of cases, and for the odds ratio of a neighborhood having Zika or chikungunya in comparison to dengue, and chikungunya in comparison to Zika (see equations (5)–(6)) under model M4.
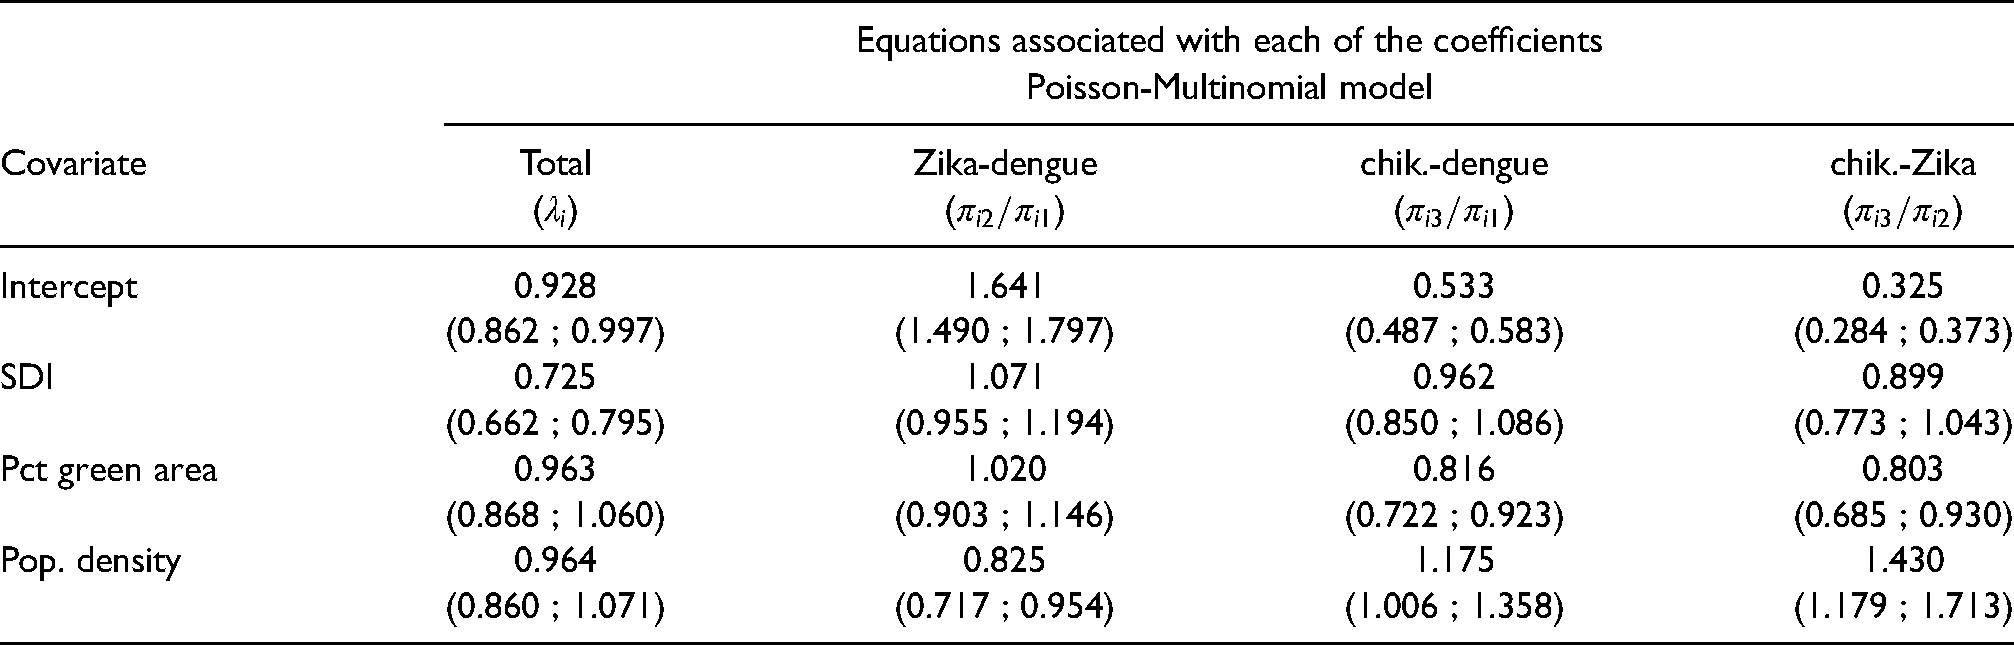
Clearly all the coefficients for SDI include
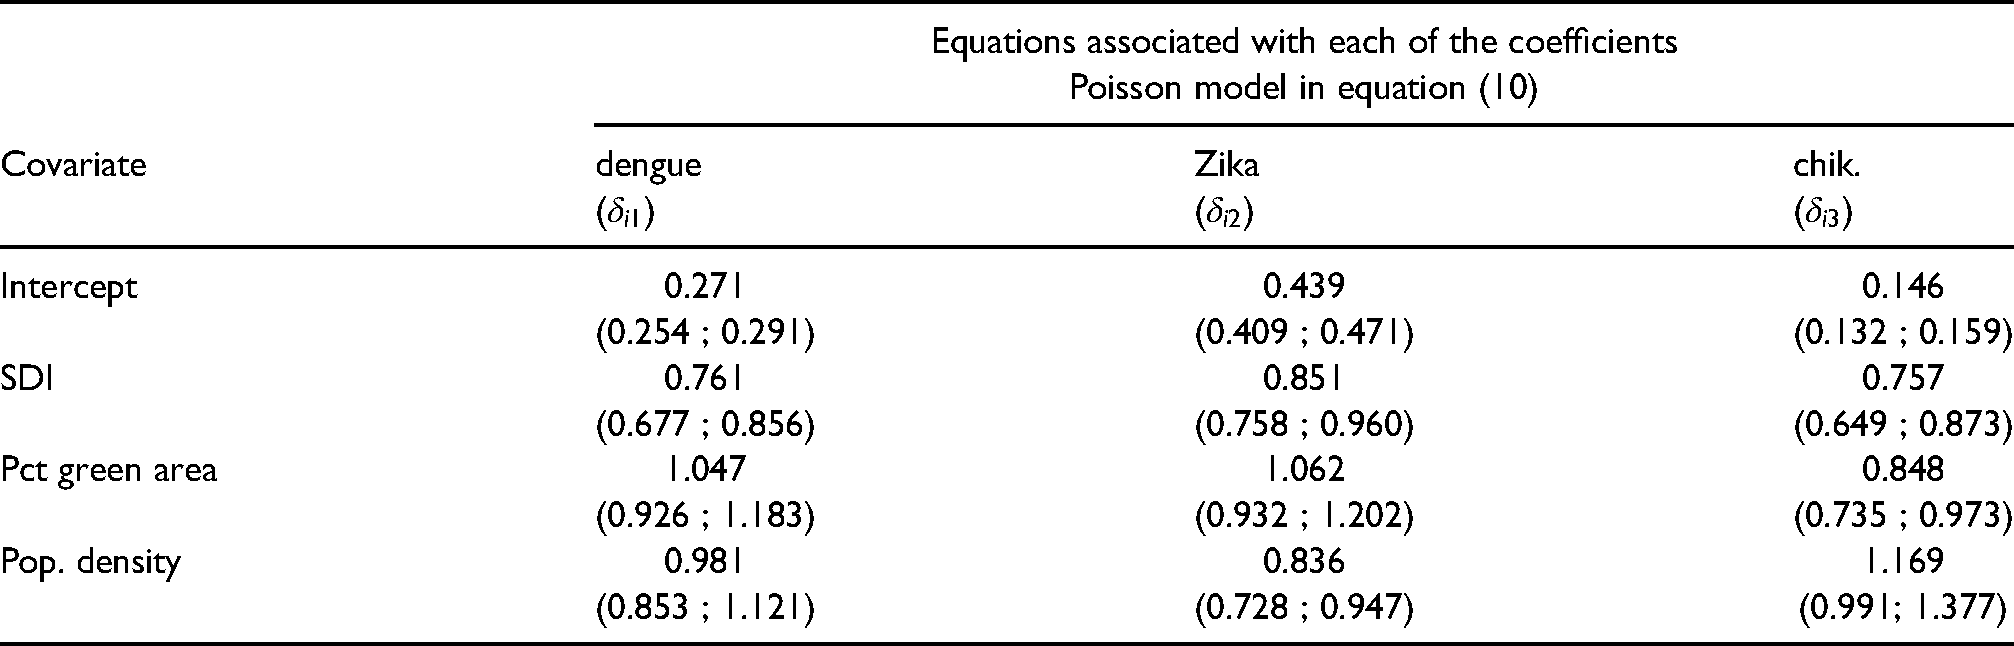
For comparison, Table 3 shows the posterior summaries of the relative risks (
Posterior summary (mean and 95% credible intervals in brackets) of the relative risks (
Panels of Figure 2 show the posterior mean of the spatial effects
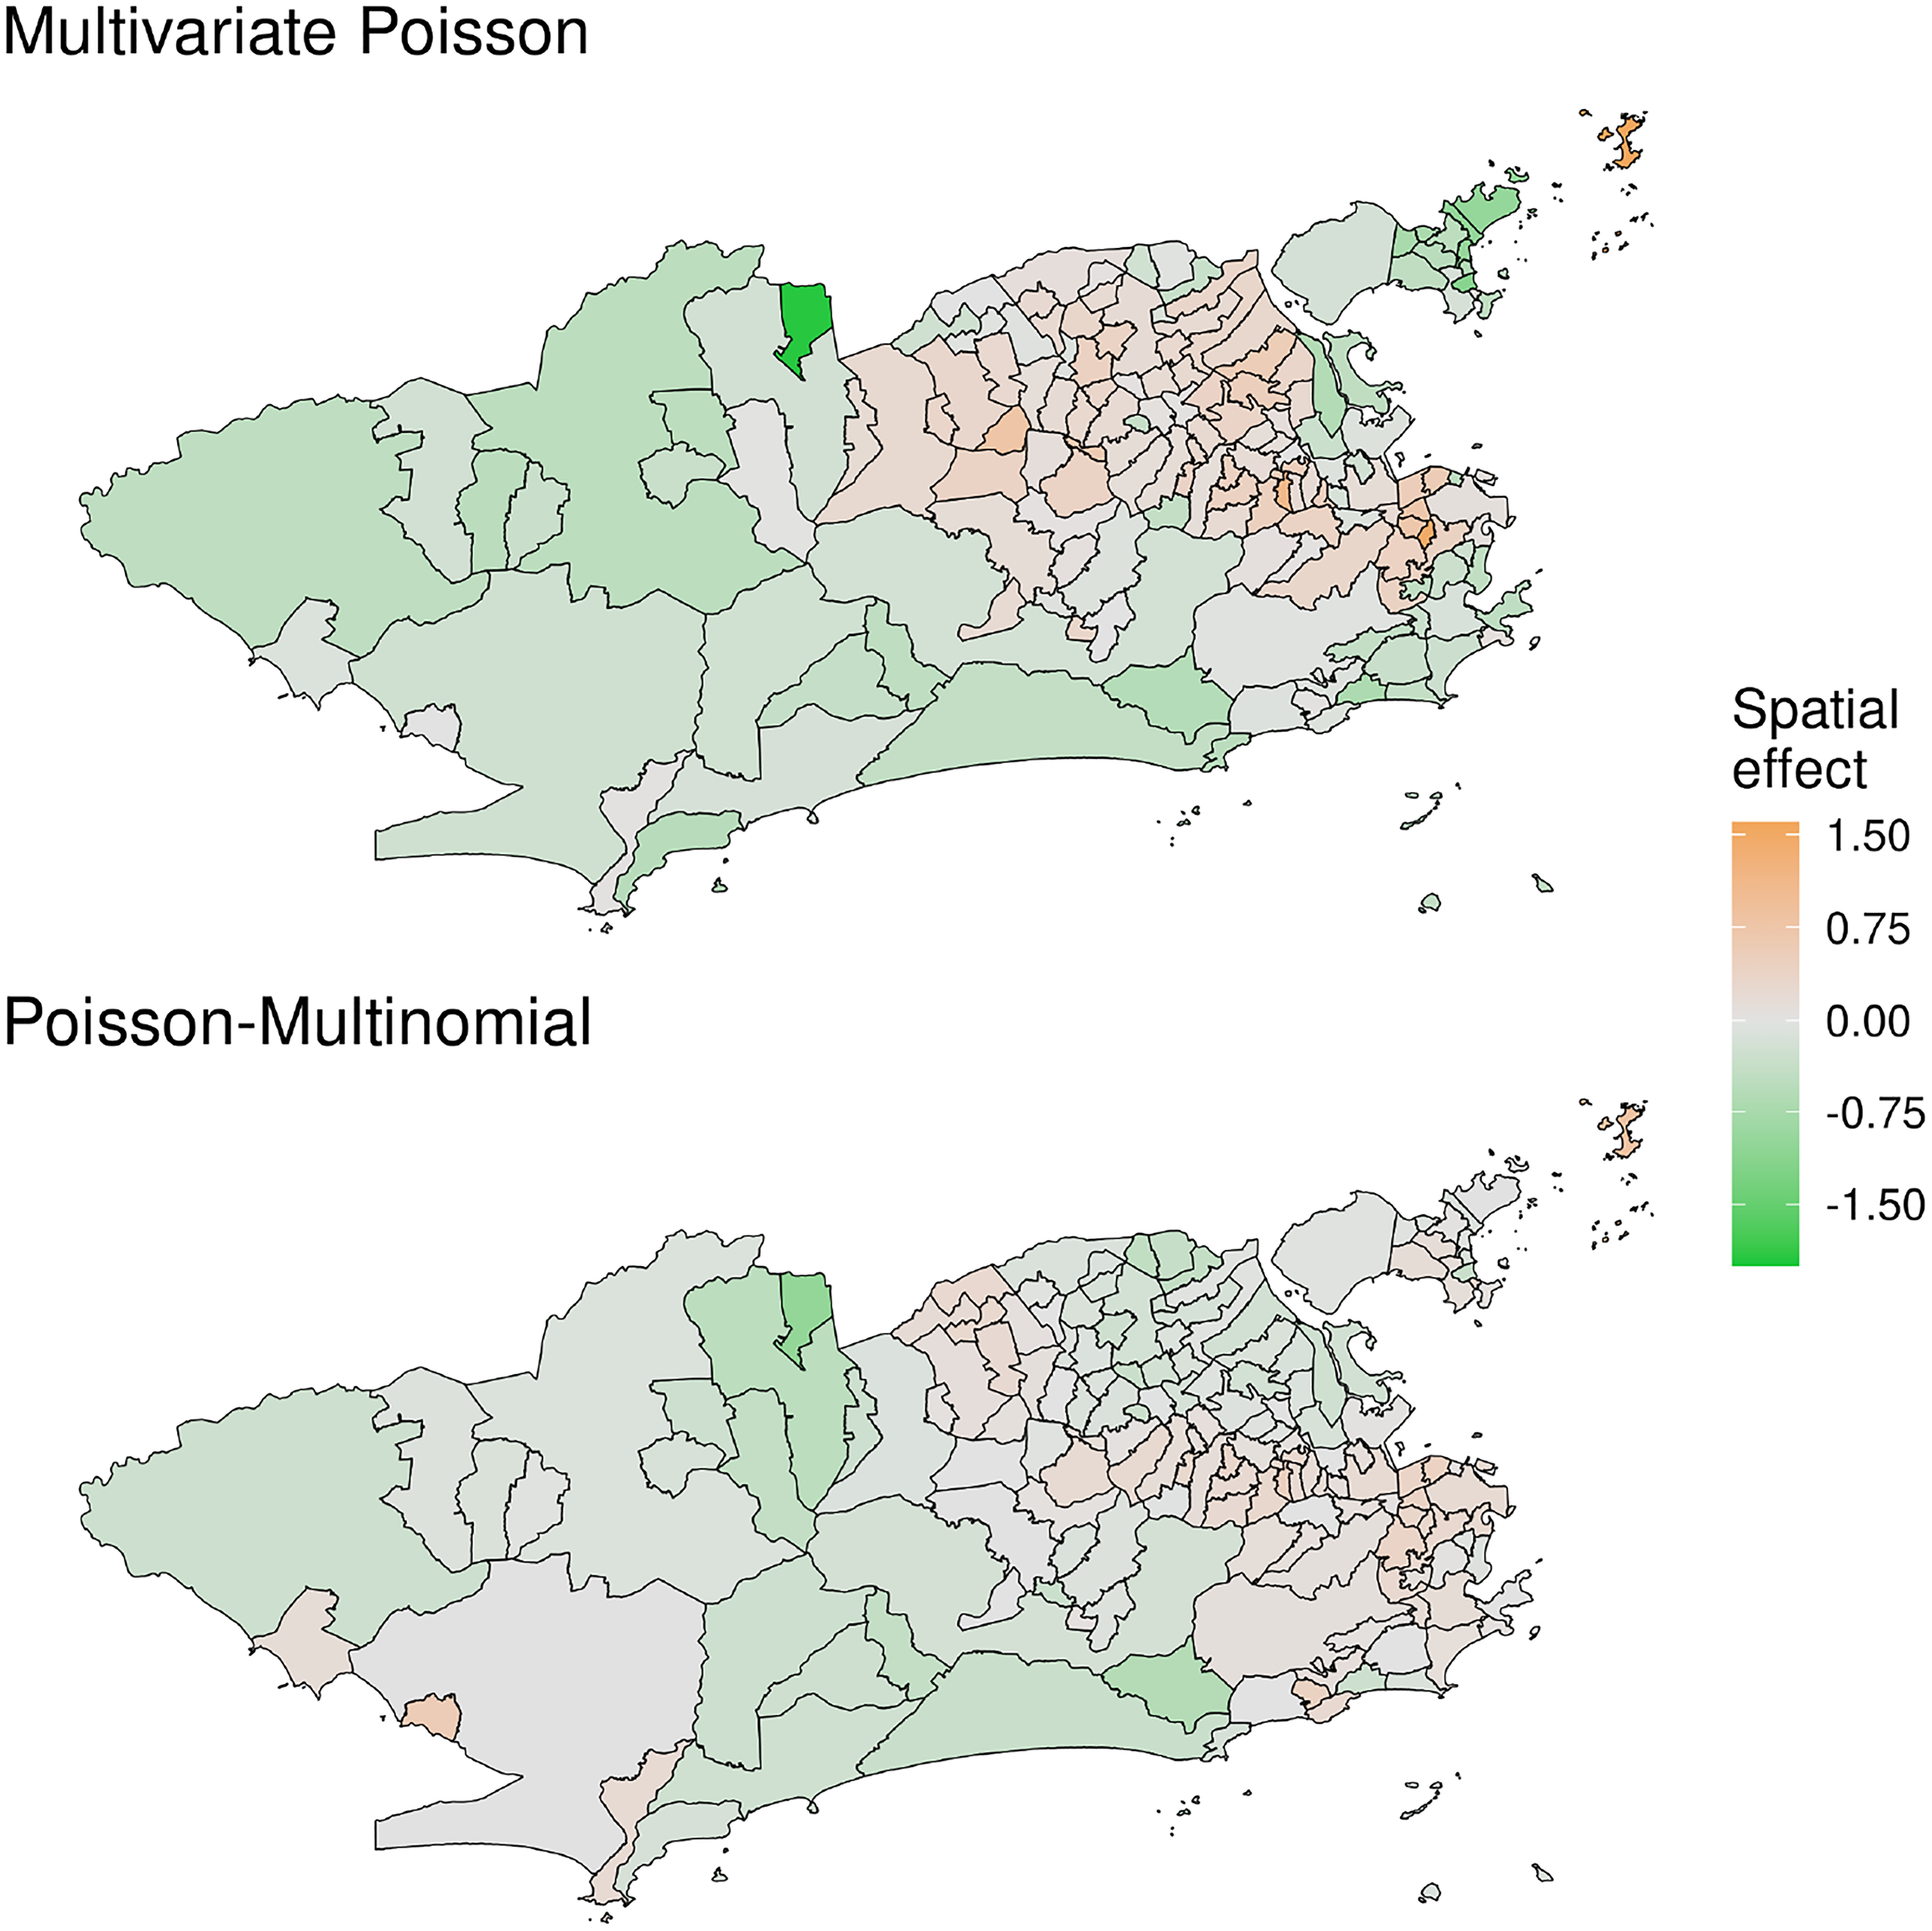
Posterior mean of the common latent spatial effect
Figure 3 shows the posterior mean of the relative risk of the total (based on equation (4)) cases of Aedes-borne diseases across the city. It is clear that during this joint epidemic, the three diseases were spread all over the city, with some neighborhoods resulting in quite high values of the estimated relative risk.
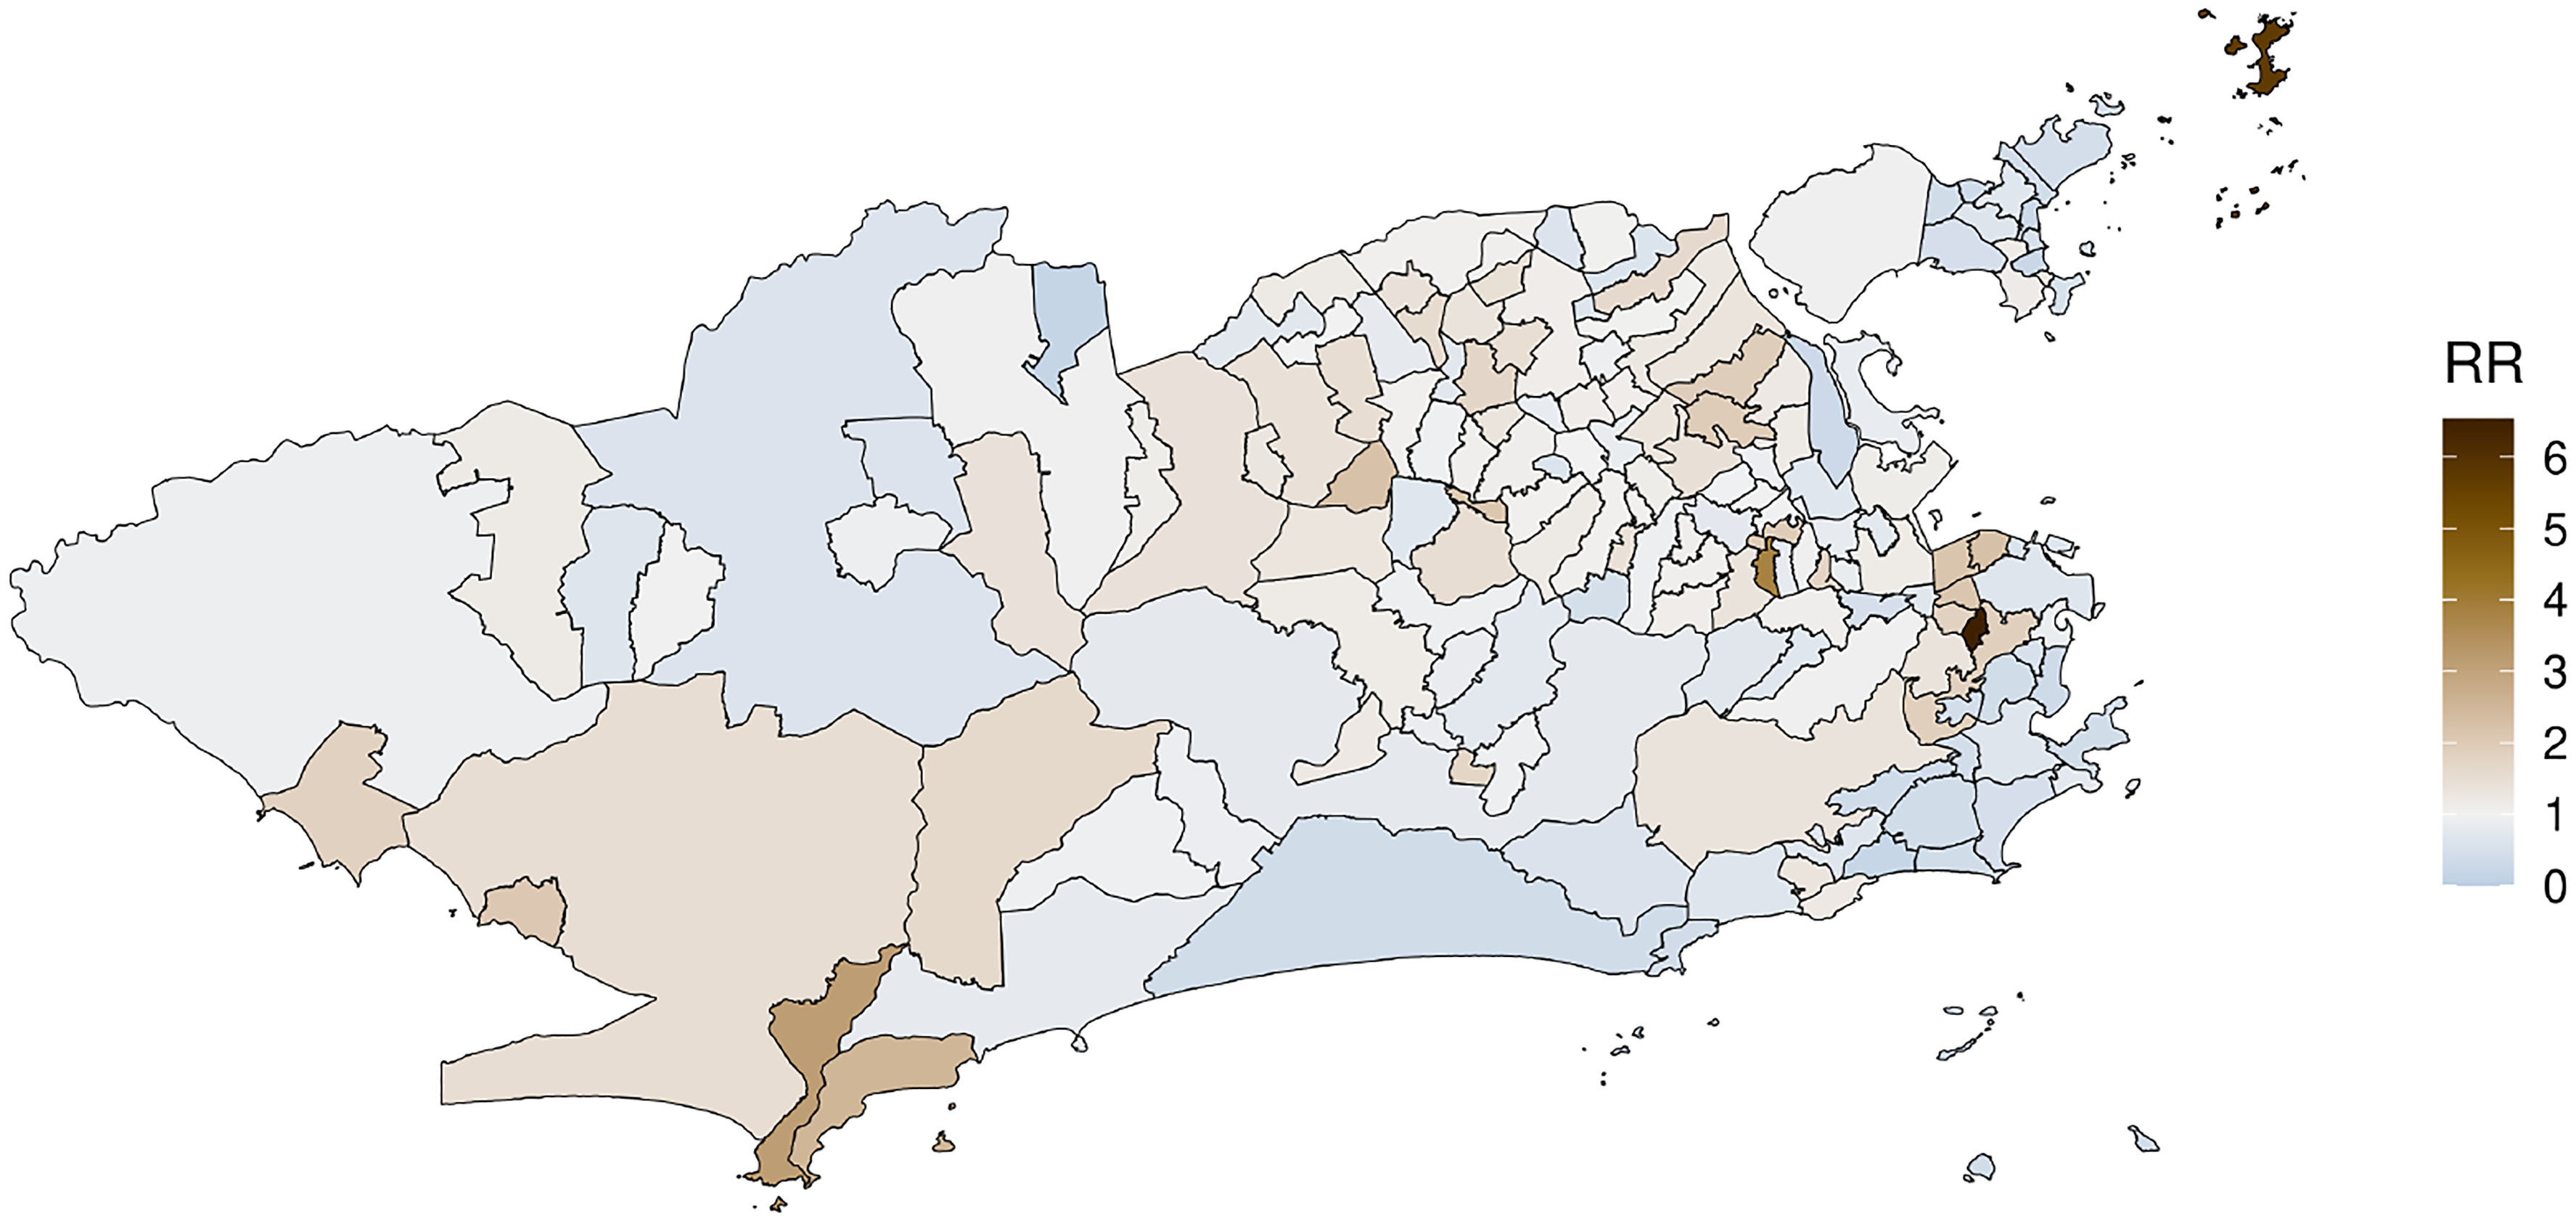
Posterior mean of the relative risk (RR) for the total cases of Aedes-borne (dengue, Zika and chikungunya) diseases across the neighborhoods of Rio de Janeiro under model M4.
Panels of Figure 4 show the posterior mean of the probability of presence of each disease estimated from the Poisson-Multinomial parametrization (top row) and the log of the posterior mean of the relative risk of each disease estimated under the multivariate Poisson parametrization (bottom row). The maps on the top row show that the probability of presence of Zika was around 50% for the majority of neighborhoods, whereas the probability of presence of chikungunya was higher in the eastern portion of the city. Because Zika resulted in quite high relative risks for some of the neighborhoods we show the log of the posterior mean of the relative risks. Clearly, among the three vector borne diseases considered, chikungunya resulted in the smallest values of the relative risk across the city, with the Eastern portion of the city resulting in higher risks associated with chikungunya.
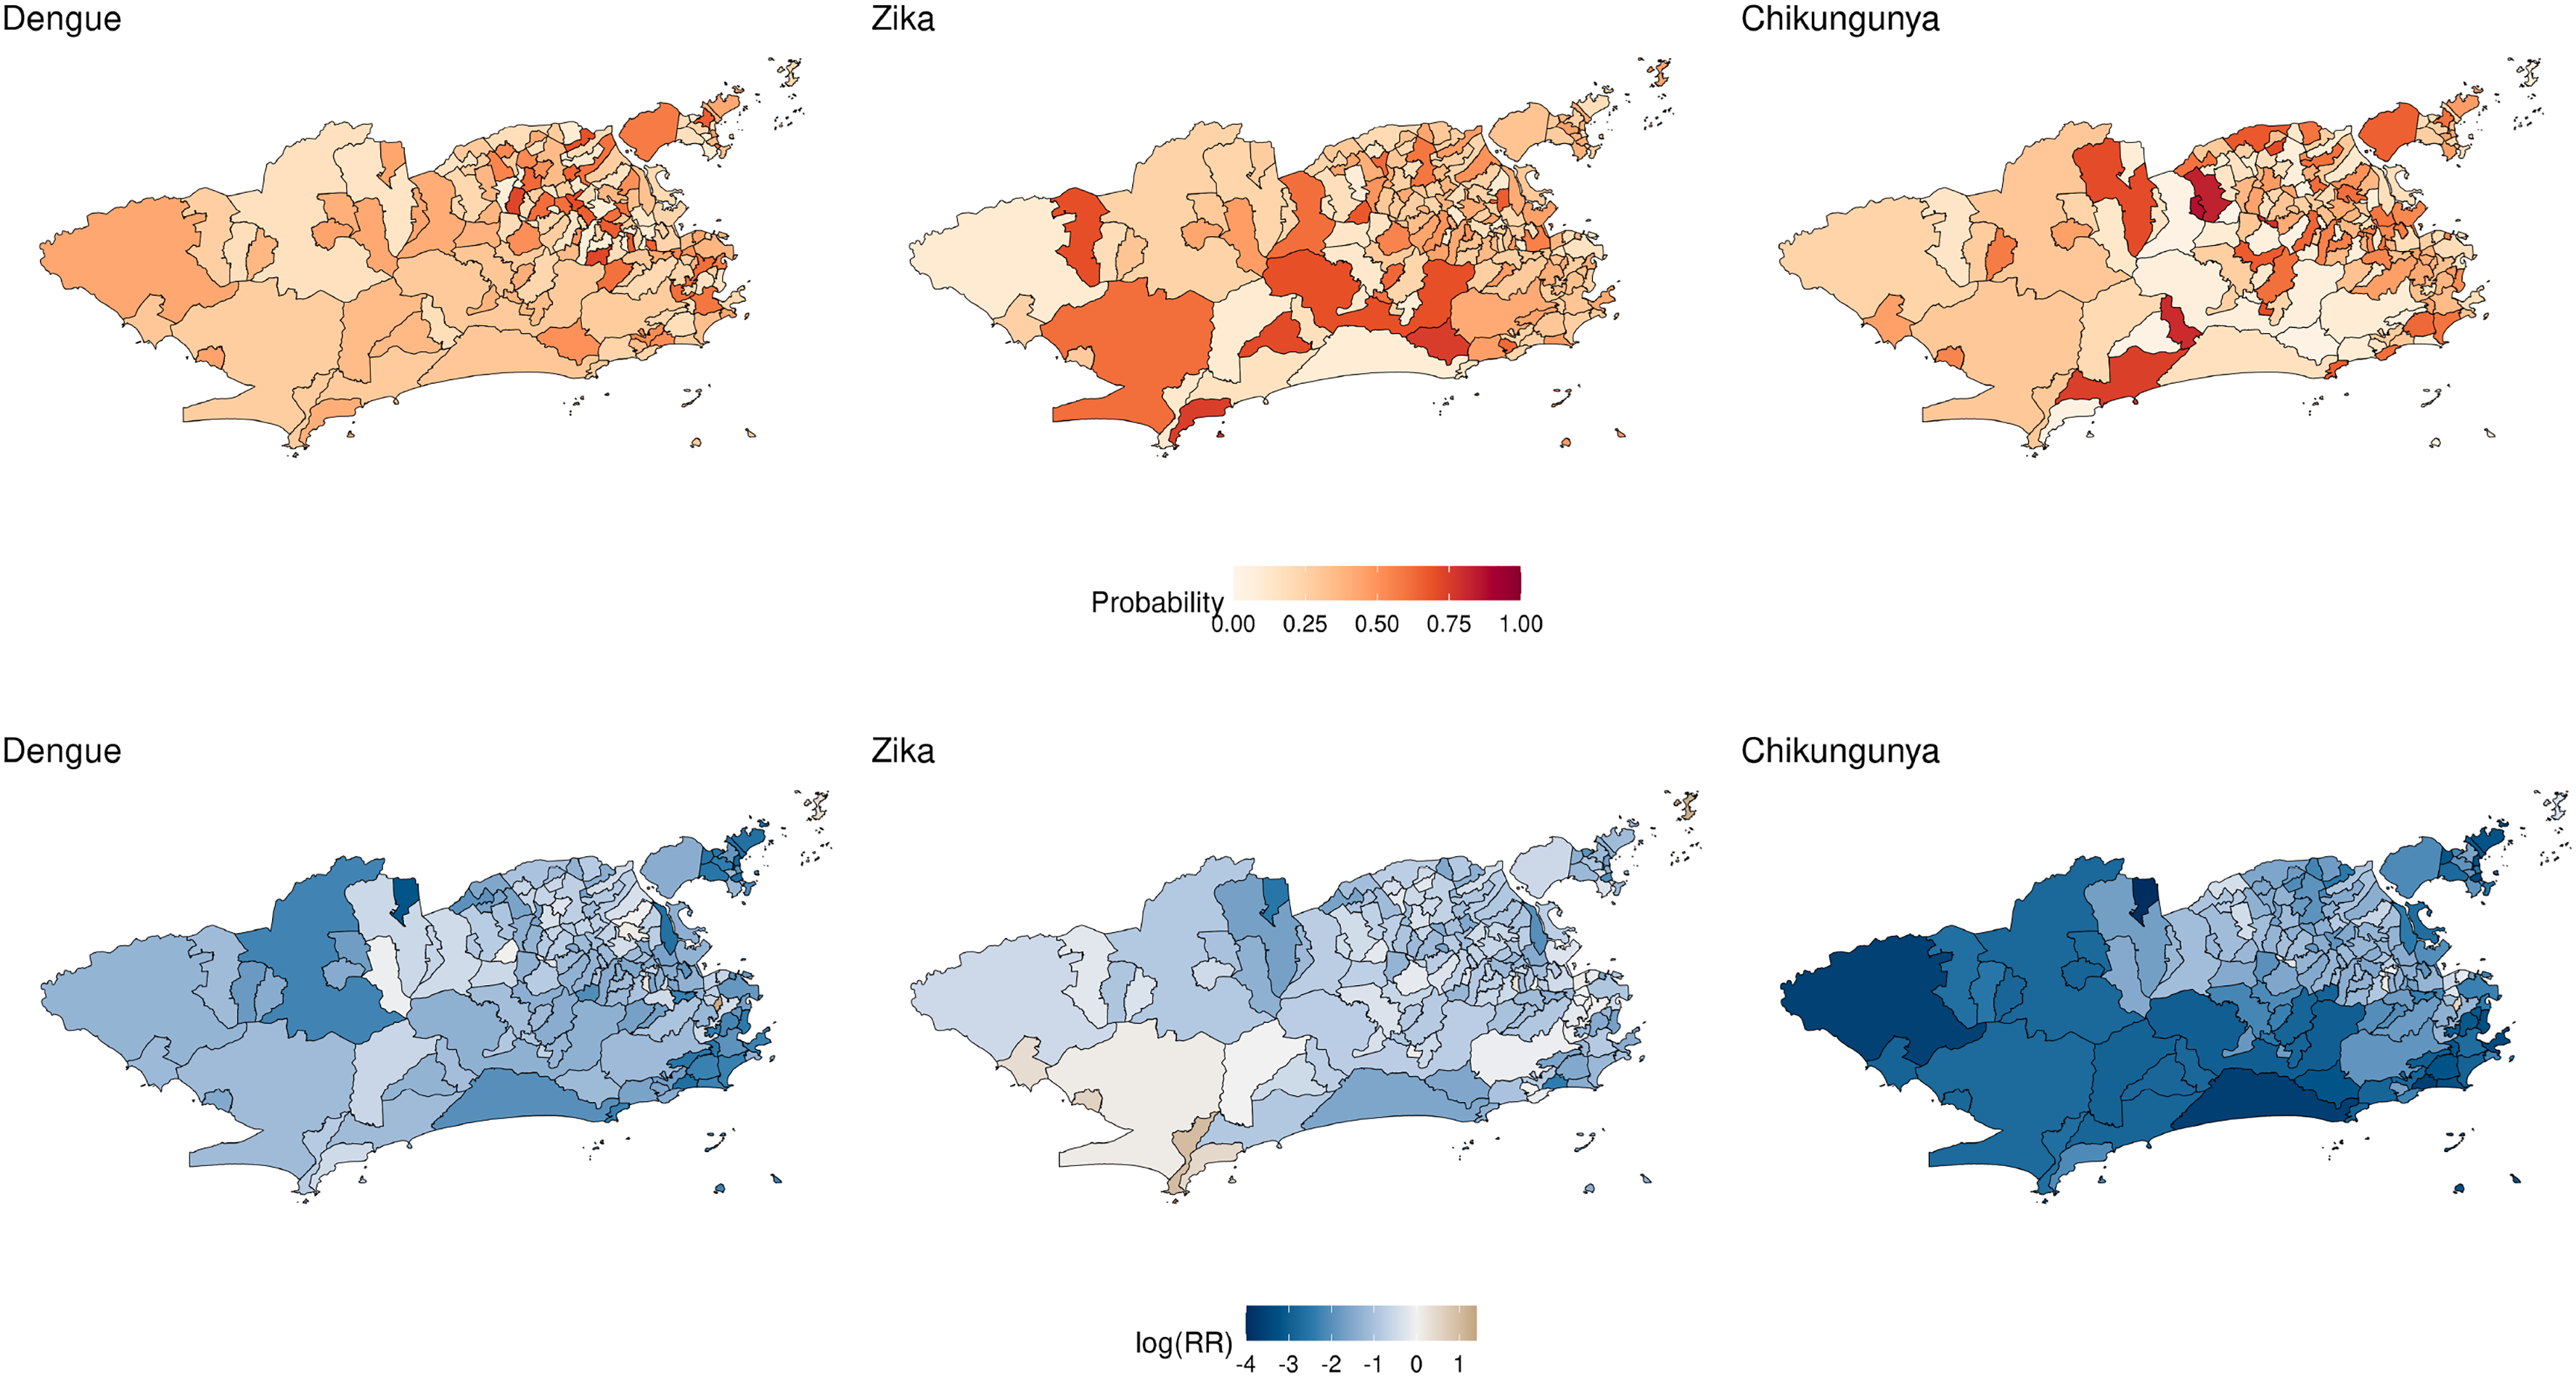
Posterior mean of the probabilities of presence of each disease
Dengue, Zika and chikungunya are vector borne diseases transmitted by the same species of Aedes mosquitoes. Between 2015 and 2016 the city of Rio de Janeiro experienced a joint epidemic of the three diseases for the first time, leading to what is known as a triple epidemic. We had available the number of cases of each disease across the neighborhoods of Rio de Janeiro. We proposed a model for the total cases of vector borne diseases and, conditional on the total number of cases, we proposed to model the probability of presence of each of the three diseases across the neighborhoods of the city. This was done by assuming a Poisson model for the total number of cases and, conditional on the total, we assumed a multinomial distribution for the vector of observed cases in each neighborhood.
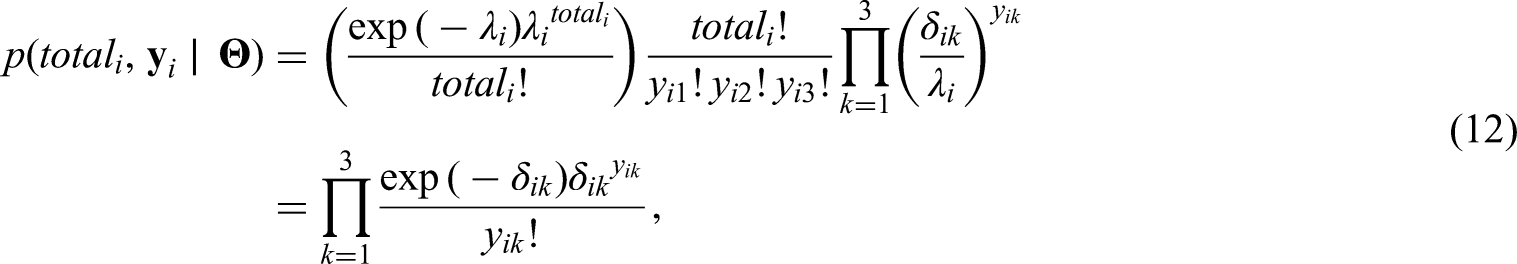
In Section 2 we discussed different parametrizations for the probabilities of presence of each disease. Because of the relationship between the Poisson and multinomial distributions, depending on the proposed parametrization, the total number of cases does not bring information to the likelihood function (see equations (11) and (12)). To allow the total number of cases to bring information to the likelihood function we proposed to model the probabilities in the multinomial component of the model through the baseline category logit model. 18 As dengue is endemic in the city for more than 30 years, it was considered as the baseline category. This implies that we are modelling the probability of a neighborhood having cases of Zika given it is either cases of dengue or Zika, and the probability of having chikungunya given it is either cases of dengue or chikungunya. A simulation study (Section D of the Supllementary Material) showed that we are able to recover the true values of the parameters when the data are generated from the Poisson-multinomial model (equations (4) and (5)).
We fitted particular cases of the proposed model to the data available from Rio de Janeiro; we considered both parametrizations, the Poisson-Multinomial model as in equations (4) and (5) and the multivariate Poisson model as in equation (10). And for each parametrization, we explored different prior specifications for the latent effects
As dengue is endemic in the city of Rio de Janeiro, we believe the parametrization in equations (4) and (5) provide multiple advantages in comparison to the one in equation (10). First it allows to account for the uncertainty in the total notified number of cases of Aedes-borne diseases. In particular, the multinomial component allows for uncertainty in the allocation of the total number of cases across the different diseases (categories). This is an interesting feature of the model as most of the notified cases are based on clinical-epidemiological criteria, without laboratory confirmation. As the three Aedes-borne diseases have similar symptoms, cases are often mistakenly classified when there is co-circulation,3,2 which is aggravated by the fact that it was the first time the city experienced epidemics of Zika and chikungunya. At the beginning of the triple epidemic, health workers were not aware that Zika and chikungunya were circulating in the city, and had little experience in clinically distinguishing the three diseases. Second, it provides a tool to understand how the number of cases of Zika and chikungunya are spread over the city in comparison to dengue, which has been present for more than 30 years in the city. The SDI of a neighborhood does not seem to affect differently the odds ratio of Zika or chikungunya in comparison to dengue as 1 is included in the respective 95% posterior credible interval of the odds ratios (see 2nd row of Table 2). We learned that the odds of a neighborhood having Zika instead of dengue increases by 2% with a one standard deviation increase of percentage of green area, but
The multivariate Poisson model can be seen as a particular case of the Poisson-Multinomial model. It provides estimates of the relative risks of the different diseases without providing a clear comparison among them. For the considered period, the multivariate Poisson model suggests that for all three diseases, the relative risk of neighborhoods decreases as the value of SDI increases. And as population density increases the relative risk of Zika decreases by approximately 16%; and as the percentage of green area increases the relative risk of chikungunya decreases by 15%.
The assumption of a multinomial distribution for the number of cases of each of the diseases implies on a negative conditional covariance structure. This is because in the multinomial distribution the events are assumed mutually exclusive. We do not believe this is an issue in the case of the Aedes-borne diseases because previous studies have suggested that co-infection of the different vector borne diseases rarely happens. However, we suggest to think carefully about this assumption before fitting the proposed model to the joint counts of other diseases.
A natural extension of the proposed model is to assume a negative binomial distribution for the total number of Aedes-vector borne diseases in each neighborhood. We fitted the negative binomial model to the total number of cases in our dataset, but it did not improve model fitting, and for this reason we only show the results based on the Poisson distribution for the total cases. See Section E of the Supplementary Material for more details.
Supplemental Material
sj-pdf-1-smm-10.1177_09622802221102628 - Supplemental material for A Poisson-multinomial spatial model for simultaneous outbreaks with application to arboviral diseases
Supplemental material, sj-pdf-1-smm-10.1177_09622802221102628 for A Poisson-multinomial spatial model for simultaneous outbreaks with application to arboviral diseases by Alexandra M. Schmidt, Laís P. Freitas, Oswaldo G. Cruz and Marilia S. Carvalho in Statistical Methods in Medical Research
Footnotes
Acknowledgements
The authors would like to thank the Municipal Secretariat of Health of Rio de Janeiro for providing the data on reported cases. The authors acknowledge financial support from the Natural Sciences and Engineering Research Council (NSERC) of Canada (Schmidt - Discovery Grants RGPIN-2017-04999), Institut de valorisation des données (IVADO) (Schmidt, Cruz and Carvalho - PRF-2019-6839748021), the Emerging Leaders in the Americas Program (ELAP) Government of Canada (Freitas), Coordenação de Aperfeiçoamento de Pessoal de Nível Superior - CAPES, Brazil - Finance Code 001 (Freitas), Fundação Carlos Chagas Filho de Ampara à Pesquisa do Estado do Rio de Janeiro, Brazil (Carvalho - Grant no. E_26/201.356/2014) and, Conselho Nacional de Desenvolvimento Científico e Tecnológico, Brazil (Carvalho - Grant no. 304101/2017-6).
Declaration of conflicting interests
None declared.
References
Supplementary Material
Please find the following supplemental material available below.
For Open Access articles published under a Creative Commons License, all supplemental material carries the same license as the article it is associated with.
For non-Open Access articles published, all supplemental material carries a non-exclusive license, and permission requests for re-use of supplemental material or any part of supplemental material shall be sent directly to the copyright owner as specified in the copyright notice associated with the article.