
Abstract
Quantitative methods have been proposed to assess and compare the benefit-risk balance of treatments. Among them, multicriteria decision analysis (MCDA) is a popular decision tool as it permits to summarise the benefits and the risks of a drug in a single utility score, accounting for the preferences of the decision-makers. However, the utility score is often derived using a linear model which might lead to counter-intuitive conclusions; for example, drugs with no benefit or extreme risk could be recommended. Moreover, it assumes that the relative importance of benefits against risks is constant for all levels of benefit or risk, which might not hold for all drugs. We propose Scale Loss Score (SLoS) as a new tool for the benefit–risk assessment, which offers the same advantages as the linear multicriteria decision analysis utility score but has, in addition, desirable properties permitting to avoid recommendations of non-effective or extremely unsafe treatments, and to tolerate larger increases in risk for a given increase in benefit when the amount of benefit is small than when it is high. We present an application to a real case study on telithromycin in Community Acquired Pneumonia and Acute Bacterial Sinusitis, and we investigated the patterns of behaviour of Scale Loss Score, as compared to the linear multicriteria decision analysis, in a comprehensive simulation study.
1 Introduction
A drug benefit–risk assessment consists of balancing its favourable therapeutic effects versus adverse reactions it may induce. 1 The benefit–risk balance is a strong predictor of the therapy’s long-term viability and a key element for decision-making during the drug’s development, the regulatory approval process, and the post-marketing follow-up.2–4 For many years, a qualitative description of evidences had been the main approach to establish a drug’s profile.5,6 This approach, however, tends to lack transparency since the decision of taking (dropping) a drug is based on a large amount of data coming from different sources and on criteria which can vary for different experts. Structured frameworks and quantitative methodologies have been recently proposed to make a benefit–risk assessment more comprehensive and consistent.7–12
According to the European Medicine Agency Benefit–Risk Methodology Project,6,13–15 one of the most comprehensive quantitative approaches is multicriteria decision analysis (MCDA).16–19 It has also been recommended by several highly profiled expert groups, e.g. see IMI PROTECT Work package 5. 20 The main idea of MCDA is to calculate a single utility score using multiple criteria and taking into account the importance of each criterion. While non-linear forms of the utility score are recognised in various application areas of MCDA,21,22 a linear aggregation of treatment’s effects on benefits and risks remains the most common choice for the drug development.17,23–26 The major advantage of the linear model is its intuitive interpretation: a poor efficacy can be compensated by a good safety, and vice-versa. However, the linear utility score can result in the recommendation of highly unsafe or poorly effective drugs27,28 and, consequently, in a counter-intuitive conclusion. Moreover, the linearity implies that the relative tolerance in the toxicity increase is constant for all levels of benefit. This leads to implicit assumptions on decision-makers’ preferences which might not hold for all drugs. Avoiding these pitfalls is possible with, first, adopting good practices to ensure that the modeling approach makes sense, 27 and, second, by using non-additive and non-linear models.12,29 The main objectives of this work are to explicitly illustrate the issues of the additive linear MCDA model through a comprehensive simulation study, and to provide an alternative approach, namely, Scale Loss Score, for aggregation of treatment’s effect overcoming these issues. The proposed approach is based on recent developments in the theory of estimation in restricted parameter spaces30,31 and is shown to have soundness in the context of drug evaluation.
The case study of telithromycin (Ketek®) raises questions regarding the suitability of a linear MCDA utility score for the drug benefit–risk assessment. Telithromycin was approved for the treatment of infections in several indications in 2001 by the EMA 32 and in 2005 by the FDA. 33 It was (qualitatively) reassessed in 2006–2007 by both agencies based on updated safety data. In particular, some serious visual adverse reactions, syncopes and acute liver failures have been reported. The terms of the marketing authorisations were varied in order to better describe the drug safety profile, and two indications were removed from the labeling by the FDA, among them Acute Bacterial Sinusitis (ABS). More recently, the IMI PROTECT Benefit–Risk Group34 applied MCDA to this clinical example. Even if this assessment was performed solely for the purpose of testing the methodology, the main results indicated a fairly strong superiority of telithromycin versus the comparators in ABS, which is not consistent with the concerns expressed by the health authorities. Consequently, alternative methods more accurately reflecting decision-makers’ preferences are of great interest.
In this work, we extend the assumption of non-linearity of preferences, which is well established in other fields such as microeconomics or ecology,21,35,36 to the drug development context. We advocate two properties that a desirable measure of drug benefit–risk assessment should have:
Decreasing level of risk tolerance relative to benefits: an increase in risk could be more tolerated when benefit improves from ‘very low’ to ‘moderate’, compared to from ‘moderate’ to ‘very high’. Non-effective or/and extremely unsafe treatments should never be recommended.
Motivated by recent developments in the theory of the weighted information measures37,38 and in the theory of estimation in restricted parameter spaces, 31 we propose Scale Loss Score (SLoS) as a novel measure for the benefit–risk assessment which shares both of these properties. The first property is achieved through convex preferences between efficacy and safety and the second one by a strong penalisation of extremely low benefit and high risk values.
We perform a comprehensive simulation study investigating the performances of SLoS and MCDA in many different scenarios. Note that this is, to our knowledge, the first time the properties of MCDA are systematically explored by simulations in the medical context. We also apply the new measure to the motivating clinical context of telithromycin. The elicitation of criterion weights for linear MCDA utility scores is widely discussed in the literature.11,12,39–45 Therefore, we provide an algorithm of mapping MCDA weights to SLoS weights so that the same elicitation process could be followed while preserving the weight interpretation.
The rest of the paper is organised as follows. The MCDA utility score and the novel measure are detailed in Section 2. Section 3 describes the application of both measures in the real case study (telithromycin). We present a simulation study in Section 4 and conclude with discussion in Section 5. Additional information including source code to reproduce the results may be found in the Supplemental Material.
2 Methods
2.1 MCDA utility score
The original proposal of MCDA16,17 ignores the uncertainty of parameter estimates. As this uncertainty can bare crucial information, an extension of MCDA taking into account the variability of estimates was proposed by Waddingham et al. 46 This approach is often called Probabilistic MCDA (or Stochastic MCDA) and is described below.
2.1.1 Utility score
Consider m treatments (indexed by i) which are assessed on n criteria (indexed by j). We adopt the following notation:
ξij is the performance of treatment i on criterion j, so that treatment i is characterised by the vector The monotonically increasing partial value functions The weights indicating the relative importance of the criteria are known constants denoted by wj such that

The MCDA linear utility score is obtained as

The higher the utility score, the more preferable the benefit–risk ratio. Then, the comparison of treatments i and h is based on

While maximising utility is common in economics,
36
the concept of a loss function is usually preferred in statistical decision theory and Bayesian analysis for parameter estimation.
35
The complement of the MCDA utility score,
Although the term ‘MCDA’ outside of the health domain refers to the general methodology to summarise several characteristics in a single aggregated score, in this work we adopt the notation ‘MCDA’ for the additive utility score with linear partial values functions corresponding to the conventional model adopted so far in the drug benefit–risk assessment. 12
2.1.2 Estimation
Within a Bayesian approach, the utility score

The probability (3) is used to guide a decision on taking/dropping a drug. A possible way to formalise the decision based on this probability is to compare it to a threshold confidence level
2.1.3 Weight elicitation
Weighting is a structured way to capture the stakeholders’ preferences between the criteria. It is recognised as a complex problem since it involves both clinical and societal value judgments. 41 Methods for quantifying subjective preferences have been widely studied in the literature,11,12,39,40,42,43,45 among which Discrete Choice Experiment and Swing-Weighting appeared to be appropriate in terms of theoretical foundations, cognitive burden, feasibility and robustness.16,44,47,48 In the MCDA framework, the weight assigned to one criterion is interpreted as a scaling factor which relates one increment on this criterion to increments on all other criteria.
2.1.4 MCDA illustration: two criteria
Let us consider an example with two criteria (one benefit indexed by 1, one risk indexed by 2) to illustrate an insight on the linear utility score in equation (2). The utility score for treatment i at fixed parameter values

As values Left panel: contours of equal linear loss score 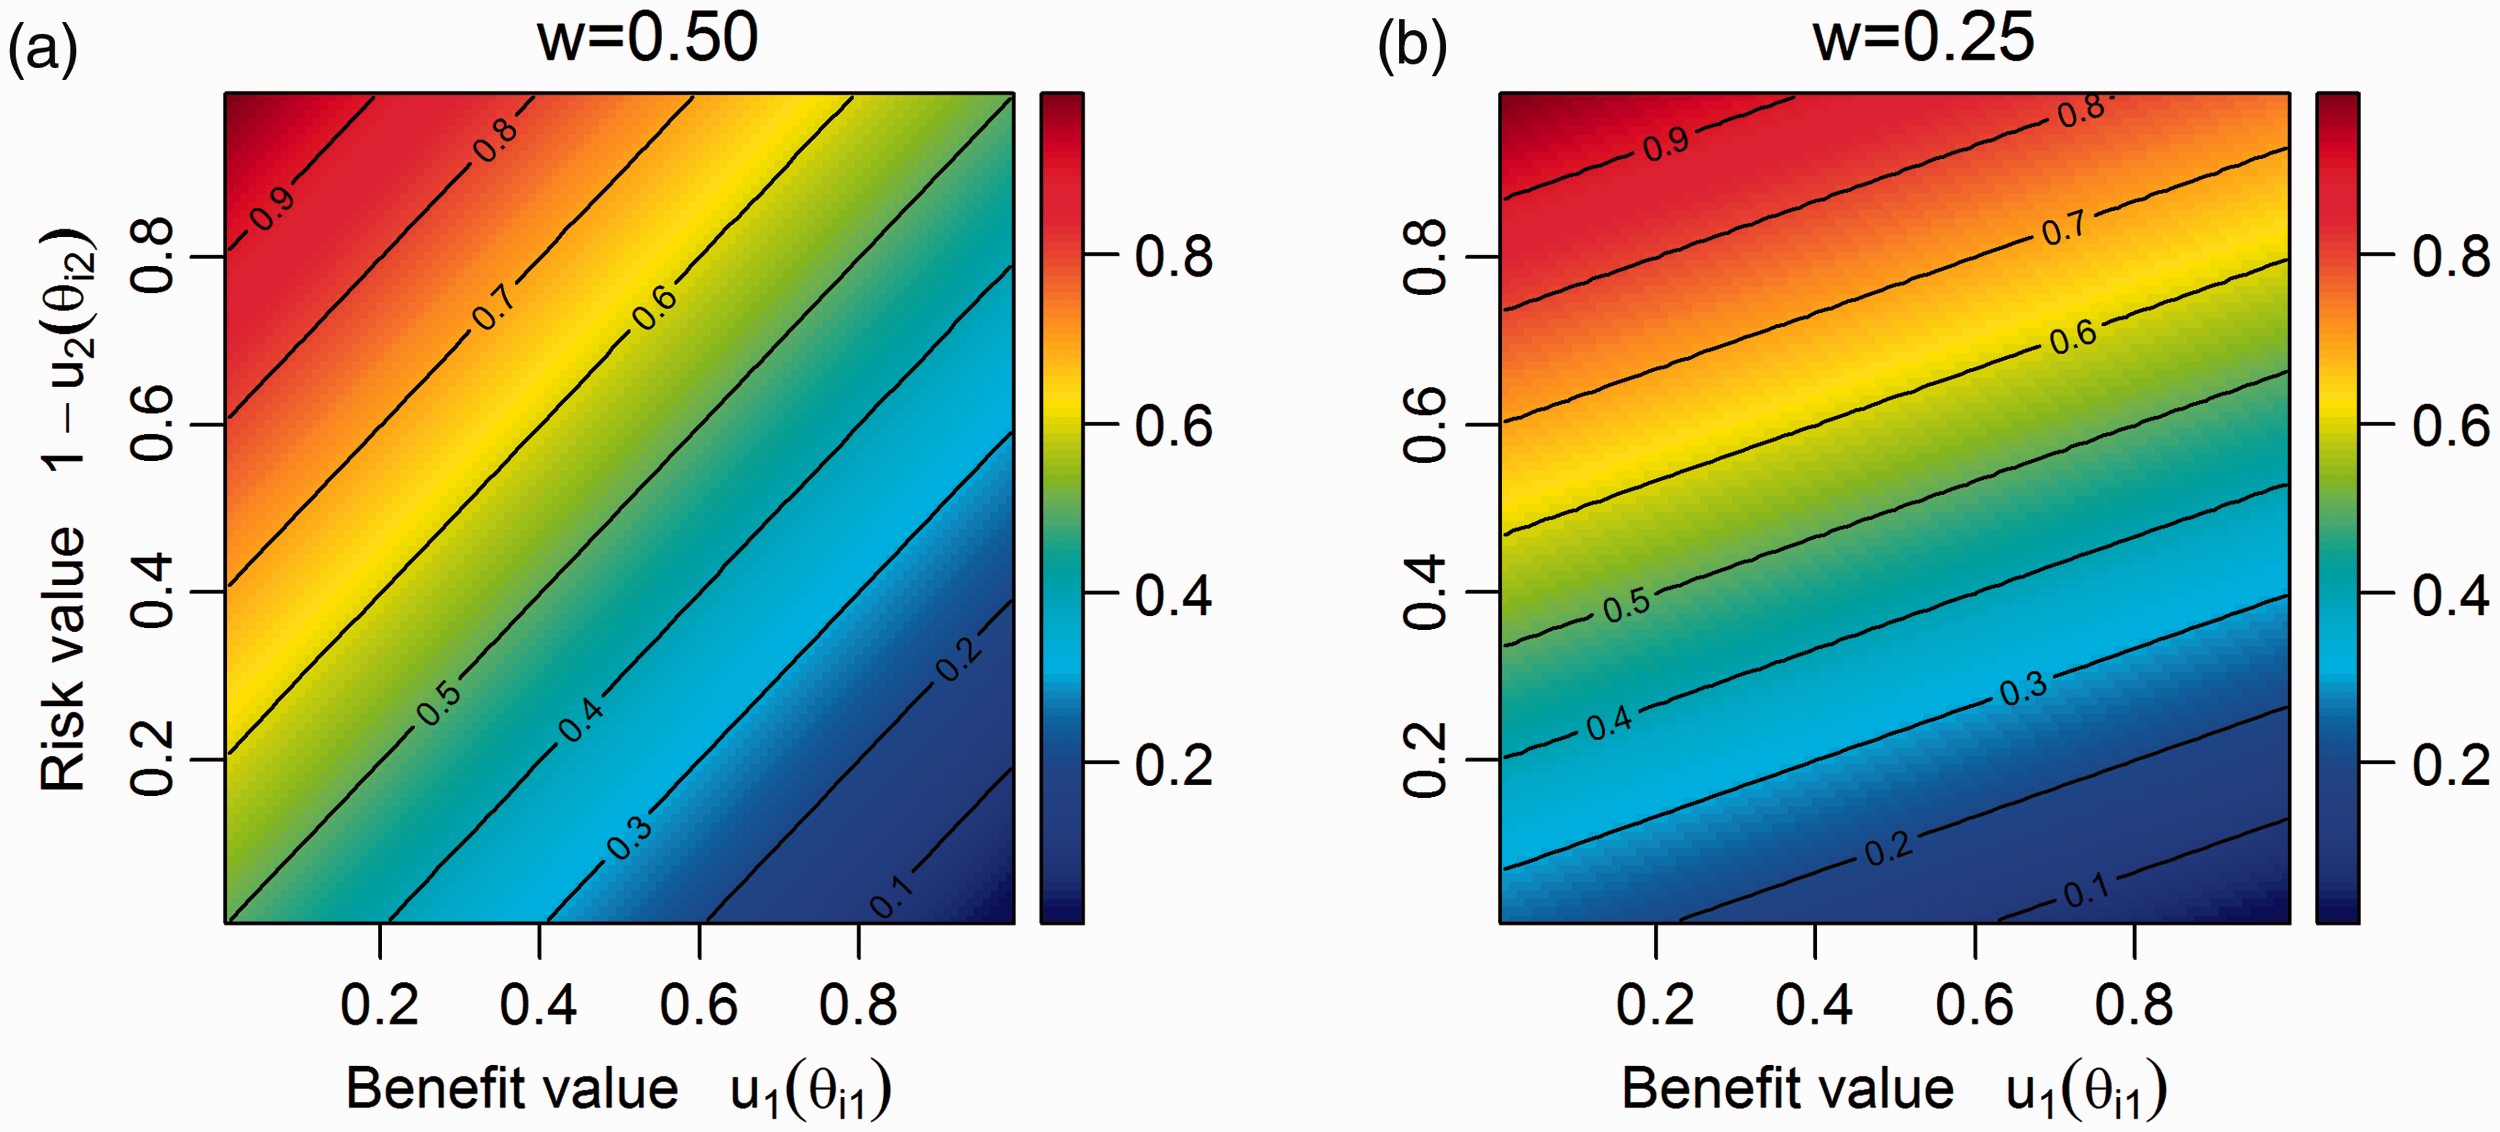
Lower values of The benefit–risk trade-off is the same for all values of the risk/benefit.
Consider two cases where a drug increases the benefit probability from (a) 0.15 to 0.30 and (b) from 0.80 to 0.95 compared to another therapy. In case (a), the increase doubles the benefit probability and a higher increase in toxicity can usually be tolerated. At the same time, the same increase in case (b) is not as relatively large, therefore it can be argued that only a smaller increase in the risk probability may be tolerated. However, the linear utility score implies that the same increase in risk to match the benefit increase can be sacrificed.
Drugs with
Examples of MCDA linear utility scores with two criteria and w = 0.25.
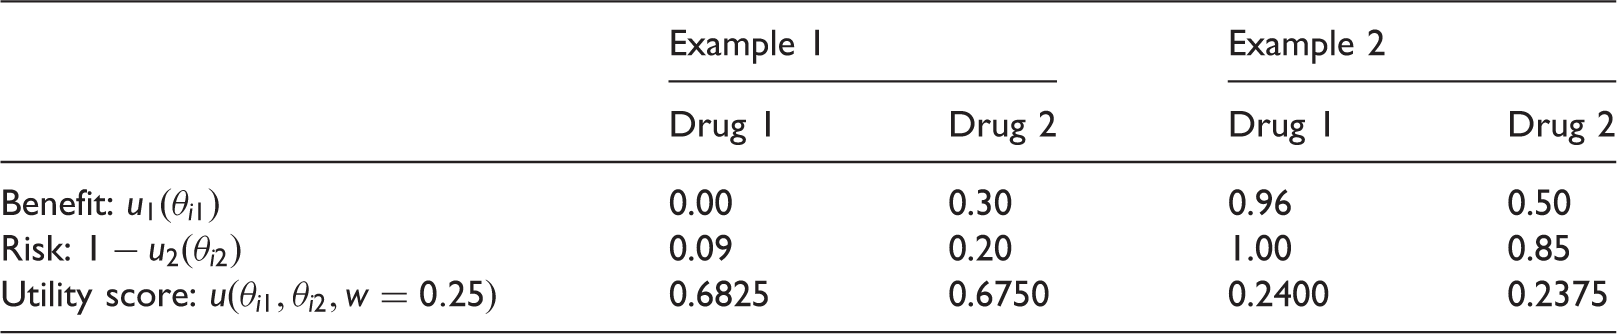
Even if none of those drugs are likely to be taken to the market, the goal of MCDA is to rank treatments and these examples reveal some counter-intuitive conclusions to which MCDA can lead. Note that decreasing values of w would help to solve the paradox in Example 1, but would worsen it in Example 2.
We advocate two properties of a benefit–risk analysis measure:
for a given increase in benefit, one can tolerate a larger increase in risk if the amount of benefit is small than if it is high, and one is not interested in the level of risk (benefit) if the drug does not treat (harm all) patients.
Formally, these properties correspond to (i) the concavity of equal loss score contours (or, equivalently, the convexity of equal utility score contours) and to (ii) a strong penalisation of extreme low benefit values and extreme high risk values. We would like to stress that the convexity of utility (concavity of loss) is widely advocated in microeconomics and is believed to reflect preferences in a more adequate way than linear ones in many applications.21,36
One can check that none of these properties are satisfied for MCDA due to its linearity. There are two forms of linearity in MCDA: in the partial value functions and in the utility score. Note that property (i) of decreasing level of risk tolerance relative to benefits can be achieved by varying the shape of the partial value functions (for instance, using concave functions for benefit and linear functions for risk). However, the explicit elicitation of non-linear forms for the partial value functions may be challenging. As the linear partial function remains a common choice in drug benefit–risk assessment, we propose a novel measure of aggregation which allows for both properties to be achieved even under linear partial value functions.
2.2 Scale loss score
2.2.1 Derivation
As an alternative to the linear MCDA utility score (equation (2)), we define SLoS for aggregation of treatment’s performances as

Clearly,
SLoS is a measure of the benefit–risk balance permitting to discriminate treatments according to their performances and according to the weights attributed to the criteria. The lower the SLoS, the more preferable the benefit–risk ratio, and the comparison of treatments i and h is based on

2.2.2 Estimation
Similarly to MCDA, we consider a Bayesian model and assign a prior probability distribution to ξij. Given the observed outcomes 
This probability can be compared to a fixed confidence threshold ψ as in the MCDA approach.
2.2.3 SLoS illustration: two criteria
To illustrate the properties of SLoS, consider the example presented in Section 2.1.4 with one benefit and one risk. The SLoS for treatment i in the point of fixed parameter values takes the form

Figure 2 presents the contours of SLoS (equation (6)) for all pairs of Left panel: contours of l(θi1, θi2, 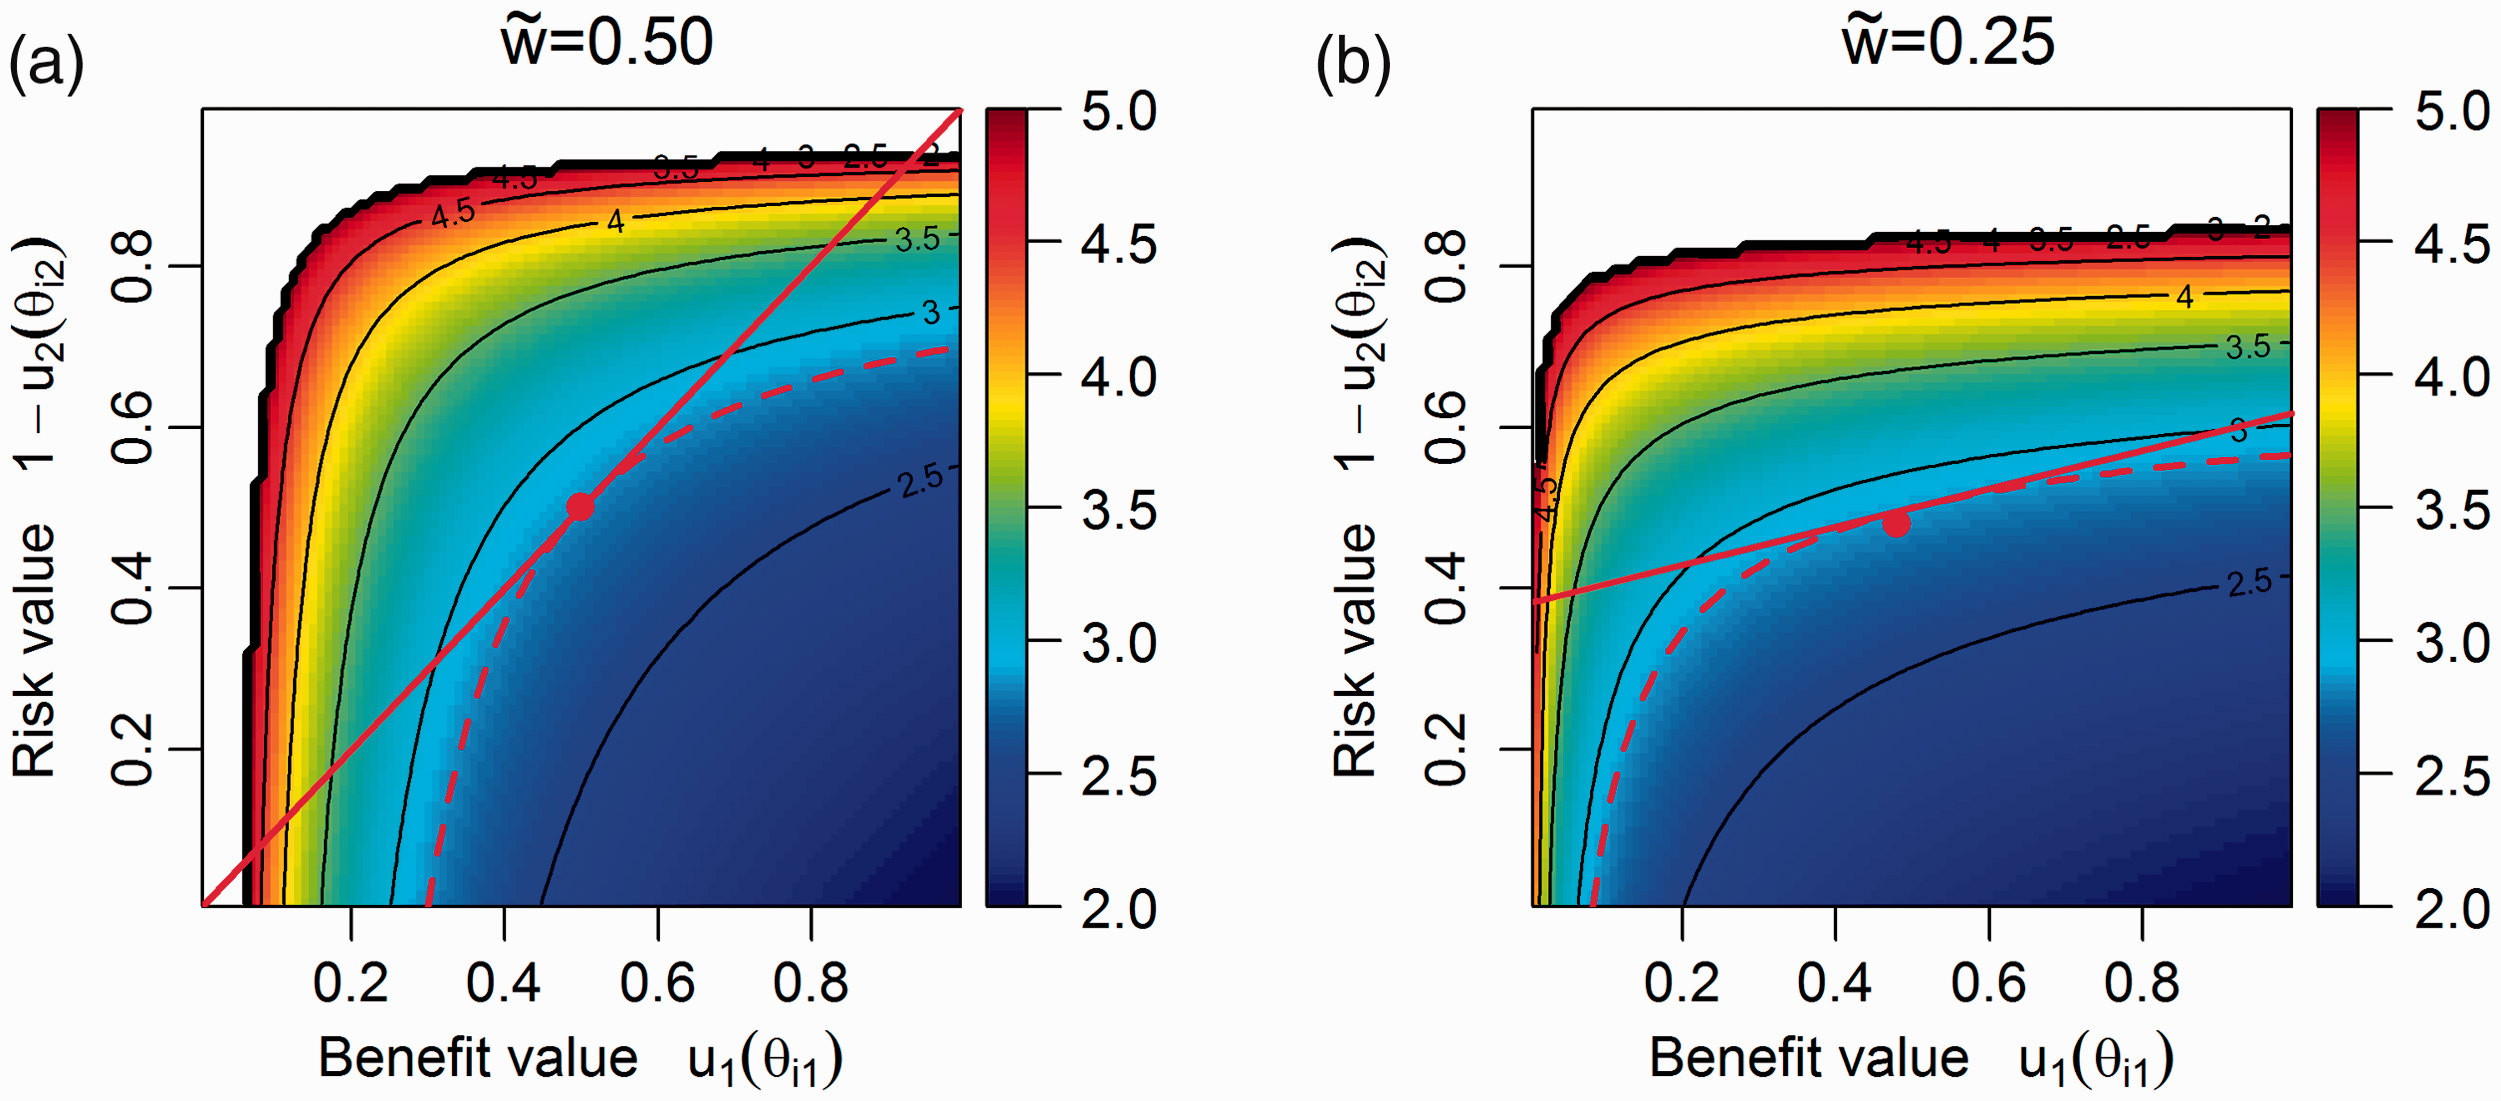
SLoS is minimised when the benefit–risk balance of the drug is maximised, at the point (1,0) (right bottom corner), where the maximum possible benefit is reached with no risk. The loss score is infinite for extreme low benefit values and extreme high risk values, thus non-effective or extremely unsafe treatments could never be recommended. Considering the cases presented in Table 1, the drug 2 had a SLoS equal to 2.53 for the first example and of 5.34 for the second example, and it is preferred to drug 1 which SLoS is infinite in both cases.
The contour lines of equal loss are concave, which is equivalent to having convex preferences between additional benefit and avoided risk, and have the form


The slope decreases as benefit increases. It follows that the relative importance of the benefit criterion over the risk criterion decreases with the amount of benefit itself. In other words, an increase in toxicity is more tolerated if, in parallel, efficacy improves from ‘very low’ to ‘moderate’, compared to from ‘moderate’ to ‘very high’.
2.2.4 Weight elicitation
Since comprehensive work has been published and is currently being continued on the weight elicitation for MCDA, we present a way to map MCDA weights wj to SLoS weights 
The weight mapping (equation (8)) does not have an analytical solution, but the approximate value of Weight mapping.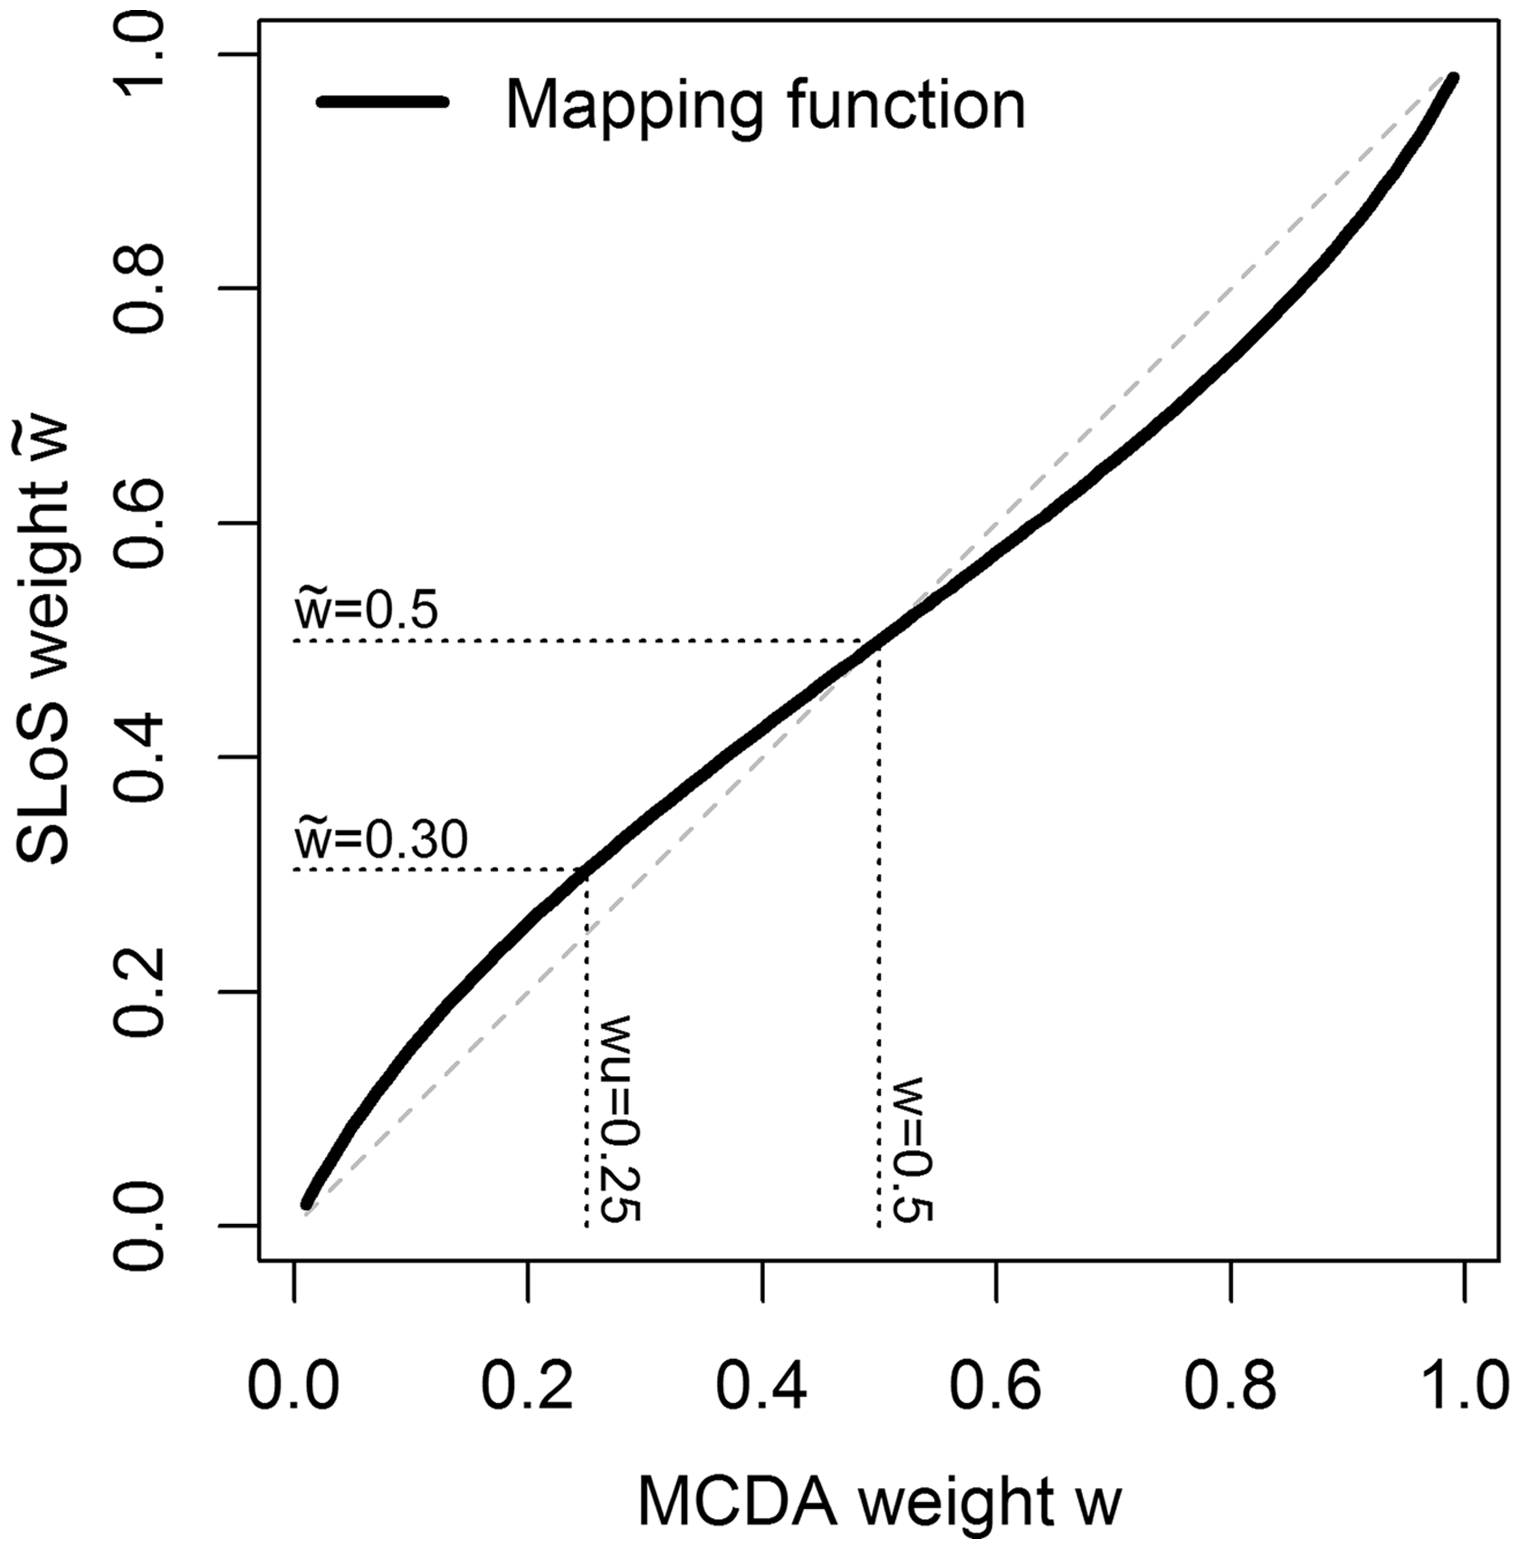
Considering an arbitrary number of criteria, the mapping (equation (8)) can be applied to each value of the MCDA weights. For instance, using four criteria with a weight vector
Mapping weights to the middle point of the benefit and risk treatment performance range relies on the assumption that MCDA weights were elicited across the entire range, or that the trade-off between criteria was anchored on average at the middle point. However, in practice, MCDA weights could have been elicited at any other point and extrapolated. In this case, the mapping procedure above could be performed accordingly by finding the SLoS weight satisfying the equality of the slopes of MCDA and SLoS contour tangents in any other point of interest.
3 Case study: telithromycin
We illustrate the use of SLoS and MCDA in a real clinical context on the case-study thelithromycin (Ketek®) reported by the IMI PROTECT Benefit–Risk Group. 34
Telithromycin was approved in 2001 for several indications as an alternative when beta-lactam antibiotics are not appropriate, and we will focus on the indications Community Acquired Pneumonia (CAP) and Acute Bacterial Sinusitis (ABS) as they well illustrate similarities and differences between the two methods. A Probabilistic MCDA model was considered in the IMI PROTECT report 34 (called Stochastic Multicriteria Acceptability Analysis with fixed weights), and MCDA utility scores presented here are derived from the original report.
Telithromycin is compared to a single alternative called ‘comparator’, which comprises amoxicillin-clavulanic acid, cefuroxime and clarithromycin, used as comparators in clinical studies and pooled together. The probabilities of five binary criteria, one benefit and four adverse events (AE), were transformed using linear partial value functions (equation (1)) with the following most and least preferred probabilities of occurrence Benefit: cure rate (CAP: Risks:
– Hepatic AE (CAP: – Cardiac AE (CAP: – Visual AE (CAP: – Syncope (CAP:
Mean and 95% CrI of the Beta posterior distributions of benefit and risk parameters and of corresponding partial value functions, with their MCDA weight, for Telithromycin (Teli.) and Comparator (Comp.).
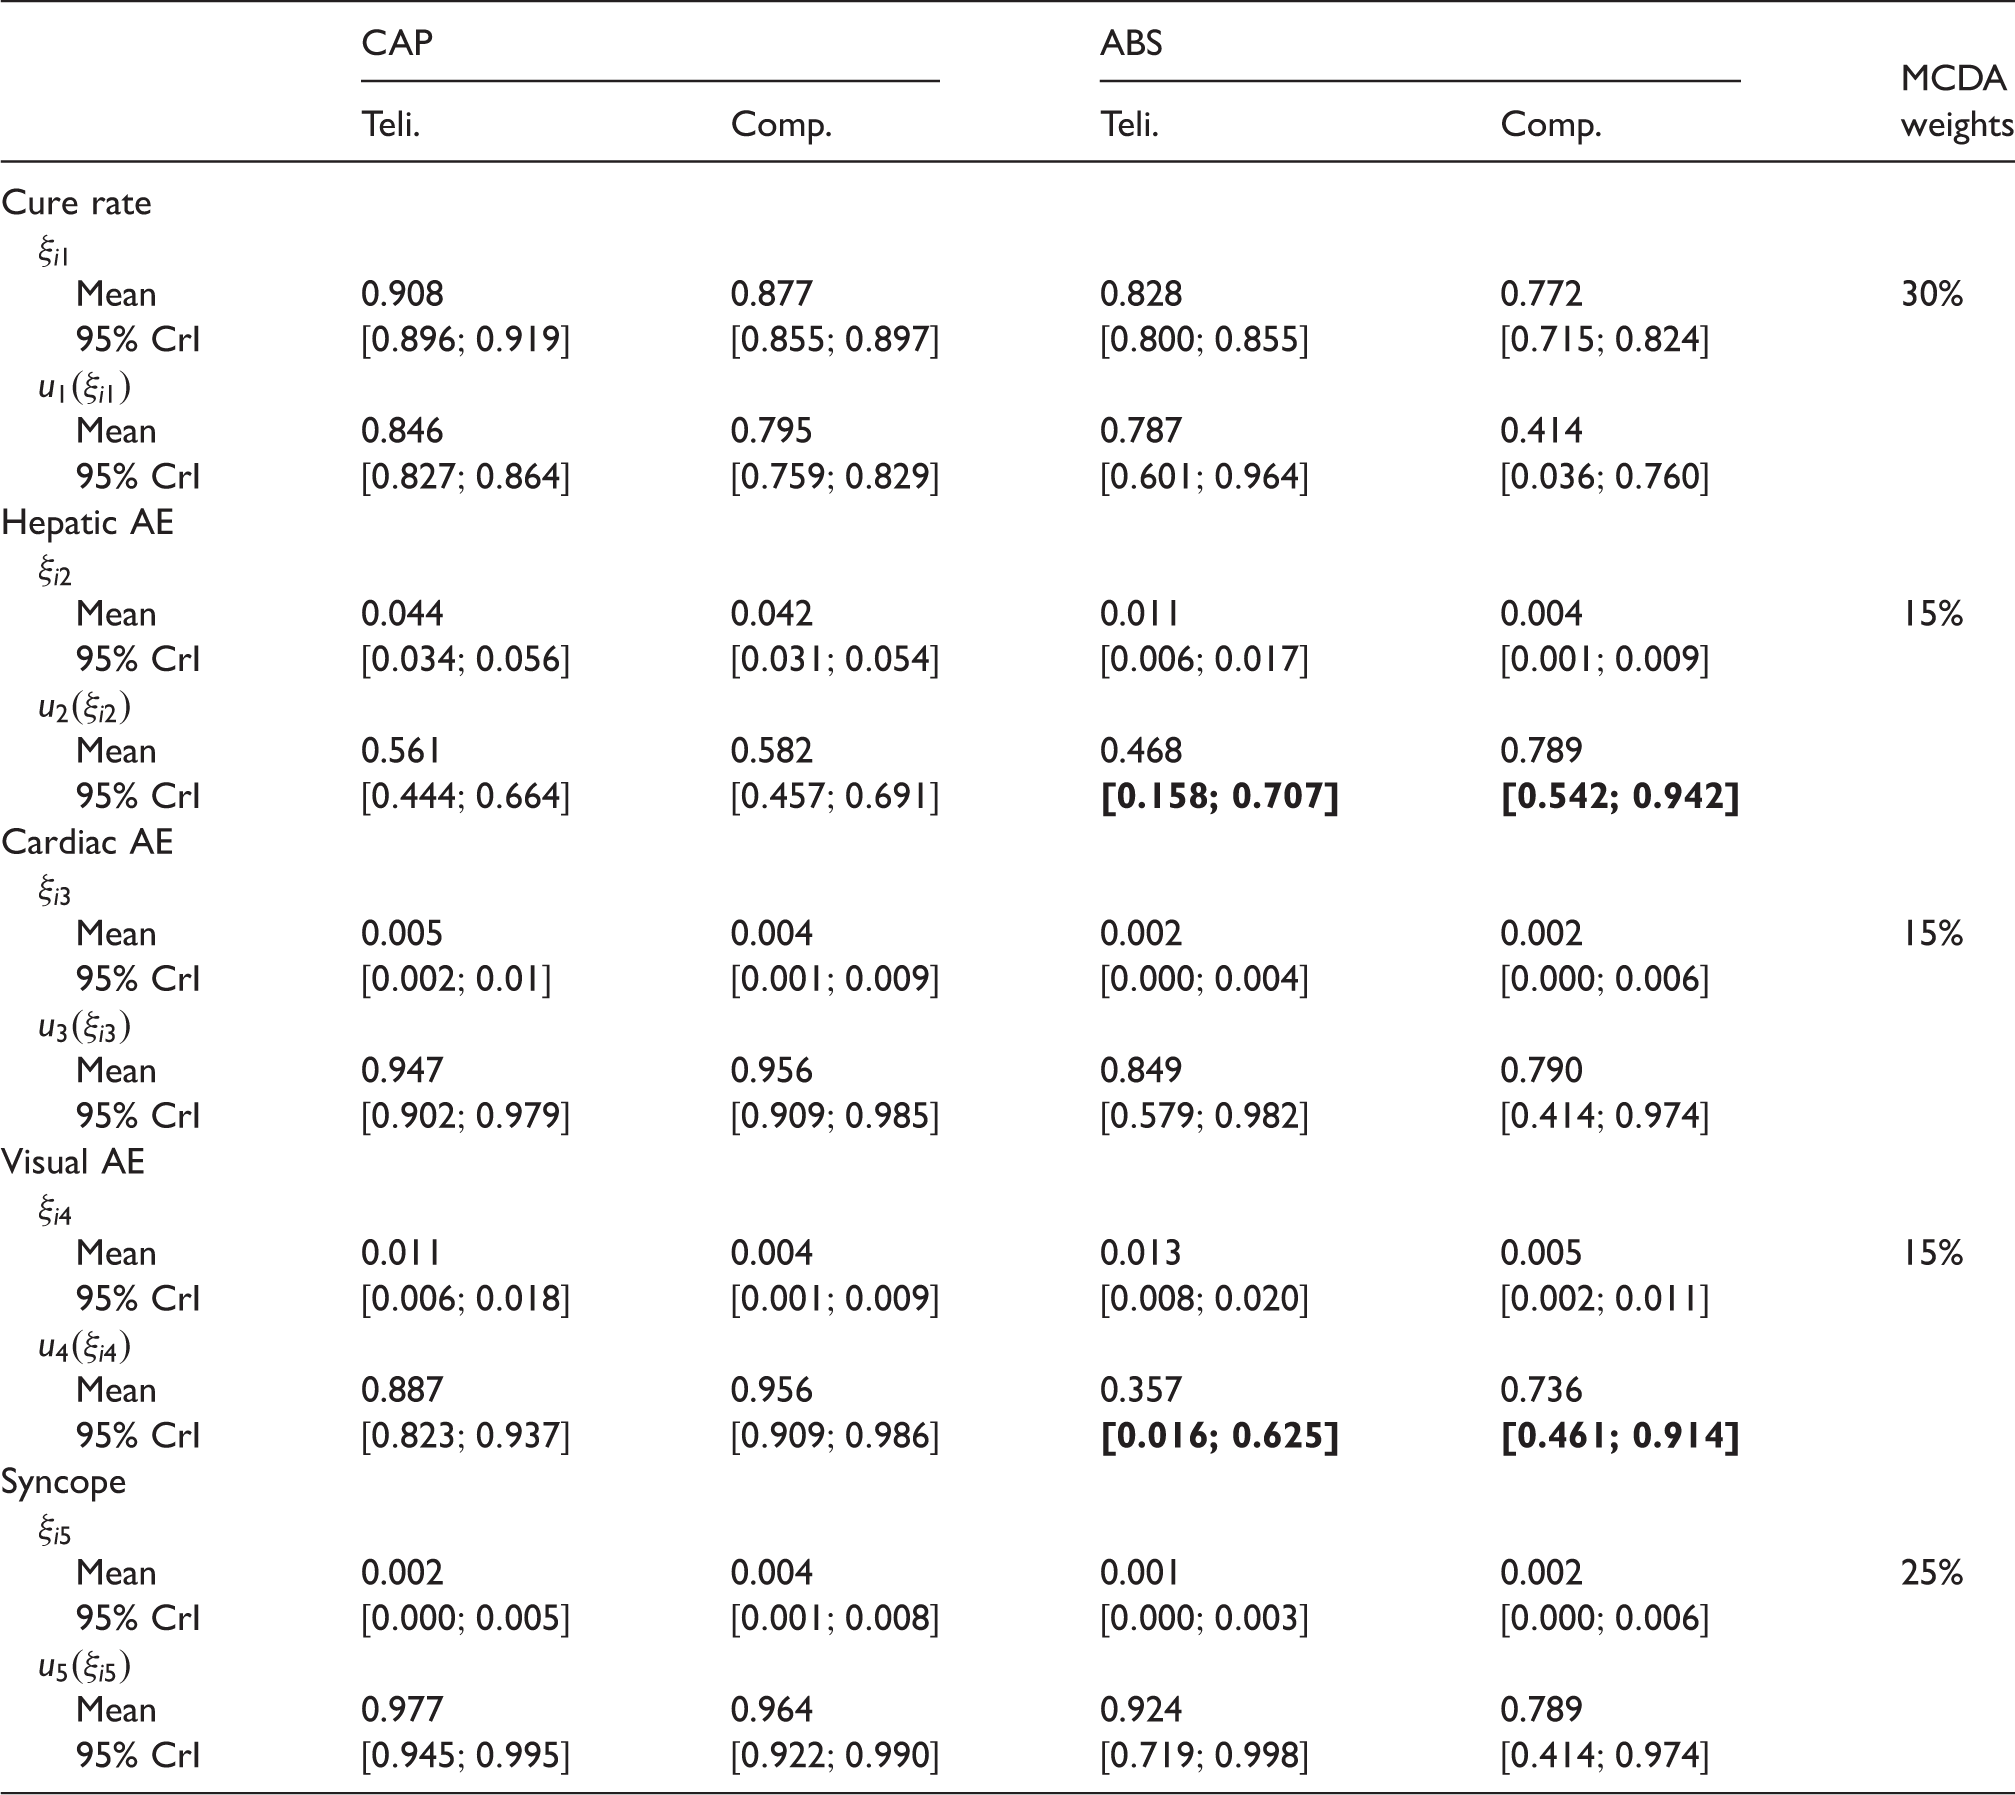
This information was used to approximate the posterior distributions of MCDA linear utility score and SLoS. The mapped SLoS weights corresponding to the MCDA weights are
For the CAP indication, MCDA and SLoS provide similar results, with probabilities that telithromycin is better than the comparator equal to 59% and 51%, respectively. These results indicate that telithromycin has a slightly better benefit–risk profile than the comparator, but with large uncertainty.
For the ABS indication, the probability that the benefit–risk balance of telithromycin is better than the comparator is equal to 71% using MCDA and 55% using SLoS. While they both indicate results in favour of telithromycin, this advantage appears to be much more uncertain with SLoS than with MCDA. The difference between the methods can be mainly explained by a higher rate of Visual AE with telithromycin (1.3% versus 0.5%), which is close to the least preferred value for this criterion in this indication (
A sensitivity analysis was conducted using MCDA weights to compute SLoS (omitting the weight mapping) and the conclusions are globally robust, with the probability of telithromycin being better than the comparator equal to 57% for CAP and 62% for ABS.
In the next section, we present a simulation study illustrating the properties of SLoS and MCDA in many different scenarios.
4 Simulation study
4.1 Setting
To investigate the performances of SLoS and MCDA, we simulated randomised controlled clinical trials with two treatments i = 1, 2, named T1 and T2, N = 100 patients per group, and two uncorrelated binary criteria (j = 1 for benefit and j = 2 for risk). We assume that benefit events are desirable (e.g. treatment response), while risk events should be avoided (e.g. adverse event), with the performance parameters ξij being their probability of occurrence. The partial value functions are defined as
Simulation scenarios with two criteria.
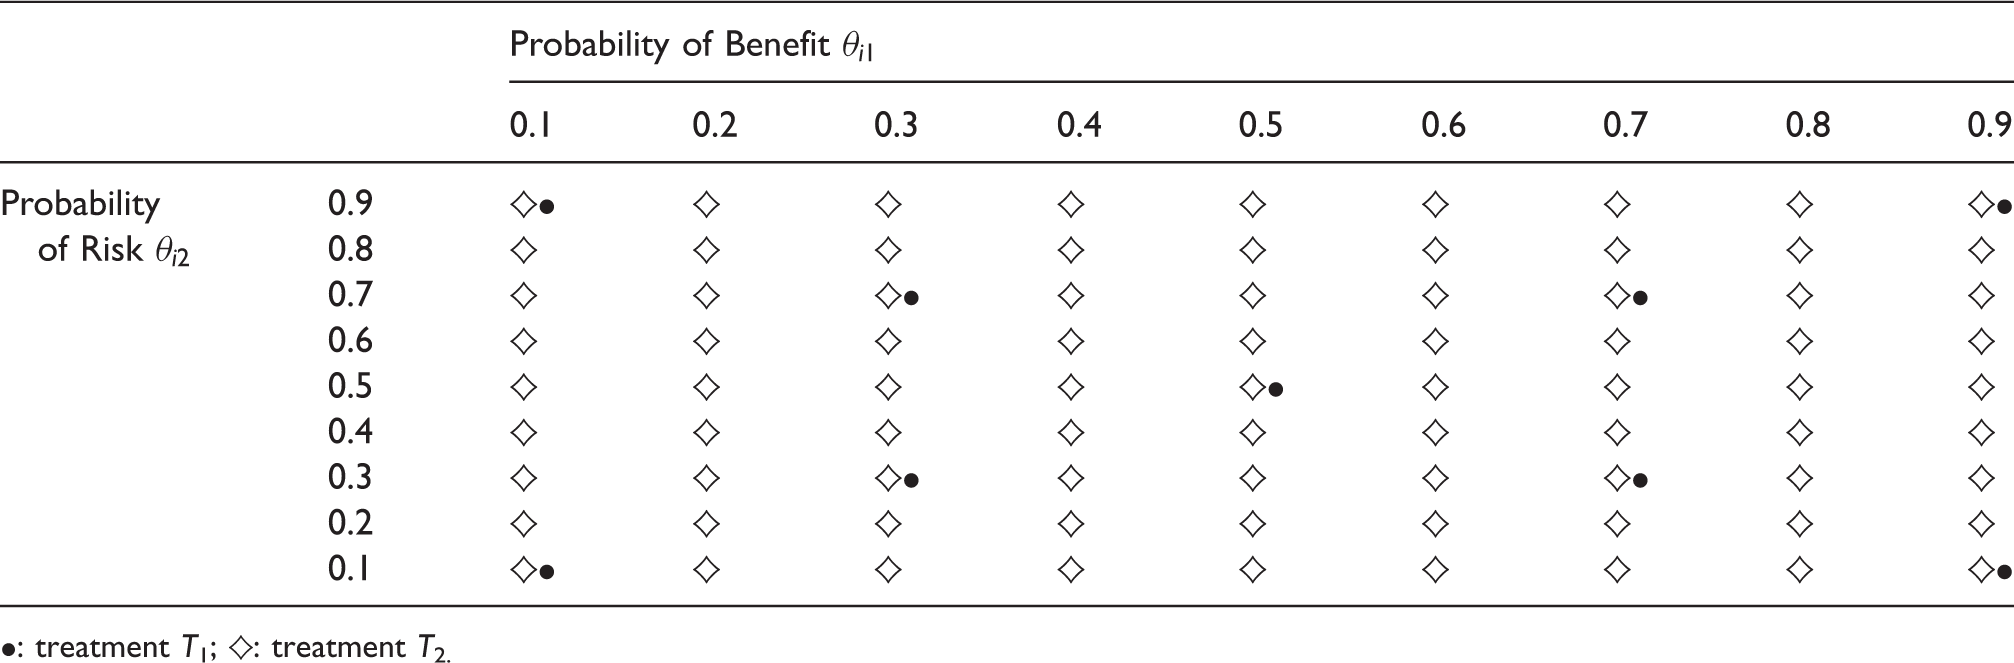
•: treatment T1; ♦: treatment T2.
Let S be the total number of simulated trials and K the number of samples generated to approximate the distributions of interest. In each trial
Assuming the threshold confidence level
The analyses were conducted using R, with S = 2500 simulated clinical trials and K = 2000 simulations to estimate the parameter distributions.
4.2 Results
The results are presented in Figure 4. All nine scenarios for treatment T1 are presented in rows and numbered 1 to 9. Each graph corresponds to fixed expected probabilities of event for treatment T1 (•), and each cell corresponds to a combination of expected probabilities of benefit and risk for T2. The probabilities Results of MCDA and SLoS performances in all simulation scenarios for two equally important criteria (wj = 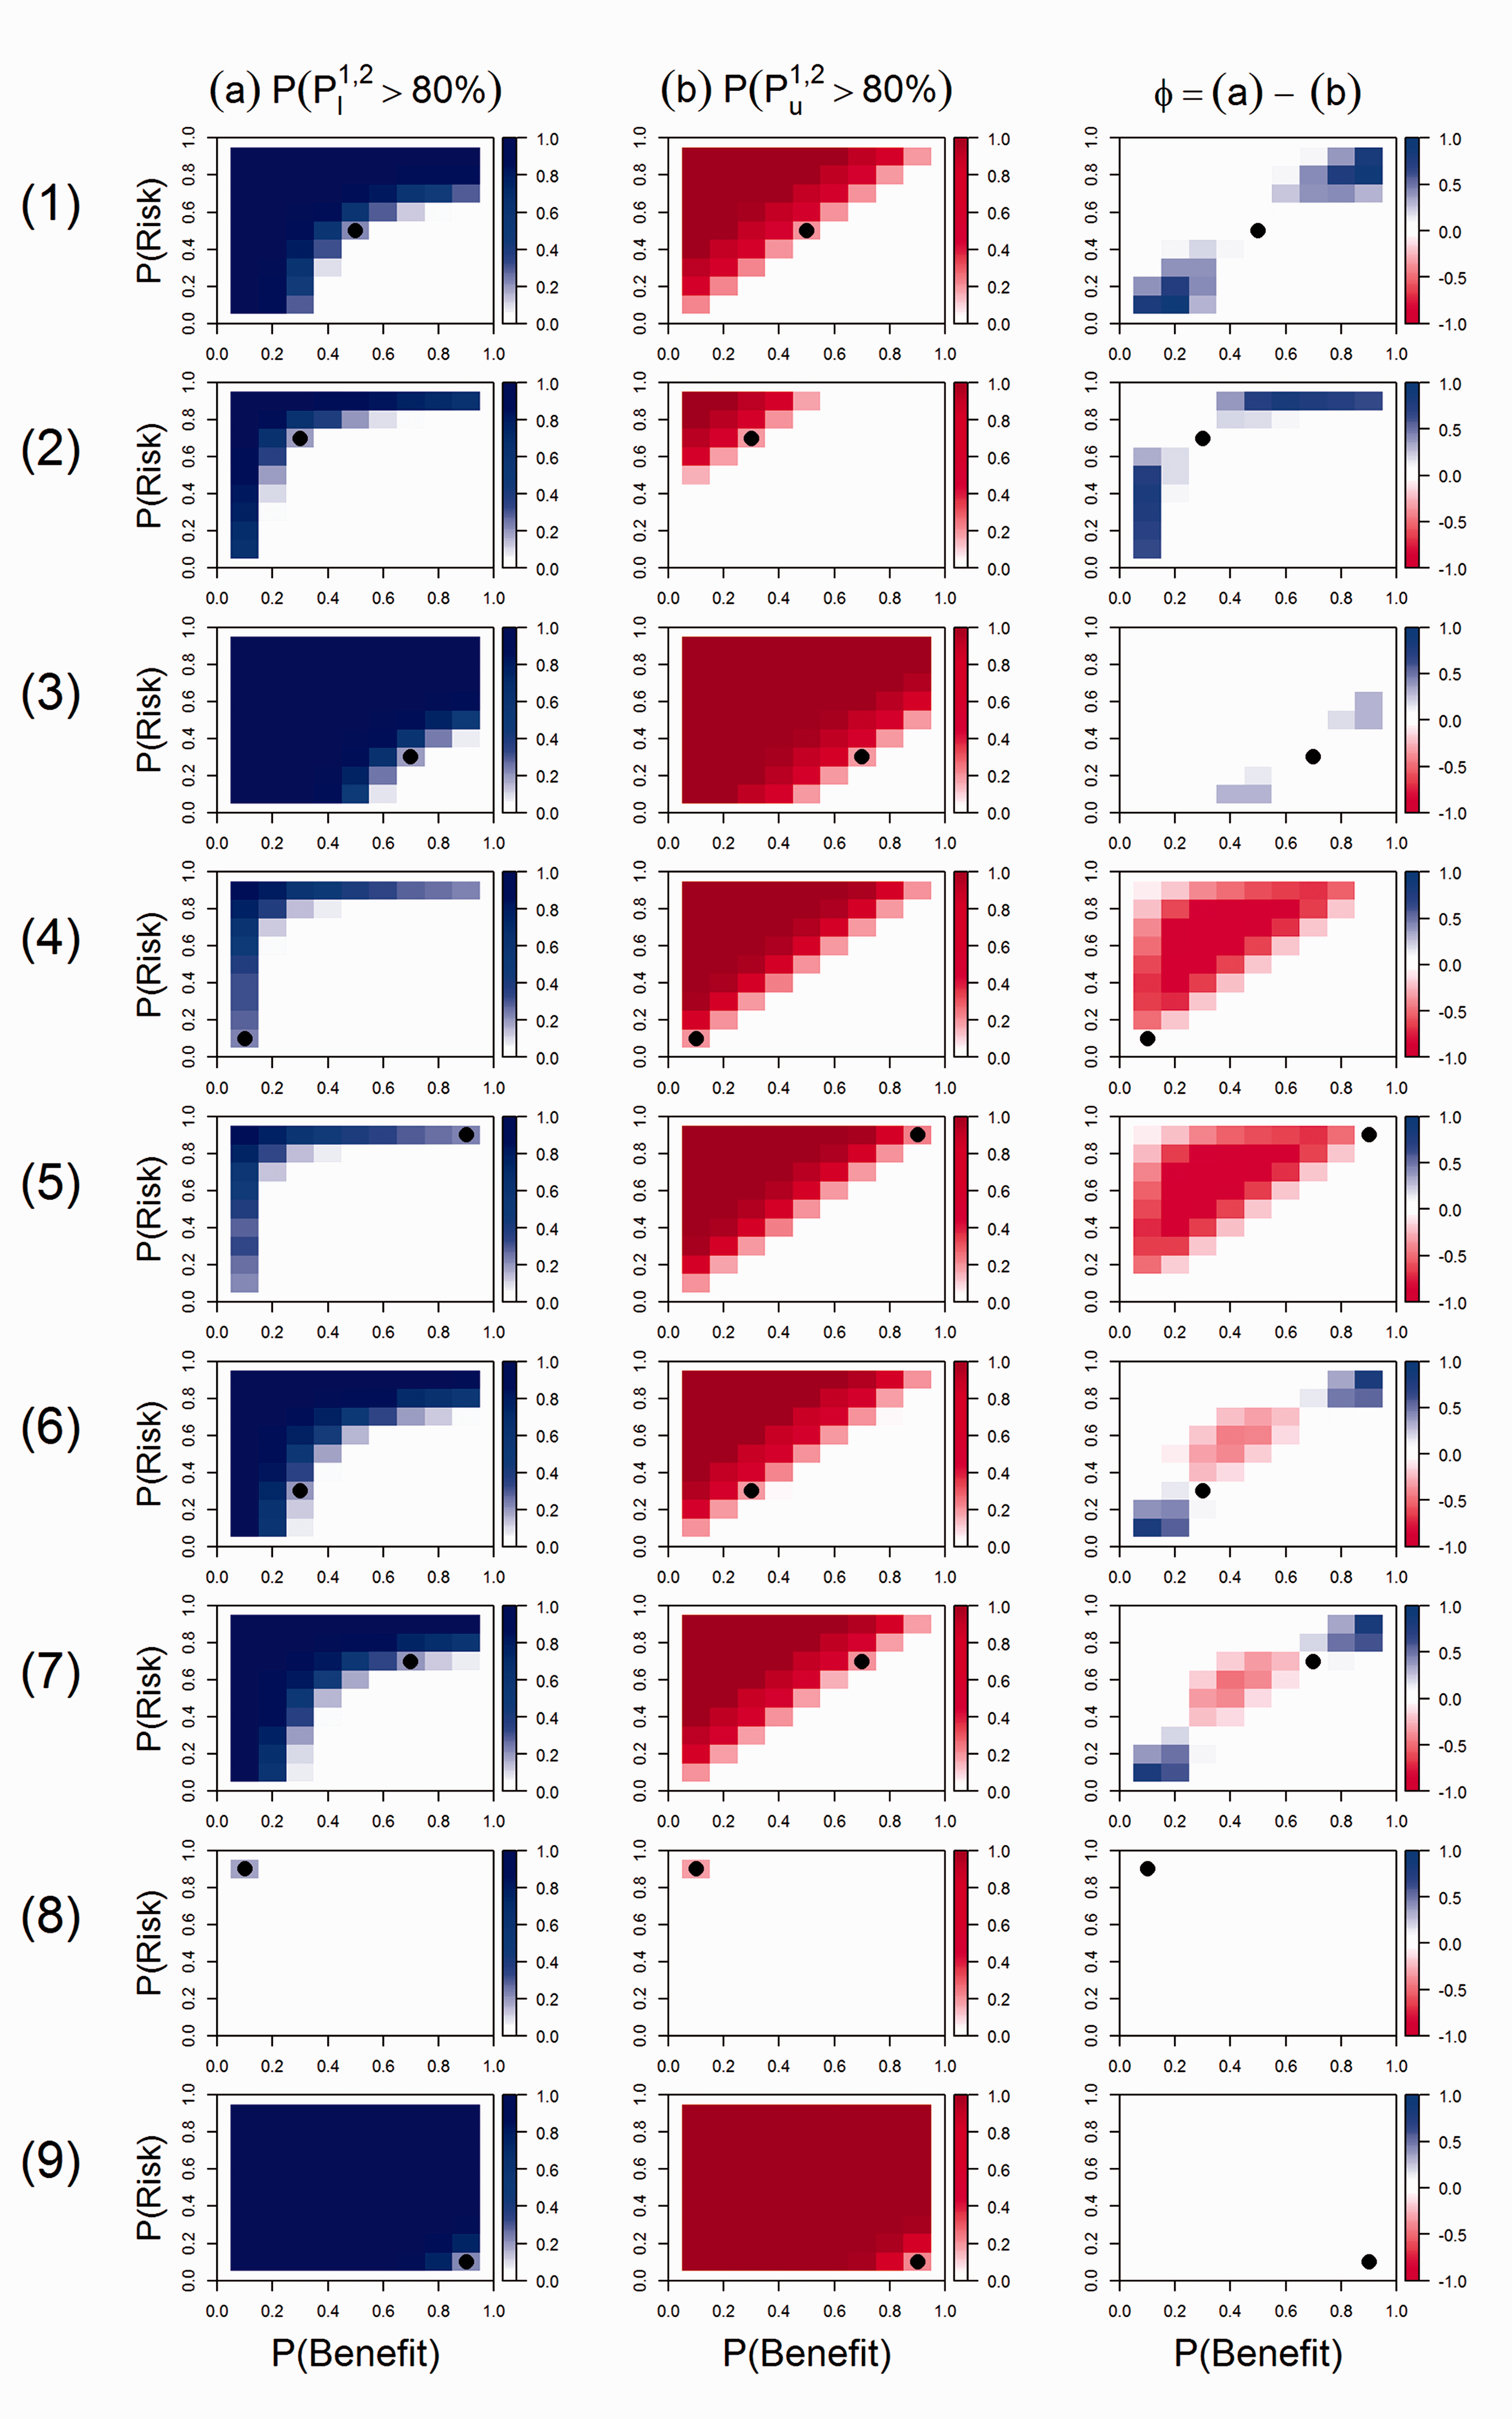
In scenario 1, the two measures are in agreement to recommend T1, which has moderate benefit and risk (
In scenario 4, T1 has almost no benefit nor risk, with
Scenarios 6 and 7 correspond to treatment T1 with either both low benefit and risk (
In all scenarios, both methods are in agreement to recommend T1 when it is indisputably better than T2, i.e. more effective and safer (or to recommend T2 when T1 is indisputably worse, i.e. less effective and more toxic, see Supplemental Material Figure S1). This is well illustrated in scenarios 8 (
Overall, both MCDA and SLoS have good performances to discriminate the benefit–risk balance of the treatments. They provide similar conclusions in many situations, and the cases where they differ highlight the two desirable properties of SLoS. Over all possible scenarios, SLoS recommends safer treatments than MCDA in half of the scenarios, and less safe treatments in the other half.
4.3 Sensitivity analyses
While the case of equally important and uncorrelated criteria is considered above, we investigated the robustness of the results in cases of:
Equally important criteria More weight on the risk criterion, using MCDA weights (w1, w2) = (0.25, 0.75) and mapped SLoS weights More weight on the risk criterion, with
The results of the sensitivity analyses are given in the Supplemental Material.
Both measures are robust to positive and negative correlations between the outcomes, with very similar results (Supplemental Material, Figures S2–S5). When an MCDA weight of 25% is given to the benefit, both measures penalise more the risk, but analogous differences and similarities as before could be observed between them (Supplemental Material, Figures S6–S7). Since the mapping is not far from an identity transformation, omitting it does not have a major impact on the results (Supplemental Material, Figures S8–S9).
A simulation study was also conducted with four criteria (two benefits j = 1, 2 and two risks j = 3, 4), for which the investigated scenarios are summarised in the Supplemental Material, Table S1, under the following assumptions:
Equally important criteria with weights Equally important criteria with weights More weight on the risk criteria, with MCDA weights More weight on the risk criteria, with
Similar conclusions could be drawn when comparing MCDA and SLoS using four criteria, even if the interpretation of the simulation scenarios is somewhat less straightforward as the amount of possible situations (low/moderate/high benefits and risks) increases (Supplemental Material, Figures S10-S19).
Overall, the conclusions are robust to correlations, number of criteria, weighting and weight mapping for both measures.
5 Discussion
In this paper, we propose SLoS as a new tool for drug benefit–risk assessment. It offers the same advantages as MCDA to summarise the benefit–risk balance of the treatments in a single measure, but it has additional desirable properties permitting to avoid recommendations of non-effective or extremely unsafe treatments, and to tolerate larger increases in risk for a given increase in benefit when the amount of benefit is small than when it is high. In contrast, we have shown that the linear form of the MCDA utility score involves implicit assumptions of the decision-makers, such as a constant benefit–risk trade-off for all values of benefit or risk, and might lead to counter-intuitive conclusions. It is worth noting that these additive and linear properties were shown to be inadequate in other application areas of MCDA,21,22 and its limitations in the health domain have been highlighted as well.27,28
The independence of the benefit and risk criteria is usually assumed for the sake of simplicity. Correlations could be taken into account in the analyses; however, our simulation study shows that both measures are robust to correlations between outcomes.
Importantly, SLoS penalises drugs with no efficacy, which is sensible for comparisons between active treatments. Indeed, a ‘no treatment/placebo’ option, in the absence of placebo effect, will most likely be strongly penalised by SLoS due to its lack of efficacy, although it may be preferable to any active treatment with a small amount of efficacy but that causes more harm overall. Therefore, MCDA’s recommendations may be more reliable in such cases and this should be carefully considered before choosing the method and when interpreting the results. However, the area of application of SLoS remains large, as many drug comparisons involve a standard of care, or a placebo with expected effects that are non-negligible. 52
The MCDA weights of the criteria should be elicited according to the preferences of the decision-makers (regulators, experts, patients, etc.) and methods have been proposed in the literature for this purpose.11,12,16,42,44,45,47,48 We propose a simple mapping to obtain SLoS weights from MCDA weights, so that the same elicitation process could be followed while preserving the weight interpretation. It should be noted that the mapping is not far from an identity transformation, and omitting it does not strongly affect the results. We considered in this paper fixed weights, but extended models have been proposed where the weights are treated as random variables to account for an uncertainty in their assignments.23,26
As an aggregation method involving multiple criteria, SLoS could be included within the family of non-linear MCDA models. It was shown that SLoS has the desirable properties even under the linear partial value functions on which this work has focused only. An alternative approach between linear MCDA and SLoS could be to handle the decreasing level of risk tolerance relative to benefits by varying the shape of the partial value functions. For instance, one can derive linearly-weighted partial value functions used in the linear utility score which exhibit the same degree of decreasing risk tolerance as SLoS. This, however, seems to be non-trivial and requires extensive attention. Furthermore, as stated above, the explicit elicitation of non-linear forms for partial value functions may be difficult for project teams. The weight elicitation and their interpretation appear also more challenging, in particular if the shapes of the partial value functions are different from one criterion to another. Meanwhile, an exploration of the use of non-linear partial value functions both in the framework of the additive utility score and SLoS is of great practical interest and is to be investigated.
In many cases, SLoS and MCDA provide similar conclusions, but SLoS shows clear advantages when treatments have no benefit or extreme risk. In general, this situation may occur in early stage drug developments, or at least before the time of marketing authorisation application, since treatments with no evidence of efficacy or high toxicities usually do not reach this point and are stopped before. Until now, benefit–risk assessments were mainly conducted in late stage by the sponsor and/or regulatory agencies, but it is recommended to initiate the benefit–risk assessment earlier in order to better support internal decisions and discussions with health authorities about the development strategy. 41 Therefore, SLoS could be used in early development, and then updated during the following phases and the regulatory process until post-marketing surveillance, in order to ensure a transparent and consistent benefit–risk assessment throughout the drug life-cycle.
Supplemental Material
Supplemental material for A novel measure of drug benefit–risk assessment based on Scale Loss Score
Supplemental Material for A novel measure of drug benefit–risk assessment based on Scale Loss Score by Gaelle Saint-Hilary, Veronique Robert, Mauro Gasparini, Thomas Jaki and Pavel Mozgunov in Statistical Methods in Medical Research
Footnotes
Acknowledgements
The authors would like to thank both reviewers and the editor for insightful comments and suggestions that helped to improve the original work significantly. Veronique Robert is an employee of Institut de Recherches Internationales Servier (IRIS). The views expressed in this publication are those of the authors and not necessarily those of the National Health Service, the National Institute for Health Research or the Department of Health.
Declaration of conflicting interests
The author(s) declared no potential conflicts of interest with respect to the research, authorship, and/or publication of this article.
Funding
The author(s) disclosed receipt of the following financial support for the research, authorship, and/or publication of this article: Gaelle Saint-Hilary’s research is supported by the Institut de Recherches Internationales Servier (IRIS). Pavel Mozgunov, Thomas Jaki and Mauro Gasparini have received funding from the European Union Horizon 2020 research and innovation programme under the Marie Sklodowska-Curie grant agreement No 633567. Thomas Jaki’s contribution arises in part from his Senior Research Fellowship (NIHR-SRF-2015-08-001) supported by the National Institute for Health Research.
Supplemental material
Supplemental material for this article is available online.
References
Supplementary Material
Please find the following supplemental material available below.
For Open Access articles published under a Creative Commons License, all supplemental material carries the same license as the article it is associated with.
For non-Open Access articles published, all supplemental material carries a non-exclusive license, and permission requests for re-use of supplemental material or any part of supplemental material shall be sent directly to the copyright owner as specified in the copyright notice associated with the article.