The integration of backfill cohorts into Phase I clinical trials has garnered increasing interest within the clinical community, particularly following the “Project Optimus” initiative by the U.S. Food and Drug Administration, as detailed in their final guidance of August 2024. This approach allows for the collection of additional clinical data to assess safety and activity before initiating trials that compare multiple dosages. For novel cancer treatments such as targeted therapies, immunotherapies, antibody-drug conjugates, and chimeric antigen receptor T-cell therapies, the efficacy of a drug may not necessarily increase with dose levels. Backfill strategies are especially beneficial as they enable the continuation of patient enrollment at lower doses while higher doses are being explored. We propose a robust Bayesian design framework that borrows information across dose levels without imposing stringent parametric assumptions on dose–response curves. This framework minimizes the risk of administering subtherapeutic doses by jointly evaluating toxicity and efficacy, and by effectively addressing the challenge of delayed outcomes. Simulation studies demonstrate that our design not only generates additional data for late stage studies but also enhances the accuracy of optimal dose selection, improves patient safety, reduces the number of patients receiving subtherapeutic doses, and shortens trial duration across various realistic trial settings.
The traditional phase I dose-finding paradigm, originally designed to identify the maximum tolerated dose (MTD) based on dose-limiting toxicity (DLT), operates under the ‘‘more-is-better” assumption that both efficacy and toxicity increase monotonically with dosage. However, this approach has proven less suitable for emerging treatments such as targeted therapies, immunotherapies, antibody-drug conjugates (ADCs), and chimeric antigen receptor (CAR) T-cell therapies.1–4 These novel therapies often exhibit non-monotonic efficacy responses, where effectiveness may plateau or even decrease at higher doses, displaying a bell-shaped dose-efficacy relationship.5,6 As a result, the MTD might deliver minimal efficacy benefits over lower doses while increasing adverse events (AEs).
Recently, the U.S. Food and Drug Administration (FDA) Oncology Center of Excellence initiated Project Optimus to reform the dose optimization and selection paradigm in oncology drug development.7 In support of this initiative, the FDA released and finalized guidance in August 2024, titled “Optimizing the Dosage of Human Prescription Drugs and Biological Products for the Treatment of Oncologic Diseases.”8 This guidance recommends dosage optimization for novel cancer treatments based on a comprehensive analysis of nonclinical and clinical data, including pharmacokinetics, pharmacodynamics, safety, tolerability, dosage convenience, and therapeutic activity, alongside dose- and exposure-response relationships. To achieve these recommendations, Project Optimus advocates for trials that compare multiple dosages to assess antitumor activity, safety, and tolerability, supporting the identification of optimal dosage(s). One effective strategy endorsed by the FDA involves the addition of dose-level cohorts or the expansion of existing cohorts (i.e. backfill cohorts) in dose-finding trials to gather more data for ongoing development assessments.
This backfill approach is particularly valuable in scenarios where efficacy does not necessarily increase with dose levels, often showing higher efficacy at doses below the MTD. Furthermore, traditional phase I trials typically require waiting for current dose-escalation cohorts to complete toxicity assessments before treating the next cohort. Adopting a backfill strategy allows new patients to be treated concurrently, enhancing dose-escalation coherence, minimizing accrual interruptions, and broadening patient access to investigational therapies. Dehbi et al.9 proposed methods to randomize backfill patients below the current study dose level using hypothesis testing within the continual reassessment method framework. Barnett et al.10 employing backfilling in a phase I trial on the estimation of the MTD and the duration of the study. Liu et al.11 proposed statistical design that allows simultaneous enrollment of a main cohort and a backfill cohort of patients in a dose-finding trial under the framework of probability of decisions. Zhao et al.12 proposed a simple and principled approach to incorporate backfilling into the Bayesian optimal interval design (BOIN). However, those dose-finding designs incorporating backfilling patients are primarily driven by toxicity, and dose-finding and optimization designs with backfill guided by both efficacy and toxicity outcomes have not been proposed with comprehensive evaluation.
Recent strategies suggest backfilling patients to dose levels where drug activity has been observed.9,10,12 However, novel treatments often present challenges, such as lengthy efficacy assessment windows and delayed effects for both toxicity and efficacy. For example, while the dose-escalation cohort might have sufficient outcome data to proceed to the next dose level, backfill patients, enrolled subsequently, may not have completed their evaluations. This discrepancy necessitates addressing issues like delayed outcomes, rapid accrual rates, and different assessment windows for toxicity and efficacy outcomes. Additionally, using pooled toxicity rates to manage excessive toxicity observed at lower doses has shown practical benefits,12 yet there remains a need for a formal statistical framework to effectively borrow information across dose levels. Furthermore, the necessity and feasibility of evaluating efficacy when allocating patients to open backfill dose levels are unclear. If deemed worthwhile, determining how to model various potential dose-efficacy relationships and deciding on an allocation method—such as equal randomization, adaptive randomization, or pick-the-winner—become critical considerations.
To bridge these gaps, this article proposes a fully sequential phase 1/2 design, or an efficacy-integrated dose optimization design,13 that allows backfilling at lower doses while the dose-escalation cohort explores higher levels. Our approach leverages the inherent dose–response relationship, employing a transformation approach to impose monotone or unimodal constraints on toxicity and efficacy. This method is robust, avoiding the drawbacks of parametric assumptions common in traditional models which are vulnerable to model misspecification. The proposed design, a robust Bayesian phase I/II dose optimization design with backfill and randomization (BF-BOD12), facilitates continuous monitoring of safety and efficacy outcomes while efficiently allocating backfill patients.
The remainder of this article is organized as follows: Section 2 introduces the dose outcome models for toxicity and efficacy, including approaches to account for pending data. Section 3 discusses the dose optimization framework that incorporates backfill and randomization strategies. Section 4 presents simulation studies to evaluate the operating characteristics of the BF-BOD12 design alongside alternative designs. Section 5 assesses the robustness of the design through sensitivity analysis. We conclude with a brief discussion in Section 6.
Dose outcome models
In this section, we introduce the dose-toxicity and dose-efficacy models employed to achieve dose optimization while backfilling patients with randomization. We assume toxicity and efficacy are independent given the fact that for small sample size early phase clinical trials, the correlation between toxicity and efficacy can be ignored with little impact on trial operating characteristics, and the consideration of reducing computational burden when incorporating incomplete outcomes when a backfill approach is considered.14,15 This validity of this assumption is also verified in Section 5.3.
Dose-toxicity model
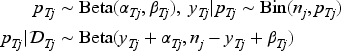
In an early phase clinical trial evaluating dose levels , we model the binary toxicity endpoints for each patient. These endpoints include dose-limiting toxicities (DLTs) or a dichotomized total toxicity burden, both scored by the Common Terminology Criteria for Adverse Events (CTCAE). For each dose , the binary toxicity outcome for the -th patient treated at that dose is denoted as , and the probability of observing a toxicity event at this dose is denoted as . Assuming a biologically meaningful non-decreasing relationship between dose and toxicity probability, we employ a beta-binomial model to handle the discrete nature of the data. Specifically, for each dose level , where patients are treated, we define as the total observed toxicities. Let represent the observed toxicity data at any time during the trial at dose , we model the toxicity data through beta-binomial model independently for each dose ,
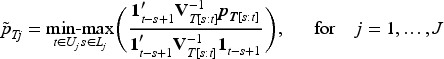
where and are hyperparameters that are often set as small values (e.g. 0.5 or 1) to obtain a vague prior, thus allowing the observed data to predominantly shape the posterior. To enforce the nondecreasing dose–toxicity relationship across dose levels and facilitate inference from to , where and , we adopt a transformation strategy for the posterior draws. This strategy involves mapping unrestricted posterior draws of to the restricted parameter space using a minimal distance mapping. We employ a modified version of the isotonic regression transformation, utilizing the pool-adjacent-violators algorithm (PAVA) with weights defined as the reciprocals of the posterior variances of for .16
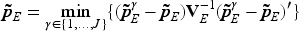
Specifically, the following min-max formula17,18 is used to transforming draws from the posterior density for the unrestricted toxicity probability parameters:
where is the unconstrained posterior covariance and and denote subsets of such that the ordering is known for all and the ordering for all . The subscript indicates the submatrices and subvectors corresponding to elements . This approach aligns with Dunson and Neelon16 that transformed posterior samples represent an order-restricted functional of the unconstrained parameters. Therefore, these post-processed draws can be viewed as originating from a Bayesian posterior distribution. This method of imposing order constraints not only adheres to the expected pharmacological dose–response relationship but also facilitates borrowing information across doses in a nonparametric manner.
Dose-efficacy model
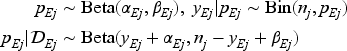
We consider binary efficacy endpoints, such as objective response and efficacy surrogate endpoints, for each treated patient. For each dose level , let denote the binary efficacy outcome for the -th patient treated at that dose, and represent the probability of observing an efficacy event at that dose. We record the total number of patients treated at dose as , and the sum of observed efficacy events among these patients as . The collected efficacy data is denoted as for each dose . The efficacy probability is modeled independently for each dose as follows:
where and are hyperparameters. For novel anti-cancer agents, the dose-efficacy relationship often presents a significant challenge due to its potentially complex nature, which may include non-monotonic umbrella-shaped or plateaued relationships. Given this complexity, our analytical focus shifts towards an order-constrained parameter set, , derived from a transformation of the unconstrained posterior samples, , from to a subset . This subset is defined through a series of inequalities imposed on the elements of such that , encompassing different possible orderings across the dose levels:
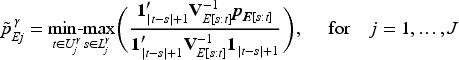
When the peak occurs at or , the model simplifies to a straightforward nonincreasing or nondecreasing dose–efficacy relationship, respectively. The support of the constrained parameters is, therefore, following an umbrella or plateaued ordering with peak location . Following Barlow17 and Gunn and Dunson,19 by enumerating the location of the unknown peak , unimodal isotonic regressions with reciprocal of the posterior variances as weights is performed at posterior draws of , and we choose the transformed draws by minimizing the distance measure across different possible choices of peak .
Here we present more details. Assuming a peak at , the following min-max formula is used to transforming draws from the posterior density for the unrestricted efficacy probability parameters,
where is the unconstrained posterior covariance and and denote subsets of such that the ordering is known for all and the ordering for all . The subscript indicates the submatrices and subvectors corresponding to elements . Then the known assumption of is relaxed due to the fact that under investiated doses are limited and prespecified, we choose by minimizing the Mahalanobis distance measure across all the possible locations of :
Similarly, as these transformed posterior samples remain order-restricted functionals of the original, unconstrained parameters, they can be considered valid draws from a Bayesian posterior. Gunn and Dunson19 showed several theoretical properties for the transformation approach in Bayesian inference. One particular important feature is that the posterior tends to be centered close to the constrained estimator when the information in the prior is small relative to the sample size even when the sample size is small to moderate. This feature is especially valuable in early phase clinical trials, where sample sizes are limited and prior knowledge about the test compound may be scarce, allowing for effective inference by incorporating order constraints to borrow information. The estimation and inference for toxicity and efficacy are based on the transformed posterior draws in both dose-escalation and backfilling cohorts.
Likelihood with pending data
In Sections 2.1 and 2.2, we described how completely observed toxicity and efficacy data are used to generate and transform posterior distributions for dose-finding and backfill purposes. However, challenges arise in scenarios such as rapid accrual rates, late-onset of toxicity and efficacy, or incomplete evaluations in backfill cohorts when the dose-escalation cohort has already provided sufficient information for decision-making at a given time point . Under these circumstances, not all toxicity and efficacy outcomes are fully observed, complicating the inference process. To effectively utilize the partial information available and facilitate timely decision-making, we adopt likelihood approximation methods as detailed by Lin and Yuan.15 These methods allow for the integration of pending outcomes into the analysis by approximating these outcomes with a standard binomial likelihood.
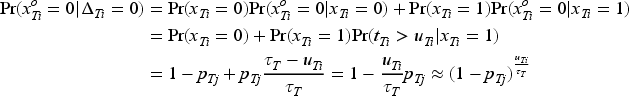
We take toxicity as an example and denote the observed toxicity outcomes for patients at dose level by , where . These outcomes indicate whether a patient has experienced a toxicity event () or not () by the decision time . It is important to note that while an observed outcome of definitively implies , an observed outcome of does not confirm the absence of toxicity, as could still be 1 if the toxicity event occurs after . We introduce the indicator to represent whether the toxicity outcome for patient has been fully ascertained () or remains pending () as of the decision time. Furthermore, we define as the actual follow-up time for patient up to the decision time , and as the time to the event of toxicity. The length of the assessment window for determining toxicity is denoted by . Therefore, by assuming the time-to-event is uniformly distributed over the assessment window recommend by Cheung and Chappell20 and performing the Taylor expansion,15 for a patient with pending toxicity data (i.e. ) at dose , the likelihood is given by the following equation:
Thus, by taking into account those with ascertained toxicity outcomes, given the observed interim toxicity data , the joint likelihood function is given by the following equation:
where is the ascertained toxicity outcomes at dose by the time , and is the “effective” sample size for toxicity used to accommodate the incomplete follow-up period at dose . In other words, the “effective” sample size represents at dose , total number of patients with ascertained toxicity total follow-up time for patients with pending toxicity/ length of toxicity assessment window. Therefore, with “effective” binomial toxicity data , the previous beta-binomial models can still be used as , as well as the post-processing transformation for Bayesian inference on order-constrained parameters. The efficacy pending data can be accommodated in a similar way, and the details can be found in the Supplemental Material.
Dose optimization design with backfill and randomization
Dose-escalation algorithm
At the beginning of the trial, the posterior estimates for toxicity and efficacy probabilities are typically unreliable due to the limited amount of initial data. Moreover, delayed outcomes present an even greater concern, as it is possible that none of the toxicity or efficacy outcomes are observed in the early stages of the trial. To gather enough information for estimating model parameters and ensure patients’ safety, we implement the following start-up phase.21–23 The first cohort of patients is treated at the lowest dose, and in the absence of observed toxicity, dose-escalation proceeds to the second dose level for the subsequent cohort. This process of escalating doses continues until the occurrence of the first toxicity event in the trial, or until the highest planned dose level is reached. Upon meeting either of these conditions, the start-up phase concludes, and the trial transitions into the model-based dose-finding phase.
Upon transitioning to the model-based dose-finding phase of the trial, we define as the current dose level being administered to the dose-escalation cohort, and denote the dose level whose posterior estimate of is closest to the target toxicity probability , that is, .
If , the candidate dose level for the next dose-escalation cohort is .
If , the candidate dose level for the next dose-escalation cohort is .
If , the candidate dose level for the next dose-escalation cohort is .
Repeat the above dose finding algoritm for dose-escalation until (1) terminating the trial early if , where , and represents the observed toxicity data at dose , which can be either complete or partial ; (2) reaching the prespecified the total number of patients in the dose-escalation cohort , or (3) the number of patients in the dose-escalation and backfill cohorts at current dose level reaches the maximum number of patients at a dose level and the same dose level is recommended.
In conventional phase I/II dose-escalation studies, the initiation of enrollment for a new cohort typically awaits the completion of toxicity and efficacy assessments for all patients in the current cohort. However, in scenarios where the assessment window for these outcomes extends significantly, and patient accrual progresses more rapidly than outcome evaluations, traditional methods may unduly prolong the trial duration. To address this issue and maintain trial efficiency while ensuring the collection of adequate toxicity and efficacy data, we have implemented a dose suspension rule. This rule stipulates that administration of the next dose level to the incoming dose-escalation cohort is contingent upon the completion of toxicity and efficacy assessments for at least 50% of the patients at the current dose level . Even in the start-up phase, where all patients in the dose-escalation cohort must complete their toxicity assessments before enrolling the next cohort, we still require that at least 50% of efficacy assessments be completed at the current dose level. This approach allows for accelerated patient accrual and a reduction in overall trial duration,15,24,25 without compromising the ethics and safety of the both the dose-escalation and backfilling processes.
Backfilling
In our proposed design, the dose-escalation cohort initially prioritizes the enrollment of patients to investigate higher dose levels. This is followed by a backfill cohort, which enrolls patients at previously tested lower doses that have been deemed safe and efficacious. Specifically, an available patient is allocated to the dose-escalation cohort if the current dose level has not been fulfilled with its planned cohort size. Otherwise, the patient is assigned to one of the doses open for backfilling until a decision can be made regarding the next dose-escalation cohort. We employ an adaptive strategy to identify the admissible set of doses for backfilling. Moreover, if multiple dose levels qualify, we implement randomization to allocate patients among these eligible backfill doses. This approach not only ensures that patient safety is maintained by utilizing doses already established as tolerable but also maximizes the efficiency of the dose exploration process by filling gaps in data from lower, yet promising, dose levels.
Let denote the minimum efficacy probability specified by the investigators, and we define the admissible set for efficacy , where , and represents the observed efficacy data at dose , which can be either complete or partial . For toxicity, the admissible set, , is defined as: , then the overall admissible set for backfill is , accommodating both safety and efficacy considerations. Take an example of toxicity, additional toxicity events observed at lower doses during backfill could suggest that these doses are not as safe as initially determined. BF-BOIN relies on pooled adjacent toxicity data to borrow information and account for small sample size.12 To address this issue, for our proposed dose-toxicity model with post-processing that inherently dynamically borrows information across doses, instead of making the to be only , we use the same overdose probability cutoff to address the potential toxicity data conflicts. The backfill cohort is assigned to the admissible doses, each with an equal probability for equal randomization following the spirit of “Project Optimus.”8 Both and the admissible set for backfill are dynamically updated based on the latest observed data. This allows doses previously deemed inadmissible to become eligible for backfill as new data accumulate and integrate those additional data into decisions for dose-escalation cohorts. This dynamic adjustment is facilitated by our proposed dose-toxicity and dose-efficacy models, which effectively borrow information across dose levels with order constraints. We assume that when the dose-escalation ends, the backfilling by definition also ends.
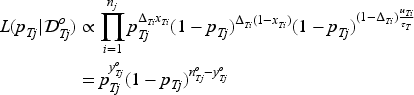
Optimal dose (OD) selection
We consider using utility as a measure of efficacy-toxicity trade-off to guide OD selection.26,27 This approach converts the bivariate outcomes of toxicity and efficacy into a one-dimensional utility value. The utility score, , corresponds to one of four possible outcomes: (no toxicity and no efficacy) , (no toxicity and efficacy) , (toxicity and no efficacy) , and (toxicity and efficacy) . The scores for and set the bounds of utility, with the most favorable outcome (no toxicity with efficacy) assigned the highest value and the least favorable (toxicity without efficacy) the lowest. Clinician input is essential to establish and , ensuring they reflect clinical priorities and the desirability of each outcome. Each dose’s mean true mean utility, , is then calculated as , with denoting the probability of each outcome at dose . Assuming independence between toxicity and efficacy, the estimated mean utility for each dose is derived as follows:
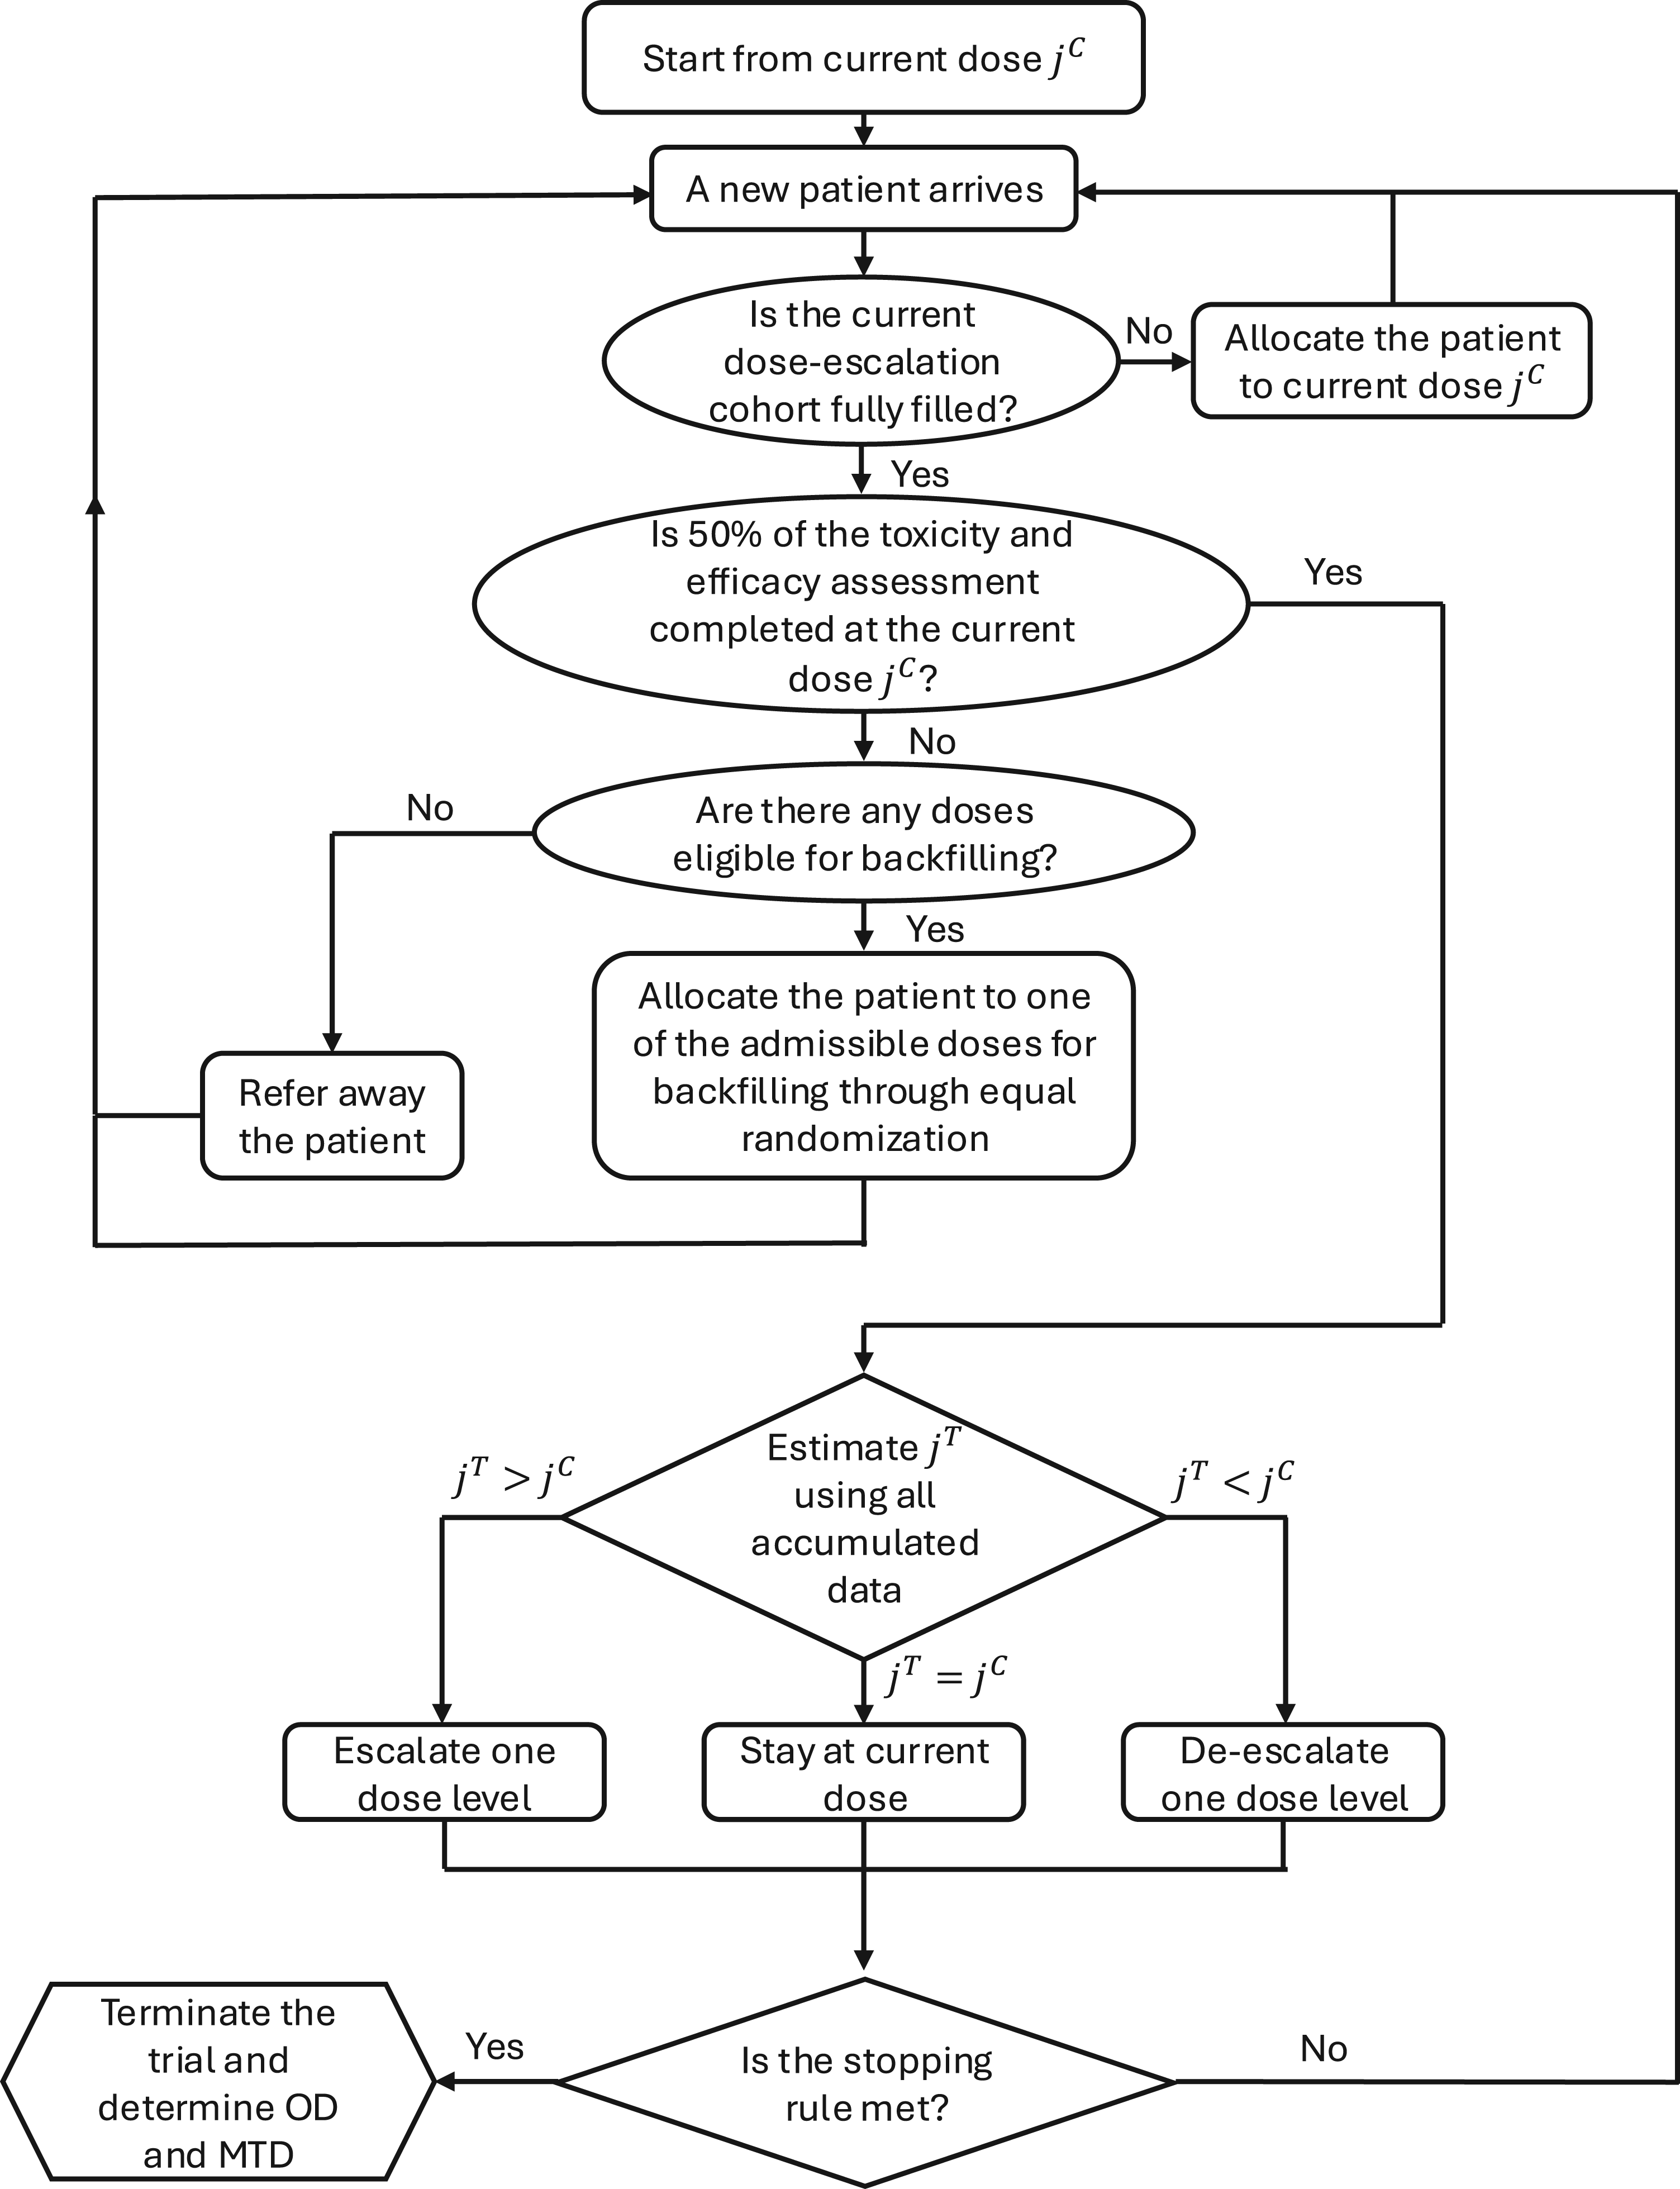
To this end, the OD is defined as the dose that maximizes the mean utility while ensuring safety and efficacy. At the end of the trial, we identify the final MTD as , and select the OD as . When there is a tie, the lower dose level is selected. The trial schema is illustrated in Figure 1 (model-based phase) and Supplemental Figure S4 (start-up phase), and the software for implementing this method, BF-BOD12, will be available at https://github.com/FrankQiu20/.
Flowchart of Bayesian phase I/II dose optimization design with backfill and randomization (BF-BOD12) design (model-based phase).
Simulation study
Simulation configuration
We conducted a comprehensive simulation study to evaluate the operating characteristics of the proposed BF-BOD12 design in comparison with the TITE-BOIN12.28 Specifically, we investigated three variants of the BF-BOD12 design: the standard implementation (BF-BOD12), a fully backfilling variant (BF-BOD12) as suggested by Barnett et al.,10 which considers all doses deemed safe for backfilling irrespective of efficacy signals until the end of the trial for OD selection, and a conservative variant (BF-BOD12) that requires fully observed outcomes without implementing a suspension rule.
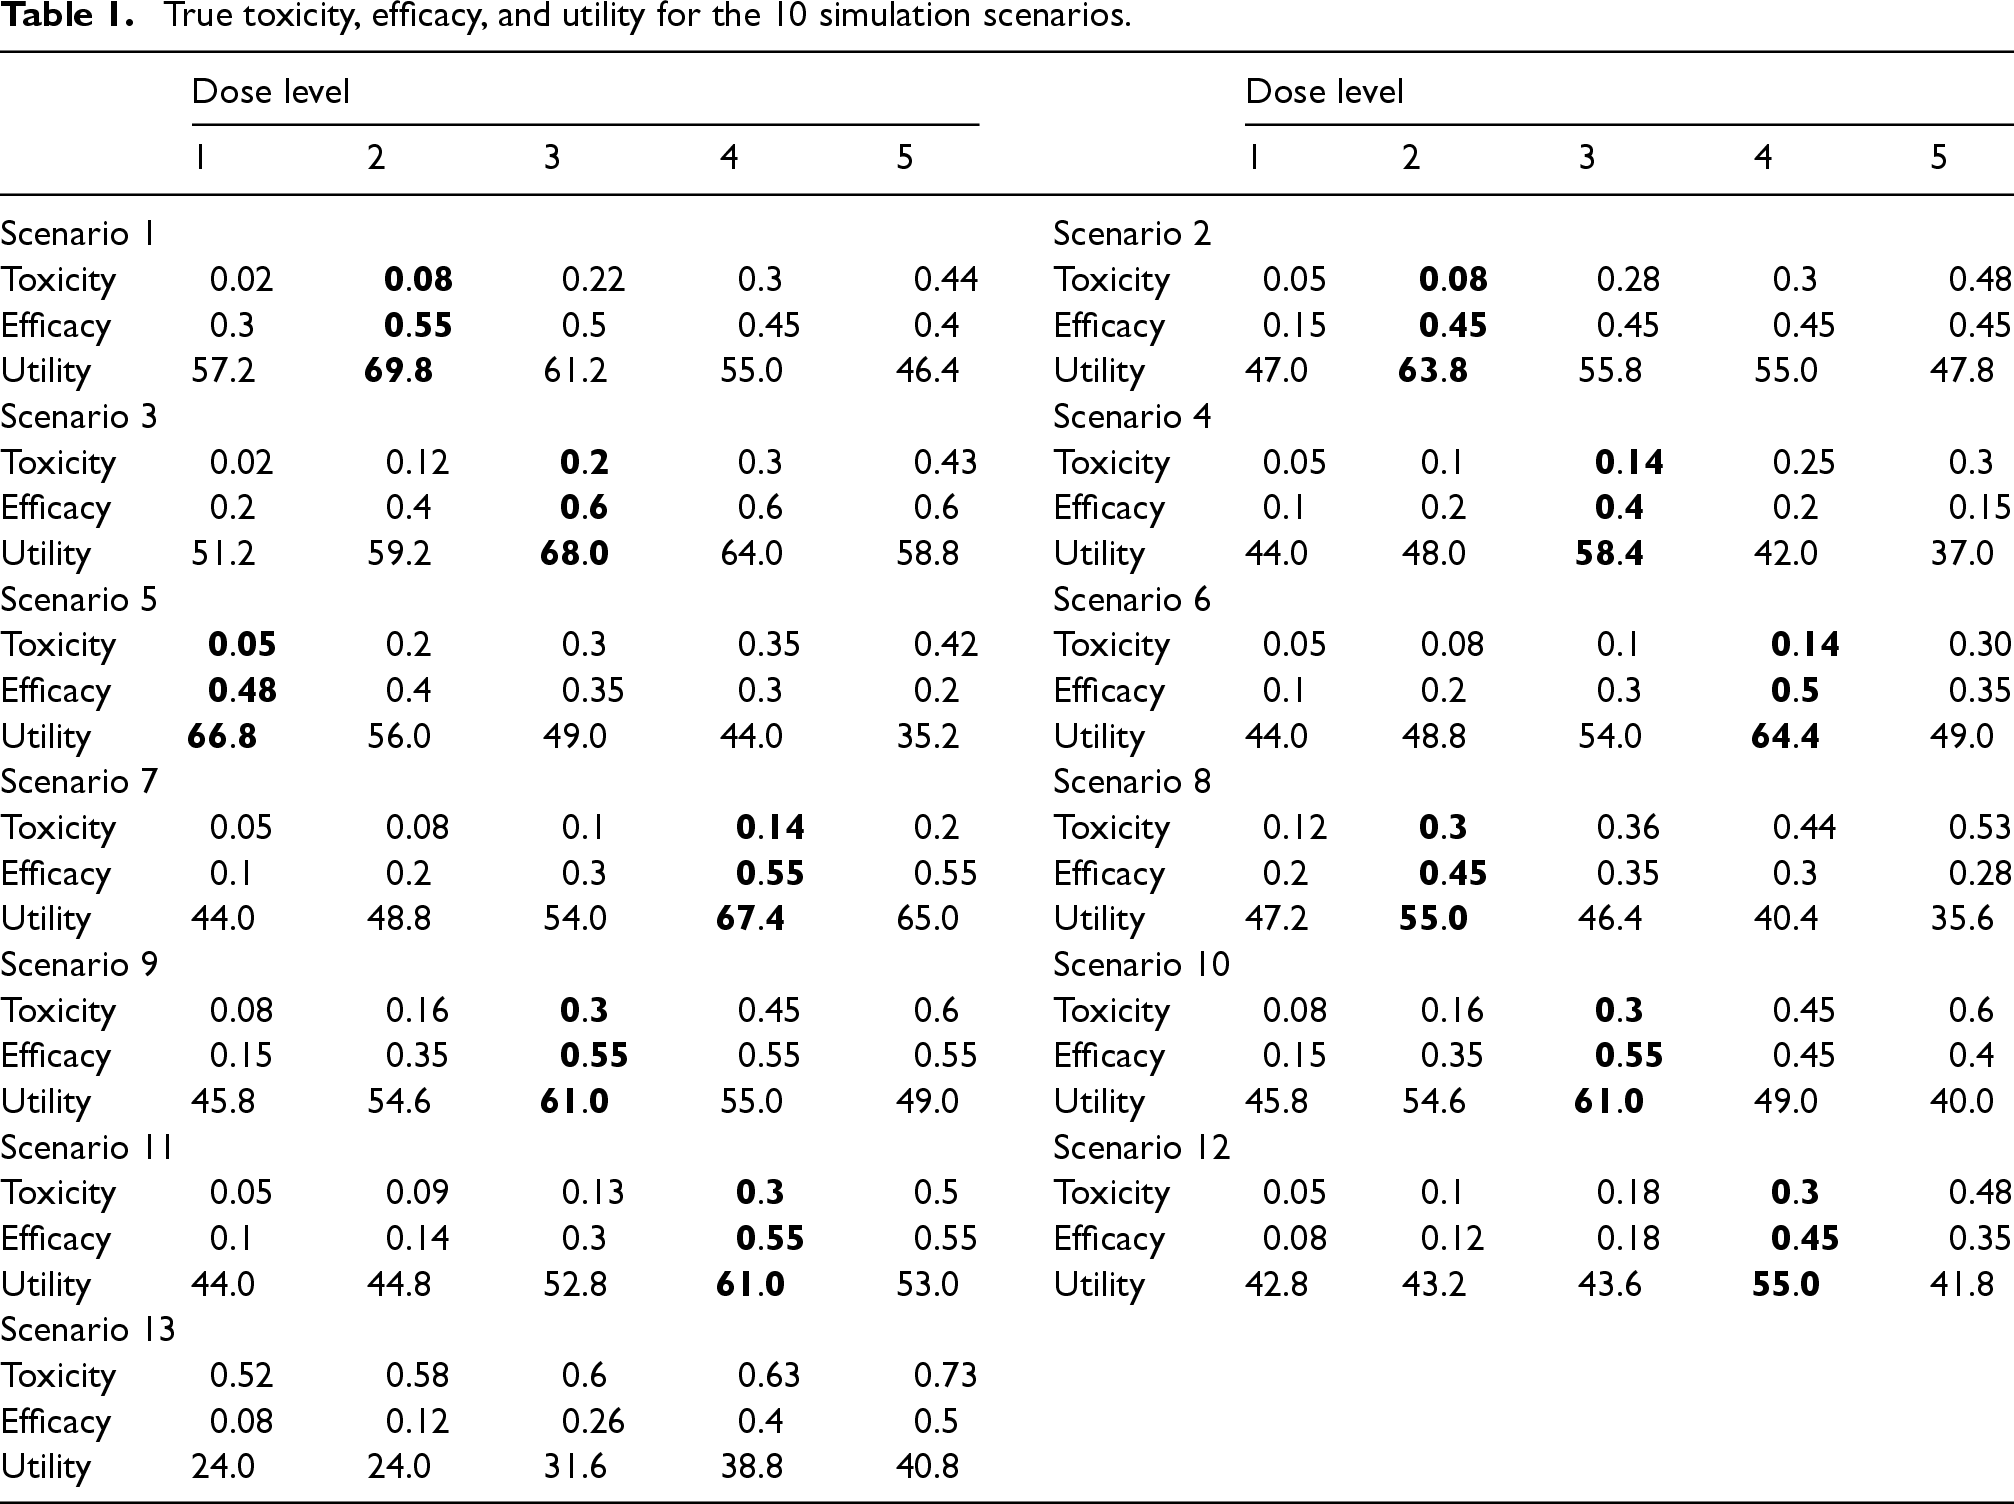
The target toxicity probability was established at , and the lower bound for the efficacy probability was set to . We set . We also specified the values and based on preliminary simulation studies that calibrated Bayesian design parameters. The maximum number of patients for dose-escalation was with the cohort size of 3, and the maximum number of patients at any dose level was . The utility values were set as follows: , , , and . The assessment windows for toxicity and efficacy were 1 month and 3 months, respectively, and the patient accrual rate was set at 3 per month, following an exponential distribution. The time-to-toxicity and efficacy outcomes were simulated from a Weibull distribution with parameters chosen to match the toxicity and efficacy probability in Table 1, with 50% of events occurring in the latter half of the assessment window.
True toxicity, efficacy, and utility for the 10 simulation scenarios.
Dose level
Dose level
1
2
3
4
5
1
2
3
4
5
Scenario 1
Scenario 2
Toxicity
0.02
0.08
0.22
0.3
0.44
Toxicity
0.05
0.08
0.28
0.3
0.48
Efficacy
0.3
0.55
0.5
0.45
0.4
Efficacy
0.15
0.45
0.45
0.45
0.45
Utility
57.2
69.8
61.2
55.0
46.4
Utility
47.0
63.8
55.8
55.0
47.8
Scenario 3
Scenario 4
Toxicity
0.02
0.12
0.2
0.3
0.43
Toxicity
0.05
0.1
0.14
0.25
0.3
Efficacy
0.2
0.4
0.6
0.6
0.6
Efficacy
0.1
0.2
0.4
0.2
0.15
Utility
51.2
59.2
68.0
64.0
58.8
Utility
44.0
48.0
58.4
42.0
37.0
Scenario 5
Scenario 6
Toxicity
0.05
0.2
0.3
0.35
0.42
Toxicity
0.05
0.08
0.1
0.14
0.30
Efficacy
0.48
0.4
0.35
0.3
0.2
Efficacy
0.1
0.2
0.3
0.5
0.35
Utility
66.8
56.0
49.0
44.0
35.2
Utility
44.0
48.8
54.0
64.4
49.0
Scenario 7
Scenario 8
Toxicity
0.05
0.08
0.1
0.14
0.2
Toxicity
0.12
0.3
0.36
0.44
0.53
Efficacy
0.1
0.2
0.3
0.55
0.55
Efficacy
0.2
0.45
0.35
0.3
0.28
Utility
44.0
48.8
54.0
67.4
65.0
Utility
47.2
55.0
46.4
40.4
35.6
Scenario 9
Scenario 10
Toxicity
0.08
0.16
0.3
0.45
0.6
Toxicity
0.08
0.16
0.3
0.45
0.6
Efficacy
0.15
0.35
0.55
0.55
0.55
Efficacy
0.15
0.35
0.55
0.45
0.4
Utility
45.8
54.6
61.0
55.0
49.0
Utility
45.8
54.6
61.0
49.0
40.0
Scenario 11
Scenario 12
Toxicity
0.05
0.09
0.13
0.3
0.5
Toxicity
0.05
0.1
0.18
0.3
0.48
Efficacy
0.1
0.14
0.3
0.55
0.55
Efficacy
0.08
0.12
0.18
0.45
0.35
Utility
44.0
44.8
52.8
61.0
53.0
Utility
42.8
43.2
43.6
55.0
41.8
Scenario 13
Toxicity
0.52
0.58
0.6
0.63
0.73
Efficacy
0.08
0.12
0.26
0.4
0.5
Utility
24.0
24.0
31.6
38.8
40.8
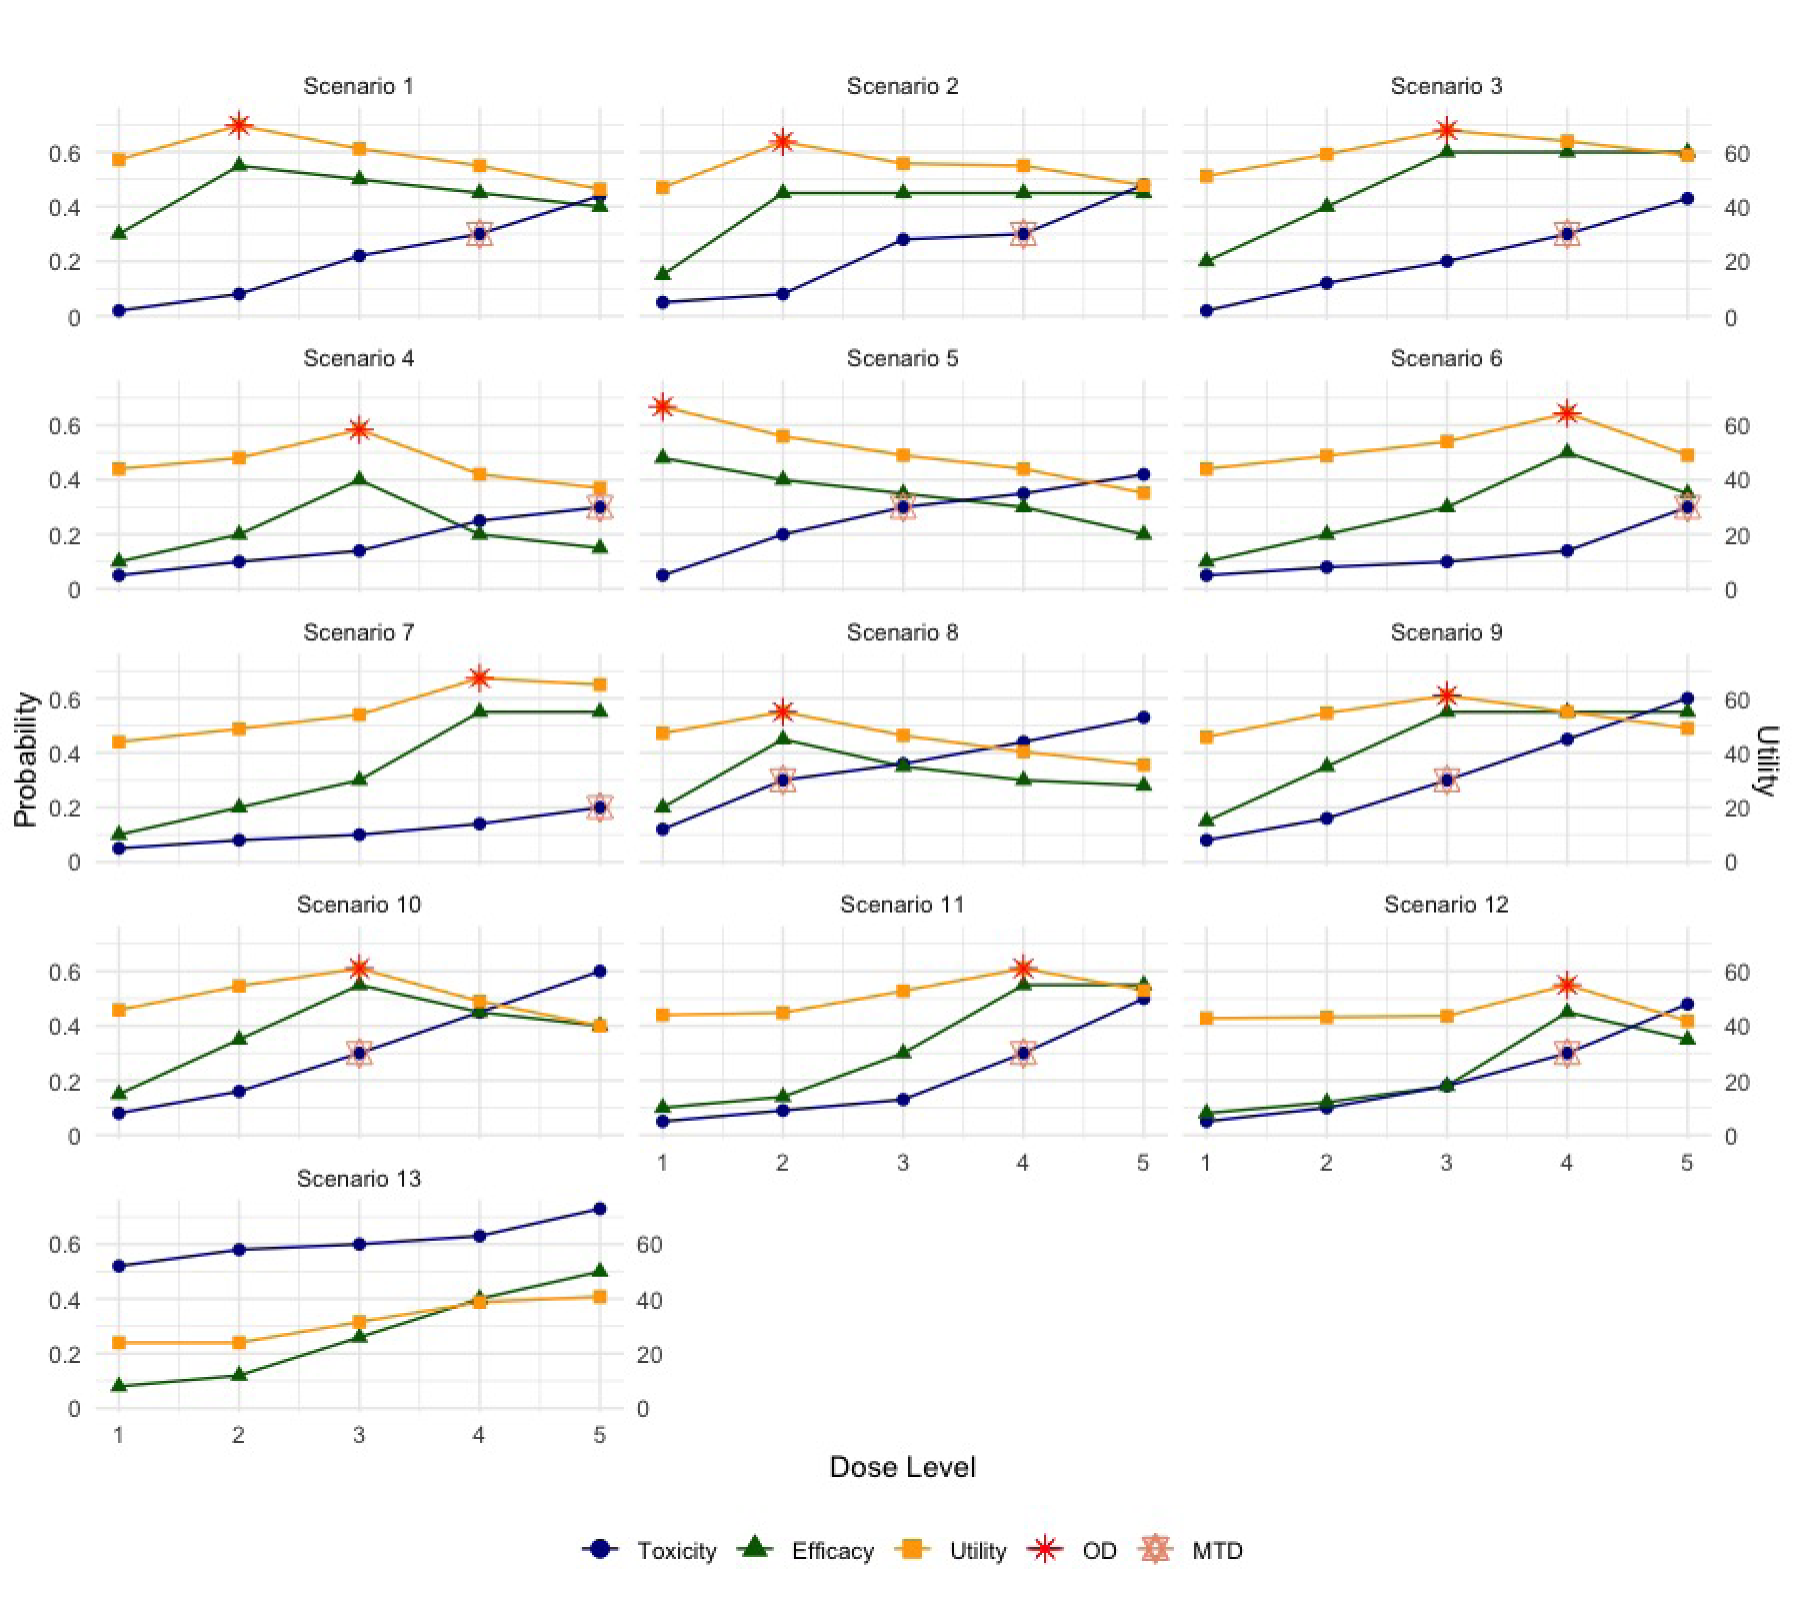
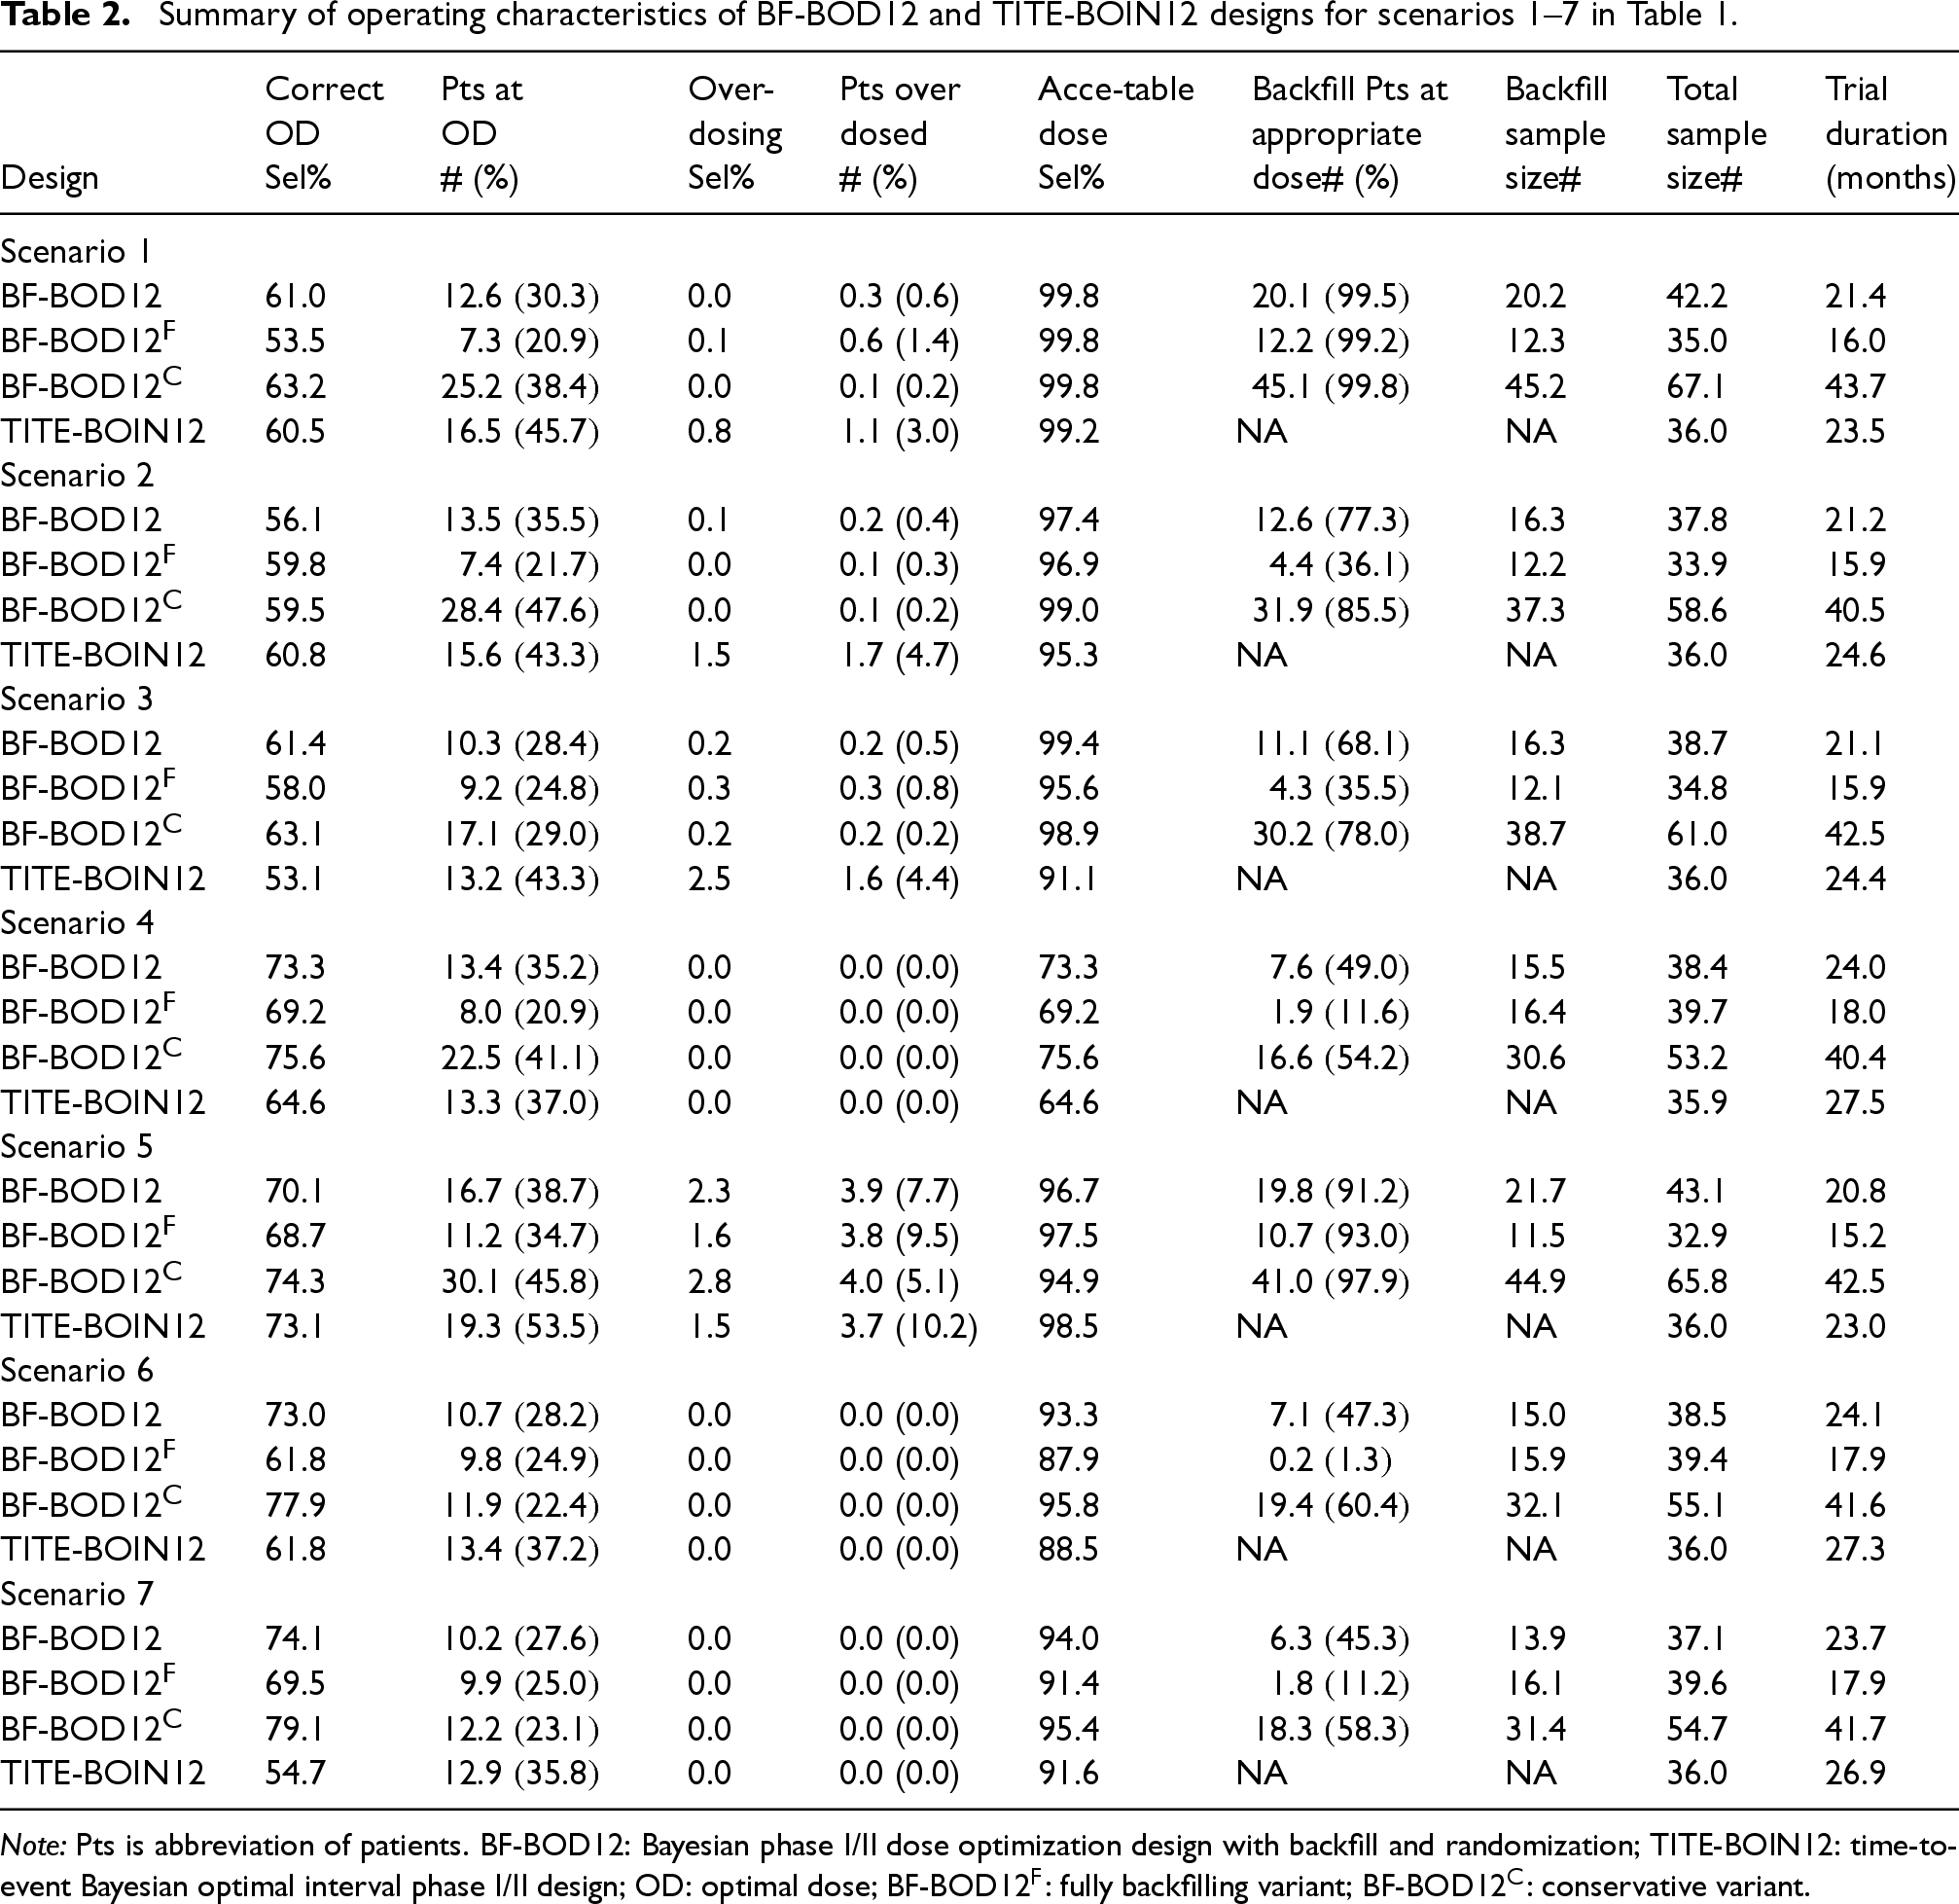
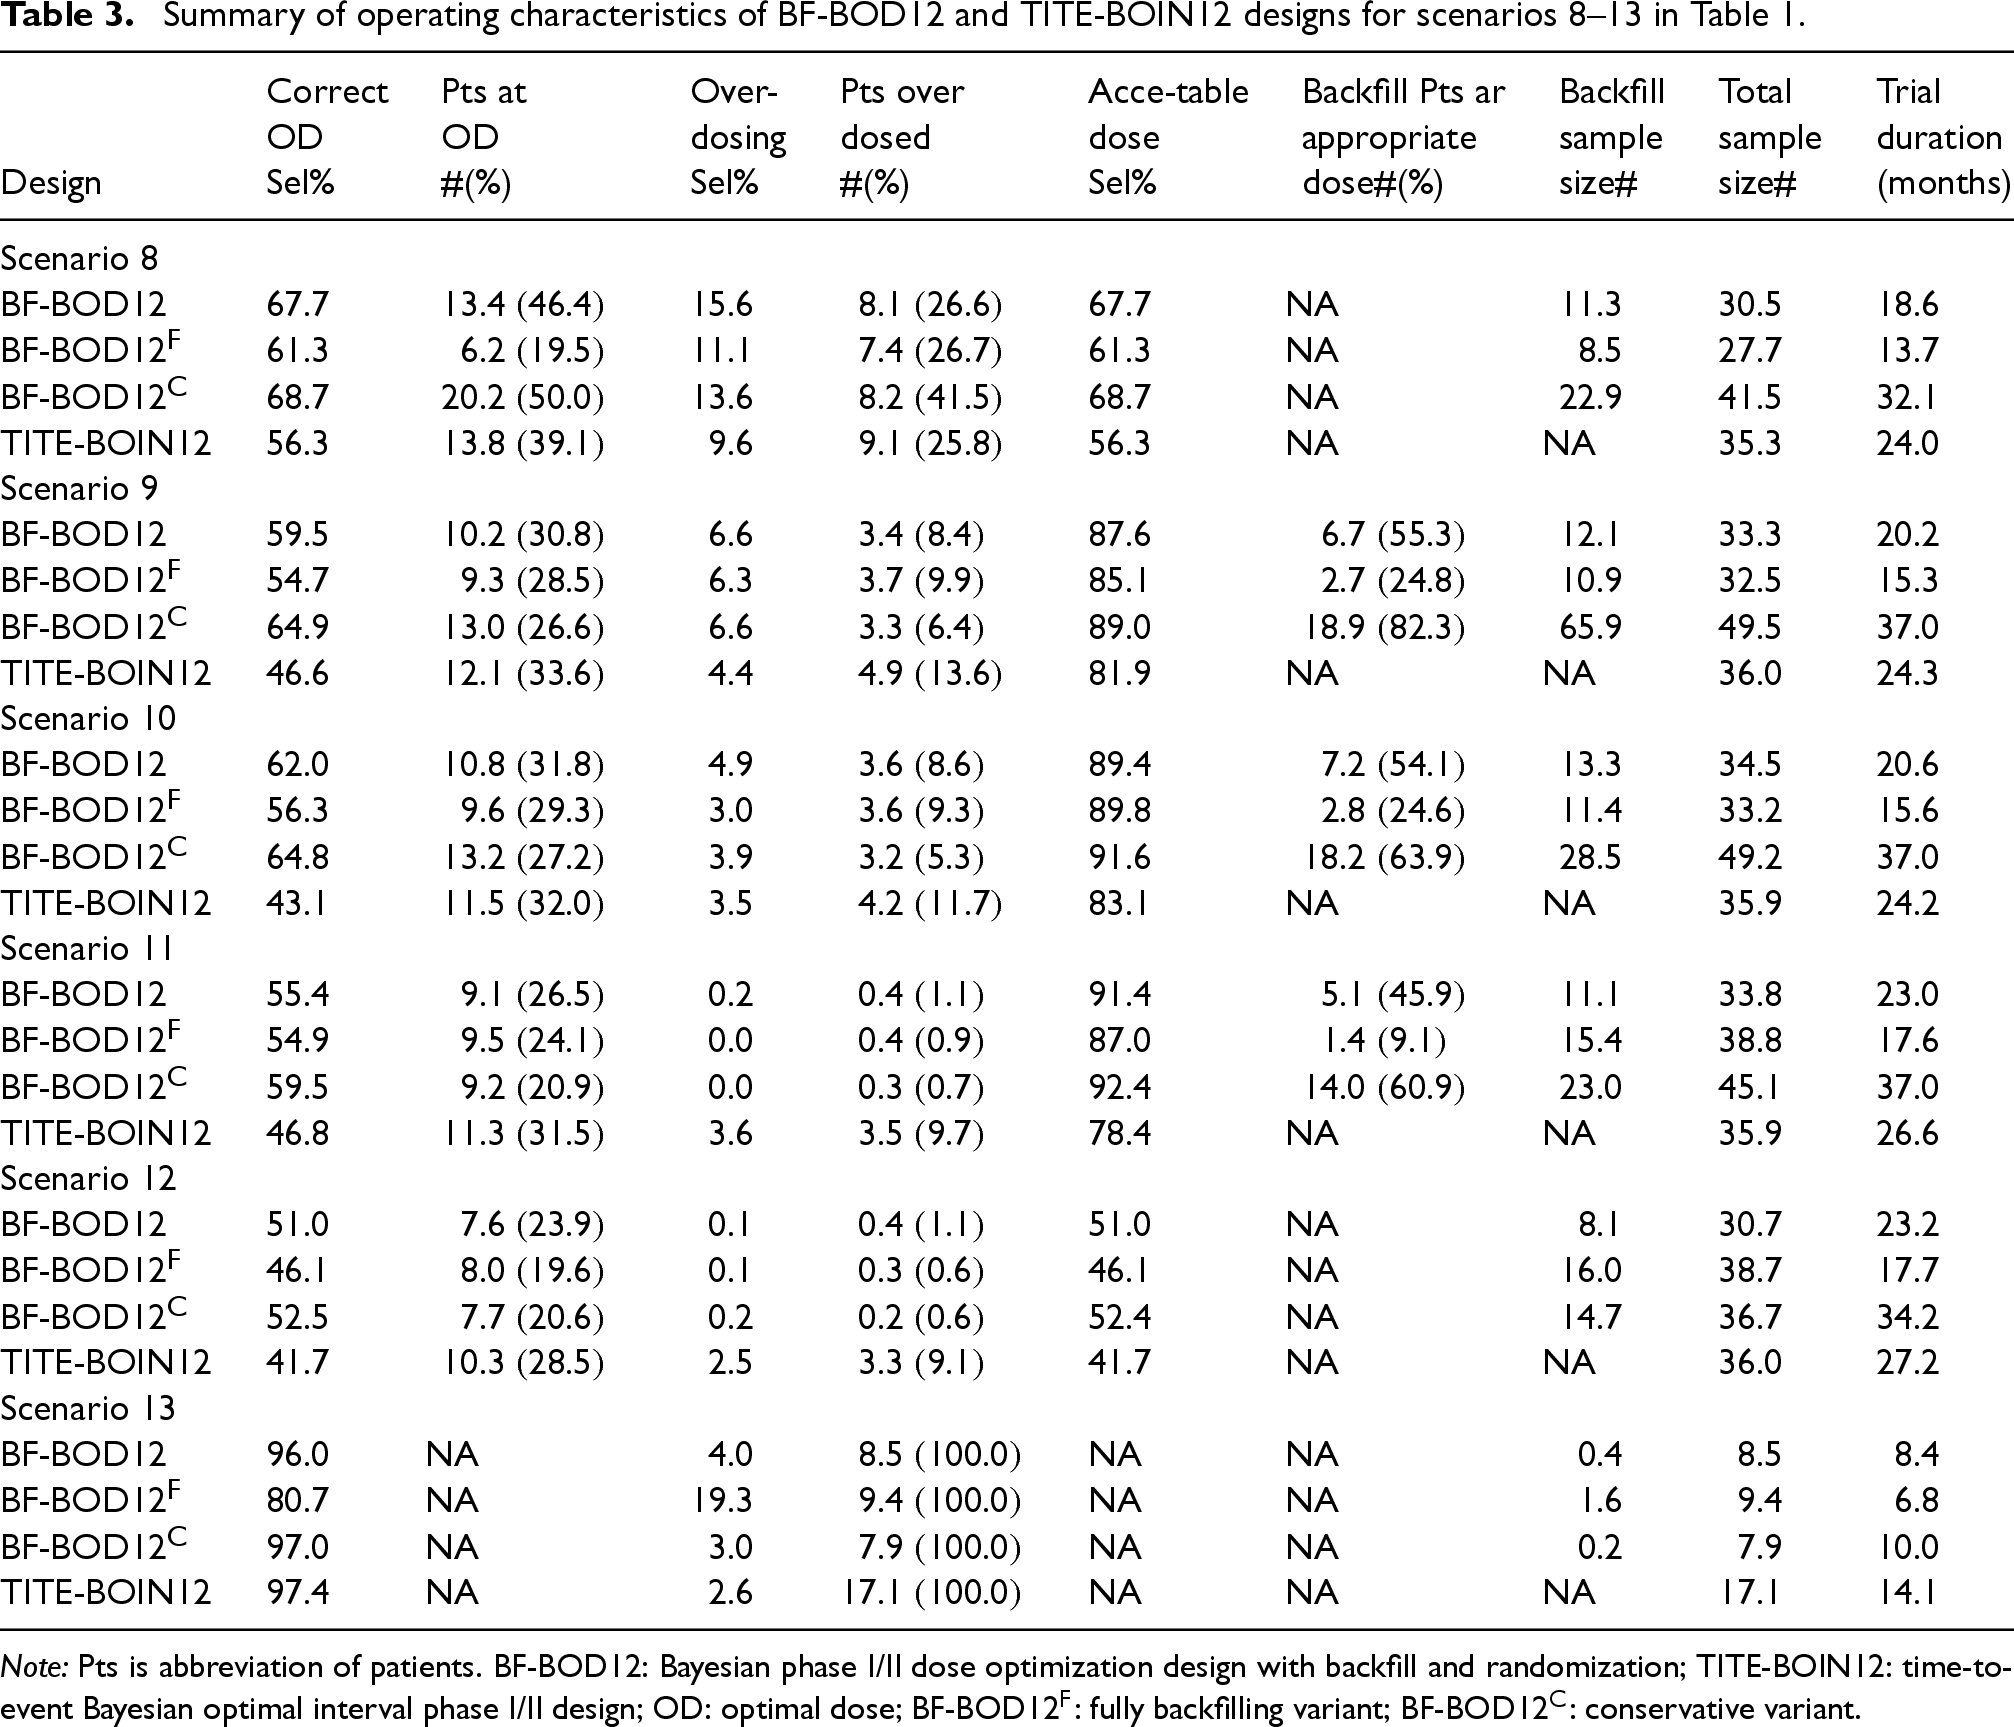
In our comprehensive simulation study, we explored 13 representative dose-response scenarios, as detailed in Table 1 and graphically illustrated in Figure 2. These scenarios are categorized as follows: scenarios 1–7, where the OD and the maximum tolerated dose (MTD) differ; scenarios 8–12, where the OD and MTD coincide; and scenario 13, the null scenario where no dose meets both toxicity and efficacy requirements. We considered seven performance metrics based on 10,000 simulated trials: (i) the percentage of correct selection of the true OD; (ii) the average number and percentage of patients allocated to the true OD; (iii) the percentage of over-dosing selection (i.e. selecting a dose higher than the MTD); (iv) the average number and percentage of patients overdosing (i.e. allocated above the MTD); (v) the percentage of selection of the acceptable dose(s) (i.e. selecting a dose with acceptable toxicity and efficacy, and ); (vi) the average number and percentage of backfill patients treated at appropriate dose(s) (i.e. dose levels below the MTD while satisfying ); (vii) the average total number of backfill patients; (viii) the average total sample size (including patients from both dose-escalation and backfill phases); and (ix) the average trial duration. Detailed simulation results are presented in Tables 2 and 3.
Thirteen scenarios evaluated in the simulation study: blue circles: dose toxicity; green triangles: dose efficacy; yellow squares: dose utility; red: true optimal dose (OD); and salmon: true maximum tolerated dose (MTD).
Summary of operating characteristics of BF-BOD12 and TITE-BOIN12 designs for scenarios 1–7 in Table 1.
Correct
Pts at
Over-
Pts over
Acce-table
Backfill Pts at
Backfill
Total
Trial
OD
OD
dosing
dosed
dose
appropriate
sample
sample
duration
Design
Sel%
# (%)
Sel%
# (%)
Sel%
dose# (%)
size#
size#
(months)
Scenario 1
BF-BOD12
61.0
12.6 (30.3)
0.0
0.3 (0.6)
99.8
20.1 (99.5)
20.2
42.2
21.4
BF-BOD12
53.5
7.3 (20.9)
0.1
0.6 (1.4)
99.8
12.2 (99.2)
12.3
35.0
16.0
BF-BOD12
63.2
25.2 (38.4)
0.0
0.1 (0.2)
99.8
45.1 (99.8)
45.2
67.1
43.7
TITE-BOIN12
60.5
16.5 (45.7)
0.8
1.1 (3.0)
99.2
NA
NA
36.0
23.5
Scenario 2
BF-BOD12
56.1
13.5 (35.5)
0.1
0.2 (0.4)
97.4
12.6 (77.3)
16.3
37.8
21.2
BF-BOD12
59.8
7.4 (21.7)
0.0
0.1 (0.3)
96.9
4.4 (36.1)
12.2
33.9
15.9
BF-BOD12
59.5
28.4 (47.6)
0.0
0.1 (0.2)
99.0
31.9 (85.5)
37.3
58.6
40.5
TITE-BOIN12
60.8
15.6 (43.3)
1.5
1.7 (4.7)
95.3
NA
NA
36.0
24.6
Scenario 3
BF-BOD12
61.4
10.3 (28.4)
0.2
0.2 (0.5)
99.4
11.1 (68.1)
16.3
38.7
21.1
BF-BOD12
58.0
9.2 (24.8)
0.3
0.3 (0.8)
95.6
4.3 (35.5)
12.1
34.8
15.9
BF-BOD12
63.1
17.1 (29.0)
0.2
0.2 (0.2)
98.9
30.2 (78.0)
38.7
61.0
42.5
TITE-BOIN12
53.1
13.2 (43.3)
2.5
1.6 (4.4)
91.1
NA
NA
36.0
24.4
Scenario 4
BF-BOD12
73.3
13.4 (35.2)
0.0
0.0 (0.0)
73.3
7.6 (49.0)
15.5
38.4
24.0
BF-BOD12
69.2
8.0 (20.9)
0.0
0.0 (0.0)
69.2
1.9 (11.6)
16.4
39.7
18.0
BF-BOD12
75.6
22.5 (41.1)
0.0
0.0 (0.0)
75.6
16.6 (54.2)
30.6
53.2
40.4
TITE-BOIN12
64.6
13.3 (37.0)
0.0
0.0 (0.0)
64.6
NA
NA
35.9
27.5
Scenario 5
BF-BOD12
70.1
16.7 (38.7)
2.3
3.9 (7.7)
96.7
19.8 (91.2)
21.7
43.1
20.8
BF-BOD12
68.7
11.2 (34.7)
1.6
3.8 (9.5)
97.5
10.7 (93.0)
11.5
32.9
15.2
BF-BOD12
74.3
30.1 (45.8)
2.8
4.0 (5.1)
94.9
41.0 (97.9)
44.9
65.8
42.5
TITE-BOIN12
73.1
19.3 (53.5)
1.5
3.7 (10.2)
98.5
NA
NA
36.0
23.0
Scenario 6
BF-BOD12
73.0
10.7 (28.2)
0.0
0.0 (0.0)
93.3
7.1 (47.3)
15.0
38.5
24.1
BF-BOD12
61.8
9.8 (24.9)
0.0
0.0 (0.0)
87.9
0.2 (1.3)
15.9
39.4
17.9
BF-BOD12
77.9
11.9 (22.4)
0.0
0.0 (0.0)
95.8
19.4 (60.4)
32.1
55.1
41.6
TITE-BOIN12
61.8
13.4 (37.2)
0.0
0.0 (0.0)
88.5
NA
NA
36.0
27.3
Scenario 7
BF-BOD12
74.1
10.2 (27.6)
0.0
0.0 (0.0)
94.0
6.3 (45.3)
13.9
37.1
23.7
BF-BOD12
69.5
9.9 (25.0)
0.0
0.0 (0.0)
91.4
1.8 (11.2)
16.1
39.6
17.9
BF-BOD12
79.1
12.2 (23.1)
0.0
0.0 (0.0)
95.4
18.3 (58.3)
31.4
54.7
41.7
TITE-BOIN12
54.7
12.9 (35.8)
0.0
0.0 (0.0)
91.6
NA
NA
36.0
26.9
Note: Pts is abbreviation of patients. BF-BOD12: Bayesian phase I/II dose optimization design with backfill and randomization; TITE-BOIN12: time-to-event Bayesian optimal interval phase I/II design; OD: optimal dose; BF-BOD12: fully backfilling variant; BF-BOD12: conservative variant.
Summary of operating characteristics of BF-BOD12 and TITE-BOIN12 designs for scenarios 8–13 in Table 1.
Correct
Pts at
Over-
Pts over
Acce-table
Backfill Pts ar
Backfill
Total
Trial
OD
OD
dosing
dosed
dose
appropriate
sample
sample
duration
Design
Sel%
#(%)
Sel%
#(%)
Sel%
dose#(%)
size#
size#
(months)
Scenario 8
BF-BOD12
67.7
13.4 (46.4)
15.6
8.1 (26.6)
67.7
NA
11.3
30.5
18.6
BF-BOD12
61.3
6.2 (19.5)
11.1
7.4 (26.7)
61.3
NA
8.5
27.7
13.7
BF-BOD12
68.7
20.2 (50.0)
13.6
8.2 (41.5)
68.7
NA
22.9
41.5
32.1
TITE-BOIN12
56.3
13.8 (39.1)
9.6
9.1 (25.8)
56.3
NA
NA
35.3
24.0
Scenario 9
BF-BOD12
59.5
10.2 (30.8)
6.6
3.4 (8.4)
87.6
6.7 (55.3)
12.1
33.3
20.2
BF-BOD12
54.7
9.3 (28.5)
6.3
3.7 (9.9)
85.1
2.7 (24.8)
10.9
32.5
15.3
BF-BOD12
64.9
13.0 (26.6)
6.6
3.3 (6.4)
89.0
18.9 (82.3)
65.9
49.5
37.0
TITE-BOIN12
46.6
12.1 (33.6)
4.4
4.9 (13.6)
81.9
NA
NA
36.0
24.3
Scenario 10
BF-BOD12
62.0
10.8 (31.8)
4.9
3.6 (8.6)
89.4
7.2 (54.1)
13.3
34.5
20.6
BF-BOD12
56.3
9.6 (29.3)
3.0
3.6 (9.3)
89.8
2.8 (24.6)
11.4
33.2
15.6
BF-BOD12
64.8
13.2 (27.2)
3.9
3.2 (5.3)
91.6
18.2 (63.9)
28.5
49.2
37.0
TITE-BOIN12
43.1
11.5 (32.0)
3.5
4.2 (11.7)
83.1
NA
NA
35.9
24.2
Scenario 11
BF-BOD12
55.4
9.1 (26.5)
0.2
0.4 (1.1)
91.4
5.1 (45.9)
11.1
33.8
23.0
BF-BOD12
54.9
9.5 (24.1)
0.0
0.4 (0.9)
87.0
1.4 (9.1)
15.4
38.8
17.6
BF-BOD12
59.5
9.2 (20.9)
0.0
0.3 (0.7)
92.4
14.0 (60.9)
23.0
45.1
37.0
TITE-BOIN12
46.8
11.3 (31.5)
3.6
3.5 (9.7)
78.4
NA
NA
35.9
26.6
Scenario 12
BF-BOD12
51.0
7.6 (23.9)
0.1
0.4 (1.1)
51.0
NA
8.1
30.7
23.2
BF-BOD12
46.1
8.0 (19.6)
0.1
0.3 (0.6)
46.1
NA
16.0
38.7
17.7
BF-BOD12
52.5
7.7 (20.6)
0.2
0.2 (0.6)
52.4
NA
14.7
36.7
34.2
TITE-BOIN12
41.7
10.3 (28.5)
2.5
3.3 (9.1)
41.7
NA
NA
36.0
27.2
Scenario 13
BF-BOD12
96.0
NA
4.0
8.5 (100.0)
NA
NA
0.4
8.5
8.4
BF-BOD12
80.7
NA
19.3
9.4 (100.0)
NA
NA
1.6
9.4
6.8
BF-BOD12
97.0
NA
3.0
7.9 (100.0)
NA
NA
0.2
7.9
10.0
TITE-BOIN12
97.4
NA
2.6
17.1 (100.0)
NA
NA
NA
17.1
14.1
Note: Pts is abbreviation of patients. BF-BOD12: Bayesian phase I/II dose optimization design with backfill and randomization; TITE-BOIN12: time-to-event Bayesian optimal interval phase I/II design; OD: optimal dose; BF-BOD12: fully backfilling variant; BF-BOD12: conservative variant.
Simulation results
Patients allocation, average trial sample size, and average trial duration
BF-BOD12 enrolls the highest average number of patients, particularly in scenarios where more efficacious dose levels are below the MTD, and the OD is not aligned with the MTD (e.g. scenarios 1, 2, and 5). In comparison, BF-BOD12 and BF-BOD12 reduce the total sample size to a range of 14–25 and 14–33, respectively, in scenarios where the MTD and OD do not match, and to 6–16 and 3–17, respectively, when they do match. The pattern of backfill sample sizes follows similarly, with BF-BOD12 having the largest, followed by BF-BOD12, and BF-BOD12. In scenarios, where efficacious doses exist below the MTD (e.g. scenarios 1–7 and 9–11), BF-BOD12 allocates the highest number and percentage of backfill patients to appropriate doses. BF-BOD12 allocates 0%–15% fewer backfill patients to appropriate doses than BF-BOD12, while BF-BOD12 shows a reduction of 4%–10% and 10%–33% compared to BF-BOD12 and BF-BOD12, respectively.
Regarding the number of patients treated at the OD, BF-BOD12 generally performs the best, with BF-BOD12 and TITE-BOIN12 showing comparable outcomes. BF-BOD12 enrolls the fewest. All three BF-BOD12 designs demonstrate better control over patient overdoses compared to TITE-BOIN12. The average trial duration is the longest for BF-BOD12 and the shortest for BF-BOD12. BF-BOD12 recruits 1–7 more patients on average than TITE-BOIN12, but the average trial duration of BF-BOD12 is slightly shorter than that of TITE-BOIN12.
These findings are intuitive, as BOD12 benefits from a longer recruitment window for backfilling patients, enhancing its capability to allocate patients effectively according to our proposed backfill allocation rules. Conversely, if we limit backfilling only to ‘‘safe” dose sets without considering efficacy signals, the trial durations decrease by an average of 1.6–6.0 months compared to BF-BOD12. However, this approach does not effectively allocate backfill patients to the appropriate doses.
Accuracy of OD selection
BF-BOD12 consistently generates the best performance in terms of the percentage of correct OD selection across most scenarios, regardless of whether the OD matches the MTD. BF-BOD12 ranks second, with differences in the percentages of correct OD selection remaining within 5%. The percentage of over-dosing selection across all three BF-BOD12 designs is comparable and uniformly lower than that observed with TITE-BOIN12. In evaluating the selection of acceptable doses, the three BF-BOD12 designs generally outperform TITE-BOIN12. Among them, BF-BOD12 shows the least favorable results, while BF-BOD12 and BF-BOD12 exhibit comparable performance.
Overall, we recommend BF-BOD12 for practical use, taking into account all performance metrics. Specifically, its performance in OD selection, patient allocation, and overdose control is very close to that of BF-BOD12, but it significantly reduces the trial duration by nearly half. In the phase I/II trial setting, where the goal is OD selection, full backfilling without consideration of the efficacy signal is generally not recommended. However, depending on the trial objectives, this approach can still yield favorable operating characteristics with a shorter trial duration within our proposed framework.
Sensitivity analysis
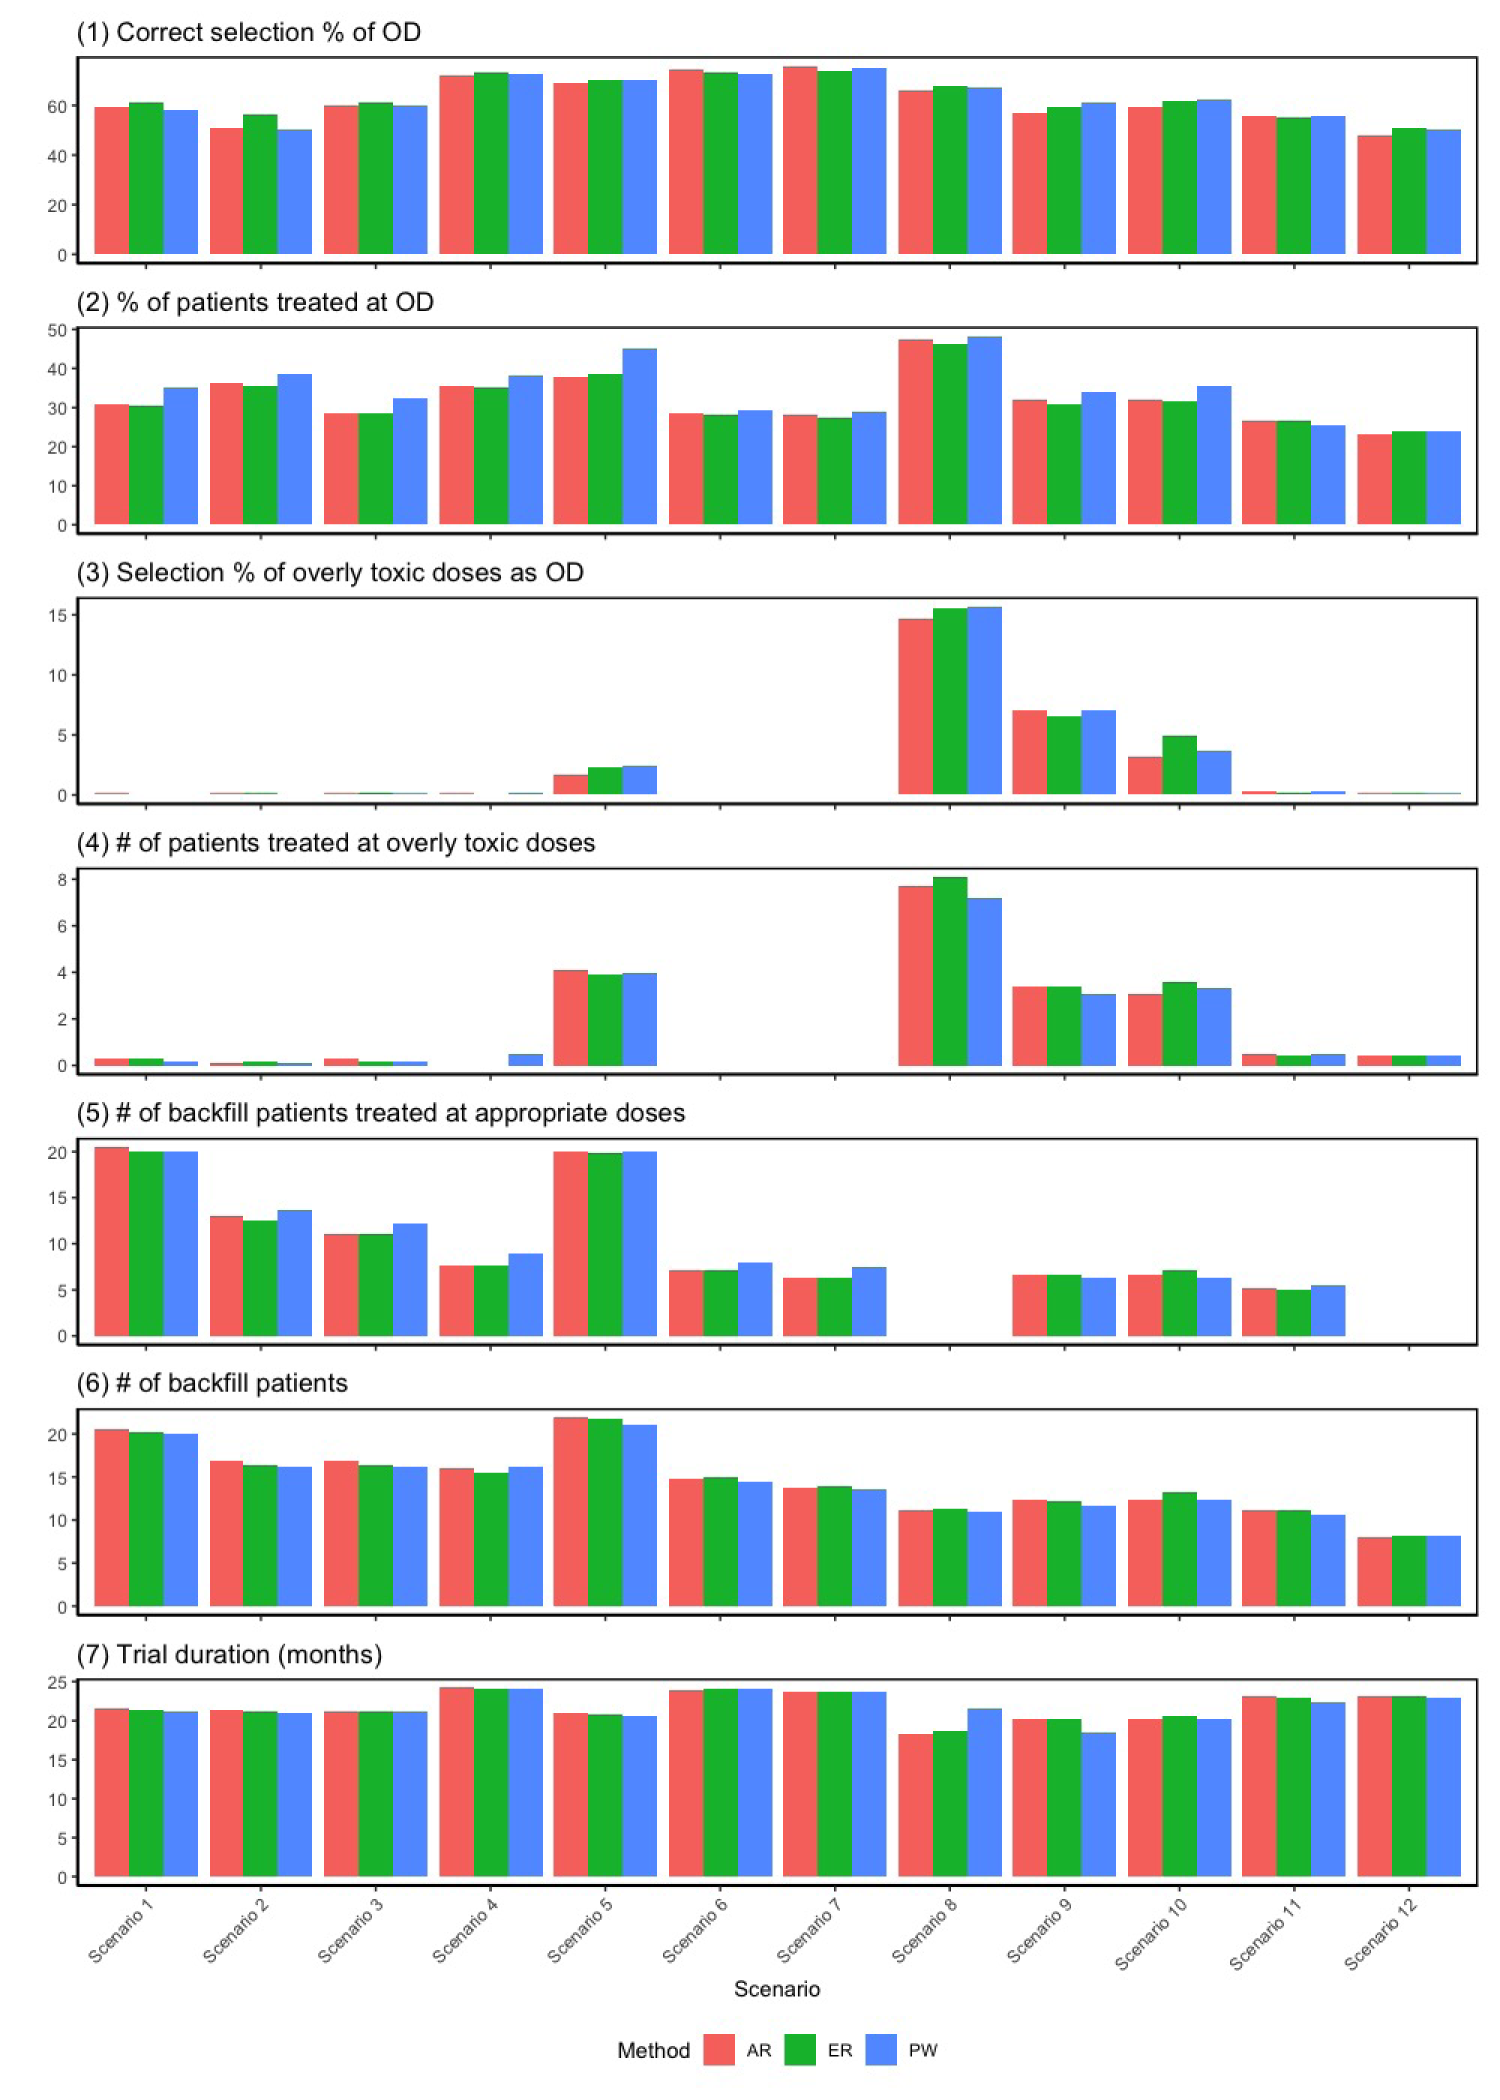
Allocation methods of backfilling patients
The backfill cohorts could be randomized among the admissible set through (1) pick-the-winner (PW) approach by deterministically assigning the backfill cohort to dose that has the largest posterior mean utility; (2) adaptively randomize (AR) the backfill cohort to dose , with probability proportional to its posterior mean utility; and (3) equal randomization (ER), where the backfill cohort are assigned to the admissible doses with equal probability . Those methods are evaluated and examined through simulation studies with results presented in Figure 3. The correct OD selection is comparable among the PW and AR strategies, with slightly superior performance for ER (the largest difference is within 6%). In terms of the percentage of patients treated at the OD, the PW approach on average assigns slightly more patients to the OD than both the ER and AR approaches, but the largest difference remains within 5%. All three strategies perform comparably in terms of overdose control, the number of backfill patients treated at appropriate doses, the total number of backfill patients enrolled, and trial duration. Therefore, we recommend ER for practical use by also considering the spirit of “Project Optimus.”
Results of sensitivity analysis for different backfilling patients allocation strategies: pick-the-winner (PW); adaptive randomization (AR); and equal randomization (ER). Scenario 13 is not included due to the non-existence of optimal dose (OD).
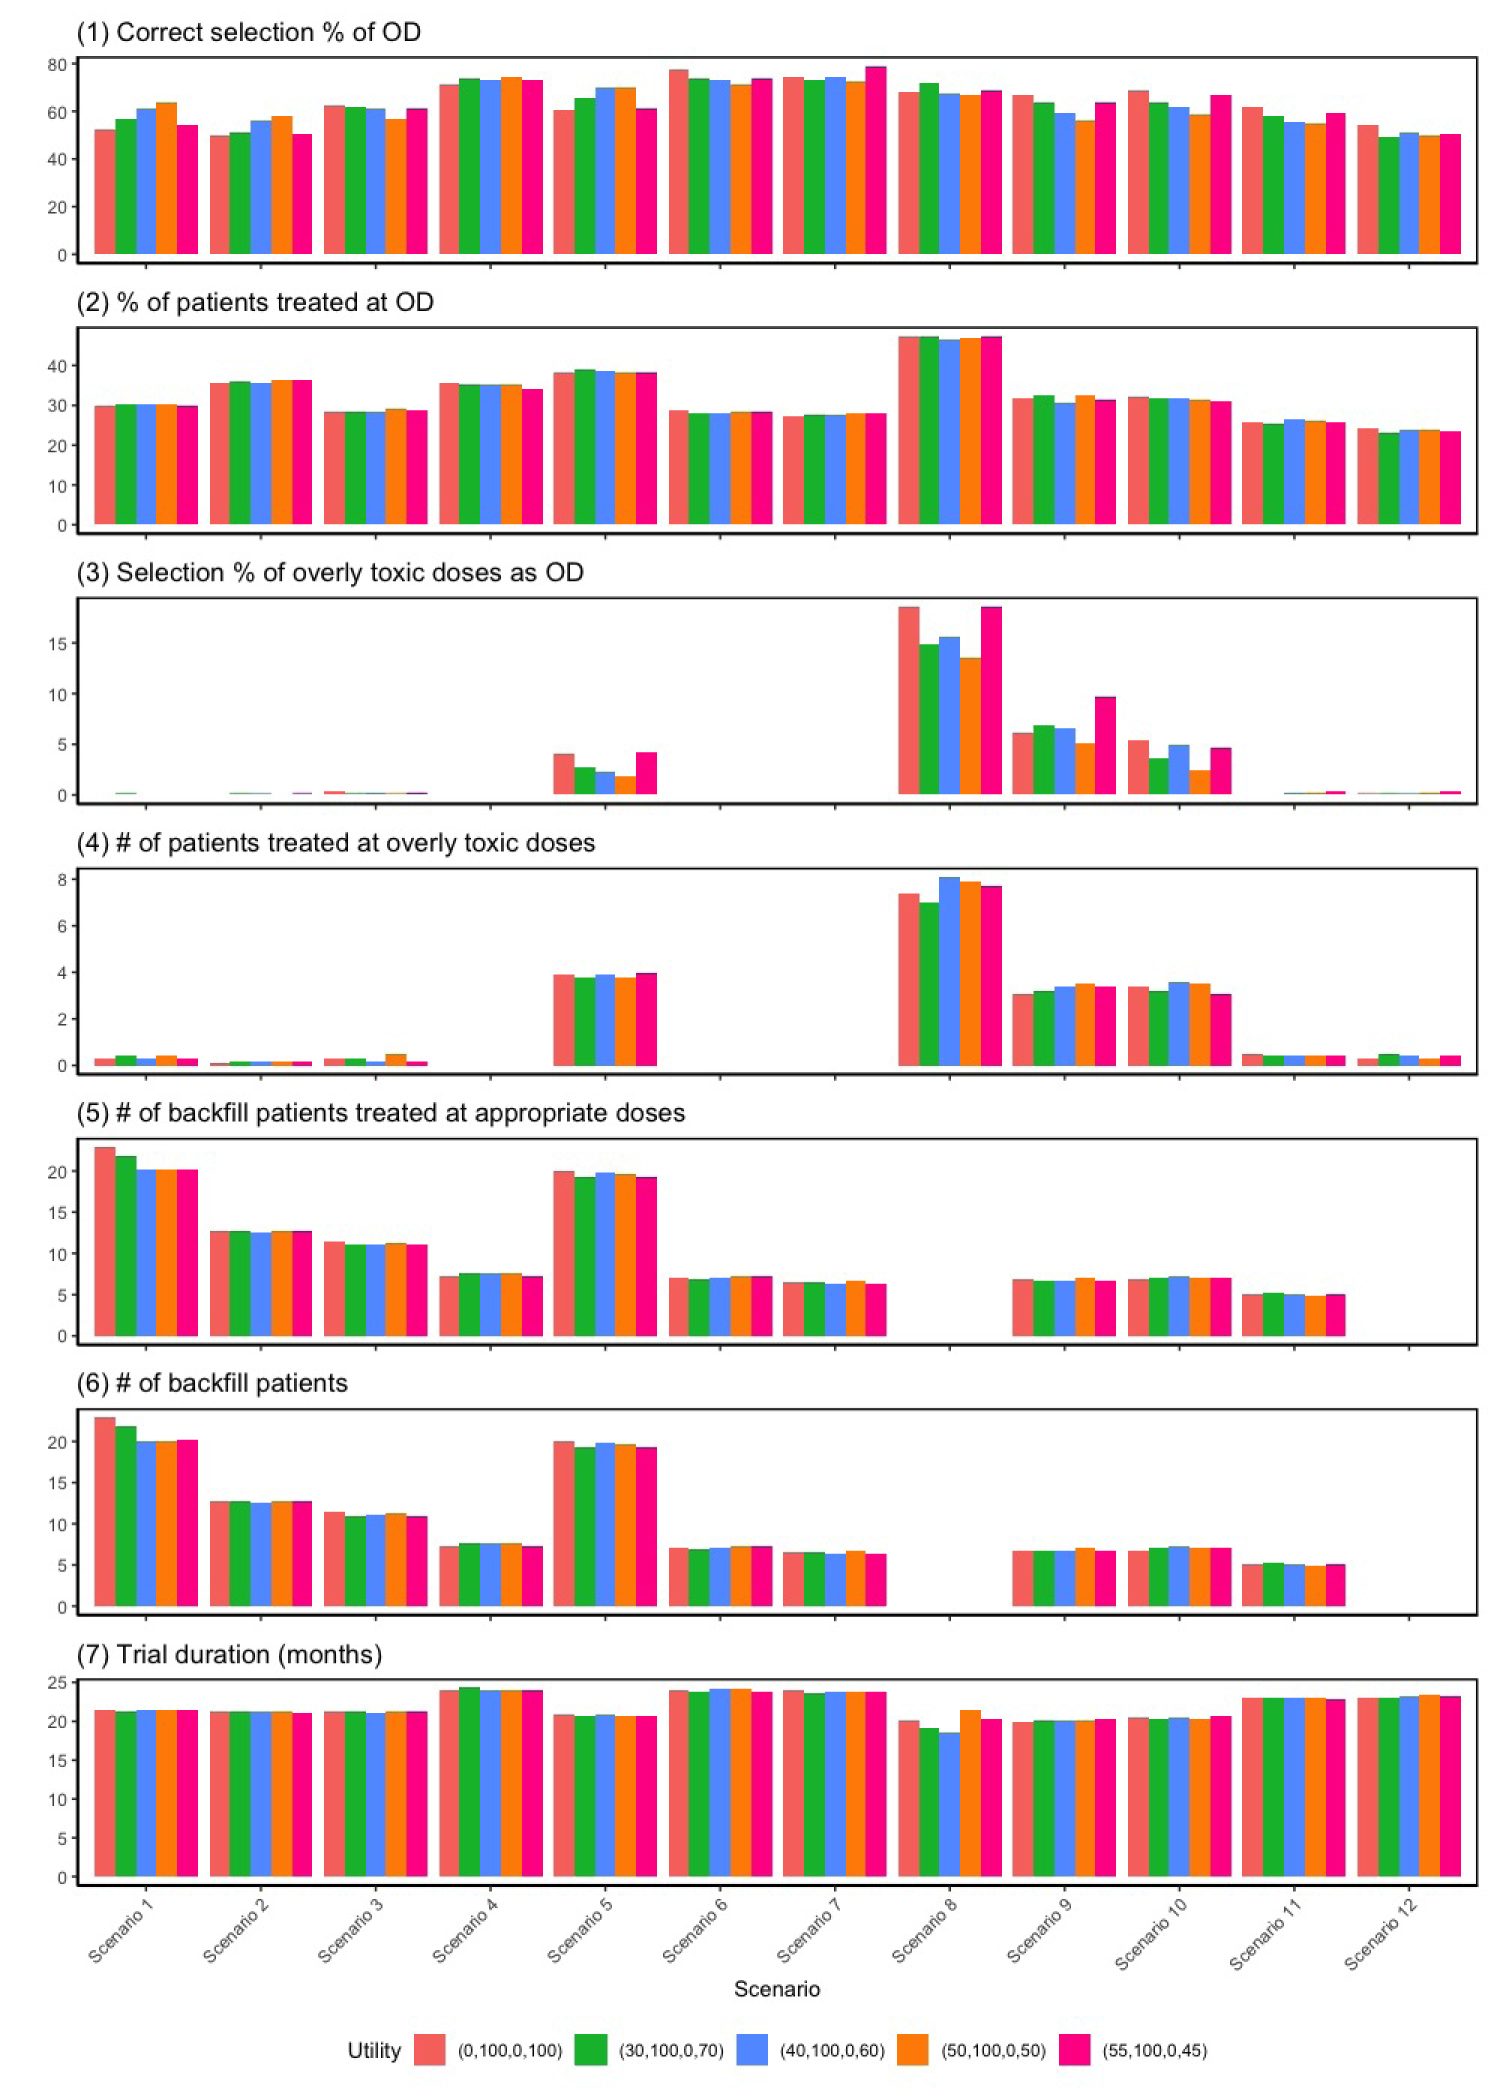
Utility values
We conduct sensitivity analyses to assess the robustness of the BF-BOD12 design by testing four different sets of utility values. The first set assigns a lower utility score for the outcome (no toxicity and no efficacy) and a higher score for (toxicity and efficacy), suggesting that patients are willing to tolerate higher toxicity for greater efficacy. The second set equates the utility scores for (no toxicity and no efficacy) and (toxicity and efficacy), indicating no additional tolerance for toxicity despite increased efficacy. The third set reflects a preference where an outcome with both efficacy and toxicity is considered inferior to one with no effects. The last set reflects a goal of selecting the optimal dose with the highest efficacy rate, provided the dose is safe. The simulation results, illustrated in Figure 4, demonstrate that the BF-BOD12 design maintains generally robust performance across various metrics employing different sets of utility values.
Results of sensitivity analysis for different utility values: (): (no toxicity and no efficacy) , (no toxicity and efficacy) , (toxicity and no efficacy) , and (toxicity and efficacy) . Scenario 13 is not included due to the non-existence of optimal dose (OD).
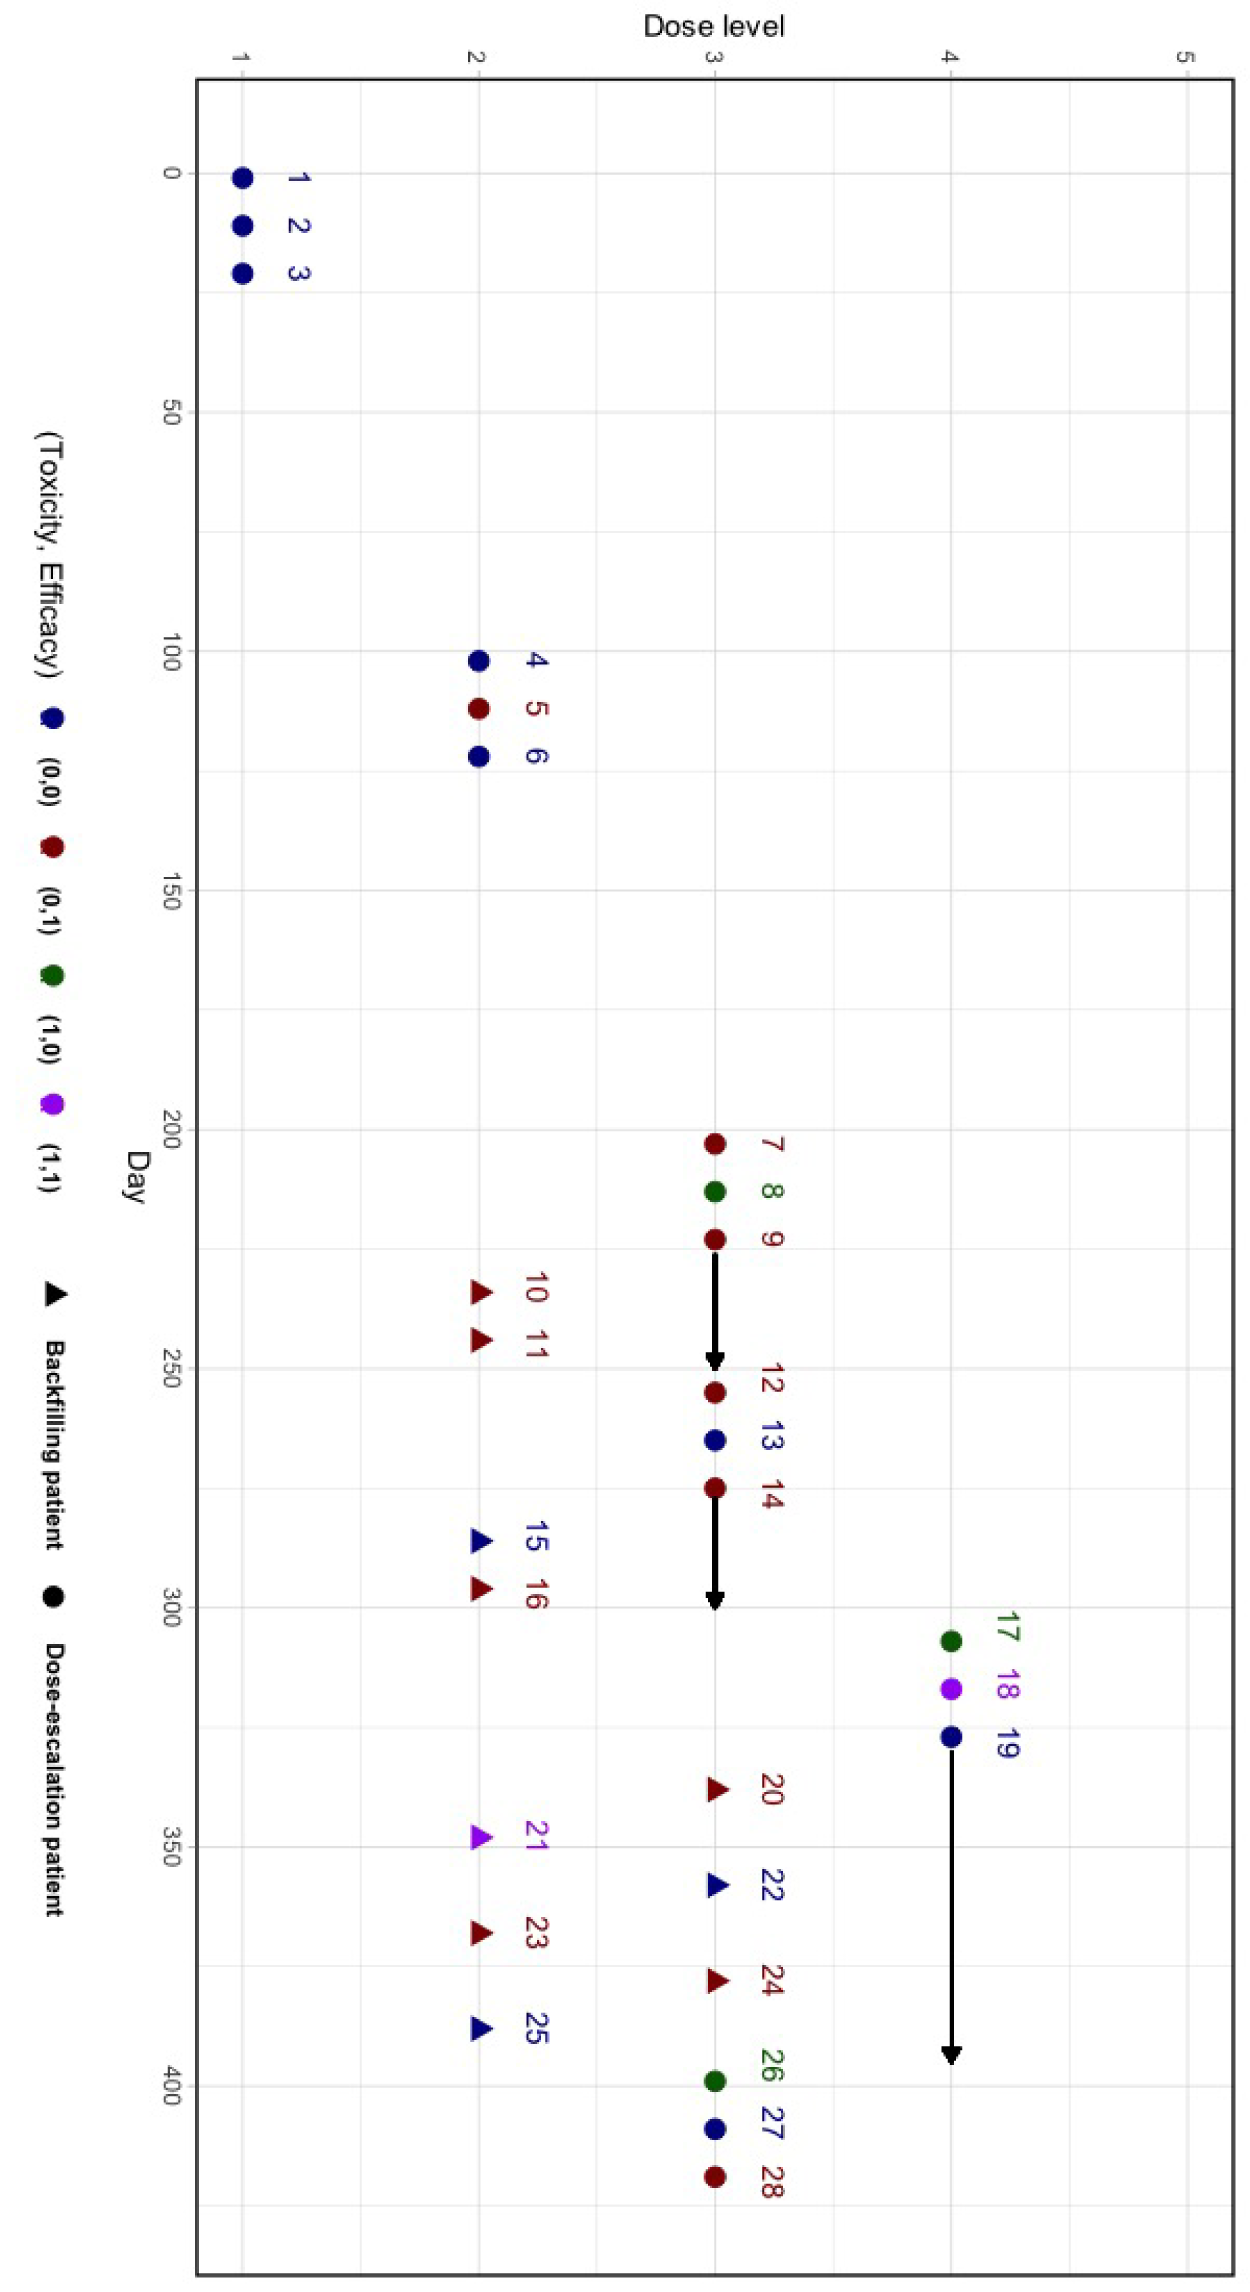
A trial example of Bayesian phase I/II dose optimization design with backfill and randomization (BF-BOD12) using scenario 1 from Table 1.
Correlation between toxicity and efficacy outcomes
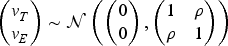
We perform a sensitivity analysis to examine the operating characteristics of the BF-BOD12 with respect to different correlations between toxicity and efficacy. A latent variable approach is employed to induce the correlations. Suppose at the dose level , for each patient we first simulate bivariate normal random variables based on the following equation:
Then the toxicity and efficacy outcomes for the patients are and , where is the inverse cumulative distribution function of the standard normal random variable, and is the correlation coefficient between toxicity and efficacy. We considered three cases: positive correlation with , zero correlation with (as shown in the main simulation study), and negative correlation with . The results are presented in Figure S1 in the Supplemental Material and we conclude the proposed design is not sensitive to the correlation between toxicity and efficacy.
In addition to the sensitivity analysis above, we further assess the robustness of the proposed BF-BOD12 design by examining variations in patient accrual rates (Supplemental Table S2), maximum sample sizes of the dose-escalation cohort (Supplemental Figure S2), lengths of assessment windows for toxicity and efficacy outcomes (Supplemental Table S3), and the underlying distributions of time-to-event for these outcomes (Supplemental Figure S3). Detailed results of these evaluations are presented in the Supplemental Material. To summarize, a higher accrual rates or larger sample size of dose-escalation cohorts recruits more patients and improved accuracy in OD selection, especially when the MTD is located at a high dose level and is not matched with OD. But the increase in average sample size and improved accuracy in OD selection is usually small due to the setting of sample size constraint . Similar observation applies to lengths of assessment window. Therefore, if the accrual rate is very low and the length of assessment window is short, the number of patients to be backfilled may be too small to meet the requirements for dose optimization. Then it may be necessary to attach an expansion component after the dose-escalation trial. In addition, the proposed design is not sensitive to the underlying distributions of time-to-event for toxicity and efficacy outcomes. When the assessment window for efficacy significantly exceeds that for toxicity (e.g. 1 month for toxicity vs. 6 months for efficacy), we conducted additional sensitivity analyses to evaluate the impact of varying the enrollment suspension rule, as summarized in Supplemental Table S4. Considering the substantial reduction in overall trial duration and the moderate impact on other operating characteristics, we recommend modifying the suspension rule to require that at least 50% of toxicity outcomes and at least 30% of efficacy outcomes be fully observed at the current dose level.
Discussion
In alignment with the principles of ‘‘Project Optimus,” backfill strategies have gained prominence in oncology dose-escalation trials. Given the potentially lengthy assessment windows for toxicity and efficacy, we advocate the use of dose suspension rules and likelihood approximation methods to gather adequate data for informed dose determination across both dose-escalation and backfill cohorts. The BF-BOD12 design facilitates continuous monitoring of safety and efficacy outcomes, selecting the OD using flexible and clinically relevant utility metrics. A significant advantage of the proposed design is its ability to borrow information across doses using transformation approaches without imposing rigid model assumptions on the dose-toxicity and dose-efficacy curves. Consequently, this design demonstrates robust performance across various shapes of the underlying true dose-response relationships, ensuring reliability and flexibility in its application.
Simulation studies confirm that BF-BOD12 is more efficient than BF-BOD12 in terms of accuracy in OD selection and patient allocation. Specifically, BF-BOD12 assigns additional patients to doses below the MTD that are also sufficiently efficacious, thereby increasing the trial’s sample size more reasonably. In contrast, although ignoring efficacy signals during backfilling reduces sample sizes and shortens trial duration, it inadvertently leads to more patients being assigned to ineffective doses. While the BF-BOD12 design shows slight improvements in dose selection and patient allocation, the gains do not justify the significant extension in trial duration. Consequently, considering practical application and simulation outcomes, we recommend BF-BOD12 for its efficiency and robustness.
This superiority of the proposed design is also demonstrated by its ability to effectively integrate new data from backfill doses that may conflict with data from dose-escalation. By leveraging probability models that borrow information across dose levels under clinically and biologically meaningful dose-response relationships, BF-BOD12 incorporates additional data into decision-making processes efficiently within a robust statistical framework. We provide a hypothetical trial example using BF-BOD12 in Figure 5 and detail the trial with patient-level data in Table S1 in Supplemental Section S1.
The proposed design can be extended from multiple dimensions. While we recommended equal randomization in the backfill cohort for simplicity, future extensions of the design may benefit from incorporating more carefully designed outcome-adaptive randomization schemes to improve trial efficiency and patient benefit. Although the BF-BOD12 focuses on handling binary endpoints of toxicity and efficacy, it can be extended to handle ordinal graded and continuous endpoints for a more unified consideration.29 We assume population homogeneity for all the subjects in the trial. However, an increased understanding of the population heterogeneity of cancer has already brought us to the era of personalized medicine, providing clinicians with an unbeatable opportunity to select individually tailored treatments considering each subject’s variability. Therefore, it is of interest to extend the proposed designs to integrate personalized information into the trial.
Supplemental Material
sj-pdf-1-smm-10.1177_09622802251374290 - Supplemental material for A robust Bayesian dose optimization design with backfill and randomization for phase I/II clinical trials
Supplemental material, sj-pdf-1-smm-10.1177_09622802251374290 for A robust Bayesian dose optimization design with backfill and randomization for phase I/II clinical trials by Yingjie Qiu and Mingyue Li in Statistical Methods in Medical Research
Footnotes
Acknowledgements
The research of Yingjie Qiu is partially supported by NIH grant P30CA142543. The authors thank the Editor, Associate Editor, and the Referees for their thoughtful and constructive comments and suggestions.
Declaration of conflicting interests
The author(s) declared no potential conflicts of interest with respect to the research, authorship, and/or publication of this article.
Funding
The author(s) received no financial support for the research, authorship, and/or publication of this article.
ORCID iD
Yingjie Qiu
Supplemental material
Supplemental material for this article is available online.
References
1.
SachsJRMayawalaKGadamsettyS, et al.Optimal dosing for targeted therapies in oncology: drug development cases leading by example. Clin Cancer Res2016; 22: 1318–1324.
2.
YanFThallPLuK, et al.Phase I–II clinical trial design: a state-of-the-art paradigm for dose finding. Ann Oncol2018; 29: 694–699.
3.
RatainMJTannockIFLichterAS. Dose optimization of sotorasib: Is the US Food and Drug Administration sending a message?. J Clin Oncol2021; 39: 3423–3426.
4.
Fourie ZirkelbachJShahMVallejoJ, et al.Improving dose-optimization processes used in oncology drug development to minimize toxicity and maximize benefit to patients. J Clin Oncol2022; 40: 3489–3500.
5.
JardimDLHessKRLoRussoP, et al.Predictive value of phase I trials for safety in later trials and final approved dose: analysis of 61 approved cancer drugs. Clin Cancer Res2014; 20: 281–288.
6.
Postel-VinaySArkenauHOlmosD, et al.Clinical benefit in phase-I trials of novel molecularly targeted agents: Does dose matter?. Br J Cancer2009; 100: 1373–1378.
BarnettHBoixOKontosD, et al.Backfilling cohorts in phase I dose-escalation studies. Clin Trials2023; 20: 261–268.
11.
LiuJYuanSBekeleBN, et al.The backfill i3+ 3 design for dose-finding trials in oncology. arXiv preprint arXiv:2303.15798, 2023.
12.
ZhaoYYuanYKornEL, et al.Backfilling patients in phase I dose-escalation trials using Bayesian optimal interval design (BOIN). Clin Cancer Res2024; 30: 673–679.
13.
YuanYZhouHLiuS. Statistical and practical considerations in planning and conduct of dose-optimization trials. Clin Trials2024; 21: 273–286.
14.
CunananKKoopmeinersJS. Evaluating the performance of copula models in phase I–II clinical trials under model misspecification. BMC Med Res Methodol2014; 14: 1–11.
15.
LinRYuanY. Time-to-event model-assisted designs for dose-finding trials with delayed toxicity. Biostatistics2020; 21: 807–824.
16.
DunsonDBNeelonB. Bayesian inference on order-constrained parameters in generalized linear models. Biometrics2003; 59: 286–295.
17.
BarlowRE. Statistical inference under order restrictions: the theory and application of isotonic regression. J. Wiley, 1972. https://books.google.com/books?id=DEamySUDBWcC.
18.
HwangJGPeddadaSD. Confidence interval estimation subject to order restrictions. Ann Stat1994; 22: 67–93.
19.
GunnLHDunsonDB. A transformation approach for incorporating monotone or unimodal constraints. Biostatistics2005; 6: 434–449.
20.
CheungYKChappellR. Sequential designs for phase I clinical trials with late-onset toxicities. Biometrics2000; 56: 1177–1182.
21.
StorerBE. Design and analysis of phase I clinical trials. Biometrics1989; 45: 925–937.
22.
YinGYuanY. A latent contingency table approach to dose finding for combinations of two agents. Biometrics2009; 65: 866–875.
23.
RiviereMKYuanYJourdanJH, et al.Phase I/II dose-finding design for molecularly targeted agent: plateau determination using adaptive randomization. Stat Methods Med Res2018; 27: 466–479.
24.
TakedaKMoritaSTaguriM. TITE-BOIN-ET: time-to-event Bayesian optimal interval design to accelerate dose-finding based on both efficacy and toxicity outcomes. Pharm Stat2020; 19: 335–349.
25.
QiuYZhaoYLiuH, et al.Modified isotonic regression based phase I/II clinical trial design identifying optimal biological dose. Contemp Clin Trials2023; 127: 107139.
26.
ZhouYLeeJJYuanY. A utility-based Bayesian optimal interval (U-BOIN) phase I/II design to identify the optimal biological dose for targeted and immune therapies. Stat Med2019; 38: S5299–S5316.
27.
LinRZhouYYanF, et al.BOIN12: Bayesian optimal interval phase I/II trial design for utility-based dose finding in immunotherapy and targeted therapies. JCO Precis Oncol2020; 4: 1393–1402.
28.
ZhouYLinRLeeJJ, et al.TITE-BOIN12: a Bayesian phase I/II trial design to find the optimal biological dose with late-onset toxicity and efficacy. Stat Med2022; 41: 1918–1931.
29.
LiMGuoZQiuY. UNITED: a unified transparent and efficient phase I/II trial design for dose optimization accounting for ordinal graded, continuous and mixed toxicity and efficacy endpoints. Stat Med2025; 44: e70098.
Supplementary Material
Please find the following supplemental material available below.
For Open Access articles published under a Creative Commons License, all supplemental material carries the same license as the article it is associated with.
For non-Open Access articles published, all supplemental material carries a non-exclusive license, and permission requests for re-use of supplemental material or any part of supplemental material shall be sent directly to the copyright owner as specified in the copyright notice associated with the article.