
Abstract
We investigate the effect of the choice of parameterisation of meta-analytic models and related uncertainty on the validation of surrogate endpoints. Different meta-analytical approaches take into account different levels of uncertainty which may impact on the accuracy of the predictions of treatment effect on the target outcome from the treatment effect on a surrogate endpoint obtained from these models. A range of Bayesian as well as frequentist meta-analytical methods are implemented using illustrative examples in relapsing–remitting multiple sclerosis, where the treatment effect on disability worsening is the primary outcome of interest in healthcare evaluation, while the effect on relapse rate is considered as a potential surrogate to the effect on disability progression, and in gastric cancer, where the disease-free survival has been shown to be a good surrogate endpoint to the overall survival. Sensitivity analysis was carried out to assess the impact of distributional assumptions on the predictions. Also, sensitivity to modelling assumptions and performance of the models were investigated by simulation. Although different methods can predict mean true outcome almost equally well, inclusion of uncertainty around all relevant parameters of the model may lead to less certain and hence more conservative predictions. When investigating endpoints as candidate surrogate outcomes, a careful choice of the meta-analytical approach has to be made. Models underestimating the uncertainty of available evidence may lead to overoptimistic predictions which can then have an effect on decisions made based on such predictions.
1 Introduction
Biomarkers and surrogate endpoints are increasingly being investigated as candidate endpoints in clinical trials where measuring a primary outcome of interest may be too costly, too difficult or require a long follow-up time. Use of surrogate endpoints in clinical trial design has advantages in overcoming these difficulties by choosing more convenient, cheaper or shorter term endpoints. Such endpoints are also becoming increasingly important in health technology assessment (HTA) and in particular in the early stages of drug development when conditional licensing based on a biomarker takes place and evidence on treatment effectiveness on a target outcome may be limited. Suitable methods need to be identified that would incorporate data on surrogate outcomes most efficiently in evidence synthesis as part of HTA.
Validating candidate outcomes as surrogate endpoints to target outcomes requires the correlation between the candidate endpoint and the target outcome on the individual level as well as the correlation between the treatment effect measured by the surrogate endpoint and the treatment effect measured by the target outcome to be established. 1 Methods for evaluating surrogacy on the individual level include, for example, Prentice's criteria, 2 proportion of treatment explained 3 and adjusted association (between the endpoints adjusted for the treatment). 4 For the evaluation to be valid in a general context of a particular disease area, it needs to be performed on a number of studies rather than based on a single trial. Meta-analysis serves the purpose of combining evidence from a number of trials and also provides a convenient tool for evaluating the association between treatment effects on the surrogate and final outcome on the study level. A number of meta-analytical methods have been proposed that aim to validate such surrogate endpoints.1,5,6 For example, Daniels and Hughes proposed a Bayesian model for a joint synthesis of correlated outcomes, focused on summary data where partially available patient data can contribute to determining the within-study correlation. 6 Buyse et al., on the other hand, designed a frequentist meta-analytic model based on patient-level data from a number of studies in the form of a mixed effects model with two measures of surrogacy derived: on the patient level and the study level. 5 Part of the validation process, beyond establishing the correlations on both levels, involves investigating whether the treatment effect measured by the target outcome can be predicted from the treatment effect measured by the surrogate endpoint (from a model built based on treatment effect on both outcomes measured in historical trials) by comparing the predicted effect with the observed effect on a target endpoint in a validation study. Methods used for prediction include linear regression (for example proposed by Buyse et al. to predict the log hazard ratio measured by overall survival from the log hazard ratio measured by progression-free survival in colorectal cancer 7 ), weighted linear regression (for example by Sormani et al. 8 in a study in relapsing–remitting multiple sclerosis (RRMS)), error-in-variables regression methods 1 (for example used by Burzykowski et al. in metastatic breast cancer study 9 or Oba et al. in gastric cancer study 10 ), meta-regression (for example used by Gabler et al. investigating 6 min walk distance as a surrogate endpoint to development of clinical events in pulmonary arterial hypertension 11 ), or bivariate meta-analysis methods, such as by Daniels and Hughes in a Bayesian framework developed to evaluate CD4 cell count as a candidate surrogate endpoint for the treatment effect on the development of AIDS or death. 6
Different meta-analytical approaches take into account different levels of uncertainty which may impact on the accuracy of the validation and predictions. The aim of this study was to investigate the effect of the choice of parameterisation of meta-analytic models and related uncertainty (that these models allow to incorporate) on the predictions obtained from those models. Bayesian methods are most suitable for this purpose as they are flexible in modelling the uncertainty. This study is concerned with predictive models for normally distributed treatment effects that are based on the summary data only. A range of Bayesian meta-analytical methods (using summary data) is implemented in order to investigate the impact of the choice of a model and level of uncertainty on the model predictions. When simple meta-regression is used to validate a candidate surrogate endpoint, the treatment effect on such an endpoint is included in the model as a covariate and hence is incorporated with no uncertainty, while the effect of treatment on each endpoint, including the surrogate, is in fact measured with error. Two approaches to meta-regression (described in Section 3.1) are investigated here: a standard use of mean trend with fixed coefficients estimated from the fixed effects meta-regression model (FEMR) and a random effects approach where between-study variability is taken into account when making predictions. In contrast to the meta-regression, the model proposed by Daniels and Hughes 6 (described in Section 3.2) includes the treatment effect on the surrogate endpoint with uncertainty by modelling it as a response (rather than a covariate). Alternatively this can be achieved using bivariate meta-analytic methods12–14 (Sections 3.3 and 3.4) which allow one to simultaneously model the estimates of treatment effects on both the surrogate and the final endpoint by taking into account the between- and within-study correlations. Models are implemented using WinBUGS. 15 While, as noted above, Bayesian methods are most suited to flexibly model the uncertainty, similar differences in the way uncertainty is taken into account and the impact of it on predictions can be also demonstrated using frequentist methods. We illustrate this by the use of meta-regression and bivariate meta-analysis in Stata. 16
In the remainder of this paper, illustrative examples in RRMS and gastric cancer are introduced in Section 2, followed by the details of each model described in the Bayesian framework in Section 3, with additional details of the use of frequentist methods in Section 3.7 and methods for surrogate endpoint validation and model comparison in Section 3.8. Results are then presented and differences between the models discussed in Section 4 which are complemented by a simulation study in Section 5 aiming to test the performance of each method and its sensitivity to the distributional assumptions. The paper is concluded by a discussion section. WinBUGS coding for each of the models, R code for the simulation and Stata code for the frequentist approach are included in Appendix 1.
2 Illustrative examples
2.1 Multiple sclerosis
Sormani et al. 8 showed that in studies investigating treatment effect in patients with multiple sclerosis, the treatment effect on relapse rate can potentially be used as a surrogate endpoint to the treatment effect on the disability progression rate. We use data from this study as an illustrative example to investigate the effect of the choice of modelling technique and corresponding level of uncertainty which is allowed to be included in each of the models. We refer to these data as the ‘Sormani data’ in the remainder of this paper.
Studies in the ‘Sormani data’ reporting the annualised relapse rate ratio and the disability progression rate ratio.
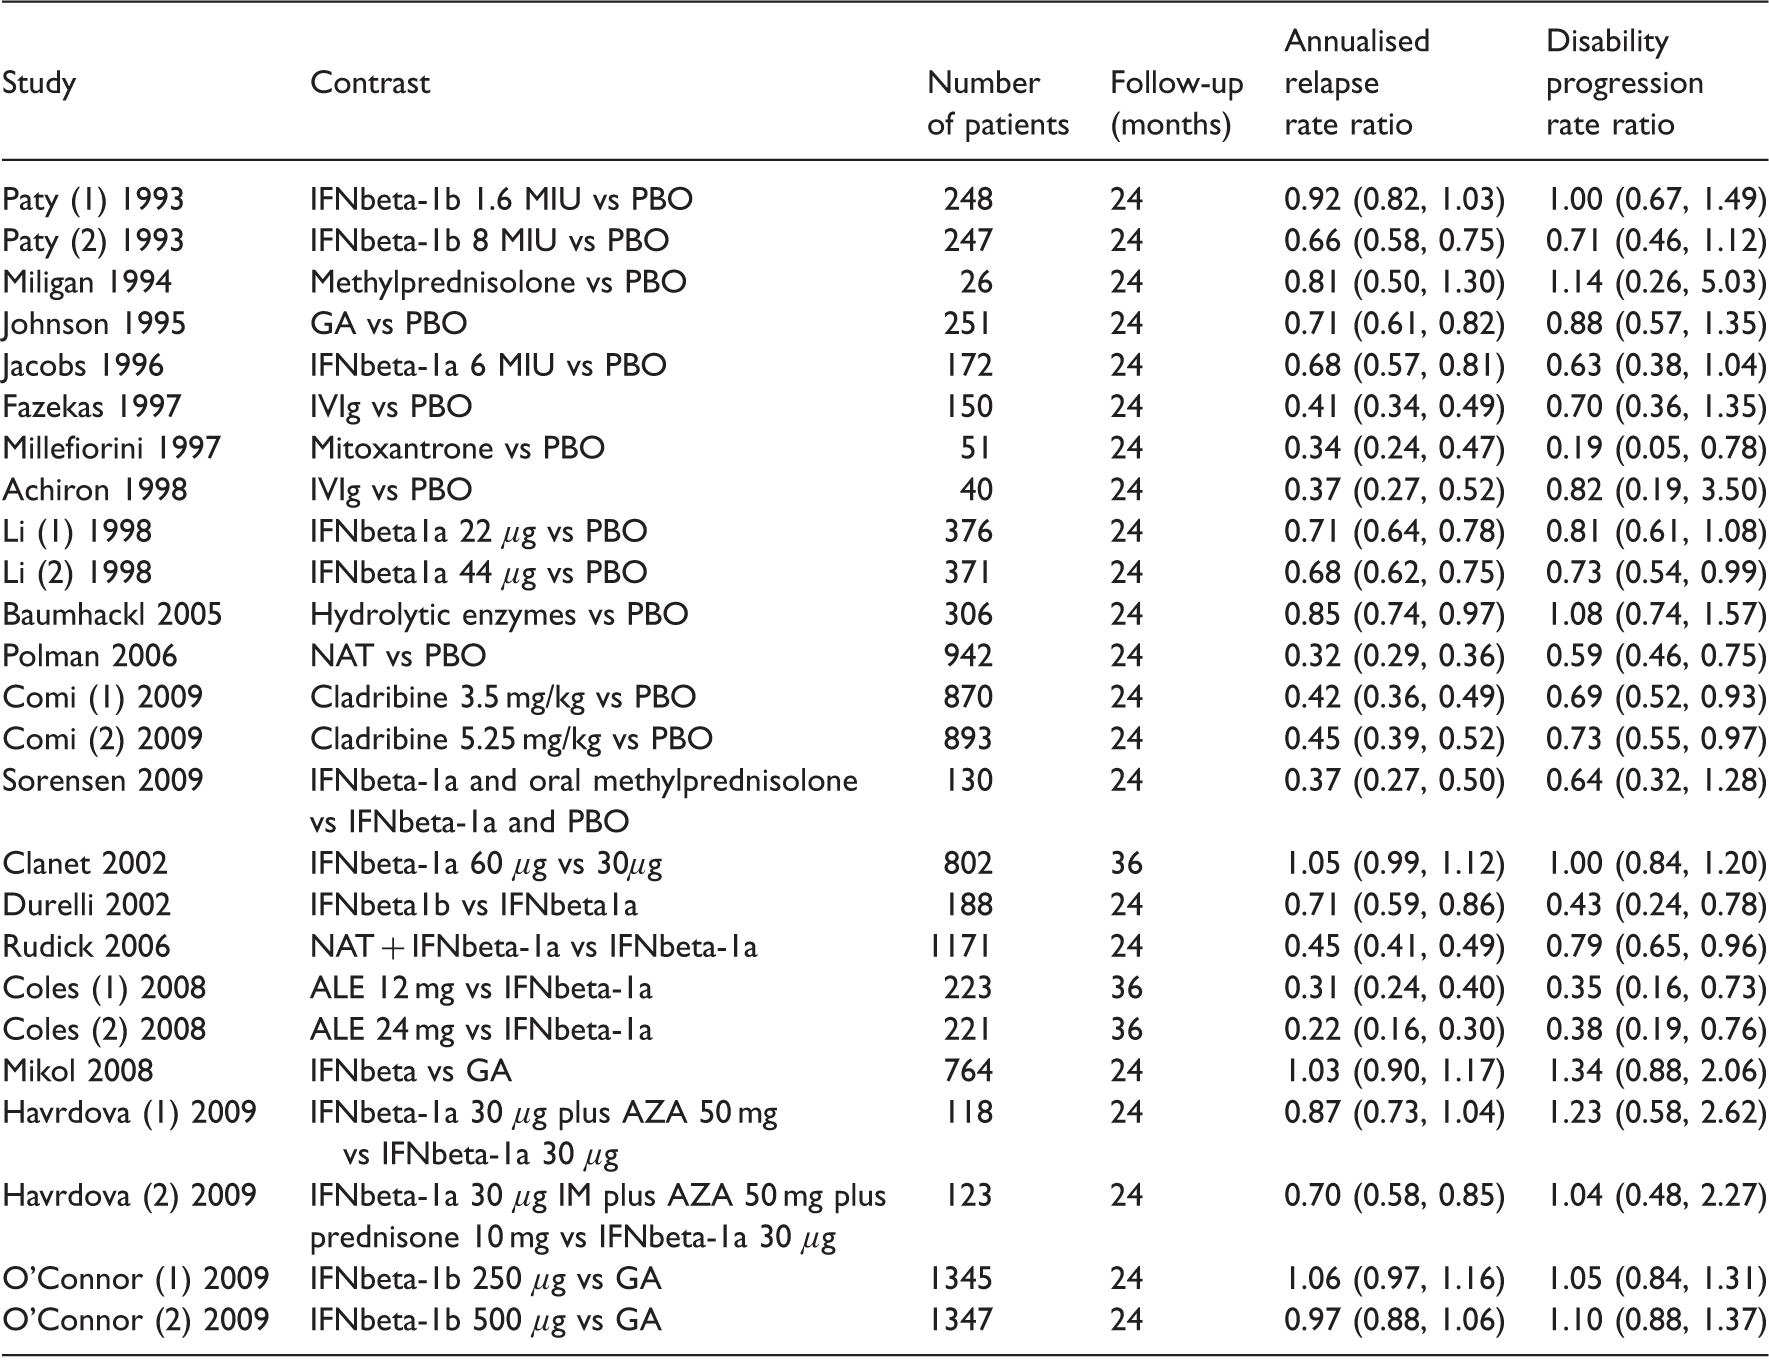
AZA: azathioprine; GA: glatiramer acetate; IFNβ: interferon-β; IVIg: IV immunoglobulin; PBO: placebo.
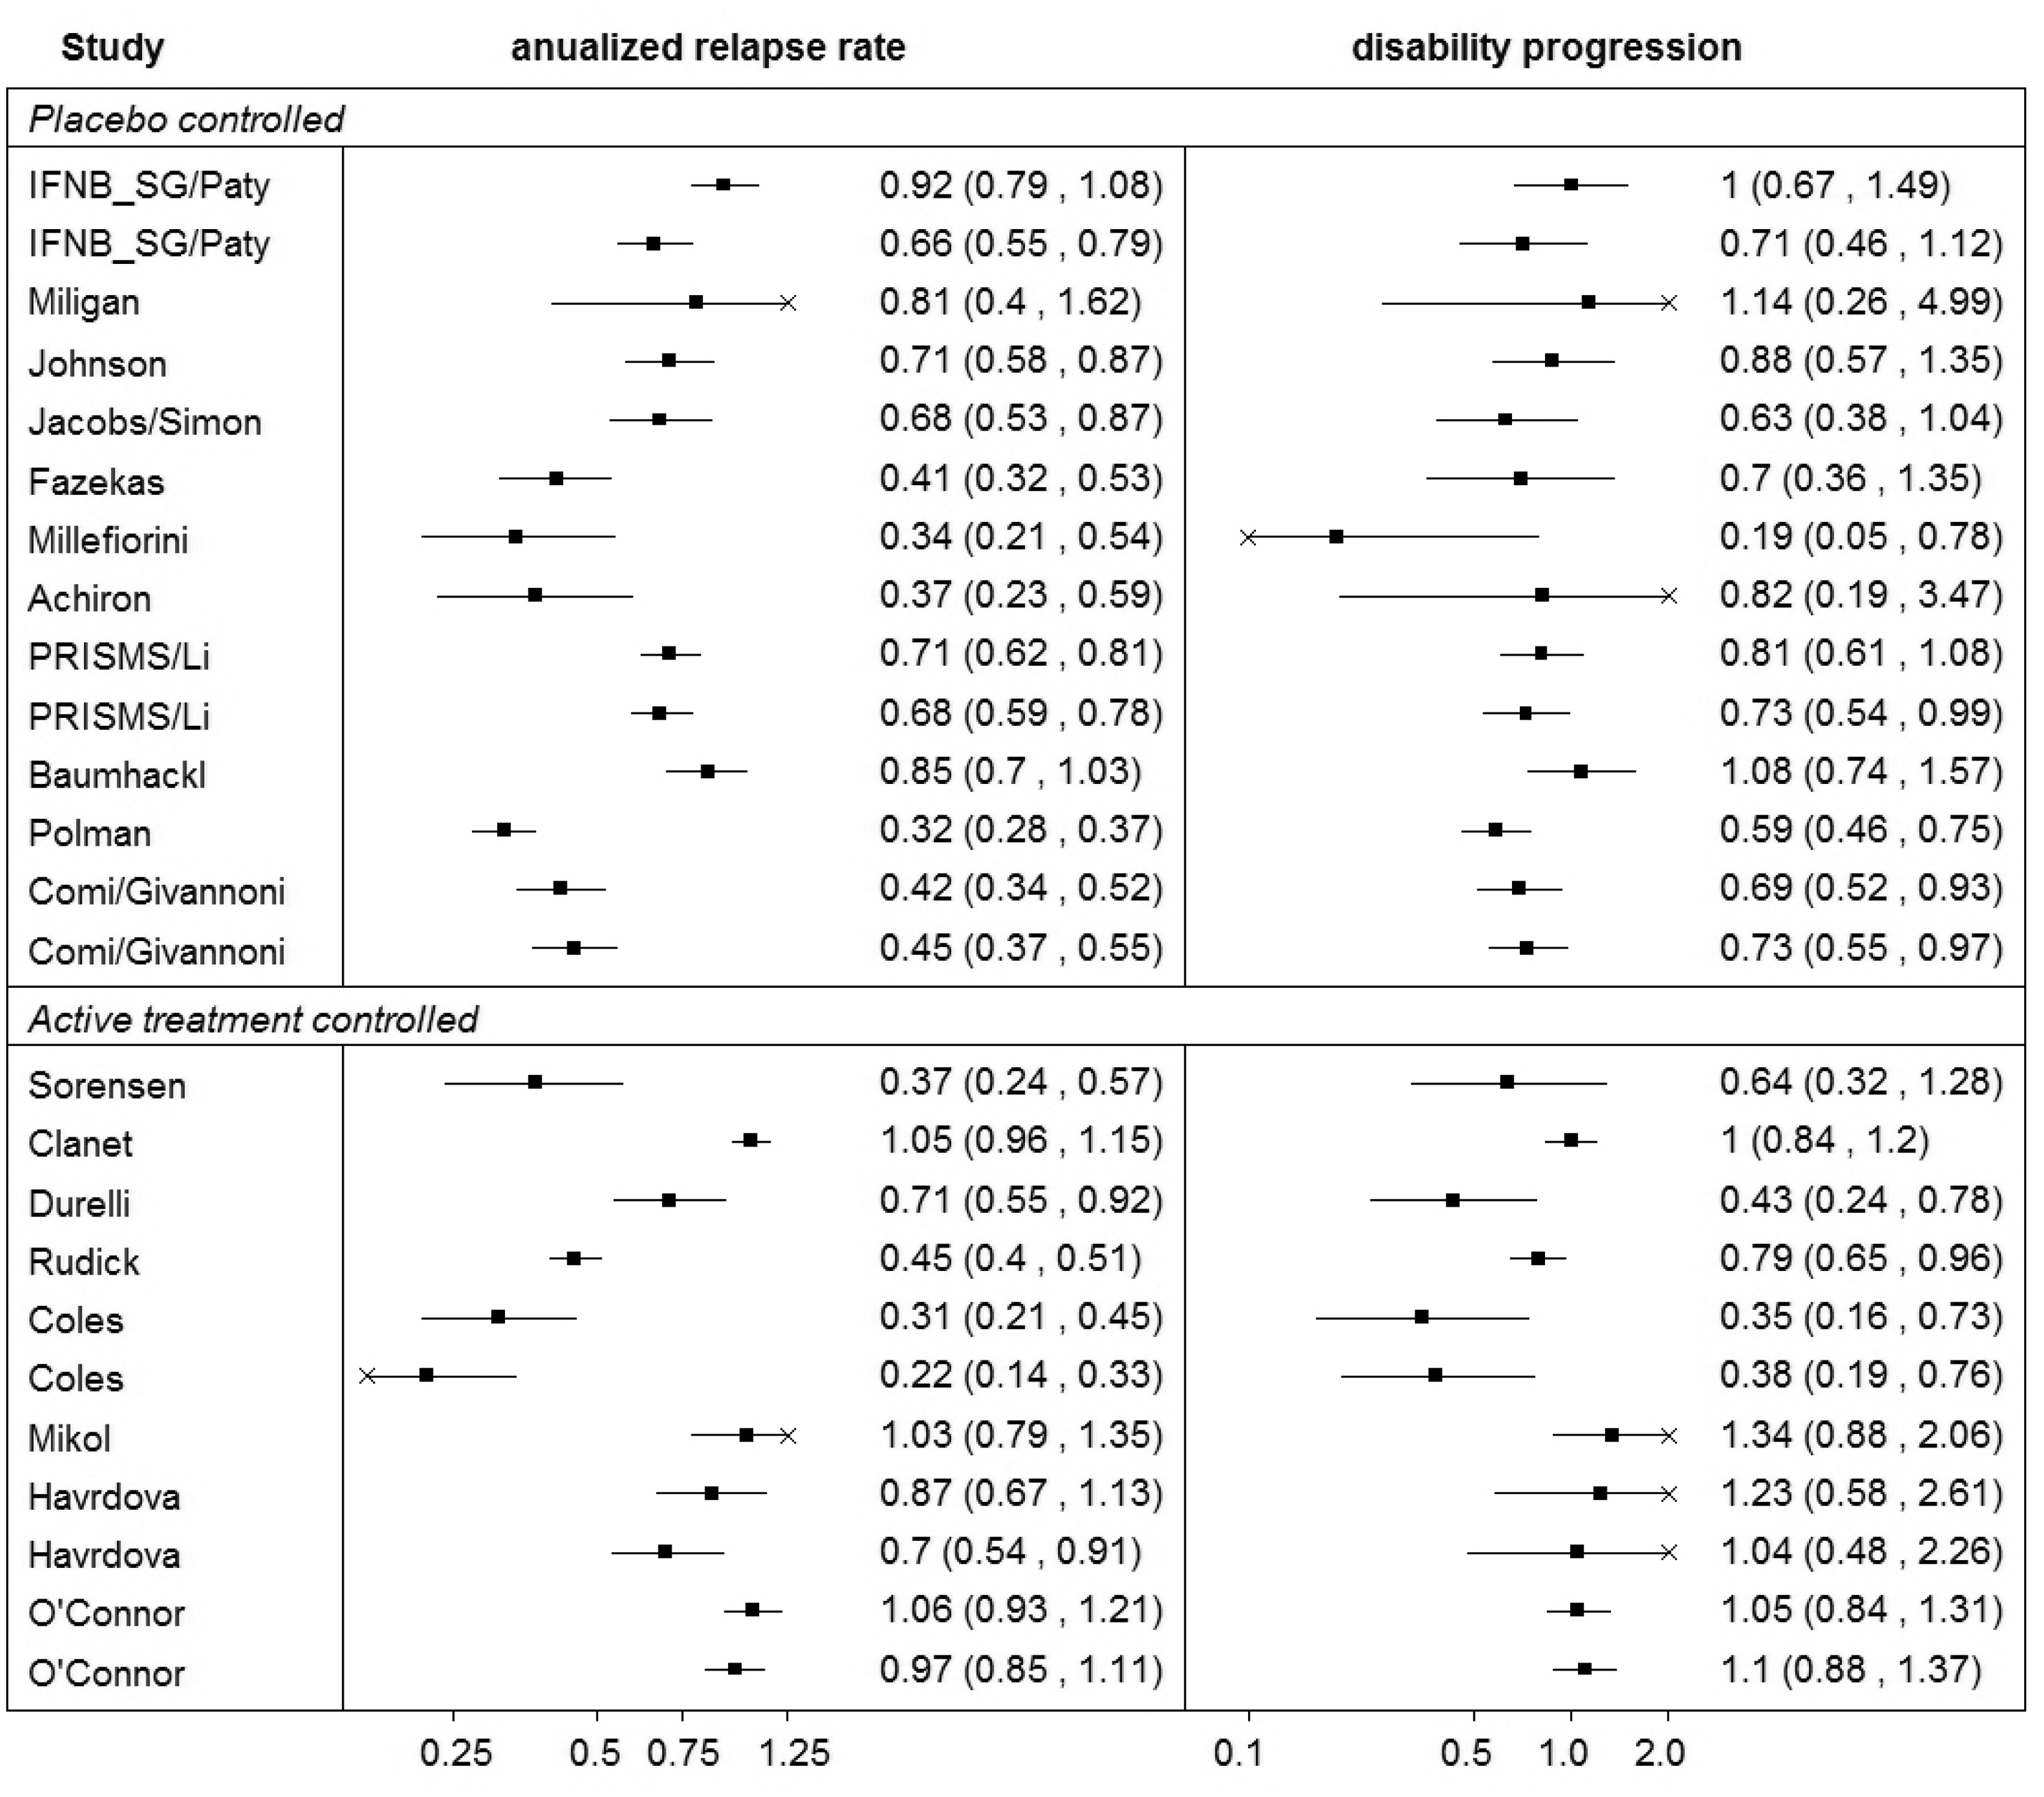
Summary of the ‘Sormani data’.
2.2 Gastric cancer
Oba et al. 10 investigated disease-free survival (DFS) as a surrogate endpoint for the overall survival (OS) in patients with curative gastric cancer. The study included randomised clinical trials that compared adjuvant chemotherapy with surgery alone. DFS was defined as the time to cancer recurrence, second cancer or death from any cause. DFS and OS hazard ratios were estimated with five years of follow-up.
Studies in the ‘Oba data’ reporting the hazard ratio measured by the disease-free survival (DFS) and overall survival (OS).
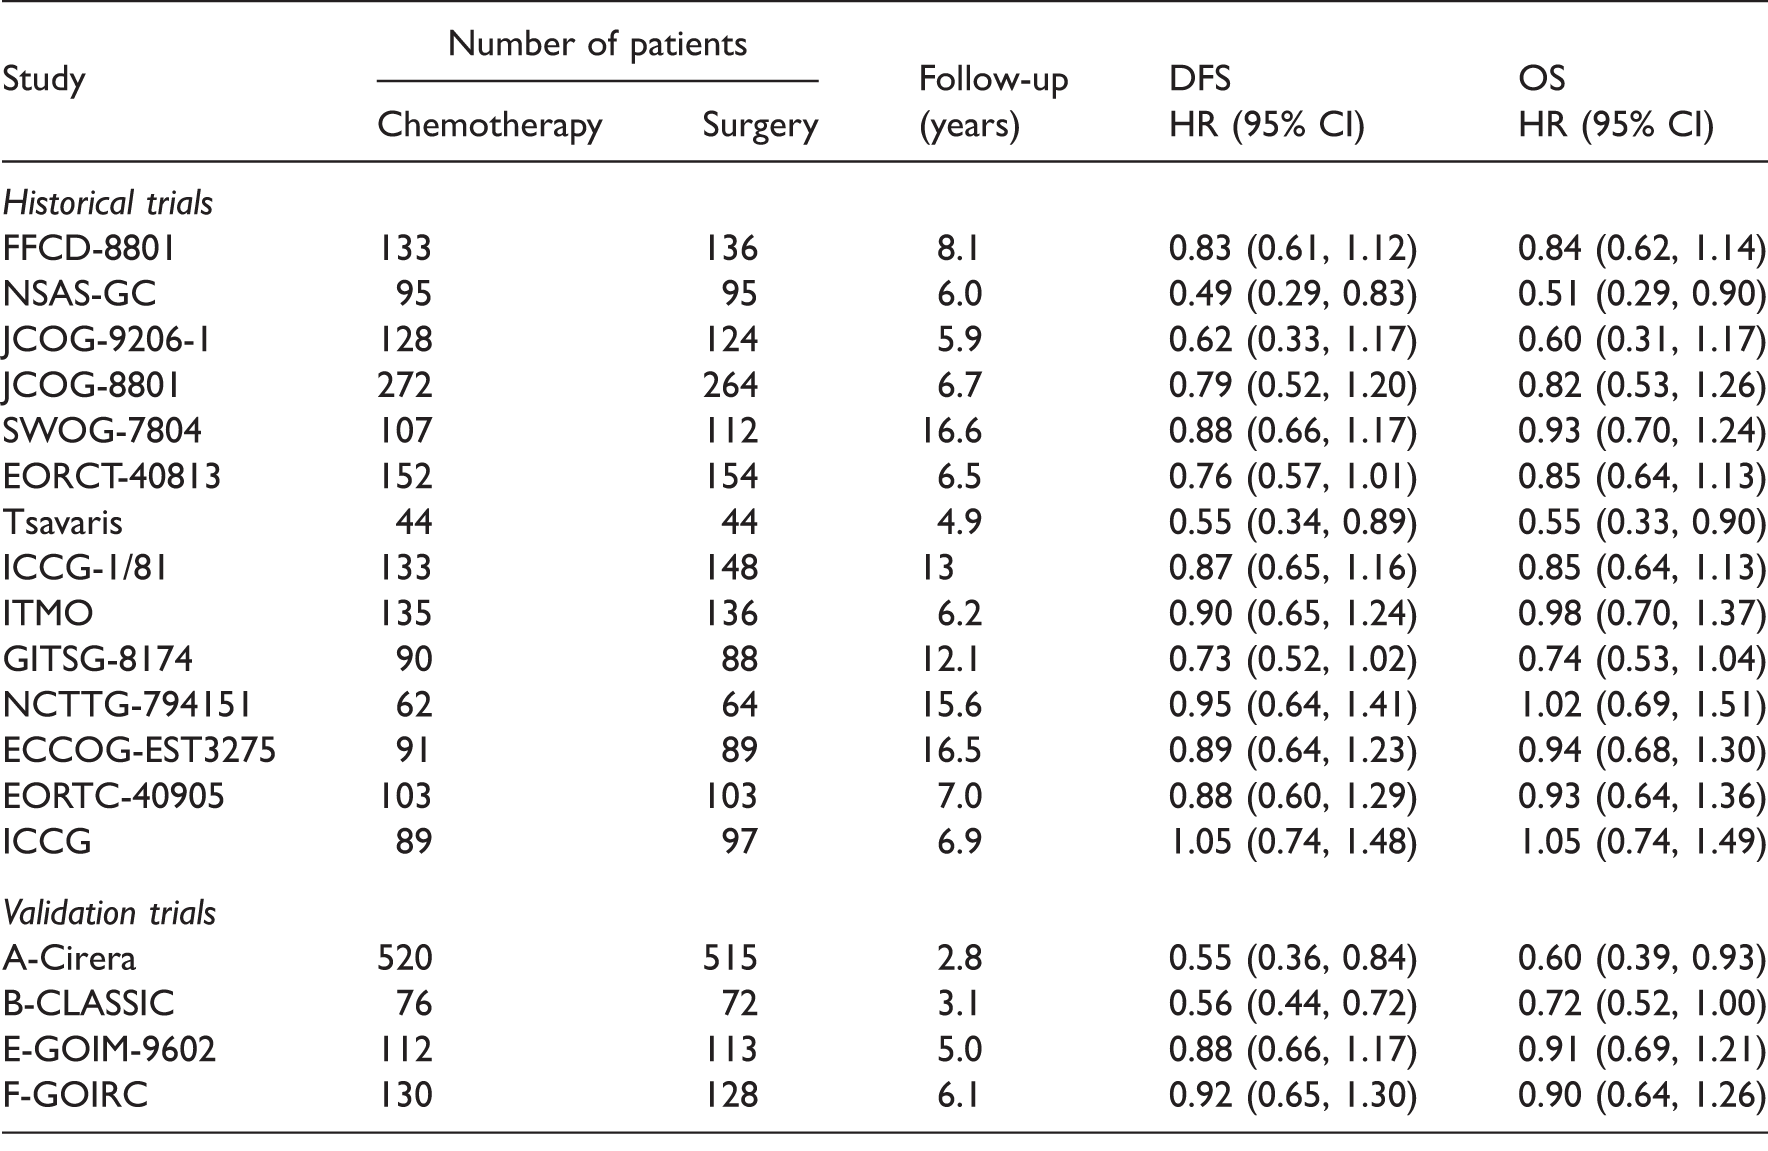
Details of chemotherapy regimens can be found in the supplementary material of Oba et al. 10
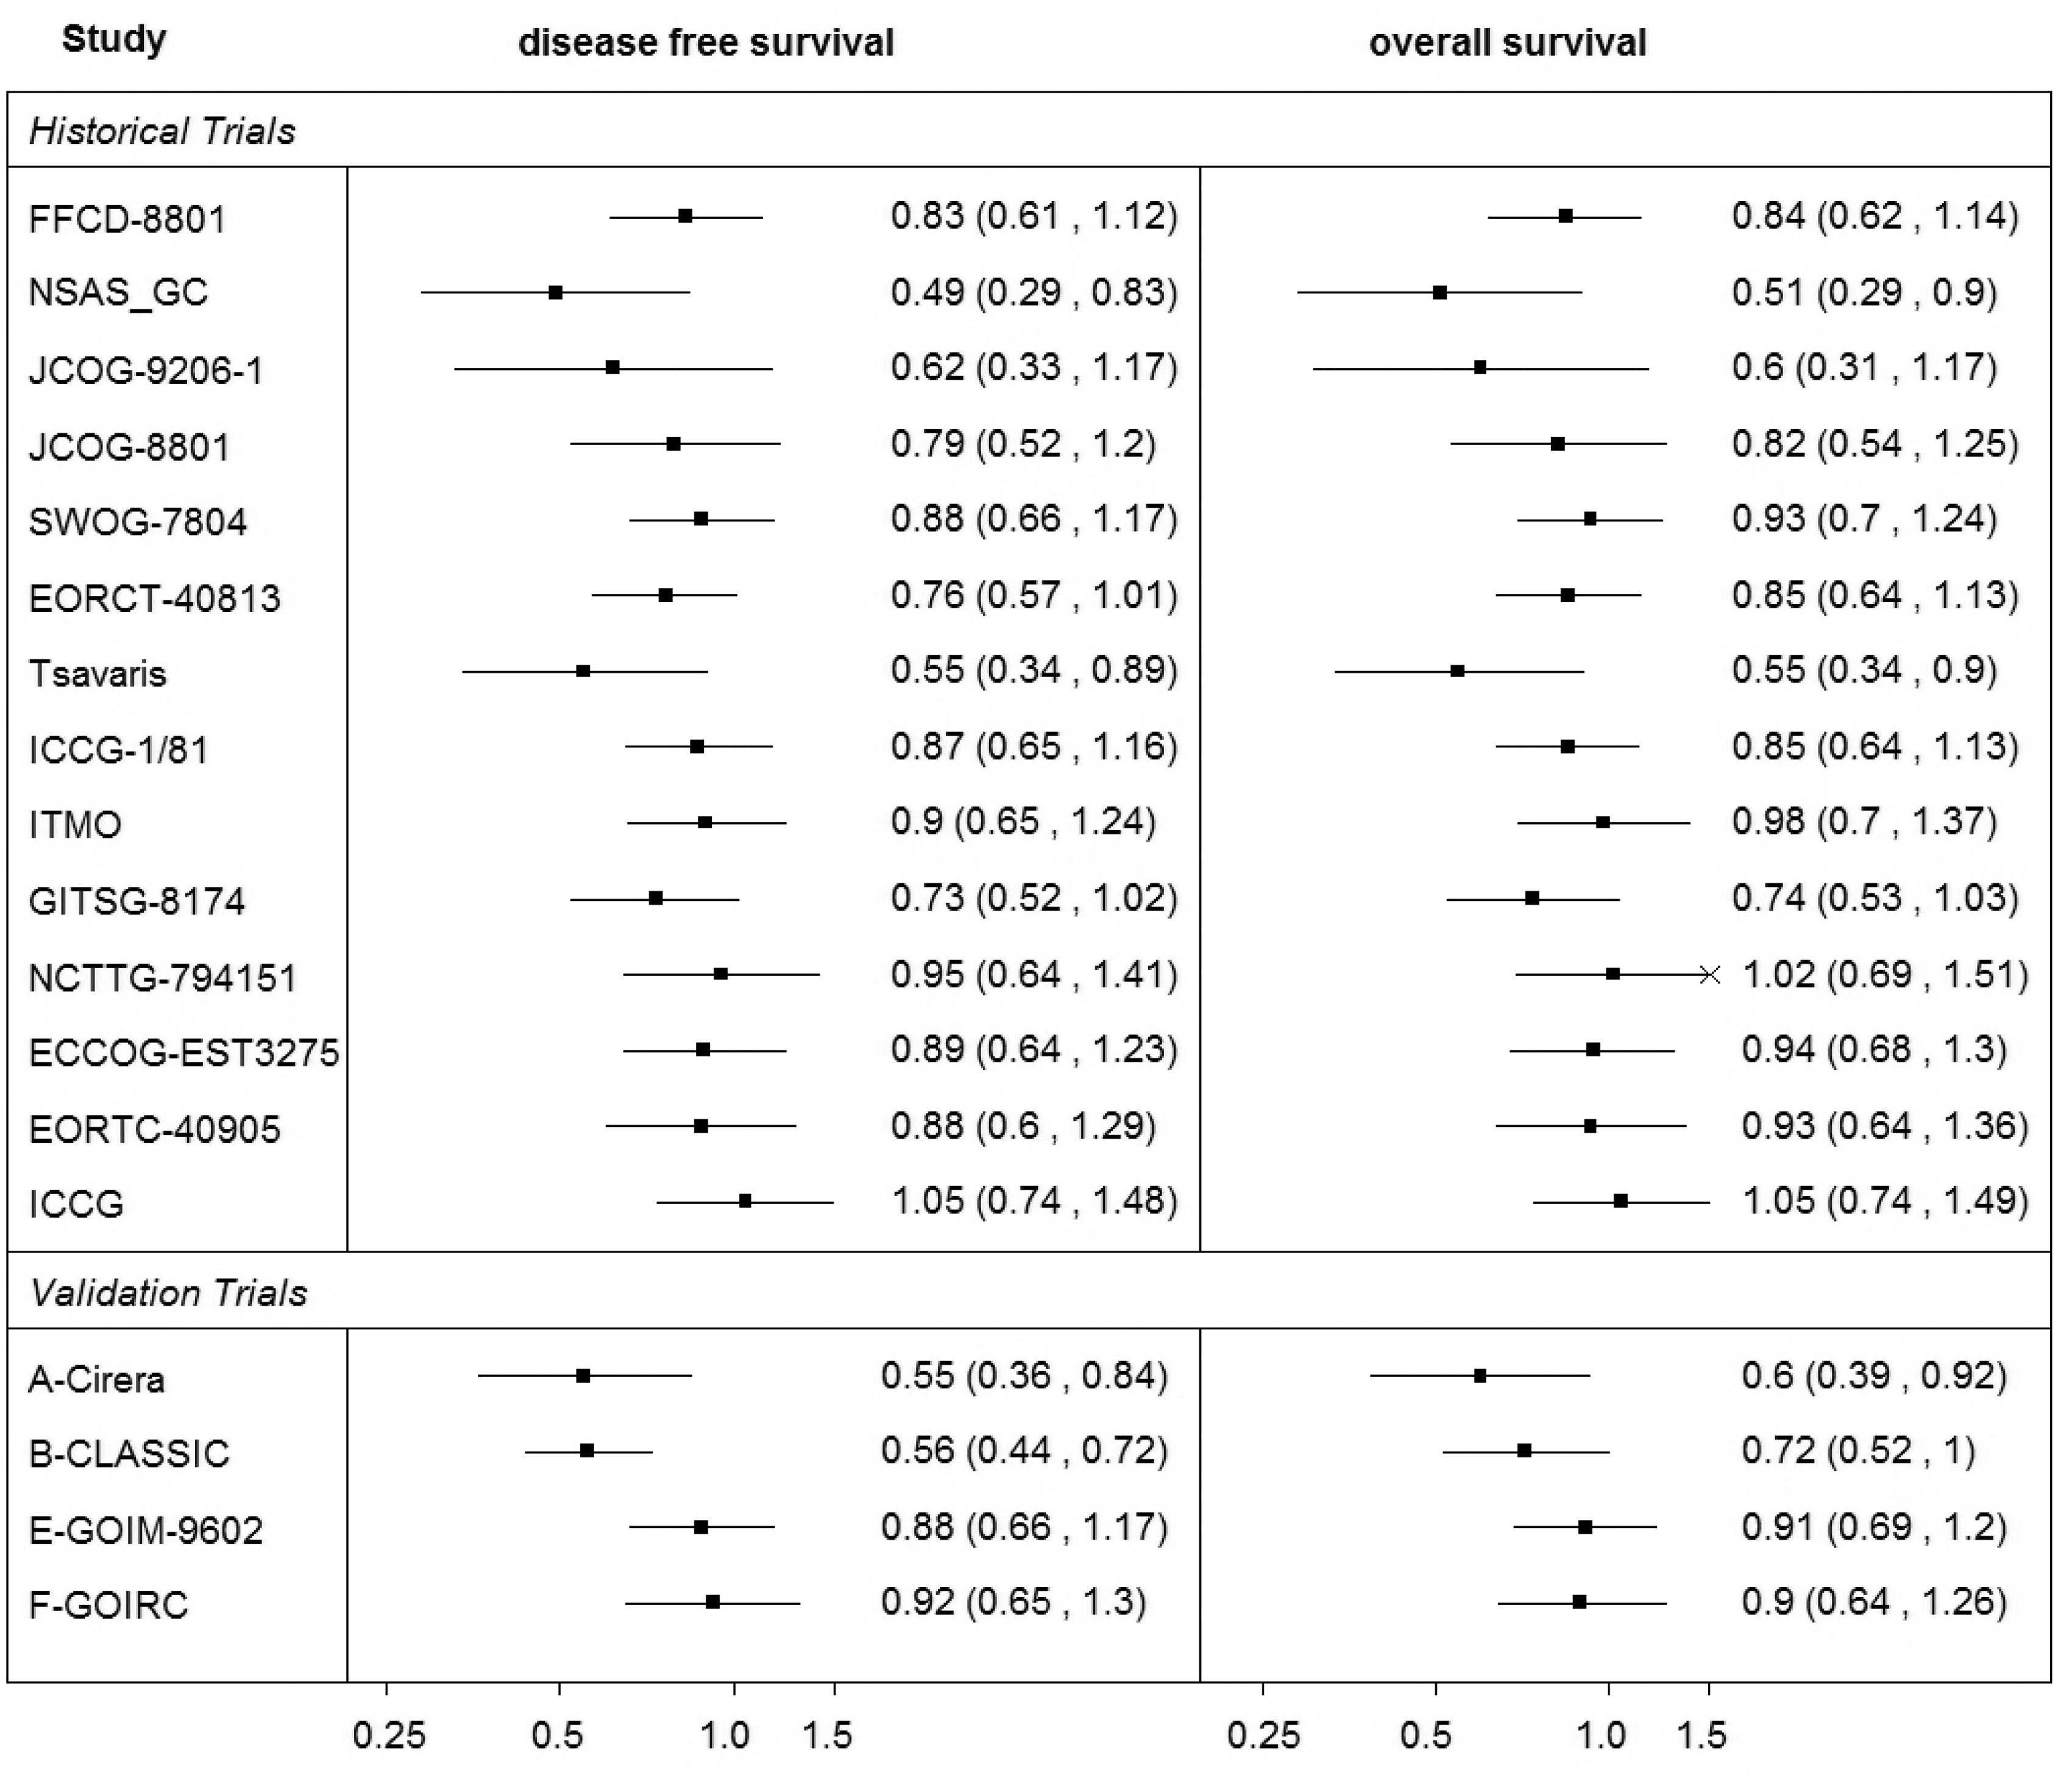
Summary of the ‘Oba data’.
3 Methods for evaluating surrogate endpoints
In this section, the technical details of the meta-analytic models are listed with emphasis on the use of such methods to predict a treatment effect measured by a target outcome of interest from the effect measured by a surrogate endpoint. The prediction is based on the association between the treatment effects on the two outcomes evaluated by a model developed based on the data in a ‘training set’, usually data from historical studies available for both outcomes from which a model ‘learns’ the relationship between them.
The methods in a Bayesian framework are described in Sections 3.1 to 3.4. To investigate the impact of the choice of parameterisation on the uncertainty around the predicted effects, we start with the simplest model allowing for a minimum variability, the FEMR. We then increase the allowed variability in the model by the use of random effects meta-regression (REMR) and further by introducing bivariate meta-analytic models which allow for the measurement error of the treatment effect on the surrogate endpoint. Sensitivity analyses to prior distributions and the distributional assumptions are discussed in Sections 3.5 and 3.6, respectively. Some frequentist approaches are then discussed in Section 3.7. Strategies for the validation of surrogate endpoints and model comparison are described in Section 3.8.
3.1 Meta-regression
3.1.1 Fixed-effects meta-regression
Linear or weighted regression models have been used to evaluate surrogate endpoints with regard to predictions,7,8 by including the treatment effect on a surrogate endpoint in the meta-analysis as a covariate. In the meta-analytic context, this approach can be described by the FEMR which in the Bayesian framework for normally distributed outcomes has the form
Having estimated the parameters λ0 and λ1, this model can be used to predict the treatment effect on the target outcome based on the observed treatment effect on the surrogate endpoint. If for a new study j, the observed treatment effect on the surrogate outcome is Y1j then, based on model (1), prediction is made using the regression equation
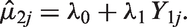
In this model, uncertainty around the predicted effect on the target outcome is related to the uncertainty around the intercept λ0, whereas the treatment effect on the surrogate endpoint is treated as a fixed covariate.
3.1.2 Random effects meta-regression
A REMR model can be used to evaluate surrogate endpoints.
17
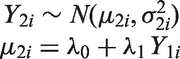
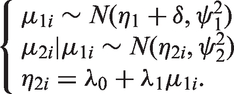
The model allows for between-study variability by assuming that the treatment effects Y2i estimate different underlying true effects μ2i (regardless of the value of the covariate) in each study i. In a Bayesian framework, meta-regression can be formulated as in Sutton and Abrams
18
in the following way using the random effects approach
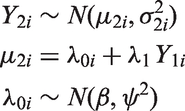
The prediction can be made by
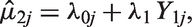
An alternative approach is also possible by centring the values of the effect on the surrogate, Y1i. In this case, the interpretation would change and the intercept would represent the true treatment effect on the final outcome at the average value of the effect on the surrogate endpoint. This approach could have an advantage when external information is available to construct an informative prior distribution to be placed on the intercept. Also, the centring of the effect on the surrogate may help to reduce the autocorrelation when conducting the MCMC simulation. However, for the purpose of predicting the effect for a new study, which is central to the evaluation of surrogate endpoints, the effect would have to be ‘un-centred’.
WinBUGS code corresponding to this model is included in Appendix 1.1.
3.2 Meta-analysis by Daniels and Hughes
In a model proposed by Daniels and Hughes,
6
the estimates of the treatment effects measured by the surrogate endpoint Y1i and the target outcome Y2i are assumed to come from a bivariate normal distribution and they estimate the underlying true effects on the surrogate and target outcomes μ1i and μ2i, respectively, from each study i with corresponding within-study standard deviations σ1i and σ2i and within-study correlation ρ
wi
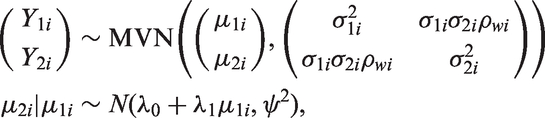
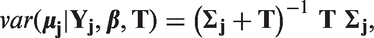
In this model, estimates of the treatment effects on both the target as well as the surrogate endpoints are treated as response variables and therefore the uncertainty around the treatment effect on the surrogate outcome is taken into account in this model. If for a study j the observed treatment effect on the surrogate outcome is Y1j, then the treatment effect on the target outcome Y2j can be predicted from the model by assuming that this outcome is missing at random. By assuming that the two effects are correlated and follow a common bivariate distribution, the missing effect (on the target outcome in this case) is estimated automatically by the MCMC simulation, from the model which takes into account the correlation between the effects on the two outcomes. WinBUGS code for this model is listed in Appendix 1.2.
3.3 Bivariate random effects meta-analysis (BRMA)
Bivariate meta-analytic methods have been proposed for joint modelling of correlated outcomes12,19 and included approaches in a Bayesian framework.20,21 BRMA is discussed here in the form described by van Houwelingen et al.
12
and Riley et al.,
13
where estimates of treatment effect on both outcomes Y1i and Y2i are assumed to be normally distributed

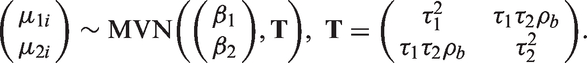
In this model, the treatment effect on the surrogate endpoint Y1i and the treatment effect on the target outcome Y2i are assumed to estimate the correlated true effects μ1i and μ2i with corresponding within-study variances
As in the model (5) by Daniels and Hughes, the treatment effect on the target outcome in a study j can be predicted from the treatment effect on the surrogate endpoint observed by this study, by assuming that the effect on the target outcome is missing at random and assuming exchangeability of the treatment effects. In contrast to model (5), the BRMA model allows an estimation of the pooled effects measured by both outcomes (rather than only the pooled effect of the target endpoint in equation (5) which is only possible when centring the effect on the surrogate outcome on the mean). Although the ability to estimate the pooled effect does not impact on the validation process, it can be advantageous when modelling treatment effects on surrogate and target outcomes jointly to combine all available evidence in the assessment of the effectiveness. However, to make it possible, stronger distributional assumptions about the true effects are made in this model in comparison with model (5). WinBUGS code for this model is listed in Appendix 1.3.
3.4 BRMA in product normal formulation (BRMA PNF)
The BRMA models (6) and (7) can be parameterised in an alternative form where instead of placing a prior distribution on the between-study covariance matrix as a whole, the between-study model (7) is represented in the PNF14,23 (a product of univariate conditional normal distributions), whereas the within-study model remains the same

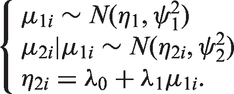
The PNF provides better control over the prior distributions placed on specific parameters of the model (compared to BRMA with Wishart prior distribution), helping to ensure that they are non-informative when this is required or allowing for informative prior distributions, based on external evidence, to be placed directly on the desirable parameters of the model. 14 WinBUGS code corresponding to this model is included in Appendix 1.4.
3.5 Sensitivity analysis: Prior distributions
When investigating the impact of parameterisation and the related uncertainty on the precision of the predicted estimates, we carried out sensitivity analysis using a range of prior distributions for the heterogeneity parameters (ψ in meta-regression and model by Daniels and Hughes and Prior I: Prior II: Prior III: Prior IV:
Other examples of non-informative prior distributions can be found in the simulation study by Lambert et al.
24
Sensitivity analysis was also carried out to investigate the impact of the choice of the parameters of the inverse Wishart prior distribution on the implied prior distributions for the heterogeneity parameters (while maintaining the implied uniform prior distribution on the between-study correlation). Wishart prior distributions with the following parameters were tested:
Wishart A: Wishart B:
Figure 3 shows the prior distributions for the standard deviations overlayed (distributions I, II and IV used directly and distributions obtained from priors III, Wishart A and B by transformation on the standard deviation scale). Prior distributions I–III have large variances and hence are non-informative. The uniform prior distribution IV is locally non-informative on the scale of the modelled data. The implied prior distributions on the standard deviations obtained from the Wishart distributions placed on the between-study precision matrix are both quite informative (as mentioned above, the corresponding implied distribution on the between-study correlation is uniform on the range of values between –1 and 1).
Prior distributions for the standard deviations used in the sensitivity analysis.
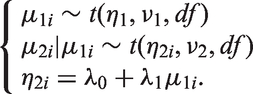
3.6 Sensitivity analysis: Relaxing the normality assumption
The methods considered here are models with random effects to reflect the assumption that the modelled treatment effects are different between the studies. The differences in the effects may be due to the varying populations, different treatments under investigation in those studies or perhaps heterogeneity in the definitions of the outcomes. 25 Typically, the normal distribution of the between-study random effects is assumed to reflect the similarity of the effects. The assumption that the true treatment effects on both outcomes (such as log relative risk and log rate ratio for the example in RRMS or log hazard ratio on OS and DFS in gastric cancer) are normally distributed may, however, not always be reasonable. When dealing with departures from normality of the modelled data, this assumption can lead to limitations of modelling and restricted inferences. 26 For example, as discussed by Marshall and Spiegelhalter, inadequate use of normality assumption about the random effects may lead to ‘overshrinkage’ of the true effects and hence to misleading inferences. 27
One way of relaxing this assumption is to use a t-distribution as recommended, for example, by Lee and Thompson
26
or Smith et al.
28
In contrast to the normal distribution, the t-distribution gives more weight in the tails which is more likely to be better at modelling extreme effects such as outlying observations.
27
We apply the t-distribution to the random effect in the BRMA model by adapting its PNF form. In the product of t-distributions formulation (PTDF), the between-study model can be formulated as
3.7 Frequentist approaches
The above models for evaluation of surrogate endpoints differ in the way they take into account the uncertainty around the model parameters. The Bayesian framework gives a flexible environment for modelling of uncertainty. Some of the models, however, can be also implemented in a frequentist approach using software such as, for example, Stata. To compare the different degrees of uncertainty allowed by different frequentist models, two models are compared here: the meta-regression and the bivariate meta-analysis.
3.7.1 Meta-regression
Suppose Y1i is the estimate of the treatment effect on the candidate surrogate outcome and Y2i represents the estimate of the treatment effect on the target outcome with corresponding within-study variance v2i in study i (
3.7.2 Bivariate meta-analysis
As in the Bayesian framework, the random effects bivariate meta-analysis can be described in the hierarchical framework


Stata code for the model predictions using the meta-regression and the BRMA is included in Appendix 1.6.
3.8 Cross-validation procedure and model comparison
Evaluation of surrogate endpoints on the study level, assessing whether the treatment effect on the final outcome can be predicted from the treatment effect on the surrogate endpoint, can be carried out by the take-one-out approach in the cross-validation procedure, as described by Daniels and Hughes. 6 This procedure aims to establish goodness of fit of the meta-analytic prediction model. In each study the effect on the final outcome is assumed unknown (in one study at a time) and it is then predicted from the effect on the surrogate endpoint, conditional on the data on the treatment effects on both outcomes from the remaining studies and the parameters of the model.
Ultimately we want to draw inferences about predicting the true effect on the final outcome μ2j in a future study j. However, in a real data scenario (as opposed to simulated data) we do not know what the true effect is. Hence for the purpose of the cross-validation, we predict the ‘observed estimate’
To investigate the impact of the uncertainty on predictions, we compare the models with respect to the predicted intervals. To compare how the choice of parameterisation affects the uncertainty of predictions, we compare the widths of the intervals of the predicted
4 Results
4.1 Results from Bayesian models: multiple sclerosis
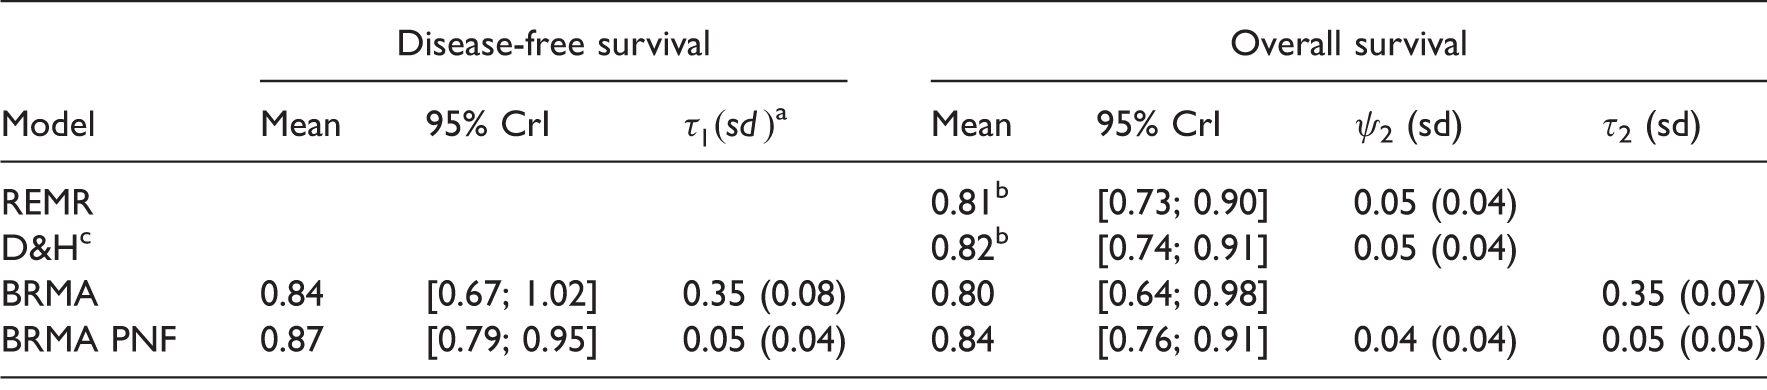
Summary results for placebo-controlled studies for the treatment effects on the risk of disability progression and relapse rate ratio.
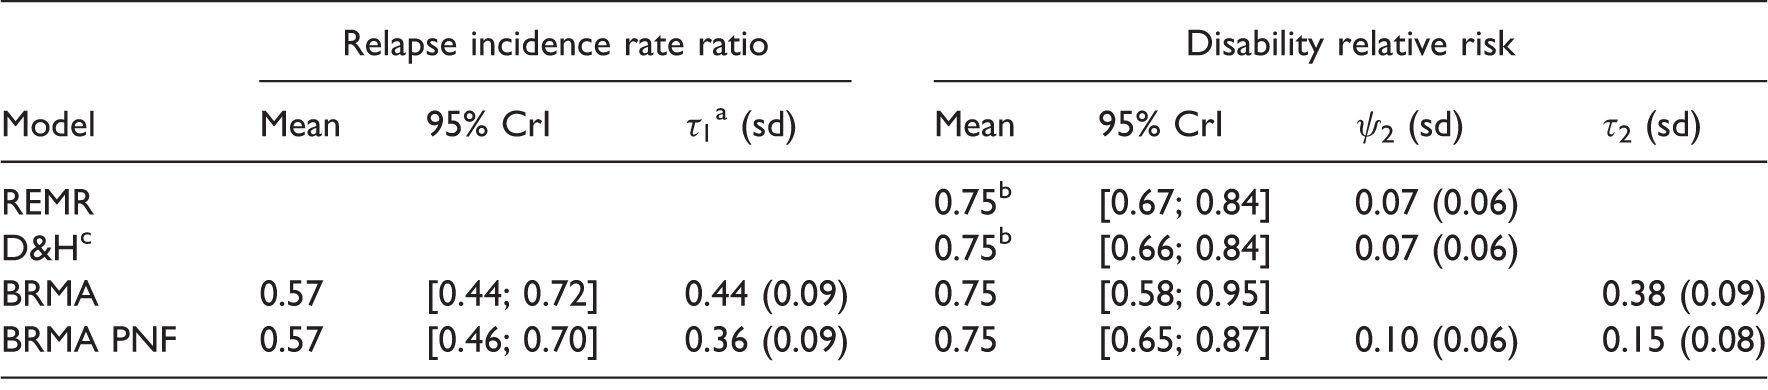
Obtained by centring the effects on surrogate endpoint on the mean. cD&H refers to the model by Daniels & Hughes.
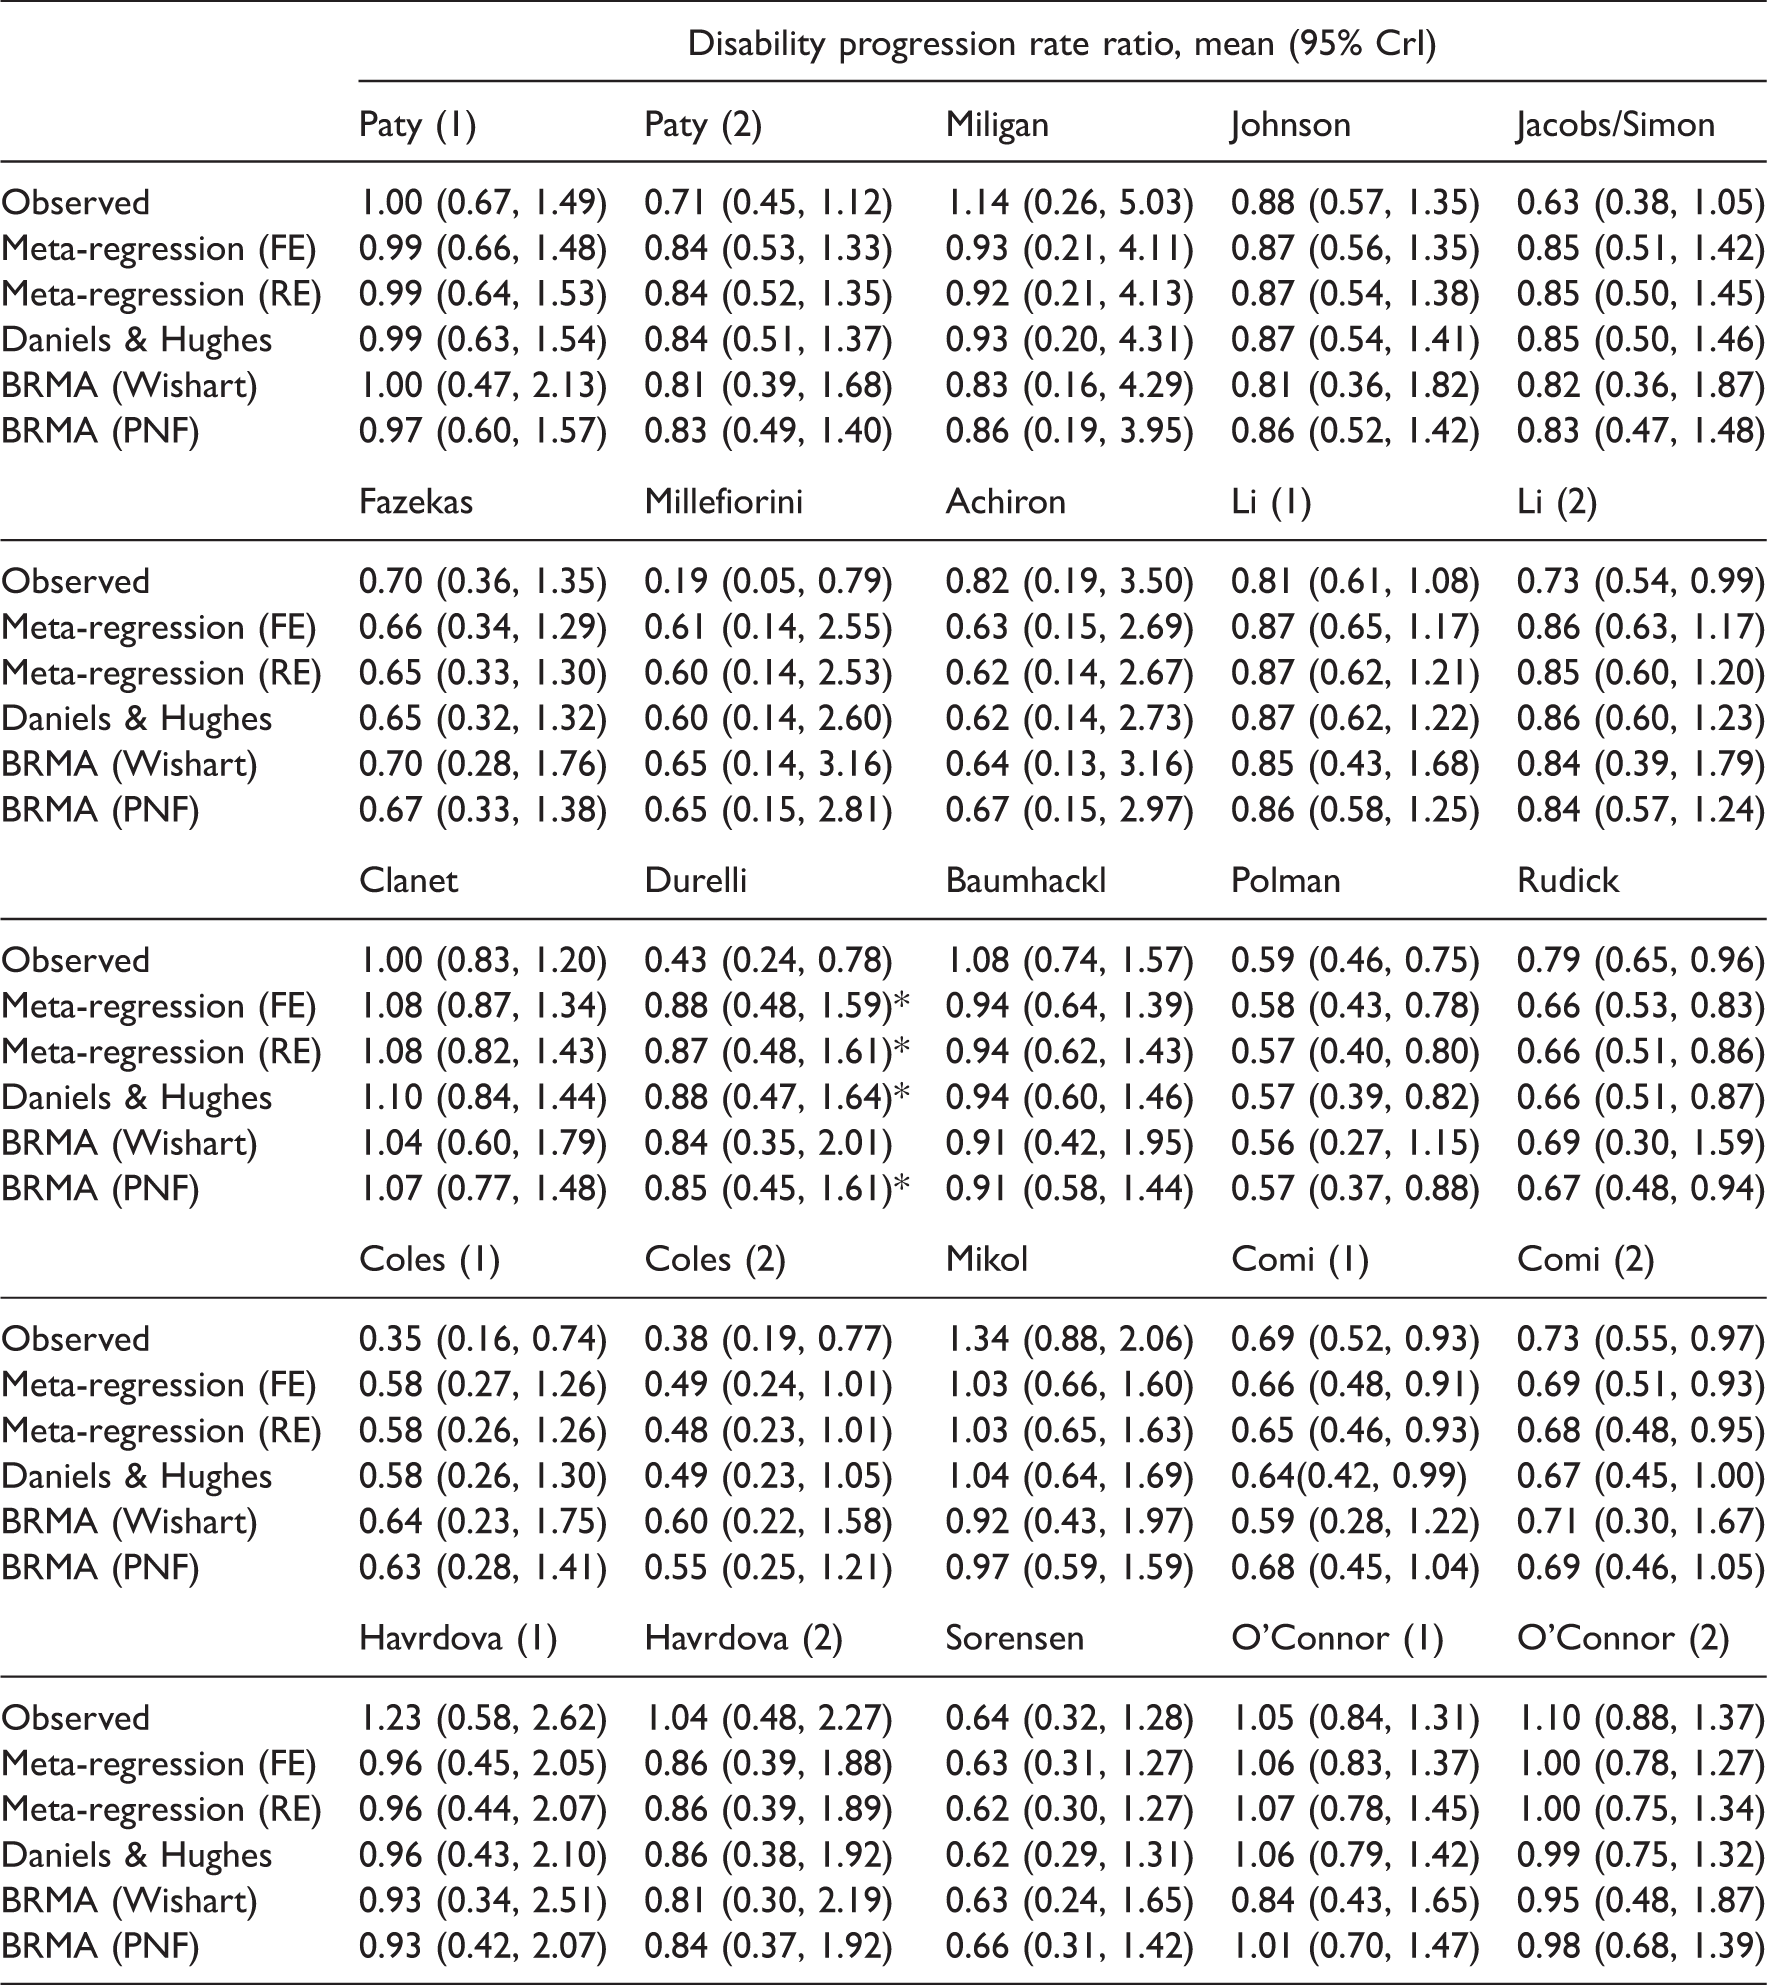
All four models were then applied to make predictions in a cross-validation procedure. The treatment effect on the final outcome (disease progression rate ratio) in the 25 studies was assumed unknown (in one study at a time which in that case became a validation study) and then predicted from the surrogate endpoint (relapse rate ratio) by each model.
Predictions obtained from all models for all studies in the ‘Sormani data’.
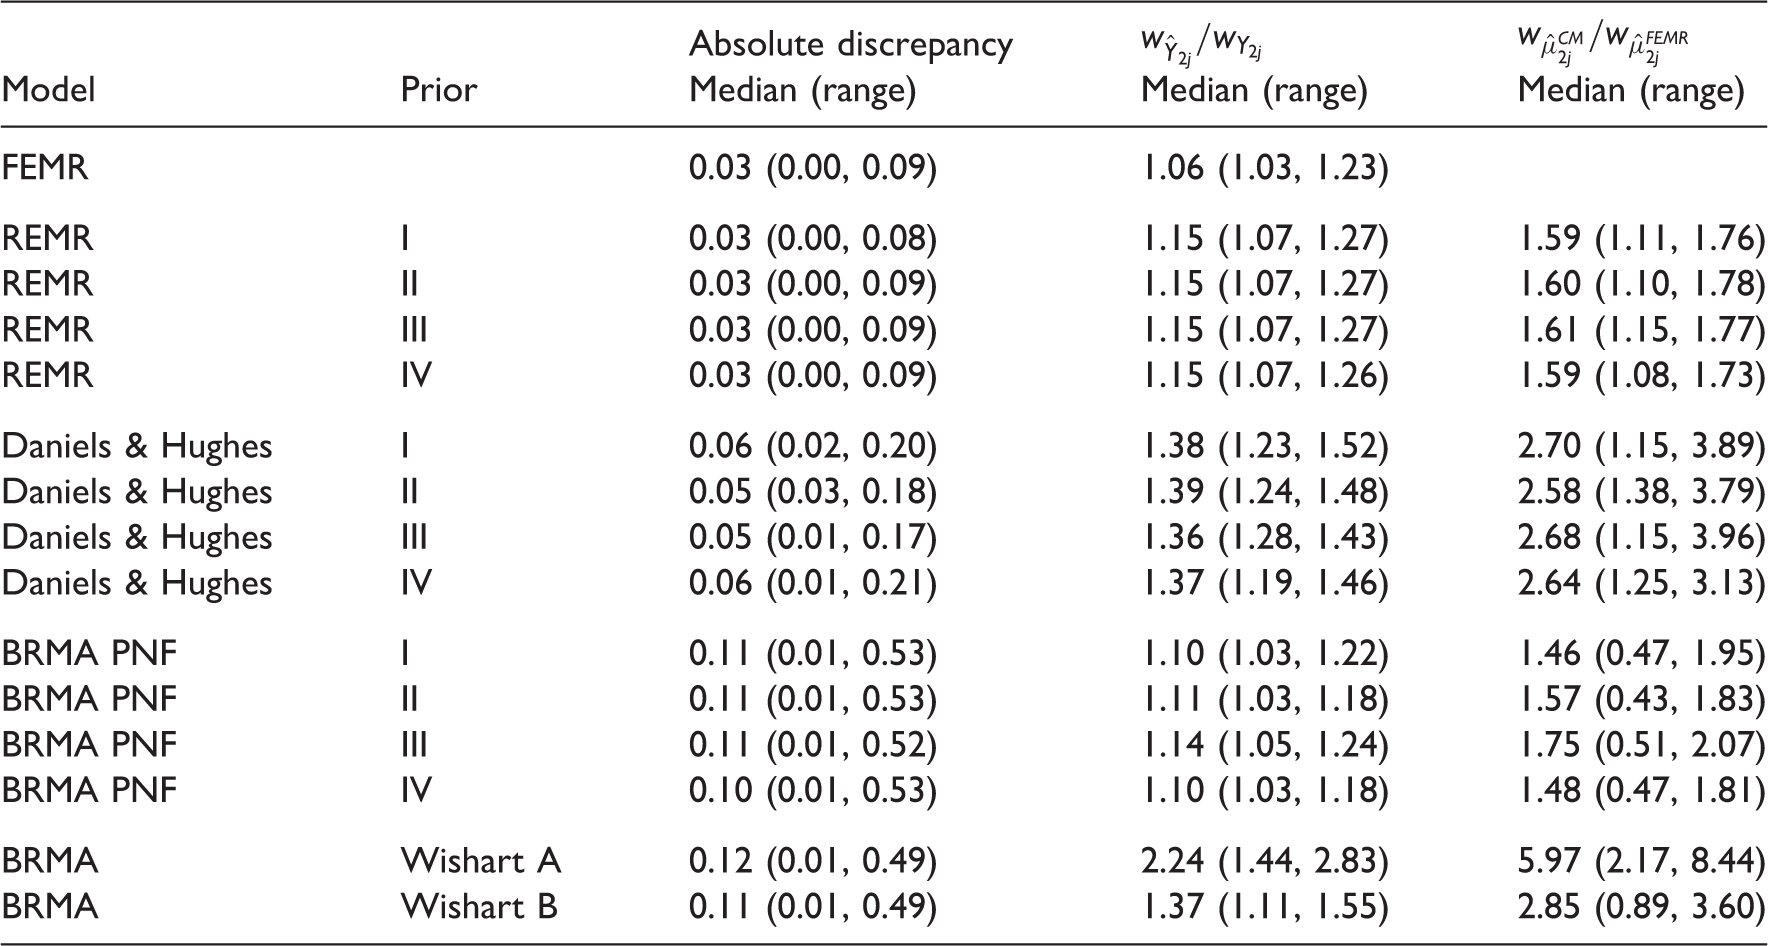
Results of the comparison of the models for predicting the treatment effect on disability progression from the treatment effect on relapse rate.
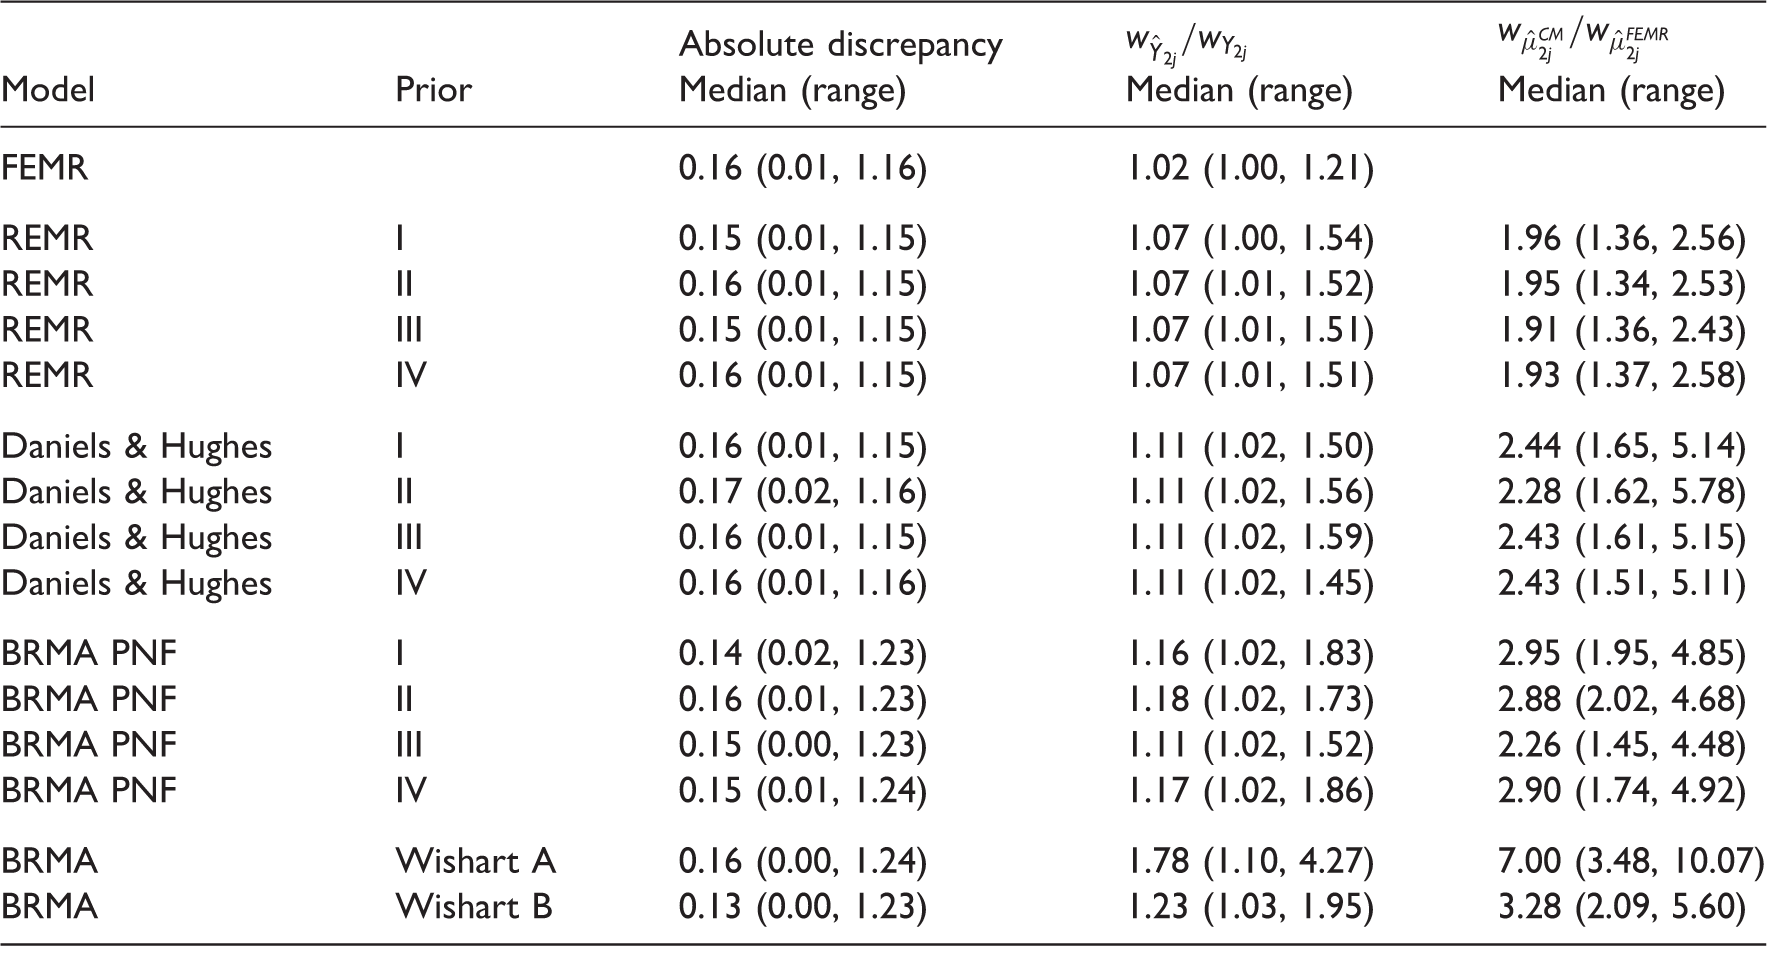
CM: current model in each row.
The accuracy of predictions for the point estimate was similar across models, but the uncertainty around the predicted effects varied depending on the parameterisation. Using the meta-regression equation (2) the effect on the target outcome was predicted with much increased precision compared to other models. For example, when using prior distribution I the interval for the predicted true effect
The results suggest that prediction of true effects obtained from the FEMR (and potentially also REMR) can be overly optimistic and artificially precise, likely with intervals not containing the true value, due to underestimated between-study variability and the measurement error corresponding to the treatment effect on the surrogate endpoint (relapse rate ratio in this case). However, the success of the prediction may also be affected by the strong assumptions about the distribution of the data made in the models, such as for example exchangeability assumption in BRMA PNF. To investigate this further, a simulation study was conducted which is presented in Section 5.
4.1.1 Discussion of the results for RRMS
Based on our results we cannot conclude that relapse rate is a good surrogate for disability progression as the prediction did not give good results for all of the studies (it failed for the study by Durelli using all methods apart from the BRMA with Wishart prior (A) which largely inflated the variance of predictions). The study by Durelli differs from the rest of the set in that the effect on the disability progression is much larger than the effect on the relapse rate, with the ratio of the relative effects on those outcomes (the effect on progression to the effect on relapse) equal to 0.6. In most of the remaining studies, this ratio is usually higher than 1.0 (it ranges between 0.94 and 2.16) owing to the fact that disability progression is a longer term outcome and the effect measured on this outcome at the same follow-up time as the effect on the relapse rate will be less due to relatively few events occurring for this outcome on this time scale. The only other study with that ratio below one was the study by Millefiorini, with the ratio of 0.56. The cross-validation did not fail for this study likely because it is a small study with estimates of the treatment effects on both outcomes having large variances (included in the predicted intervals for the cross-validation).
In the Millefiorini study, the patients were relatively young compared to the other studies with a relatively high baseline disability score which can explain the extreme treatment effect on disability of the mitoxantrone relative to the effect of the placebo. The baseline relapse rate was more representative of other studies and hence the effect on this outcome was less extreme (albeit still substantial). There does not seem to be anything, however, in the population of the study by Durelli that would explain the opposite relationship in the magnitude of the effects on the two outcomes. The patients were slightly older compared to other studies and the average baseline disability score was relatively low. This may suggest that the treatment effect on annualised relapse rate may not be a perfect predictor of the effect on the disability progression rate. However, the predictions overwhelmingly worked for the remaining studies which would encourage further research. Note that the effect on the final outcome in the data set investigated here is measured at the same time point as the effect on the surrogate endpoint. Since the disability progression is considered a long-term endpoint, when measured early it is measured with a relatively large uncertainty due to low number of events. Further research is required to establish whether the relapse rate is a good surrogate endpoint and in particular an early marker of disability progression. Such further research should include disability progression reported later compared to relapse rate, but potentially also consider both outcomes on alternative scales such as the hazard ratio for the time to disability progression. Sormani et al. already point out the limitations of using the summary data alone to evaluate the surrogate outcomes. To properly establish the surrogacy, outcomes on an individual level need to be investigated ideally based on data from all of the clinical trials.
4.2 Results from Bayesian models: Gastric cancer
Summary results for treatment effect on overall survival and disease-free survival.
Obtained by centring the effects on surrogate endpoint on the mean. cD&H refers to the model by Daniels & Hughes.
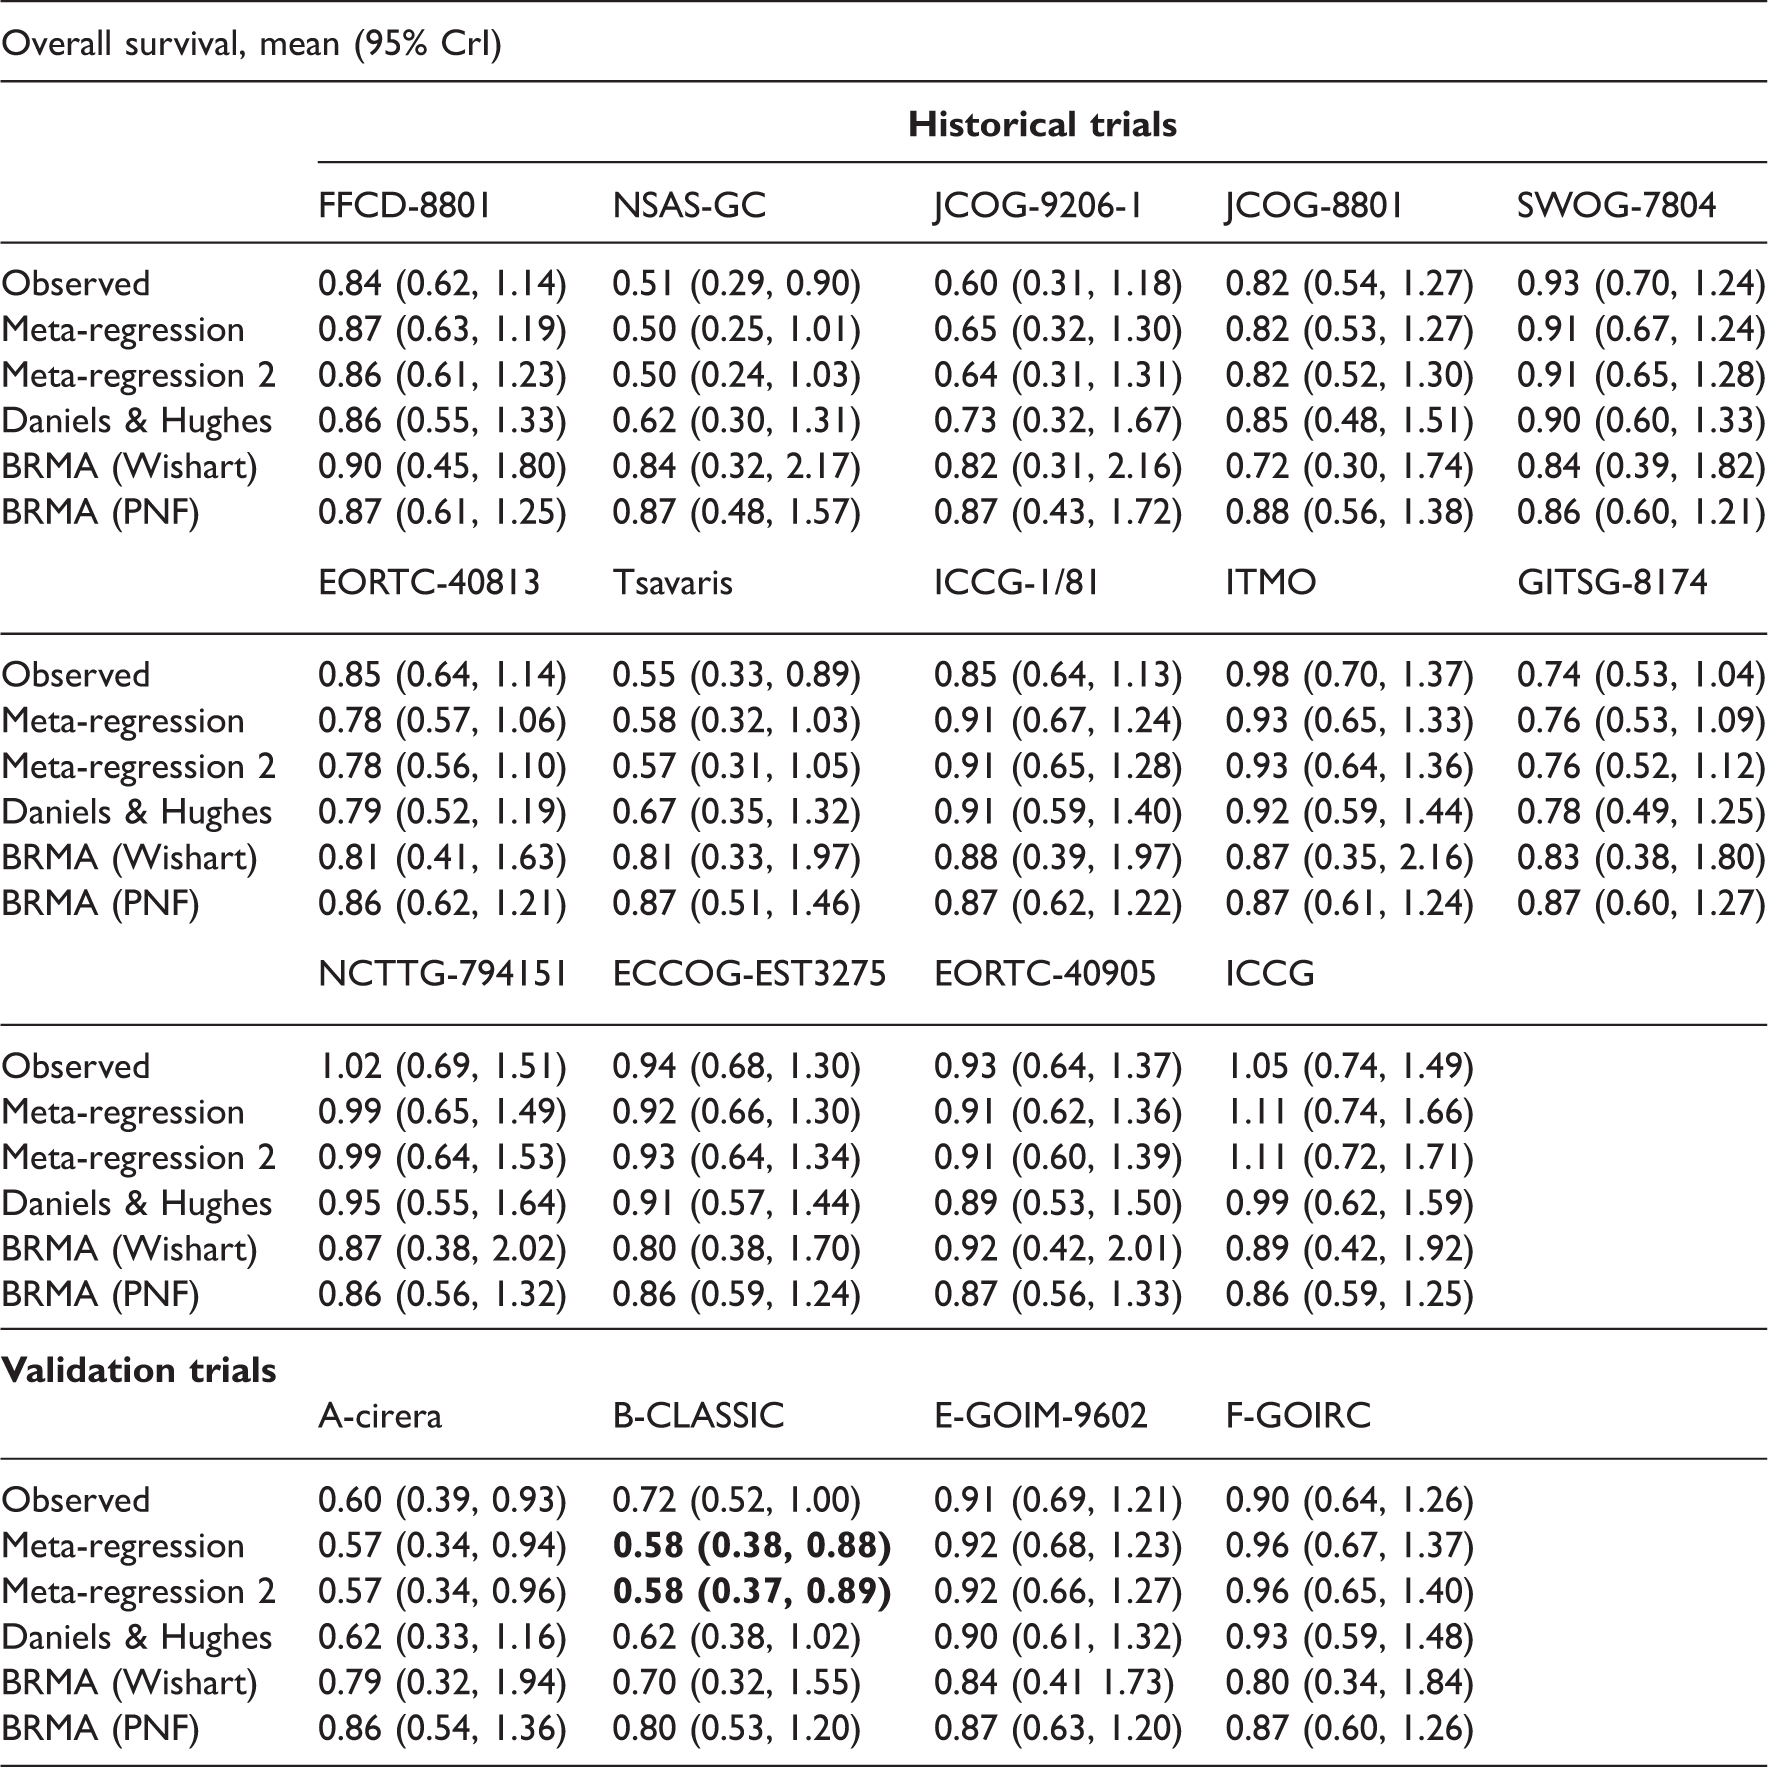
Predictions obtained from all models for all studies in the ‘Oba data’.
Results of the comparison of the models for predicting the treatment effect on OS from the treatment effect on DFS.
4.2.1 Discussion of the results for gastric cancer
The cross-validation of the predictions of the treatment effect on the OS from the effect on the DFS confirmed the results of Oba et al. recommending that DFS is a good surrogate endpoint for OS in patients with curable gastric cancer. One of the limitations of this case study was the absence of any delay between the measurement of the effect on the surrogate endpoint and the final outcome. Ideally, one would be interested in establishing whether DFS measured early could be used to predict long-term OS in the new trials. Sensitivity analysis conducted by Oba et al. was inconclusive whether or not the treatment effect on DFS measured as early as at two years of follow-up can be a good predictor of the treatment effect on OS estimated with five years of follow-up. 10
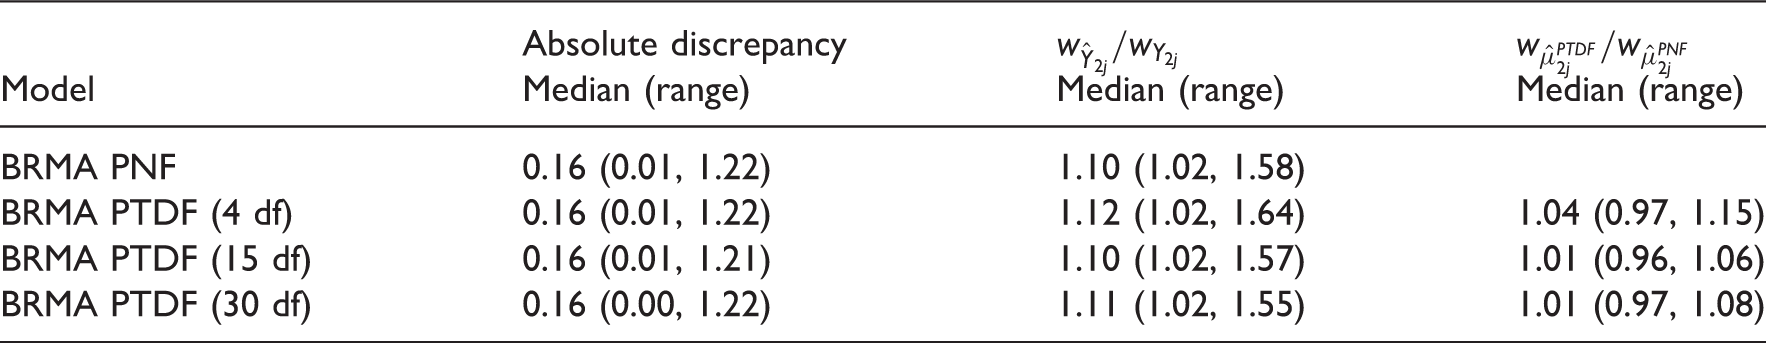
4.3 Results of sensitivity analysis with t-distribution
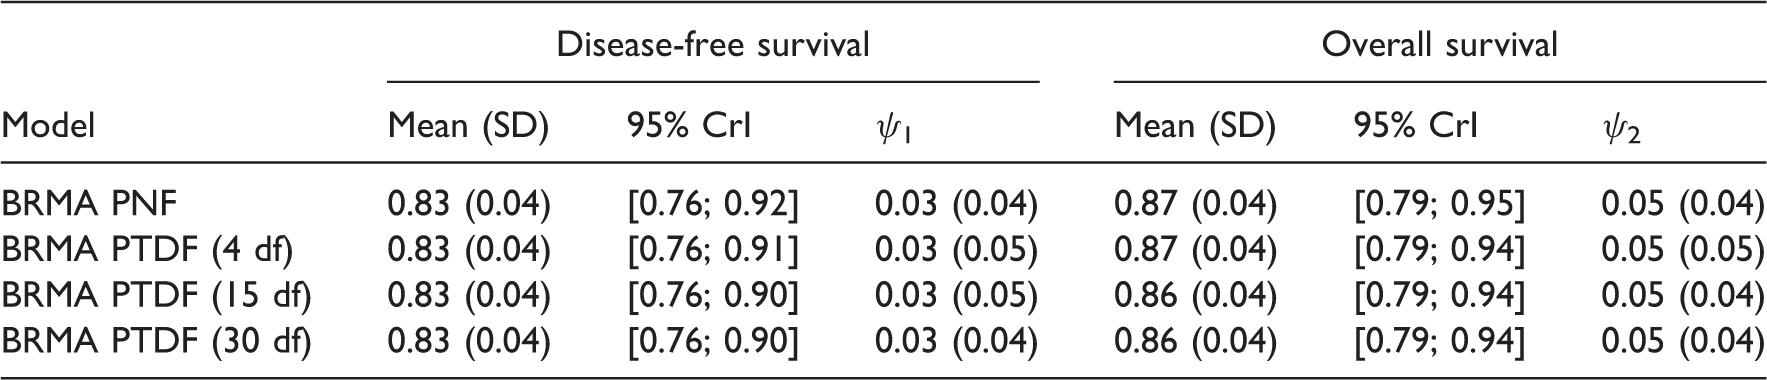
Summary results for placebo-controlled studies for the treatment effects on the risk of disability progression and the relapse rate ratio in RRMS, using models with t-distributions and BRMA PNF for comparison.
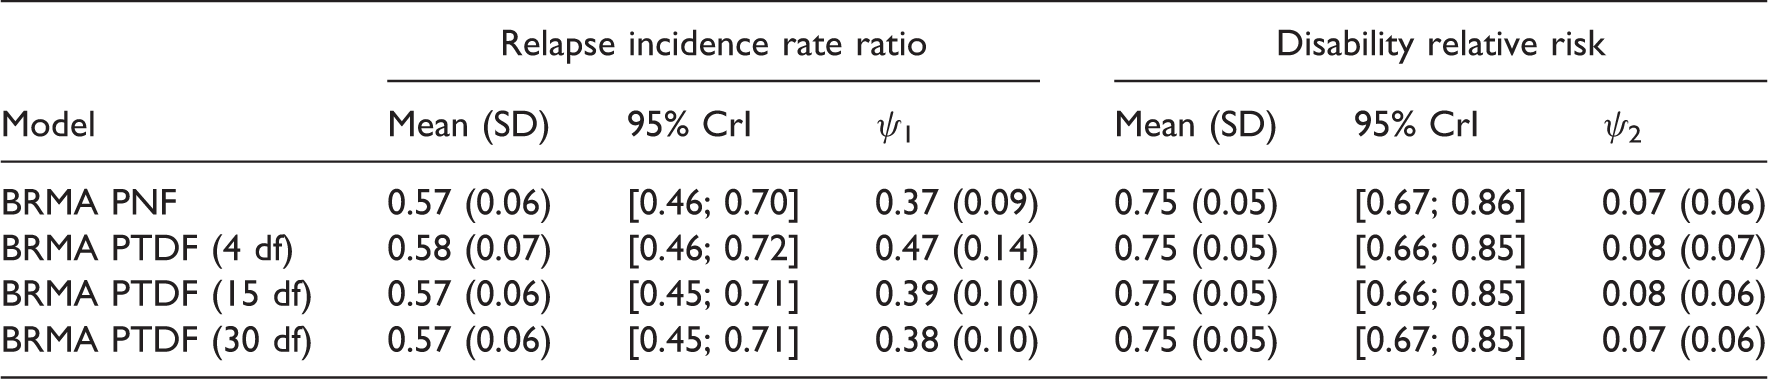
Results of the comparison of the models for predicting the treatment effect on the risk of disability progression from the treatment effect on relapse rate in RRMS, using models with t-distributions and BRMA PNF for comparison.
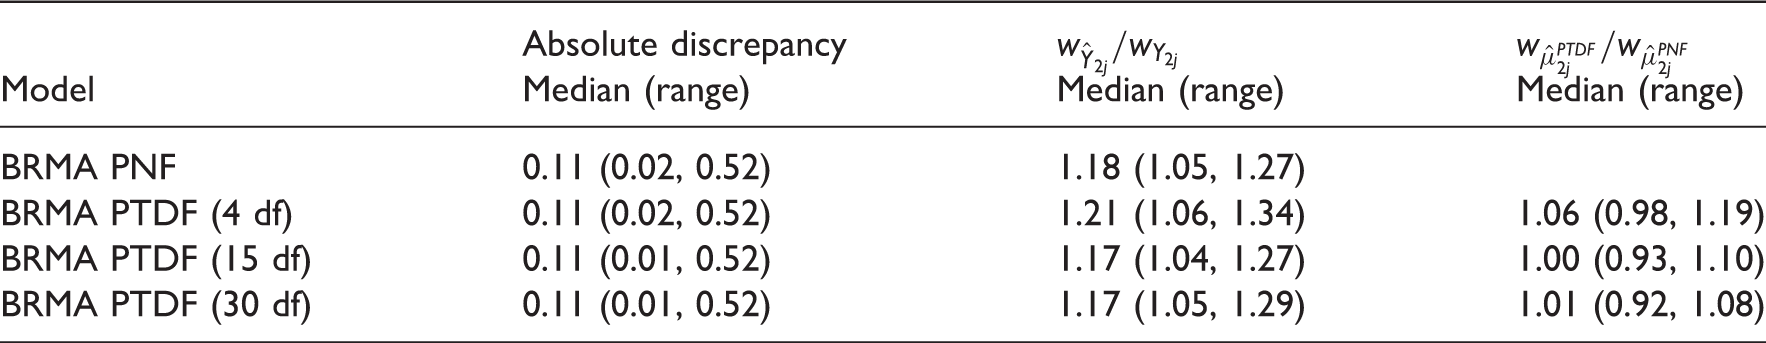
Summary results for treatment effects on overall survival and disease-free survival RRMS, using models with t-distributions and BRMA PNF for comparison.
Results of the comparison of the models for predicting treatment effect on OS from treatment effect on DFS, using models with t-distributions and BRMA PNF for comparison.
4.4 Results from the frequentist models
Results of the comparison of the frequentist models for predicting the treatment effect on disability progression from treatment effect on relapse in RRMS and the treatment effect on OS from the treatment effect on DFS in gastric cancer.
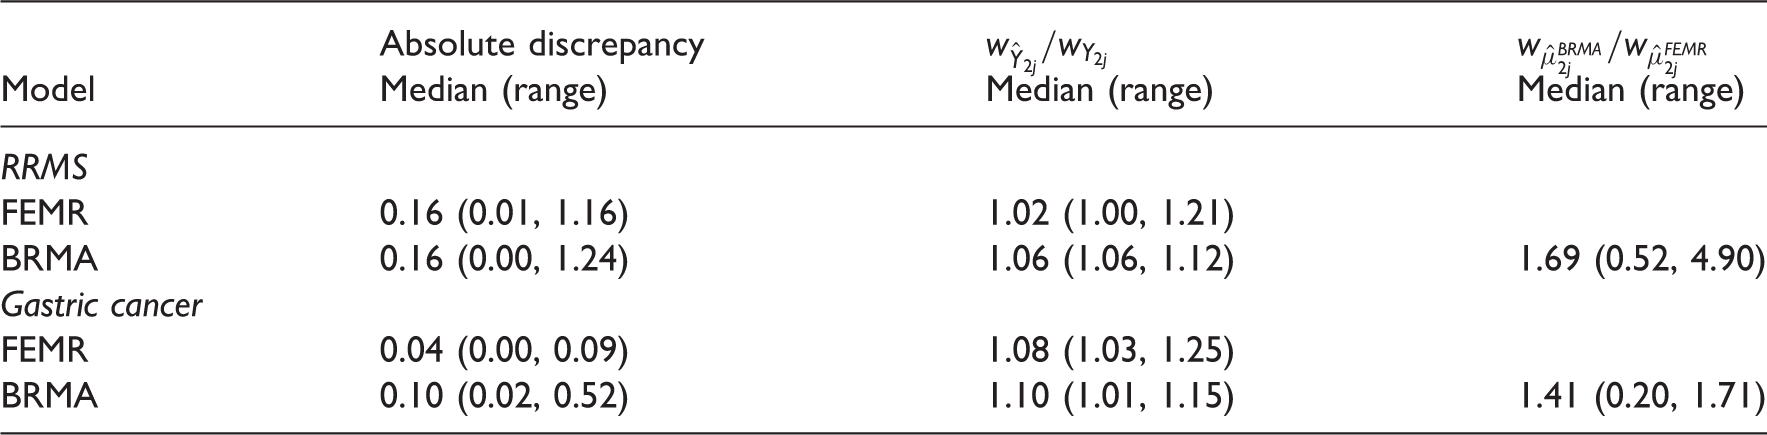
Tables A 3.1 and A 3.2 in Appendix 3 list predicted estimates on the final outcome (disability progression in RRMS and OS in gastric cancer). When using meta-regression, the predictions were obtained with reduced intervals (compared to the intervals corresponding to those obtained from BRMA). As in the Bayesian analysis, predicted interval for one study (B-CLASSIC) in the example in gastric cancer indicated significant effect (numbers in bold) when using FEMR (but not BRMA) while the observed effect was only borderline significant. Note that in the frequentist analysis, the within-study correlation is fixed (instead of the prior distributions in the Bayesian analysis). The results in Tables 13, A 3.1 and A 3.2 were obtained from models with ρ
wi
= 0.5. Sensitivity analysis using correlations
5 Simulation
The models considered in this paper allow for different level of uncertainty on the parameters and use different degree of distributional assumptions, both of which can impact on the accuracy of predictions. The models by Daniels and Hughes and the BRMA PNF seemed to predict the treatment effect on the target outcome equally well, giving conservative predictions (in comparison with meta-regression) because uncertainty around all the model parameters is taken into account, but not with overly inflated intervals. The two models, however, use a different degree of distributional assumptions. Considering, for example, a scenario where a new study may measure a treatment effect much larger compared to the effect observed in the historical studies (training set), the assumption in the BRMA PNF (about the true effects measured by both outcomes coming from a common distribution) may be too strong. Sensitivity to this assumption along with the performance of all the models is tested here by a simulation.
5.1 Methods
To carry out the simulation, data were simulated for both the validation studies as well as the ‘training set’ to ensure the control over the distributional assumptions of the data (the ‘Sormani data’ did not satisfy the assumption of normality well). Simulation of the validation data and the training set data was conducted using the BRMA PNF model (8) and (9) in a number of scenarios where the mean of the effect in the validation set is shifted by δ relative to the mean of the training set

Each model was fitted by adding a validation study to the training set (one at a time) assuming the effect on the target outcome (disability progression) unknown (coded as NA), which was then predicted by each model from the effect on the relapse rate given for this study. The predicted true effect
5.2 Results
Comparison of the performance of the models in terms of the coverage of the predictive interval.
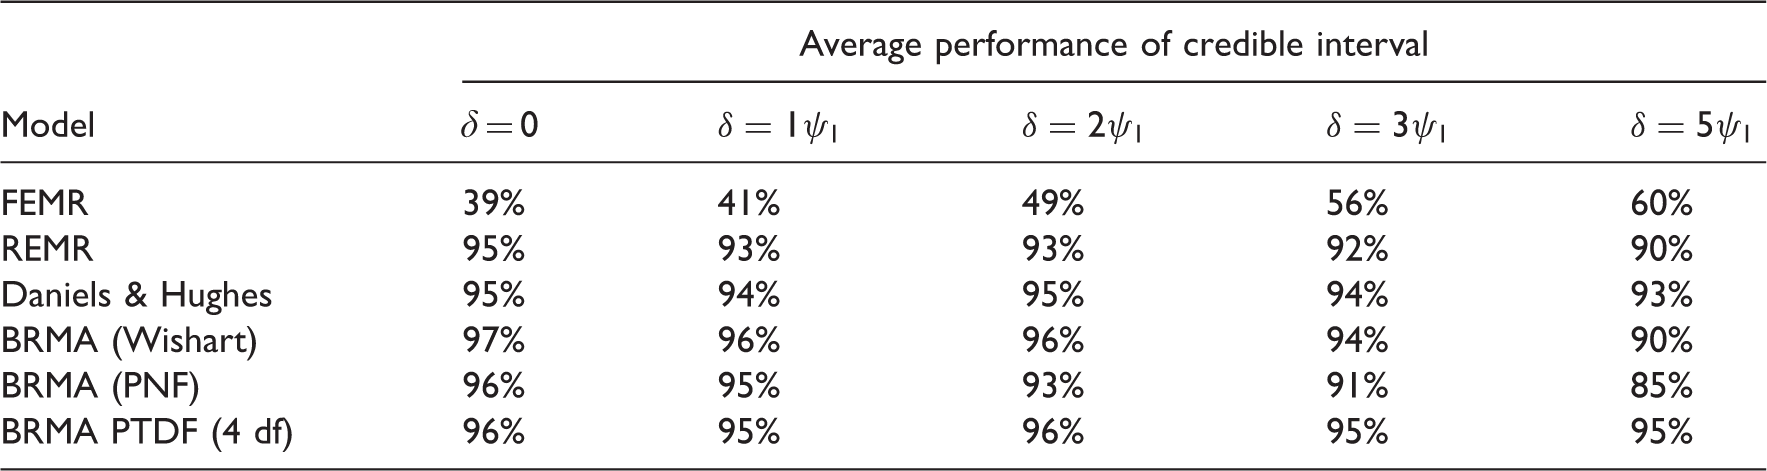
BRMA model with the Wishart prior distribution showed slightly too large performance for δ = 0 which was related to the overly inflated predictive intervals. FEMR performed least well due to the artificially reduced uncertainty by ignoring the estimation error of the treatment effect on the surrogate endpoint. In this case, the performance seems to increase with the validation set moving away from the training set which is due to the predicted interval expanding as we move further away from the data, as in linear regression.
6 Discussion
When investigating endpoints as candidate surrogate outcomes, a careful choice of the meta-analytical approach has to be made. The level of uncertainty taken into account by the model can impact on the precision of the predictions of the true effect on the final outcome
In the models by Daniels and Hughes and BRMAs, the treatment effect on the surrogate endpoint is treated as a response variable and its uncertainty is taken into account in the model in contrast to the meta-regression model where the effect on the surrogate was a fixed covariate. BRMA with the inverse Wishart prior distribution on the between-study covariance matrix seems an unreliable approach because it does not allow the analyst to easily control the prior distributions on the specific elements of the covariance matrix. Results obtained from the model are sensitive to the parameters of the Wishart distribution. For example, setting parameters of the Wishart distribution that lead to a desirable non-informative uniform distribution induced on the between-study correlation can give undesirably informative prior distributions for the between-study standard deviations, which depending on the parameters can lead to inflated intervals for pooled or predicted estimates. For the illustrative examples considered here, this led to the inflation of the uncertainty around the predicted target outcome when using the Wishart distribution with the identity matrix and degrees of freedom equal to three. The BRMA PNF and Daniels–Hughes models predict the target outcome better, but make different distributional assumptions that need to be considered when making a choice between these methods. While the Daniels–Hughes model makes less strong distributional assumptions and may perform better when the new study differs from the historical data in the meta-analysis data set, the BRMA PNF has an advantage over it by allowing the estimation of pooled effects for both outcomes when combining data reported on one or both of them, which can be desirable when the pooled effectiveness estimates are of interest as is often the case in HTA. In circumstances when the distributional assumptions are plausible in BRMA PNF, this model has an additional advantage of allowing the analyst to incorporate external information (based on external evidence or expert opinions) in the form of informative prior distributions with the potential to reduce uncertainty around the estimate of interest.14,31
When using meta-analytic methods to predict the treatment effect on a target outcome of interest from the treatment effect measured by a surrogate endpoint, modelling assumptions need to be considered alongside the uncertainty, particularly around the surrogate endpoint. While Bayesian methods allow for a great flexibility in modelling uncertainty, the frequentist methods have also been used to account for the uncertainty around the surrogate endpoint by using an error-in-variables linear regression model,9,10 which is an alternative for analysts with a preference for a frequentist approach. We have illustrated the importance of uncertainty by using frequentist methods of meta-regression and bivariate meta-analysis.
In this paper, to investigate the impact of uncertainty on predictions, we focused on a number of different parameterisations of normally distributed effects. The assumption of normality is not always reasonable and when it is not, alternative approaches need to be investigated. In our further work (to be published elsewhere) we investigate, for example, modelling of relapse rate using a Poisson distribution and the relative risk of disability progression by assuming that outcomes come from Binomial distribution. Meta-analytic methods using these type of outcomes have already been proposed, for example by Stijnen et al. who propose binomial-normal and Poisson-normal bivariate model (with binomial or Poisson distributions for the within-study variability).32 We have investigated the normality assumption on the random effect by sensitivity analysis where we replaced the normal distribution with the t-distribution. This approach has the limitation of only improving the modelling when there are more data in the tails (such as outlying observations) that a normal distribution would not capture properly. If the distribution of the data is, for example, bimodal or skewed, other approaches can be investigated such as a convolution of normal distributions 33 or skewed t-distribution as proposed by Lee and Thompson. 26 The issue of non-normality of the random effect has been discussed by Higgins et al., 25 who also review non-parametric alternatives of the meta-analytic methods that can be applied to the non-normally distributed effects (such as non-parametric maximum likelihood procedures34–37 and Bayesian semiparametric random-effects distributions based on Dirichlet process priors38–40). However, as Higgins et al. discuss, although the methods have the ability to incorporate outliers, they are not suitable for making predictions due to the unusual shape of the discrete distributions. As such, they are unlikely to be suitable for the purpose of evaluating surrogate endpoints where predictions are of crucial importance.
The methods discussed in this paper do not fully cover all aspects of the surrogate evaluation process. As already mentioned in Section 1, the individual level association between outcomes needs to be explored and to do so, individual patient data is required on a number (preferably all) of the studies included in the meta-analysis. Although this was beyond the scope of this paper, the availability of individual level data could help to model uncertainty. For example, individual data can be used to obtain the within-study correlation between the treatment effects. Daniels and Hughes have used individual level data from a subset of studies in their meta-analysis to obtain the correlation between the treatment effects by bootstrapping 6 while Bujkiewicz et al. performed a double bootstrap analysis on individual level data from a single study to obtain the correlation between the treatment effects in the form of an empirical distribution. 14 A range of methods for obtaining the within-study correlation from individual level data was explored by Riley et al. who used a joint linear regression for multiple continuous outcomes and bootstrapping methods for a range of other outcomes. 41 The availability of individual level data can also be desirable when taking into account the information on covariates which in the aggregate form is subject to ecological bias. When investigating surrogacy, the inclusion of covariates could help explain some heterogeneity or explore the effect of baseline risk. Further research is required to explore the advantages of individual level data in modelling uncertainty and exploring the impact of covariates.
Footnotes
Acknowledgements
The authors thank Ian White for his comments on the earlier version of the manuscript and for sharing his expertise on Stata coding for extending the use of the mvmeta command in Stata. We also thank the two anonymous reviewers for their comments which helped to improve the quality of the manuscript.
Declaration of conflicting interests
The author(s) declared no potential conflicts of interest with respect to the research, authorship, and/or publication of this article.
Funding
The author(s) disclosed receipt of the following financial support for the research, authorship, and/or publication of this article: This work was funded by the Medical Research Council (grant no. MR/L009854/1 awarded to SB). KRA is supported by the UK National Institute for Health Research (grant no. NF-SI-0512-10159).