
Abstract
This paper discusses and develops rhythmanalysis as a methodological approach to disentangle the temporalities of digital and predictive governance; that is, how governance evolves through temporal ordering effects produced with, and through, digital technologies. Whilst rhythmanalysis, as it has become broadly used in the social sciences over the past decades, primarily focuses on ‘lived’ (rhythmic) practices of people, we argue that rhythmanalysis can also be developed as a framework to investigate the temporalities of digital governance environments. Using the field of education and, more specifically, the case of Early Warning Systems in US schooling as a worked example, we show how such a framework allows one to approach temporalities through, first, identifying chronorhythms (defined by chronological time), kairorhythms (defined by identifying and intervening in ‘right’ moments in time) and algorhythms (defined by the design of a technology). The second dimension is to analyze relations between those rhythms; more notably, synchronization (i.e., the coordination of rhythms in time), sychorization (i.e., the coordination of rhythms in space) and disruption (i.e., the altering or coming to a stop of particular rhythms). Finally, the framework includes visualization as a third dimension of rhythmic analysis, specifically through practices of selecting, drawing and world-making. Overall, this framework can inspire scholars interested in empirically disentangling temporal and predictive governance, within and beyond the field of education.
Keywords
Introduction
As with other public policy domains confronting substantial and unprecedented influences of datafication (e.g., health or policing), education has become a key target of the ‘data deluge’ (Kitchin, 2014), where data infrastructures and practices are increasingly interwoven with various educational contexts. This includes large-scale assessments used for measuring school performance, value-added models for evaluating teacher effectiveness, the widespread implementation of digital technologies in classroom activities, and – our particular focus in this paper – predictive governance technologies designed to allow the early identification of ‘at-risk’ students for remedial intervention (Knox et al., 2020).
While there has been growing awareness of the non-deterministic, yet still highly regulative, governmental power of such data infrastructures and practices in different educational contexts (see, for instance, Hartong and Decuypere, 2023; Van Dijck et al., 2019), a more profound understanding is arguably still needed regarding the specific mechanisms and effects of algorithmic regulation; that is, how exactly data-driven technologies transform the manifold sociotemporalities of education. As we argue in this paper, and aligned with debates in other policy fields (e.g., Kitchin and Lauriault, 2014; Seaver, 2017), part of the challenge to develop such nuanced, empirically-grounded understandings of digital governance lies in developing appropriate method(ologie)s for operationalization. In this context, our paper specifically focuses on the challenge of methodologically approaching the temporalities of digital governance, that is, how governance evolves through ‘temporal ordering effects’ (Leese and Pollozek, 2023, p. 3) produced with and through digital technologies.
Particularly over the past few years, the social sciences have seen a growing (re-)engagement with time (for a recent overview, see Kitchin, 2023). Much of that work specifically addresses the close relation between temporalities and datafied environments, such as in digitally administered border controls (Leese and Pollozek, 2023), smart cities (Coletta and Kitchin, 2017), social media (Brooker et al., 2016) or weather data production (Bates et al., 2016). Similarly, in education research, scholars have increasingly addressed new dynamics of temporal (re)construction triggered by the ongoing rise of digital governance, including assessment infrastructures (Landahl, 2020), the growing ‘acceleration’ of digital learning (Jagannathan, 2021), the ‘real-time’ promise of learning analytics (Ifenthaler, 2017), or the growing role of predictive technologies that claim to optimize learning by making the future accessible in the present (Knox et al., 2020). As this body of research clearly shows, digital governance cannot only be understood by primarily focusing on (western) understandings of time as a unidirectionally progressing line (i.e., a chronology), but it must rather be approached as comprising multiple enacted forms of time that act next to, and through, each other (see also Webb et al., 2020; Lingard, 2021).
Despite this growing scholarly awareness, however, there is still little research that has systematized temporality as a methodological framework – and not solely employed it as a conceptual heuristic – to study manifestations and effects of digital technologies in (education) policy, governance and practice (e.g., Lingard and Thompson, 2017; Rosa, 2016). Responding to this need, our article discusses and further develops a rhythmanalytical framework. On the one hand, this framework is inspired by existing rhythmanalysis approaches in the social sciences (Lefebvre, 2004; Elden, 2004; Shields, 1998). On the other hand, it systematically builds on current work from the field of temporal governance that has specifically focused on digital governance environments (e.g., Nansen et al., 2009 Coletta and Kitchin, 2017; Miyazaki, 2012). Bringing both fields together, we create a methodological framework that is not only usable for ethnographic studies on the temporal experiences of actors operating in/through digital environments, but also particularly for the analysis of temporal features of documents (e.g., policy papers), data infrastructures (e.g., platforms), and digital technologies (e.g., tracking and predictive technologies). Using the field of education and, more specifically, the case of Early Warning Systems (EWS) in US schooling as a worked example, we show how the framework can guide us in approaching the manifold temporalities of digital governance in a three-dimensional-manner: i) identifying rhythms, ii) relating rhythms, and iii) visualizing rhythms. We conclude by discussing how the framework can inspire scholars interested in empirically disentangling temporal, digital, and predictive governance, within and beyond the field of education.
Temporality perspectives in digital education governance: recent developments and remaining possibilities
As noted above, there has been growing scholarly awareness of the temporal dimension related to contemporary education governance transformations, resulting in a significant scholarly (re-)engagement with time (e.g., Lingard, 2021; Decuypere et al., 2022; Schmidt-Lauff, 2023). A central argument of that research, which then equally includes studies more specifically interested in the temporal implications of digitization, is that time cannot be presumed as an objective and universalized (mainly chronological) category alongside which, for instance, education processes, or technological impact, are ‘situated’. Rather, time (just like space) is constructed and multiple, and must, consequently, be investigated relationally and as ongoingly changing (Martin and Secor, 2014). To make this conceptualization more tangible, Webb and colleagues (2020) suggest to distinguish between three modalities of time: i) chronologic (‘clock time’, quantitative); ii) aionic (‘durational’, sensed, qualitative); and iii) kaironic (‘the right time’, moments in which to act). Prange (2005), in turn, developed a temporal heuristic that differentiates between ‘data time’ (Datenzeit), which is related to the ‘planned‘ temporal activities of teaching, and ‘modal time’ (Modalzeit), which instead refers to the temporal processes of actual learning on the student side. We would argue against these different modalities being reified as more ‘correct’ alternatives to other possible ways of comprehending temporality, but simply note them to highlight the multiple possibilities for apprehending how time can be constructed and experienced.
Within this broader body of research on the relation between temporalities, governance transformations and (educational) policy processes, scholars have also more specifically addressed how temporalities are being produced through and around digital (education) technologies. At the same time, large parts of that research have, at least so far, either been on a more general level – such as studies on the ‘acceleration’ of digital education through COVID-19 or the promises of ‘real-time’ governance (e.g., Cone et al., 2021), or they have been foremost theoretical in nature (e.g., Lingard, 2021). In contrast, only very limited research has actually ‘done’ systematic temporal analysis; that is, has systematized temporality in a methodological manner, and not solely employed it as a conceptual heuristic.
As argued in the introduction, one reason for this shortage of empirical temporalities studies in digital education governance lies arguably in a lack of useful methodological ‘toolboxes’ to guide operationalization. Put differently, more guidance seems to be needed regarding what exactly to look for empirically and, then, how to analytically systematize the messiness of temporalities. Responding to this need, we now turn our attention towards the approach of rhythmanalysis and discuss how it may be developed into a methodological framework suitable for understanding temporalities of digital (education) governance.
The manifold faces of rhythmanalysis
To date, the term ‘rhythmanalysis’ is most commonly associated with the works of French Marxist philosopher Henri Lefebvre and his book Rhythmanalysis, Space, Time & Everyday Life (Lefebvre, 2004). Even though largely recognized as being very complex and hermetic, Lefebvre's thinking has been hugely influential and widely adopted in the social sciences, and more particularly by scholars interested in disentangling how time(s) and space(s) induce, and at the same time are induced by, the lived experiences of people (e.g., Elden, 2004; Shields, 1998). The methodological framework we present here draws inspiration from this work in the sense that it focuses on rhythms as patterns in time and space that require repetition within a given period of time. Thus, what distinguishes rhythms for randomly accruing movements, activities, phenomena and noise is the reoccurrence of particular activities that ‘emerge as beats in the superposition of multiple and heterogeneous temporal flows and routines’ (Coletta and Kitchin, 2017: 3). However, in social phenomena, pure, absolute repetition does not exist. Each activity will invariably induce the production of difference, since there will always be something new and/or unforeseen induced through each repetition (Lefebvre, 2004). As Lyon (2018: 24) states, ‘[r]epetition includes difference in the sense that each repeated element is different from the preceding or subsequent one quite simply because it is not that one. And repetition produces difference as difference emerges from the very act of repetition’ (emphasis original).
Over the past decades, different strands of rhythmanalysis have evolved around this general interest to trace the simultaneity of repetition and difference. At the same time, most of that research can be denoted as phenomenological in nature, focusing on the ‘lived’ (analogue) experiences and temporal ‘sense-making’ of people; for instance, through the body (see Henriques et al., 2014; Nash, 2020; Vergunst, 2010). Closely related is research that focuses on practices as characterized by multifarious rhythms that variously crisscross, enhance and interfere with one another (Blue, 2019; see also Mareggi, 2013, for the case of urban practices). Equally in education research, we see an increased attention in understanding education as a rhythmic practice (Alhadeff-Jones, 2017; Schmidt-Lauff, 2023). What we find particularly inspiring here is the two-step methodological procedure that much of this research employs: while a first step is to identify (and disentangle) rhythms present in a practice, a second step is to then investigate the specific relations between those rhythms (e.g., synchronization), including the impacts of their relational coming-together (Lyon, 2018). The methodological framework we propose below adopts a similar ordering of methodological dimensions.
At the same time, such forms of rhythmanalysis have not yet systematically focused on analyzing digital, algorithmically-mediated environments and data infrastructures, in which rhythms are less ‘embodied’, but rather embedded and mediated via various technological features and processes (see Nansen et al., 2009 for an exception). As Coletta and Kitchin (2017, 4) state, research on algorithmic technologies still substantially lacks ‘temporal awareness’ (see also Leese and Pollozek, 2023). To address this gap, Coletta and Kitchin refer to Miyazaki's (2012) notion of ‘algorhythms’ to investigate how algorithms are endowed with particular temporalities and to capture the computational effects of algorithmic technologies on time (see equally Lupinacci, 2024). Moreover, applying the notion of algorhythms to the education field, Alirezabeigi and colleagues (2023) investigated the ‘temporal landscape’ of classroom tasks mediated via screens, and showed how algorhythms contribute to a prioritization of task completion cycles over chronologies of task completion. However, until now, such algorhythm-studies have offered only little methodological advice regarding how precisely to do rhythmanalysis on/through digital governance contexts. Still, their outlines of analysis and findings provide important further inspiration for our framework.
In sum, whilst there exists a range of research that adopts rhythmic thinking – or rhythmanalysis in particular – to disentangle and investigate temporalities, the research field does not yet have a more holistic and nuanced methodological framework at its disposal that allows to analyze temporality in/through digital environments, or that has a dedicated analytical lens on rhythms. Consequently, we develop in the following an approach that acknowledges the significant contribution of more ‘classical’ rhythmanalysis scholarship, as well as considers the many developments in contemporary temporal and/or digital (education) governance research.
Towards a methodological framework for studying digital and predictive governance through rhythmanalysis
Here, we first outline our methodological framework, before then illuminating how this framework emerged through our worked example and what it made us see (differently). This methodological framework on the one hand can be understood as resulting from our detailed reading of the conceptual literature described above, which resulted in a first rendering of the framework. On the other hand, the framework equally needs to be understood as emerging from our close engagement with a specific empirical case. Figure 1 provides an overview of our suggested framework, in which we distinguish three dimensions for studying digital governance through rhythmanalysis:
Identifying different rhythms, particularly chronorhythms (defined by chronological time), kairorhythms (defined by identifying and intervening in ‘right’ moments in time) and algorhythms (defined by the design of a technology). Relating different rhythms, focusing in particular on synchronization (i.e., the coordination of rhythms in time), sychorization (i.e., the coordination of rhythms in space, such as a meeting venue or on a screen), and disruption (i.e., the altering or coming to a stop of particular rhythms). Visualizing rhythms, particularly through practices of selecting (i.e., which rhythms and their relations to focus on), drawing (i.e., which forms of graphic elements and arrangements to choose) and world-making (i.e., reflecting on the overall performative impact of fabricated visualizations).
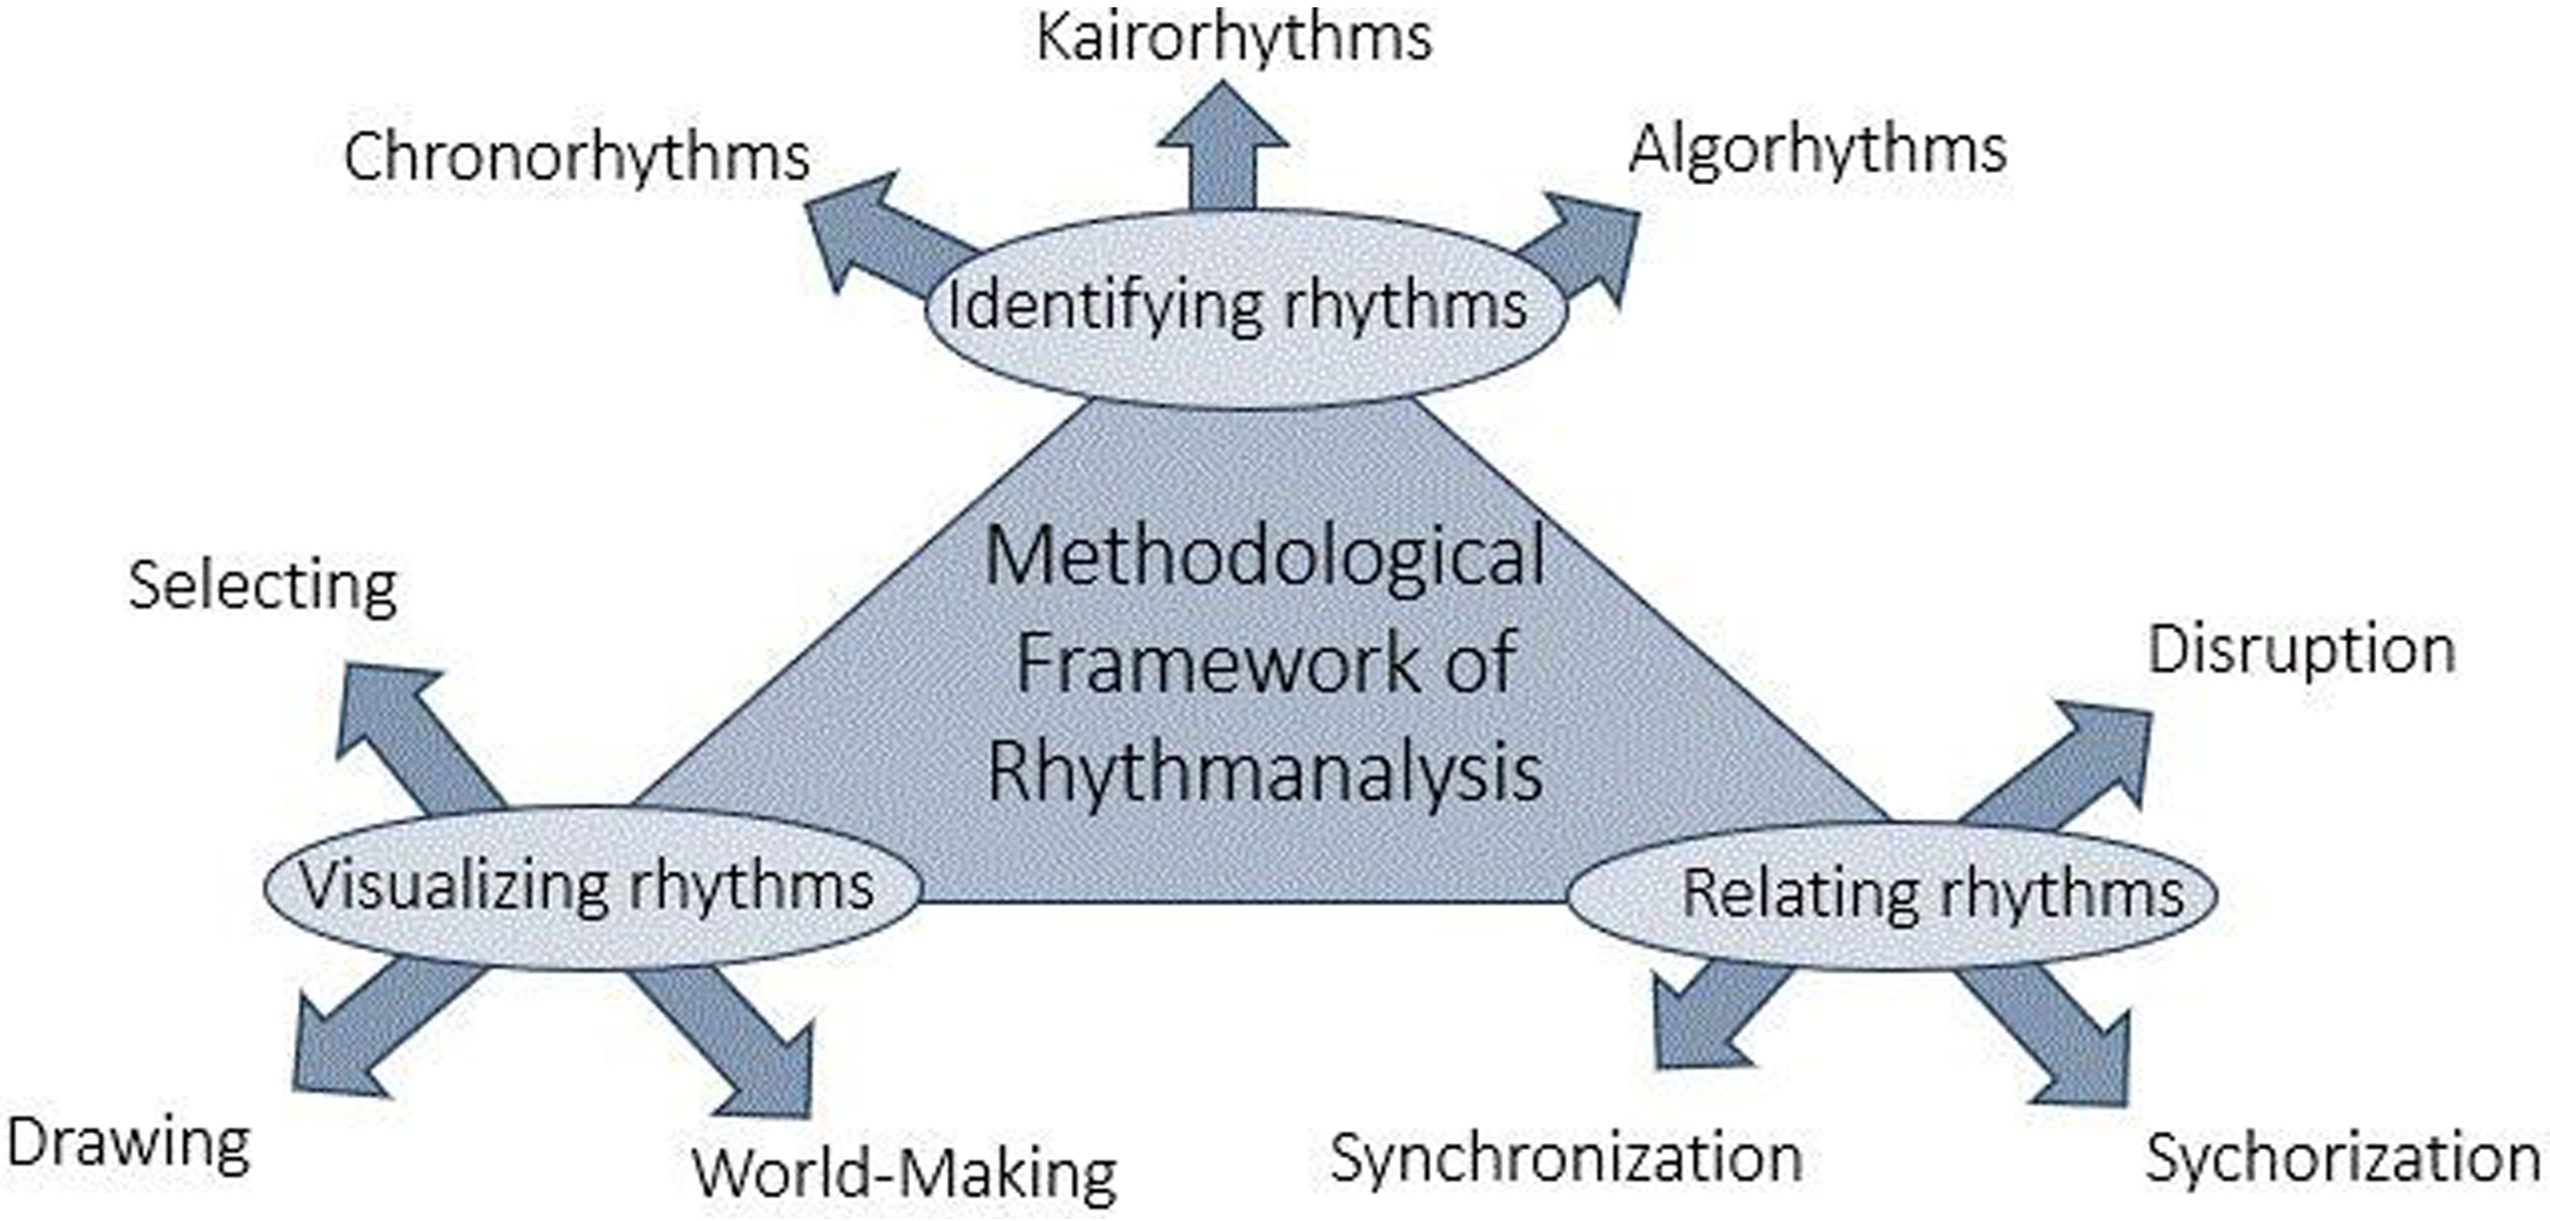
A three-dimensional rhythmanalysis framework.
A worked example: early warning systems in US schooling
For our initial framework development, we selected the case of a so-called Early Warning (Indicator) System (EWS) used in US schooling as a worked example. Such EWS intend to identify at-risk students based on predictive modelling of (mainly) attendance, behavior and course grading data. In fact, EWS are not unique to the field of education. Rather, over the past decades, they have become widely applied in various sectors of society, including climate governance (Zommers and Singh, 2014), child protection (Ratner and Elmholdt, 2023) and financial crisis prevention (Samitas et al., 2020).
The popularity of EWS in US schooling goes back to different policies that triggered an intensive datafication of education governance since the early 2000s (see Holloway, 2020; Anagnostopoulos et al., 2013; Lewis and Hartong, 2022). As a result, most US states had implemented large-scale data systems by the early 2010s, with some including different attempts for preventive and predictive student data tracking (ibid.). In 2015, EWS gained substantial further momentum when the federal Department of Education re-authorized the Every Student Succeeds Act (ESSA), which required US states to demonstrate significant engagement with data-intensive strategies for preventing student drop-out (AIR, 2021). A major role was also played by the American Institute of Research (AIR), which developed its own field of policy activity devoted to developing, evaluating, and distributing EWS among states (AIR, n.d.).
We found the AIR material particularly interesting for our methodological explorations, since it (co)produced a rich body of documents – as well as informed the production of similar documents within different US states – that specifically discuss temporal integration and temporal EWS setups as keys for success. In that context, we found different so-called EWIMS (Early Warning Intervention and Monitoring System) Implementation Guides, which provide a step-by-step instruction of how to align the EWS and its (temporal) cycles with school rhythms. In doing so, the guides can be regarded as undertaking rhythmicity on their own, in the sense of seeking to mediate and calibrate repetitions and rhythms, and to simultaneously minimize and maximize (particular) rhythmic differences (see equally Coletta and Kitchin, 2017).
It is for this reason that we decided to use one of these EWIMS implementation guides from the US State of Michigan (Michigan Department of Education, 2017 hereafter, the ‘Implementation Guide’), which offers a wide range of formats for content analysis – including texts, figures, and screenshots from an EWS (for instance, see Figure 2). As we will show, this orchestration made it possible to trace various rhythms manifesting in and through the document, and to investigate their multiple (equally visual) relations with one another.
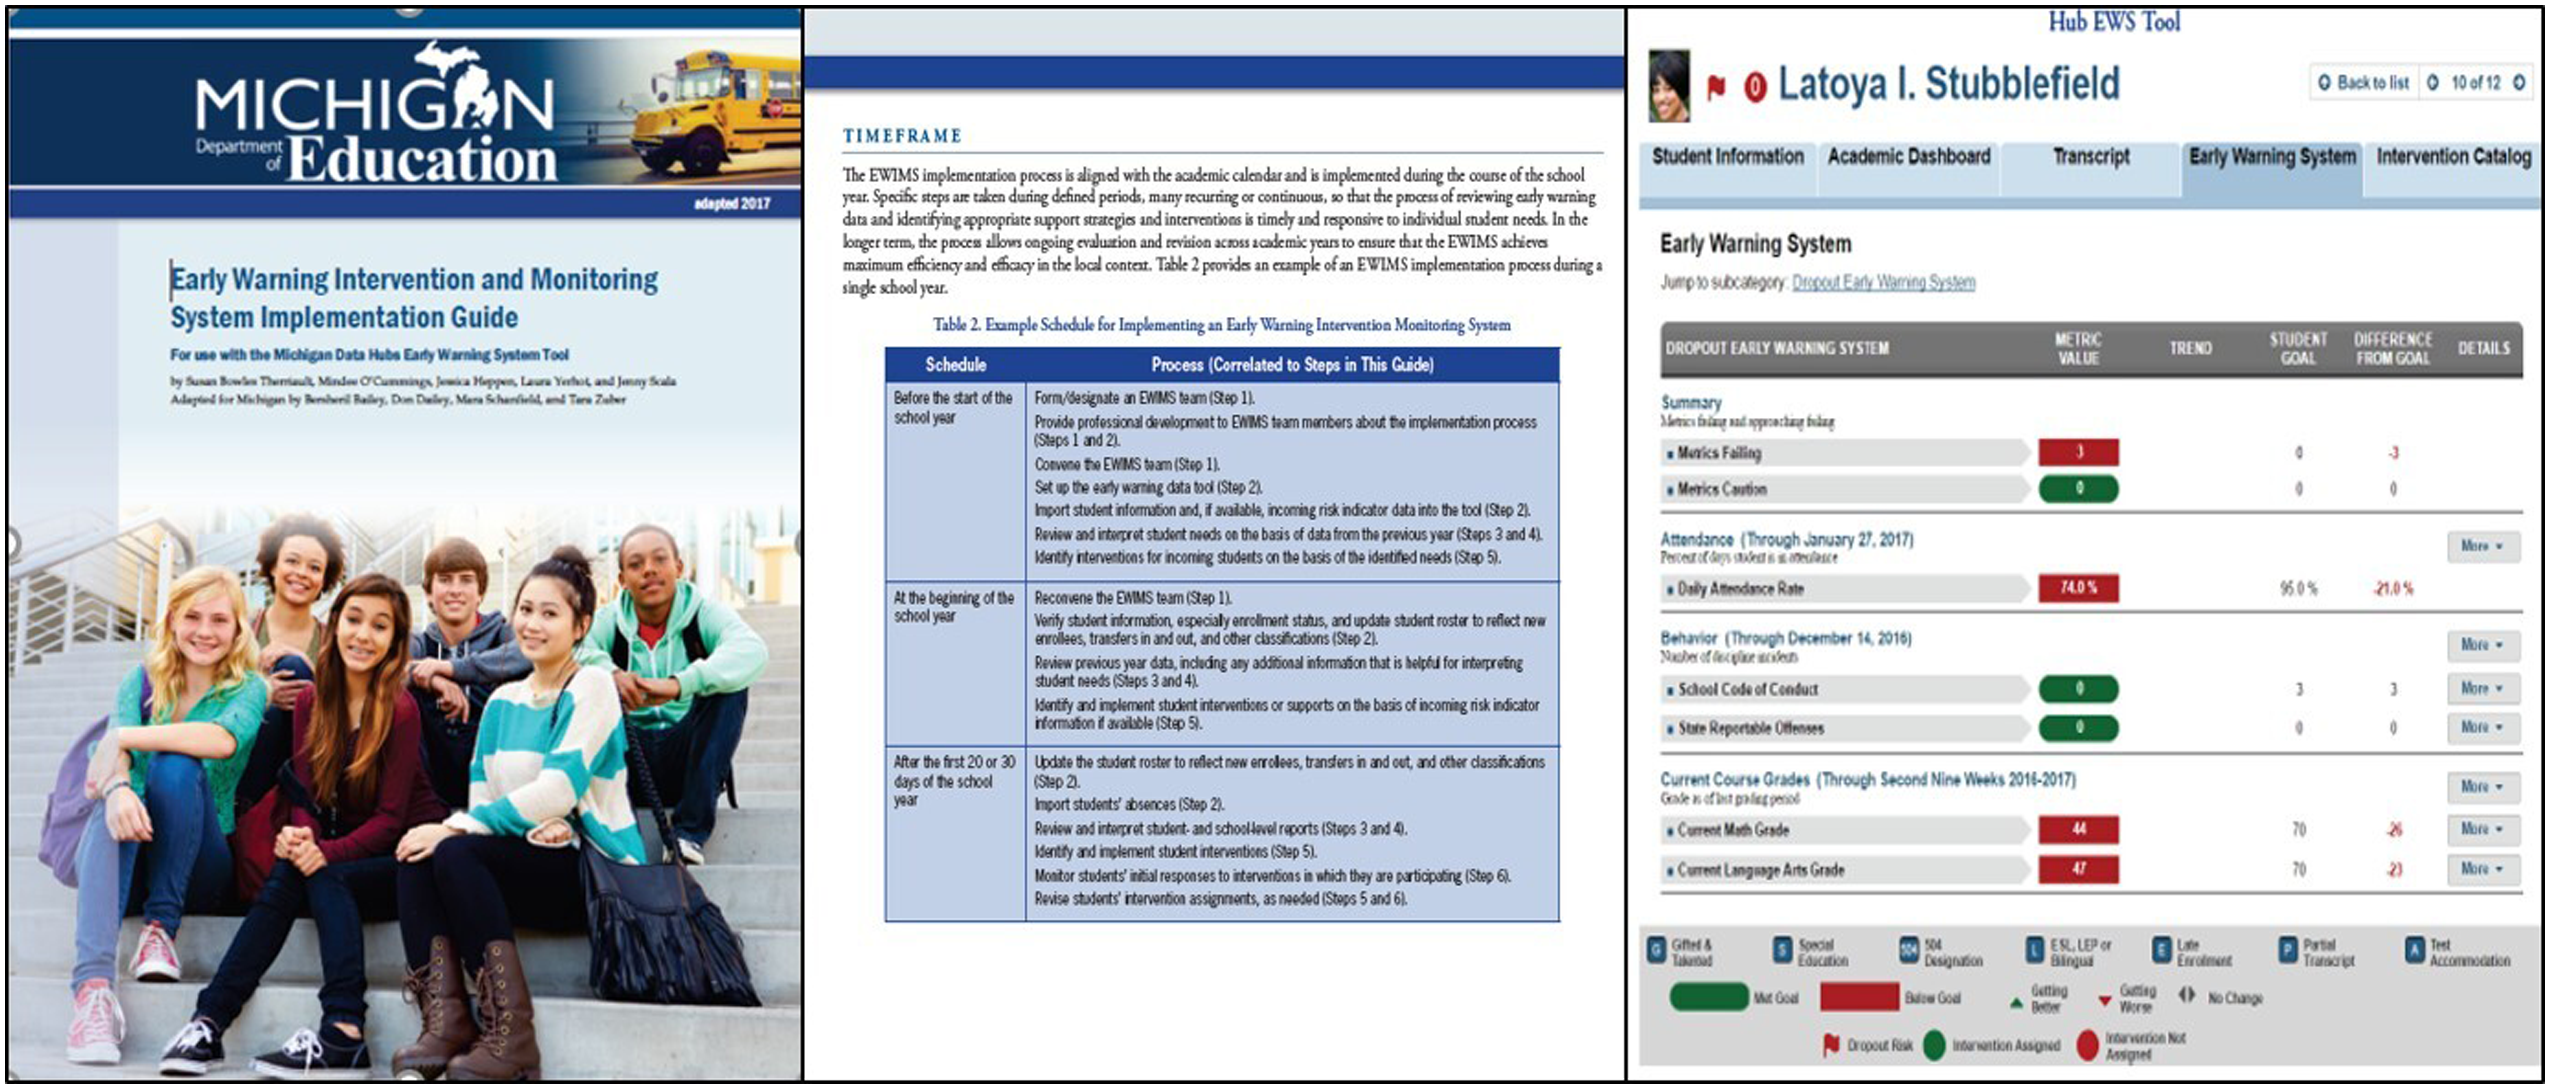
Example content from the Michigan EWIMS implementation guide. Source: Michigan Department of Education, 2017.
Rhythmanalysis dimension I: identifying rhythms
Based on our engagement with the literature, we identified three ‘types’ of rhythms that seem most relevant to our research interest in Early Warning Systems: i) chronorhythms, or rhythms defined by chronological time (in our case, for instance, the school year), ii) kairorhythms, or rhythms defined by identifying and intervening in ‘right’ moments in time (in our case, for instance, the moment of identifying ‘at-risk’ students and to plan interventions), and iii) algorhythms, or rhythms defined by the design of a technology (in our case, for instance, EWS data processing into dashboards). Whilst chronorhythm denotes a common concept in classical rhythmanalysis literature, we adopted the concept of kairorhythm from the ‘kaironic time’ category found in (education) governance research (Bucher, 2018; Webb et al., 2020). In turn, the algorhythm concept was, as noted above, introduced by Miyazaki (2012) and later used in the work of Coletta and Kitchin (2017) and Alirezabeigi and colleagues (2023).
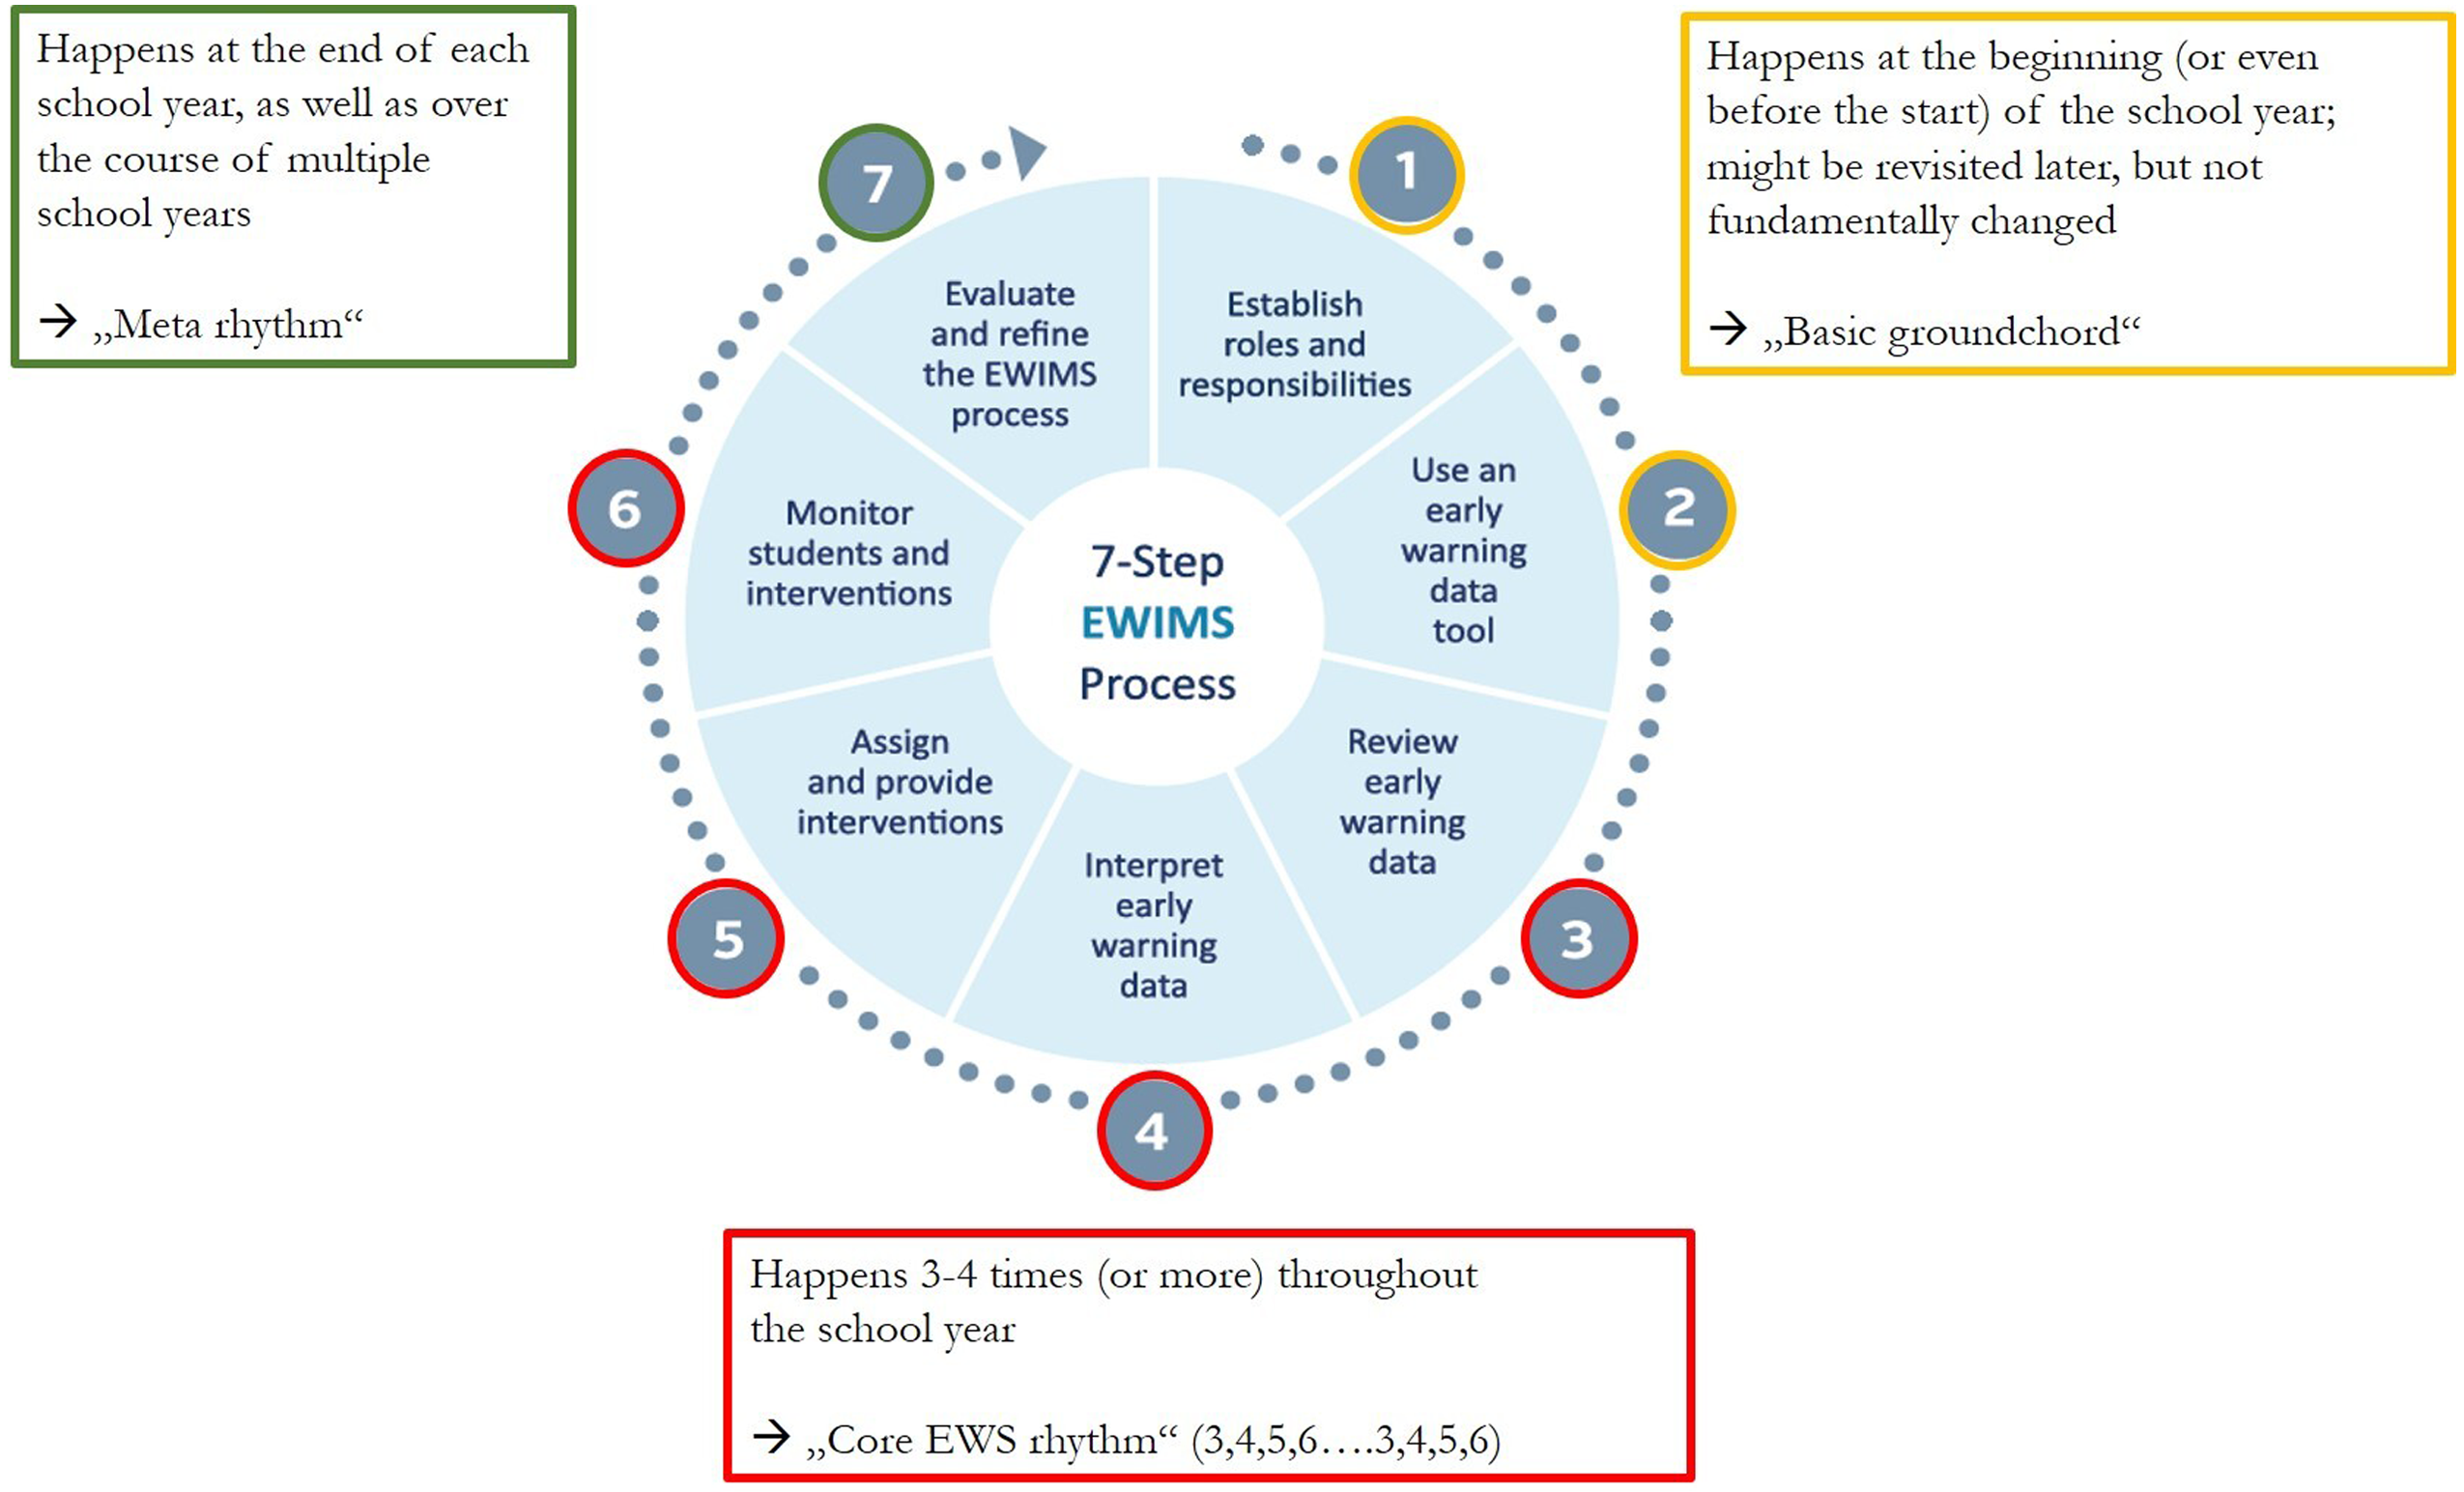
Identifying these three rhythms – and the underlying temporalities that enable these rhythms – in the Implementation Guide thus formed the first stage of our methodological approach. Practically, we started this stage by scanning the Implementation Guide for where (i.e., in which parts of the document) and how (i.e., in what ways) time is depicted and discussed in general. This included a special emphasis on how time is meaningfully divided in the document and what forms of periodicisation are used in the texts and figures. Indeed, we found that the Implementation Guide not only discusses temporalities in a variety of (interlinked) ways but also offers different temporal (meta-) framings that invite closer investigation. As an example, the Implementation Guide introduces, discusses and visualizes a so-called 7-step EWIMS Process (cycle) (Figure 3; see also Institute for Education Sciences, n.d.: 1).
Our analytical annotations on content from Michigan EWS implementation guide.
The first two steps refer to setting-up the technical system (i.e., enabling algorhythms of data processing) and establishing roles and responsibilities to secure the EWS operation and usage. Steps three to six, then, refer to the actual daily operation of the system, as well as the ongoing review and interpretation of student data (as displayed on the dashboards), and the assignment and monitoring of interventions. Practically, the Implementation Guide anchors all of these steps (data review, intervention assignment and follow-up monitoring) within designated meetings of a so-called EWS group. These should be scheduled ‘regularly’ and at particular (‘right’) times per schoolyear: “The EWIMS team should meet regularly throughout the year—a minimum of three times per year. At least one meeting should be held (a) before the start of school, (b) after the first 20 or 30 days of school, and (c) shortly after the end of each grading period.” (Implementation Guide: 7)
The last step of the circle points to an overall evaluation of the process (and EWS) at the end of each school year, followed by adjustments in preparation for next year´s operation.
As this initial exploration shows, the circle model introduces different (at least three) rhythmic patterns – which we conceptualized here as the ‘basic groundchord’, ‘core EWS rhythm’ and ‘meta-rhythm’ – that each carry different rhythmic references. These additional conceptualizations not only help ‘placing’ the different steps in the rhythmic context of the entire EWS arrangement, but equally raise our awareness for rhythms – both other chronorhythms, as well as kairo- and algorhythms – that pierce the chrono-centric rationale of aligning the EWS with the school year. As shown, such references include grading periods or the ‘first 20–30 days of school’, but they equally emphasize rhythms of data processing or meeting schedules. Also, the exploration of the circle model pointed to the interesting fact that the ‘core EWS rhythm’ is actually repeated several times throughout the schoolyear. This is, however, not visible in the figure, and rather becomes clear through the textual components of the Implementation Guide. It is, consequently, this composition of all components of the guide that we used to further investigate the overall rhythmic arrangement of the EWS. Hereby, the aim was less to end with a neat (and static) rhythmic overview, but rather to actively embrace and work with the deep entanglement of various (sorts of) rhythms.
For instance, as noted above, a closer investigation of chronological referencing in the guide already reveals a multitude of distinct chronorhythms, which are at same time nevertheless being ‘drawn into’ the dominant, standardized periodization of ‘school years’. In other words, the chronological rhythms of the school year, which is situated from July to June across two calender years, acts as a key framing device for how the EWS is implemented and enacted. With the school year comes, then, a split into four roughly equal terms (Michigan.gov, 2022: 1), meaning that different chronological markings of time (calendar years, schools years, school terms, months …) are present across, and interrelate in, a variety of scales, as well as schooling practices (e.g., grading periods). As noted before, these references to different yet interrelated chronological timeframes are explicitly noted in the Implementation Guide: ‘[T]he EWIMS implementation process is aligned with the academic calendar and is implemented during the course of the school year. Specific steps are taken during defined periods, many recurring or continuous’ (Implementation Guide, 2020: 6; emphasis added),
Moreover, these multiple chronological timeframes equally guide other rhythms, such as kairorhythms (e.g., to review student data ‘after each grading period’ or ‘revise student intervention assignments for the summer and the next academic year’; Implementation Guide, 2020: 7) (see below). Indeed, by contrast to the omnipresent chrono-centric – and mainly school year-oriented – referencing in the guide, references to kairological time/kairorhythms appear as less dominant. Moreover, these kairorhythms equally relate differently to the different chronorhythms (see next section).
From a general perspective, the circle model itself can be regarded as coming with a clear rationale of when is the ‘right time’ within the school year to implement the different steps of the EWS. For instance, clarifying roles and responsibilities must, in the rationale of the guide, happen before the actual operation of the system; reviewing student data should (only) happen after updates of student data. Zooming closer in onto the ‘core EWS rhythms’, we see, however, that such ‘right’ moments of reviewing data/assigning interventions are only partly defined in the guide (e.g., after 20–30 days of school; after grading periods), while other sections refer much more broadly to ‘good’ rhythms throughout the school year (e.g., when the guide talks about ‘frequently’ scheduling the meetings). Hence, we can also observe here a deliberately non-chronological referencing to time, which much more emphasizes intuition, or a feeling, of when it is ‘appropriate’ to submit or review EWS data based on other supplemental data and the professional judgement of the EWS team members.
The simultaneity of clearly indicated definitions of ‘right time’, and a much more open understanding of ‘temporal appropriatness’, can also be traced when further zooming in on the aforementioned team meetings. Outside of the digital platform and the data contained therein, these meetings arguably form the central rhythmic activity of the EWS, insofar as they occur regularly and provide the ‘interface’ between the digital (i.e., EWS data and platform) and the physical (i.e., face-to-face meetings and other data) (see also next section). Hence, the Implementation Guide includes extensive instructions for these meetings, thus limiting when the ‘right time’ can be enacted. At the same time, the team is instructed to interpret EWS data in the context of other supplemental (i.e., non-EWS) data sources, including annual assessment data, benchmark data, student observations and work samples, but also conversations with students and parents (Implementation Guide, 2020: 23-24). All these contextualizations may practically require pre- or post-meeting activities (i.e., rhythmic expansion), which could be interpreted as a second kairorhythm, partly overlapping with the condensed meeting time, but simultaneously stretching beyond it.
Related to that, we can identify another kairotic referencing to time, which is the importance of identifying ‘trends’ within the data as part of the review process. While these trends occur over a period of (chronological) time, there is nevertheless a decidedly kairological dimension to their recognition and, in turn, the teams’ response to them. For instance, a student might be ‘getting better’ or ‘getting worse’ (i.e., becoming less or more ‘at risk’), and thus parsing these trends to determine the appropriate time and course of action is paramount. As noted in the Implementation Guide, ‘… the process of reviewing early warning data and identifying appropriate support strategies and interventions is timely and responsive to individual student needs’ (Implementation Guide, 2020: 6; emphasis added).
This tension between essentialising and particularizing can also be seen in the standardization of possible interventions within the intervention catalogue that can be deployed in Step 5 (‘Assign and provide interventions’; Implementation Guide, 2020: 28), which contrasts with needing to assign specific interventions on the basis of individual student risks and requirements (ibid.: 30). Put differently, there is a predetermined (and thus temporally ‘squeezed’ [Rosa, 2016]) catalogue of possible interventions in the EWS, and yet there is the need for these universal solutions to respond to the particular needs and requirements of the student identified as ‘at-risk’.
Lastly, and as noted above, the Implementation Guide reveals references to algorhythms mostly with regard to (human) data input/updating and processing. Different from other (and newer) EWS, data updating does not happen automatically (e.g., based on data interoperability with the School Management System), but requires a deliberate (human) moment of inputting. Since up-to-date data are a key precondition for the EWS to operate, such moments of data inputting are, consequently, imbued with substantial kairotic implications (see above), while they simultaneously form the starting point for the algorhythm to operate. The algorhythm, at that stage, runs until the output of data dashboards (including student flagging) is produced, and then pauses until the meeting has happened. During the meeting, (standardized) interventions from the data system are being selected, resulting in another (smaller) algorhythm of linking student data to interventions, and to follow up that linkage during the next data updating.
In sum, as this first lens of investigation showed, the active disentanglement of chronorhythms, kairorhythms and algorhythms enables us to develop a more nuanced understanding not only of the variety of temporalities involved in the EWS setup and operation (as visible in the Implementation Guide), but equally of their ‘positionality’ within the overall rhythmic assemblage of EWS. At the same time, the investigation already clearly pointed to the close interrelation of i) different rhythms of the same type, and ii) different rhythmic types. It is the latter to which we, consequently, turn next.
Rhythmanalytical dimension II: analyzing the interrelation of rhythms
Building on the identification of different temporalities and rhythms in the Implementation Guide, the second phase of our methodological framework entails analyzing how individual rhythms interrelate with one another. More specifically, this includes three main forms: i) synchronization, or the coordination of rhythms in time; ii) sychorization, or the coordination of rhythms in space; and iii) disruption, when the introduction of a given rhythm works to displace or marginalize other rhythms present. While synchronization and disruption are again concepts taken from the more classical rhythmanalysis literature, we complemented them with the term sychorization, which refers to the coordination of rhythms in space (Lyon, 2018: 86). This term is particularly useful in that it reminds research to remain constantly attentive towards the spatial dimensions, elements, and impacts of rhythms, and hence, to make clear that rhythms are a coming together of both temporal and spatial features (ibid.).
Using the aforementioned data review and intervention assignment meetings as a starting point, we can clearly see in these meetings a central moment of, first, synchronization, in which chronorhythms, kairorhythms and algorhythms are brought together in time for the purpose of determining students deemed to be ‘at-risk’. This decision-making is based on the early-warning data provided from the EWS (algorhythms), the regularly scheduled nature of the meetings referenced to the school year (chronorhythms) and the need of team members to consider these EWS data – alongside supplemental data and their professional opinions – to decide on timely interventions (kairorhythms). While these meetings serve as the interface between the digital and physical (see above), they equally coordinate and synchronize the distinct rhythms present in the system. This not only enables intersections of people and data to occur as meetings in the first place, but it also allows for subsequent decisions (and reflections on these decisions) to be made on the basis of these meetings.
At the same time, the meetings also serve as a clear instance of sychorization, whereby the data present on digital dashboards are brought (via the screen) into the same physical space as human actors and other supplemental (and possibly analogue) data. These meetings happen at a certain dedicated moment in chronological time, but they at once equally constitute ‘the right time’ to take action, and they are very much steered by the algorhythms of the EWS. Put differently, all three rhythms not only operate next to one another, but are rather entwined together in a harmonized, orchestrated manner.
Starting, in turn, from the algorhythms in the EWS, we see that they partly occur outside of/ separated from other rhythms (e.g., independent data processing) but also connect to chronological and kairological time(s); for instance, they are visible in the meetings that depend on a previous data processing loop. We can then see how it is the algorhythm that actually structures how chronological and kairological times and rhythms can be enacted during the meeting. In turn, the algorhythms do not have any effects without the chronologically scheduled meetings and the kairologically decided interventions. Coming back to the circle model discussed above, the very nature of Steps 1–7 depicted in Figure 3 further mirrors such algorhythmic periodicization, which forms preconditions of the system's operation, while at the same time becoming entwined ‘with’ the standardized chronological framing of the school year. It is, then again, only through the beat of the frequent data processing that steps 3–6 – comprising the ‘core rhythm’ of the EWS – can occur periodically and pulse throughout the school year (3, 4, 5, 6 … 3, 4, 5, 6 … 3, 4, 5, 6 …).
However, it is not just (more or less intensive) synchronization and sychorization of rhythms that is of interest when investigating the possible relations between chrono-, kairo- and algorhythms. Equally, we are concerned with disruption, or the ‘de-synchronization/-sychorization’ of rhythms. An interesting example of such rhythmic disruption is the moment that students are flagged to be ‘at-risk’ and assigned with interventions. It is in such moments that students, who were beforehand not affected by the EWS rhythms, become ‘drawn out’ of the usual school and classroom rhythms, and ‘drawn into’ the spacetimes of the EWS´s rhythmicality. It is only now that such students become subjected to the direct influence of the EWS algorhythms and kairorhythms. This ‘drawing in’ supposedly occurs within the (external) chronological time of the school year (in which the students further participate), but there is equally an intensification of how this ‘intervention time’ is temporally ‘loaded’ with the fear of being ‘too late’, which also means that intervention-induced student progress must become visible until the next moment of (kairotic) data review. One could possibly interpret this as temporal acceleration for those students, as they become drawn into the EWS rhythms, which then slowly decreases during the time until the next meeting, in which the ‘predicted’ future (potentially) becomes the ‘actual’ present. Depending on the student's responses to the selected interventions, we can then anticipate two possibilities. First, if the student has responded favourably to the intervention, there is a resynchronization with the usual chronorhythms of the schoolyear (i.e., they are ‘released’ from the accelerated EWS spacetimes). Alternatively, if the student has not responded favourably and is still deemed to be at-risk, the result is an even further increased temporal pressure in order to get the student back on track within an even shorter period of time (i.e., running against the overall EWS finish line at the end of the schoolyear).
Another example of rhythmic disruption in the aforementioned disjuncture between essentialising and particularizing; that is, the standardizing chronological time of student monitoring and intervention that the Implementation Guide seeks to enact, and the simulateneously emphasized need to account for ‘individual student needs’. As much as the Implementation Guide suggests the (possibility of) strict ordering of time, there is equally the sense that chronological time can only be ordered so far before it effaces the individualization necessary to deal with ‘this student’, rather than essentialised ‘students’. Despite the presence of algorithmic processing, the ability to delineate the ‘right’ time and the ‘right’ degree and type of intervention requires that teachers still exercise their discretion, both individually and in concert with their colleagues, (here) mainly at the periodic EWS meetings. This also reflects that the ‘right’ (kairologoical) time and type of intervention will ultimately vary by the individual student and the nature of their ‘at-risk’ status, even while the periodicization of these check-ins and their standardization are running.
In sum, our investigation of rhythmic interrelations reveals a number of interesting findings, which also allow for broader conclusions regarding the operationality of digital governance. We see how the question of ‘which rhythms matter most’ cannot be answered easily, but that the answer strongly depends on the specific part of the EWS assemblage. Equally, each type of rhythm also constitutes preconditions for the others, and all identified forms of rhythmicity happen and impact one another simultaneously. This finding seems particularly relevant regarding the evaluation of digital governance systems, which are oftentimes (quickly) framed as overruling other (temporal) forms of governing.
Rhythmanalysis dimension III: visualizing rhythms
As noted earlier, the Implementation Guide itself can be regarded as undertaking rhythmicity by (co)constructing and mediating particular rhythmic understandings of time. One way of doing so is through visualizations, such as the above circle model (Figure 3), which not only suggests that EWS are constituted by different rhythms, but also equalizes these rhythms visually, as same-sized, cake-shaped pieces of a circle. In contrast, even though entangled within the textual components of the figure, the distinct nature of chronorhythms, kairorhythms and algorhythms is rendered invisible, just as is the co-existence of multiple chronorhythms.
When engaging with the case, we consequently felt that this performativity of visualization needed to become integrated into the framework, especially since we found hardly any critical discussion of this perspective in the rhythmanalytical literature, even though visualizations of temporalities are oftentimes presented (see, for instance, Miranda et al., 2016; Mareggi, 2013). Hence, this last sub-section engages with the question of how visuals always (co-)construct a selective view on rhythmic complexity. That is, by selecting distinct elements to visualize (and not others) and by drawing them in a particular way, they exercise rhythmic power – i.e., they make up particular rhythmic ‘worlds’ – in the context of temporal governance. At the same time, we discuss how visuals can be presented (differently) in ways that illuminate the complex rhythmicity in EWS as suggested in the Implementation Guide.
To begin with, when looking into literature on rhythmanalysis (and we are only referring to that literature here, acknowledging that there is a much broader field of research on visualization per se), we find numerous studies that include visuals. And yet, as noted above, these are typically employed without (to our reading, at least) a more critical methodological reflection. At the same time, we see that most visuals (re-)enact a chronocentric understanding, with a clear emphasis on chronorhythms that are visualized, for instance, in linear graphs to be read from left to right (e.g., Mulíček et al., 2014: 312). Importantly, we do not argue here that such chronocentric visuals cannot be useful, but rather that they foster a particular (chronological) view on rhythmicity.
In turn, visualizations of kairo- or algorhythms still seem to be much more scarce (but see Alirezabeigi et al., 2023), despite the growing importance of algorithmic data production and data flows as backbones for visual production, such as in the field of urban studies (Miranda et al., 2016; Mareggi, 2013). One inspirational example that we found in this regard is Miranda and colleagues’ visualization (2016) of human activity at particular places of a city, based on social media data posted from those places throughout the year. The number of posts (captured as different levels of activity) were coloured differently, with the aim to visually display them with circles denoting ‘pulses’ or ‘beats’ (a concept also used, but not visualized, by Coletta and Kitchin (2017) in their study on urban algorhythms). In other words, next to the selecting of which specific rhythms to visualize, the actual drawing of rhythms (e.g., lines and circles) forms a central dimension that enables one to visualize how rhythms co-exist, synchronize/sychorize and/or disrupt one another.
Transferring this visualization idea to our EWS case, we first focused on the computational activity of the EWS and generated a visual line of algorhythms (Figure 4). As noted in the last sections, the algorhythmic ‘core beat’ – at least in the rationale of the Implementation Guide – has its particular emphasis on the period between (manual) data input/update and data dashboarding, and ends with the automated flagging of students. Afterwards, there is another, yet smaller, beat around the manual assignment of interventions in the system by the EWS group, which, together with the next periodical data input, forms the background data for the next algorithmic calculation.
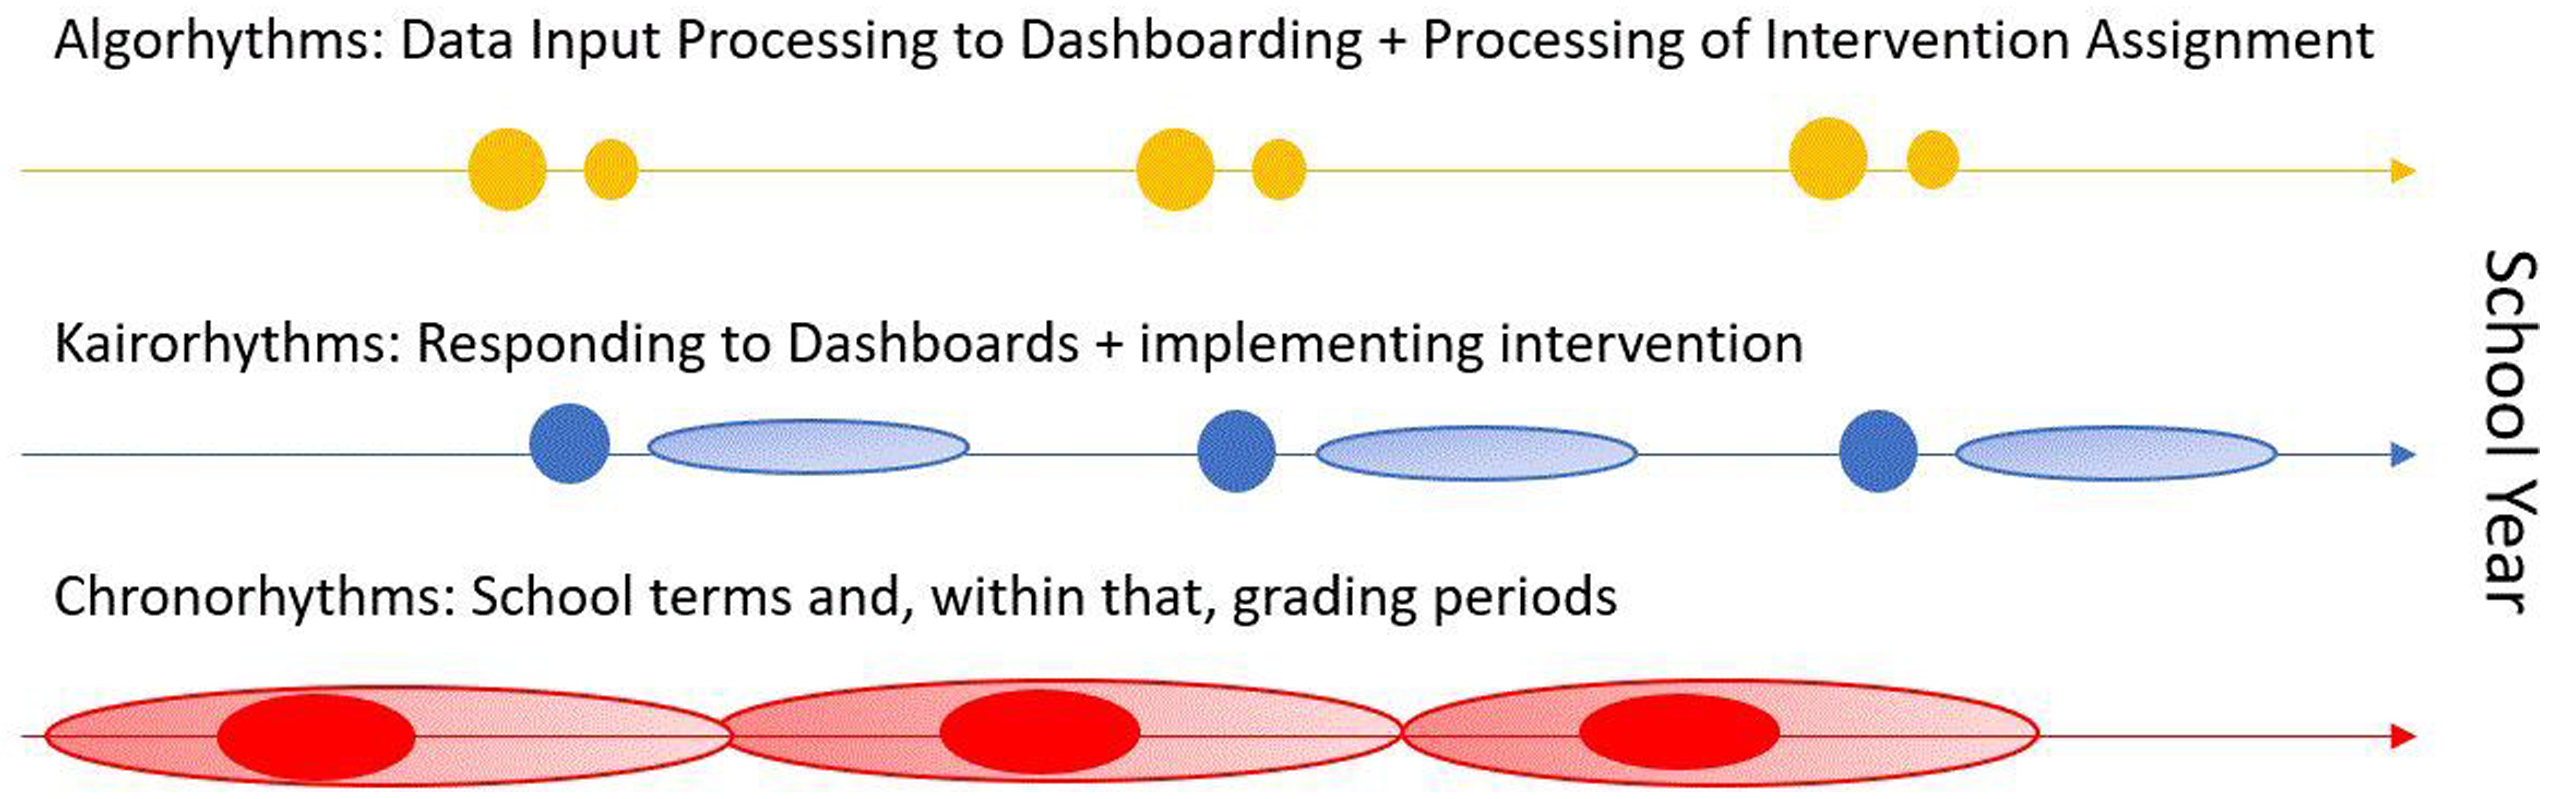
Visualization of EWS rhythms, example 1.
Visualization of EWS rhythms, example 2.
Based on this first line (and rhythmic display), we then drew a second line representing EWS kairorhythms. As shown above, the Implementation Guide suggests there is one ‘proper time’ of intervention, which is after the data dashboard and flagging has happened, and synchronized/sychorized through the meetings. At the same time, we further differentiated between the actual assignment of the intervention in the digital system (beat 1, strongly synchronized with the algorythm) and the actual analogue process of ‘intervening’, which may last a lot longer than the actual interaction with the digital system (beat 2, fading). In visual terms, this means that the ‘pulse’ of the kairorhythm falls in between the algorhythmic beats and then fades out until the next meeting.
In a last step, we complemented this arrangement with a line for chronorhythms. As argued above, the visual setting of arranging a line from left to right already presupposes a chronocentric frame, which in our case could, for example, be a typical school year, as framed in the Implementation Guide. Within the school year, we could, then, visualize other chronorhythms that are identified as being particularly relevant for the EWS functioning. As noted above, such other chronorhythms are, for instance, grading periods, which are imagined as happening immediately before the EWS data input and processing algorhythm. Different from the kairorhythm, this ‘beat’ is, in each EWS cycle, singular.
As these brief explorations of a potential visualization strategy show, the very act of creating visuals and positioning rhythms and their relations within forms its own type of rhythmic analysis (and methodological challenge). It emphasizes how the genuine ‘problems of visualization’ (such as: where to visually place something, etc.) can, on the one hand, fruitfully enhance our understanding of how rhythms operate, how their interrelation manifests, and what conclusions on both temporal and digital governance can be drawn. On the other hand, it clearly points to the multiple moments where those rhythms are co-enacted by the researcher, and where the created visual carries with it a performative power, i.e., it fabricates a particular temporal ‘world’.
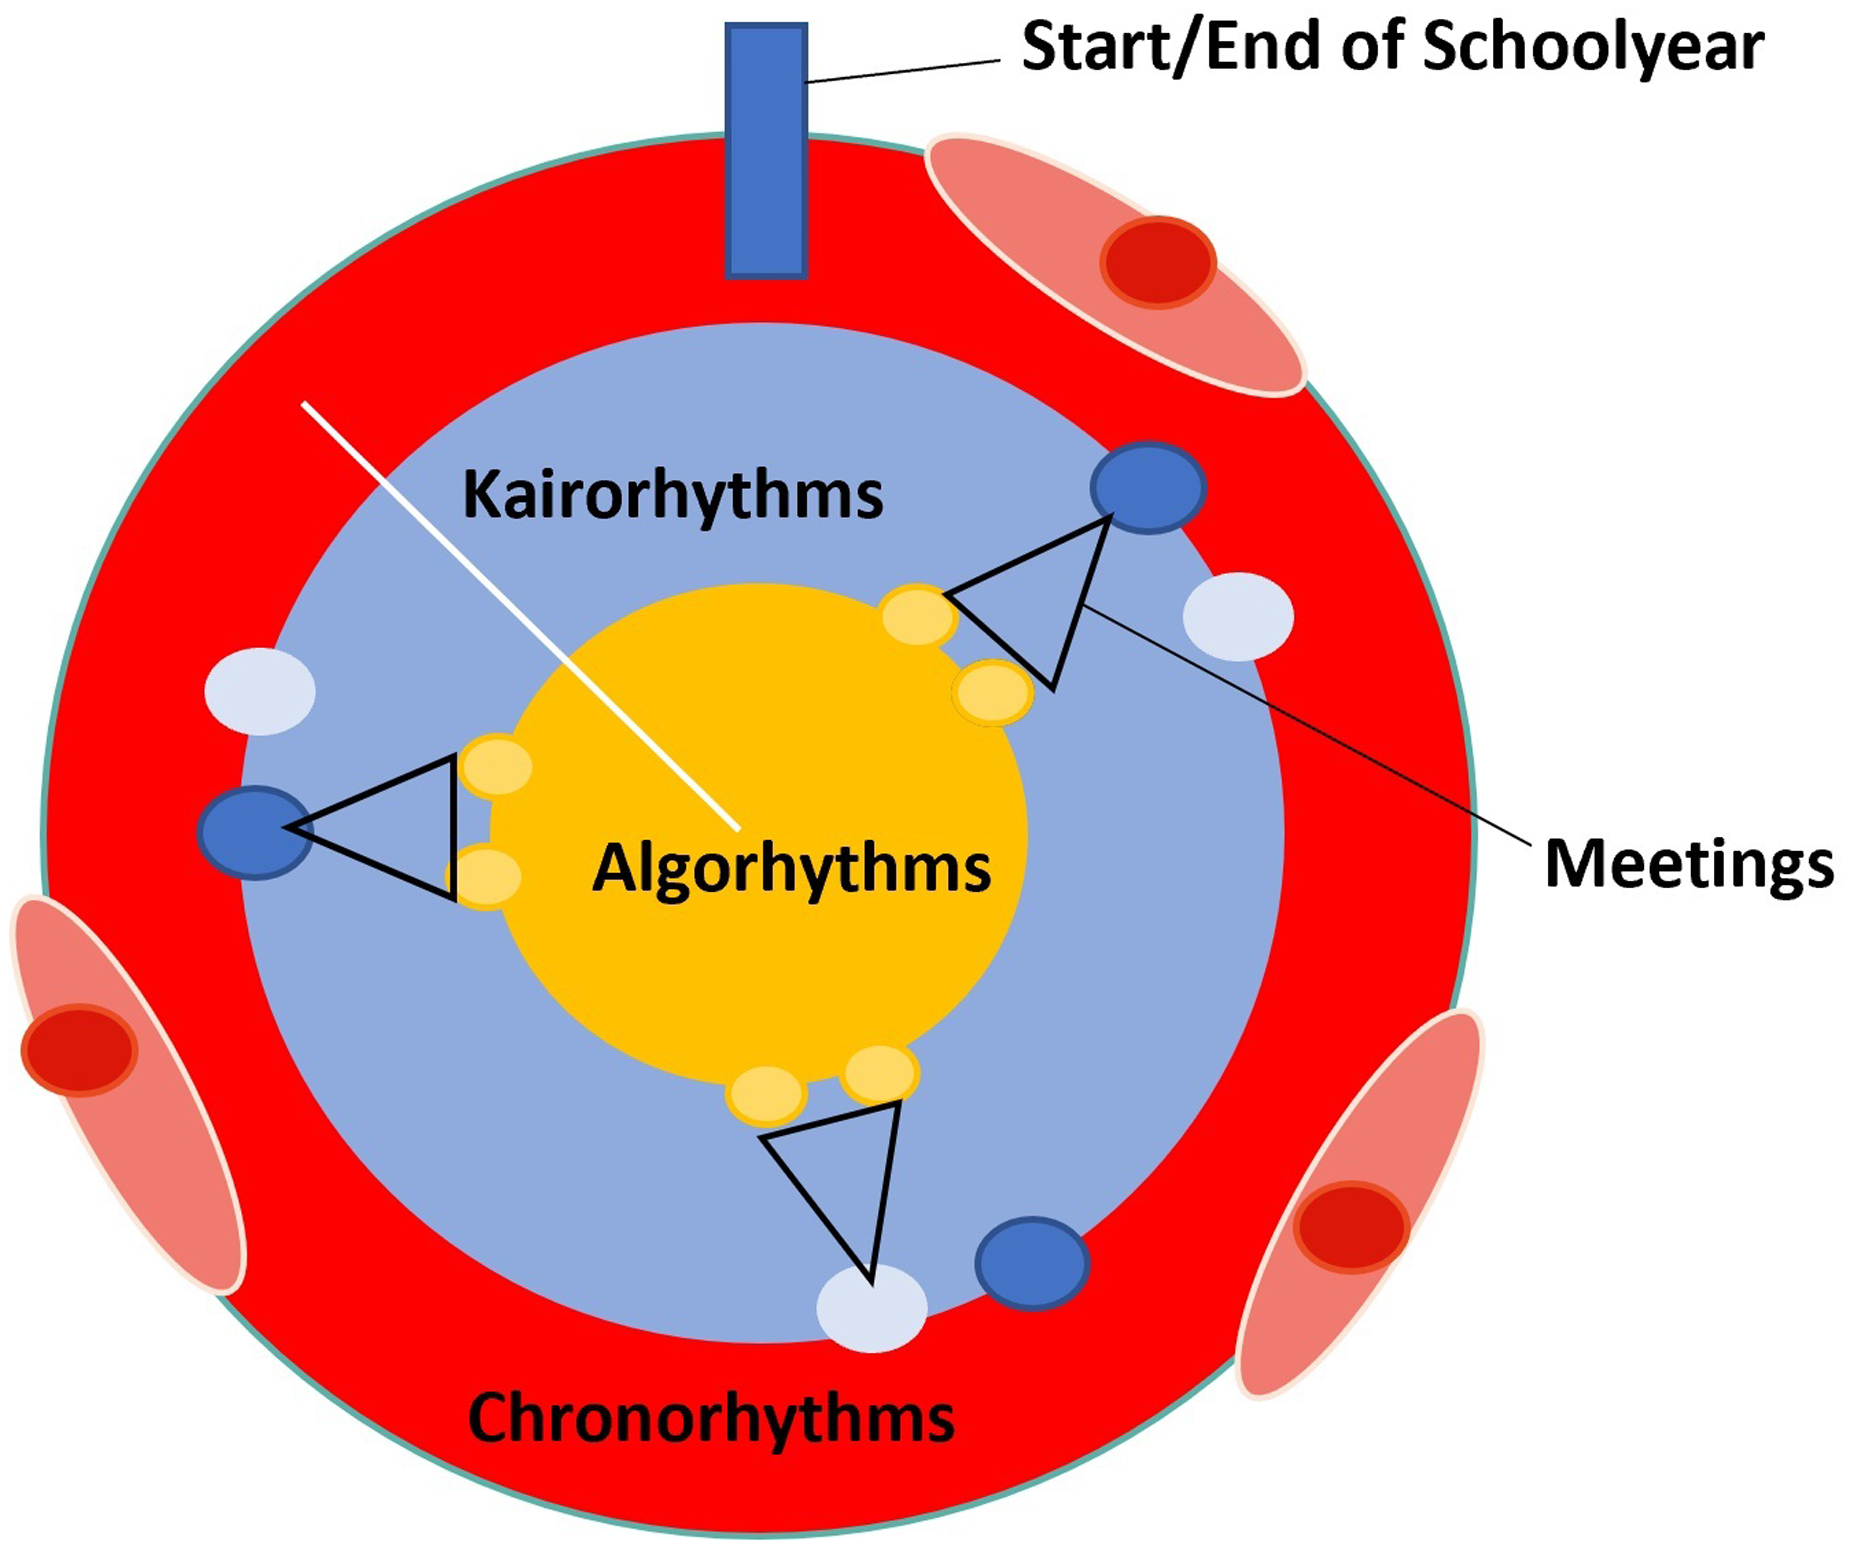
Visualizing rhythms, as we did in Figure 4, clearly poses certain drawbacks as well. As mentioned above, ‘horizontal’ temporal visualizations can be problematic regarding their implied chronocentrism, which suggests a chronological timeline from left to right, and repetitive rhythms either within that line, or when rereading the lines. This is why we would like to equally discuss an example for selecting and drawing rhythms that is suggesting a circular frame. More specifically, we refer here to the so-called ‘beat wheel’ method (Suissa, 2019). The idea of the beat wheel visual, which originated in music theory, is to arrange beats (e.g., sounds of a drum) in a much more ‘realistic’ manner than notes on a sheet do. When being ‘started’, the proverbial ‘clockhand’ starts turning, activating a beat when passing the dot. Different colors of dots mark the volume and type of beat, so that even complex rhythms can be visualized in different beatlines. This arguably needs a different and more complex selection of elements to include in the visualization of these rhythms.
If we follow a similar attempt as with the former visualization example, and try to draw the aforementioned algo-, kairo- and chronorhythms in the wheel, we see that, first of all, many things appear similar (the lines now being rings of the wheel, and the beats being organized around the wheel). At the same time, the non-linear visualization fosters a visual understanding of chronorhythms forming one of many parts of the wheel, instead of the overarching frame, in which other rhythms are being visually positioned (and, thus, creates an according visual idea of the temporal world). In addition, the wheel invites us to also include visual elements that are spanning across different lines. Here, we see a fruitful option to also include the element of sychorization (here: triangle) – namely, the physical meetings within the EWS cycles – but also to play around with different shapes (other than dots).
What becomes clear when reflecting on both visualizations is their emphasis on synchronization and repetition, with far fewer options for emphasizing disruption or change. However, both are elements that, as shown above, play a crucial role in rhythmanalysis and EWS. Consequently, a key challenge for developing such visualizations further would lie in exploring different options in that direction. The first visualization, for instance, offers the simple option of changing rhythmic patterns if the chronological line is extended beyond one school year. But equally, the beat wheel could include, for instance, line breaks, or visual elements that mark acceleration or slowing-down. Deliberately expanding EWS analysis to the level of school practice (e.g., researching how a school actually uses EWS throughout the year) marks a further option to increase the sensitivity for visual requirements to show what is ‘really going on’ when the rhythms of EWS are being ‘lived’. It is at the latest here that visualizations also appear as potential counteracts of ‘emancipatory education’ (Alhadeff-Jones, 2017); that is to say, as methodologies that show those – contradictory or harmful – sides of temporal governance that are oftentimes (deliberately) hidden in policy documents, such as implementation guides.
To sum up this last analytical section, we would like to emphasize that the visualization part proved to be a considerably more challenging for us, as researchers, than the other parts. Even though the absence of proper visualization skills in the author team undoubtedly constitutes part of that challenge, we equally think that this has something to do with the interpretive acts that are required to identify and subsequently visualize rhythms and their interrelations. When trying to describe the rhythms enacted by (interactions with) digital technologies, the challenge for researchers is precisely to create non-linguistic (e.g., visual) ways for analyzing data that were, in our case, largely consisting of discursive elements (i.e., focused on a written document as case material). In other words, analyzing (interactions between) rhythms implies a need to go beyond what is discursively uttered, even though such ‘non-linguistic analysis’ subsequently needs to be written out in an intelligible manner for the reader. Even though we readily admit the challenging nature of this interpretive work, we do hope that this section still has illustrated some of the various ways to productively deal with such possibilities.
Concluding thoughts
The goal of this article was to present rhythmanalysis as a methodological framework that can assist in understanding the various temporalities of digital governance in general, and of predictive (education) governance in particular. The methodology that we propose aims at disentangling the various rhythms that originate when algorithmic technologies unfold, and draws attention to the multiple interrelations of rhythms, rather than necessarily suggesting a clear dominance of one form of rhythm(s) above others. Put differently, we showed how algorhythmically induced temporality, at least on the level of EWS design (i.e., the Implementation Guide), does not necessarily overrule other forms of temporality (such as chronorhythms and kairorhythms), but that there are various types of interdependence and interrelation, in which algorhythms also become heavily chronologically and kairologically shaped, and vice versa. While we acknowledge that how these rhythmic interrelations are, ultimately, practised – i.e., how they manifest as ‘rhythms in practice’ – lies beyond the scope of this paper, we invite this interest in future enquiry, including our own. For instance, we are indeed interested in further pursuing an exploration of the ‘lived rhythms’ of EWS via more ethnographic approaches, which might apprehend how teachers, students and other school actors inhabiting these timespaces perceive and make sense of rhythms and temporality. Moreover, we equally see importance in tracing the capacity of repetition to produce difference in different sites and moments, since the actual practice and enactment of EWS will invariably take on slightly different forms through each (re)iteration of the rhythm that occurs, regardless of how it is rendered in the idealized policy documents.
To end with, we would like to reemphasize that our attempt with this contribution was less to provide a generic methodological ‘how-to-guide’ and more to showcase various methodological routes (and accompanying reflective moves) that show a potential rhythmanalytical methodology ‘in action’. In that regard, while our methodological approach has been developed from a single case, our contribution should equally not be read as a conventional ‘case study’ analysis. Rather, we have used the EWS case to demonstrate the utility of rhythmanalysis for better understanding the rhythmic complexities of digital governance. This reflects what has been described by Lury (2012) as ‘live methods’, in which research reflexively and intentionally engages with ‘relations and with parts, with differentiation, and be involved in making middles, in dividing without end(s), in mingling, bundling and coming together’ (ibid.: 191). Or, as Piattoeva and Saari (2022), as well as Decuypere and Lewis (2023) showed, novel research problems, such as digital governance, can only be approached by starting ‘in the middle’, and by acknowledging that methodologies are co-constitutive of the settings of which they enquire (Lury, 2020). Put differently, the research gazes made possible by a rhythmanalysis lens necessarily become enfolded with the empirical practices of the objects one is studying. This means that any research intervention or problematization is deeply implicated in the data that will be gathered and analyzed, and equally in the (sorts of) results that get published, and which consequently find their way back into practice, in both foreseeable and in unexpected ways (Lury, 2020). This also means, in the end, to actively embrace the contingency of research that emerges by staying close to both theory and practice, and to recognise the entanglement and imbrication of one with the other.
Footnotes
Declaration of conflicting interests
The authors declared no potential conflicts of interest with respect to the research, authorship, and/or publication of this article.
Funding
The authors disclosed receipt of the following financial support for the research, authorship, and/or publication of this article: This work was supported by the Deutsche Forschungsgemeinschaft (grant number 423781123) for Sigrid Hartong.