
Abstract
The organic market is growing, and confidence is key. However, it is hard to distinguish an organic product from another regular product. In this article we examined a consumer NIRS-Vis device for its capabilities to distinguish organic retail milks from conventional milks. The study revealed differences between the two groups, allowing classification of samples, but these differences were not as distinct as those provided by other devices examined previously. Nevertheless, with some improvement of performance of this kind of devices and integration in smart phones, authentication of foods is within reach of citizens in the near future.
How organic is organic?
The term “organic” refers broadly to agricultural practices that cover particular resource usage and considers animal welfare. Frameworks for organic practices have been established by several international organisations in order to formalise and certify “organic” producers. In the EU, organic products have to meet specific EU regulations.
The organic food production and industry in Europe is a lucrative market. Retail sales amounted approximately 30 billion euros in 2015. Considerable growth in consumption of organic products is seen, with Eastern European countries catching up. Germany is the leading market for organic products with a share of 11% of global organic sales. 1
Global milk production amounted ca. 800 billion litres in 2017, ca. 1% of which was organic. Nevertheless, milk is an important product in the organic assortment. Its global annual value is estimated at four billion euros currently. The organic farming costs are 1.3–1.6 times of those of conventional farms. This results in an added value for organic milk at the farm gate of 27–44% compared to conventional milk, and at retail level of an additional 9–53%, depending on the country.
Although consumers have doubled their consumption in the last decade, this demand is outstripping supply. This results in rapid changes in organic market dynamics and marketing opportunities, which may be addressed in an unfair way by those that override their moral compass. To combat this kind of fraud and limit its impact, fraud mitigation measures are implemented. One of these measures is analytical testing of products, but this comes with a challenge for organic products, because there are a fairly limited number of methods available. For organic milk authentication, carbon and nitrogen isotopes have been suggested, 2 as well as fingerprints of the fat fraction of milk. 3 Although these methods work reasonably, they can only be conducted in a laboratory environment. Recently, near-infrared spectroscopy (NIRS) – as a more rapid tool – has been evaluated in our laboratory for distinction of organic milk from conventional milk, both in the form of benchtop and handheld applications. For screening purposes, both seem feasible. 4 However, the handheld device tested was in a price range suiting inspectors or larger companies, but not consumers. How interesting would it be if organic products could be subjected to crowd analysis, with consumers testing their own foods? This article deals with such an application. We developed an application to distinguish organic milk from conventional milk in the Netherlands for a low-price NIRS-Vis device which runs with an app on a smart phone and uses cloud calculations, and we evaluated its performance.
What did we do?
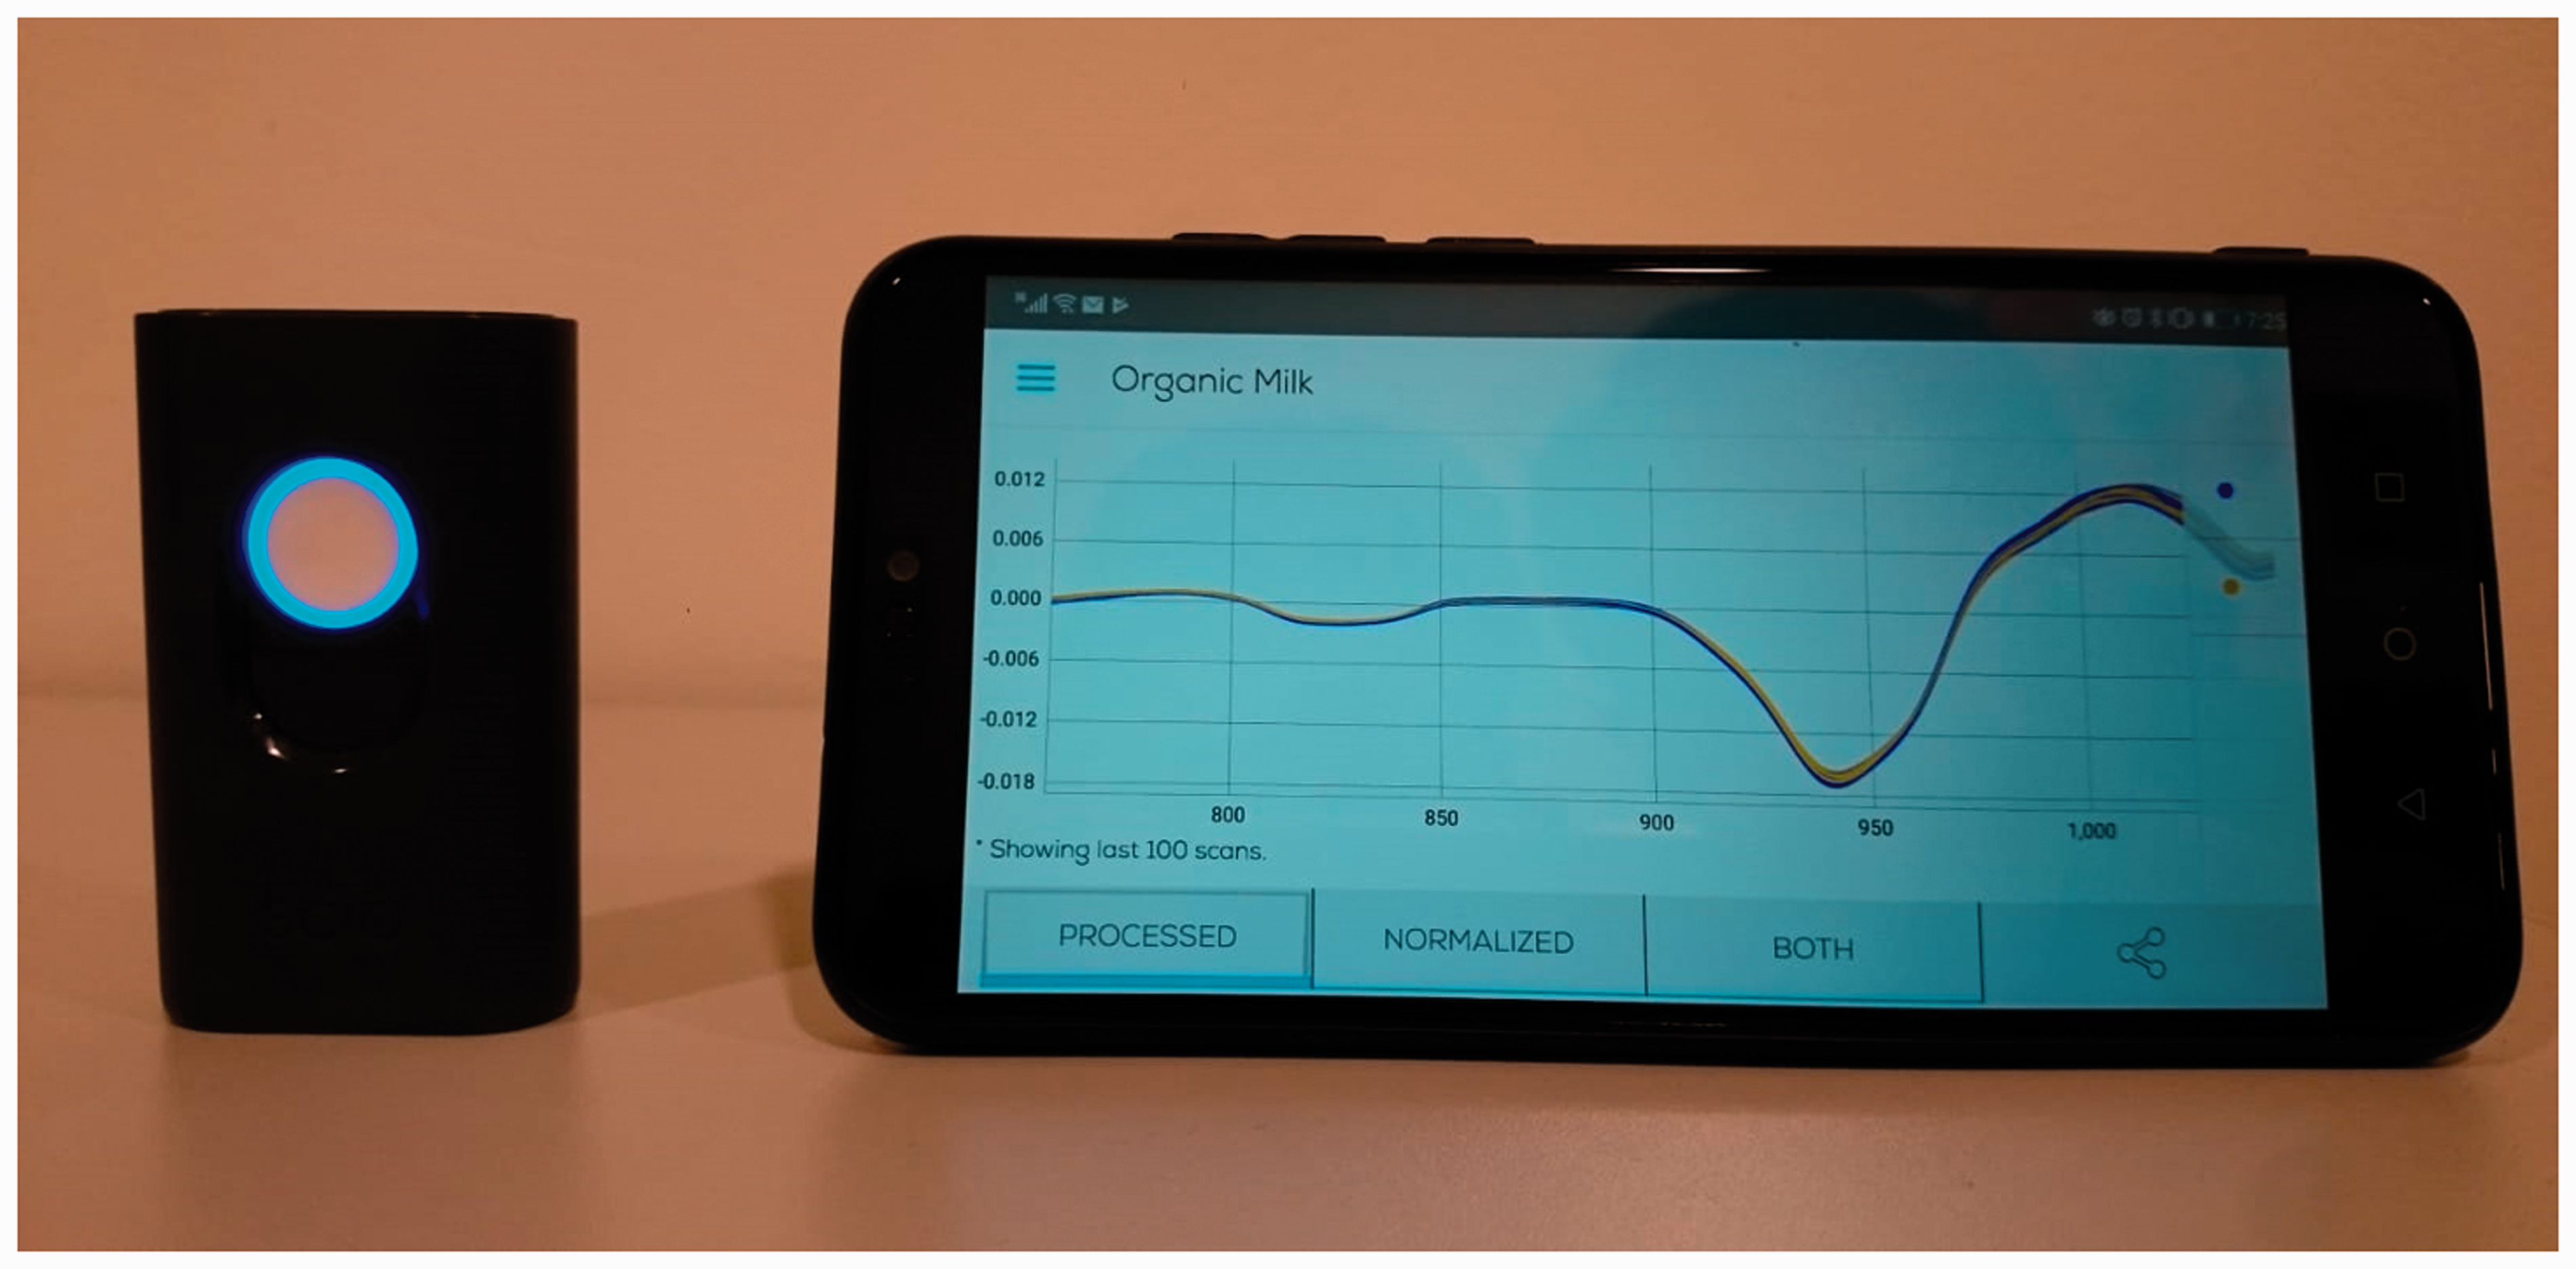
Eighty-seven samples of full-fat, pasteurized retail milks were collected from grocery stores in the Netherlands during a period of eight weeks in the summer of 2016 (Figure 1). The sample set included 37 organic retail milks and 50 conventional (non-organic) retail milks. All samples were analysed in triplicate with the mini Scio device (Consumer Physics, Israel; Figure 2) along with its accessory for measurements in liquids allowing submergence of the device in a glass beaker of milk. Transmission data in the 740–1070 nm range were collected in triplicate, and calibration with the device white reference was conducted after analysis of each set of three samples (nine replicates). The device was operated with the company’s developer app for smartphones and tablets available in google store and Apple store, and was synchronised with a smartphone via Bluetooth. Connection to the internet allowed storage of spectra in the developer’s portal or SCIO cloud. After completion of the analyses, all data were exported to Excel and triplicate readings were averaged for further data analysis. Classification statistics (Partial Least Difference Discriminant Analysis (PLS-DA)) were applied to the pre-processed data in order to examine the distinction of organic from conventional milk samples. The milks were also analysed for their fatty acid compositions by gas chromatography flame ionization detection. The correlation coefficients of the fatty acid proportions and the wavelength absorbances measured with the Scio device were calculated to explore underlying relationships.
Milk samples for analysis. The device.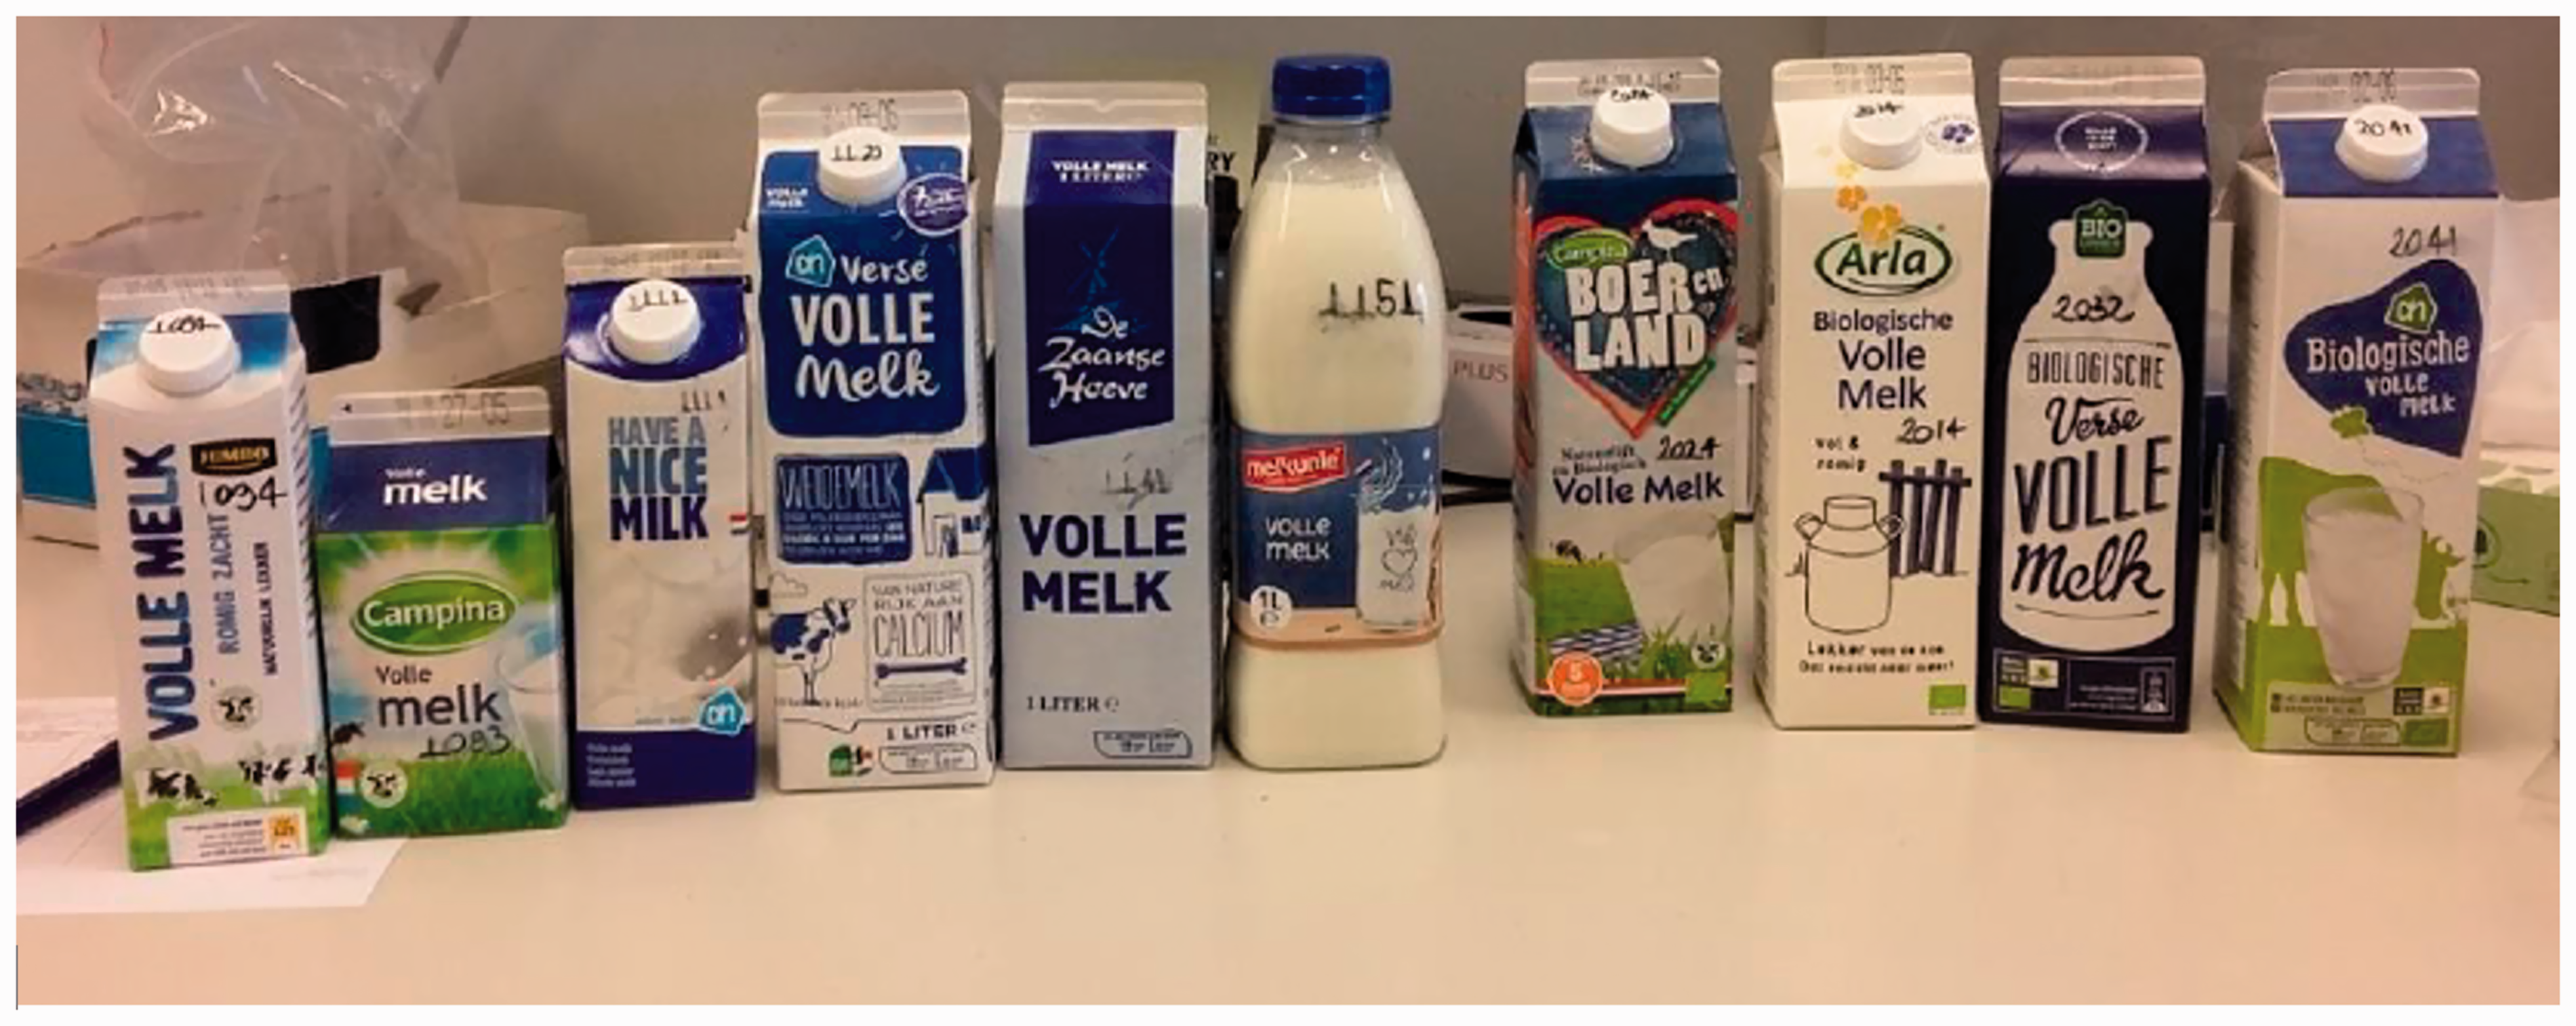
What did we find? Did it work?
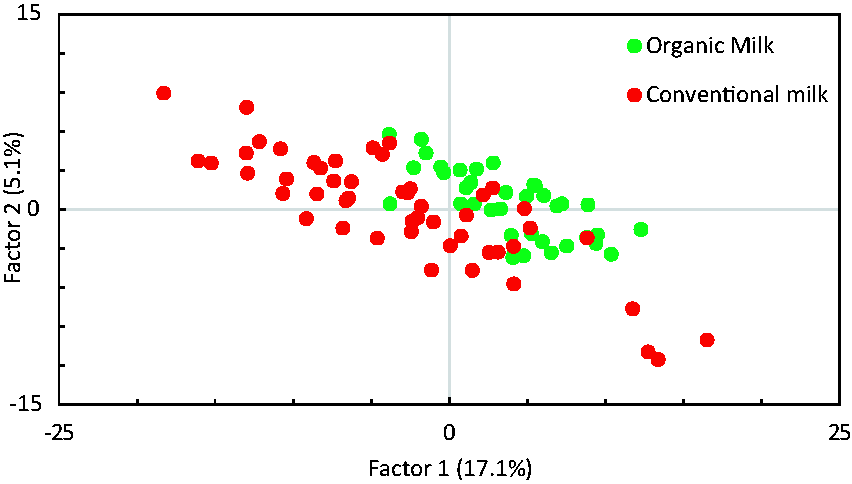
The organic and conventional milk samples were all analysed with the portable device. Mean spectra for organic and conventional milk groups are presented in Figure 3. The mean spectra show differences between the two groups, which is promising. However, one has to consider the variation within the groups as well. Statistical comparison of the pre-processed data with classification statistics revealed reasonable separation of the two milk groups (Figure 4). In cross validation, 89% of the organic milk samples and 80% of the conventional milk samples were assigned to the correct class. This result is reasonable considering that the previously examined handheld equipment for professionals or benchtop NIRS presented better performance.
4
The major advantage of this tiny device is, however, that it is in the price range of consumers and, therefore, available to many. This makes it even suitable for citizen science.
Mean NIR spectra of organic and conventional retail milk samples acquired with the Scio device. Plot of the PLS-DA (classification statistics) on the spectral data of the organic and conventional milk samples acquired with the Scio device.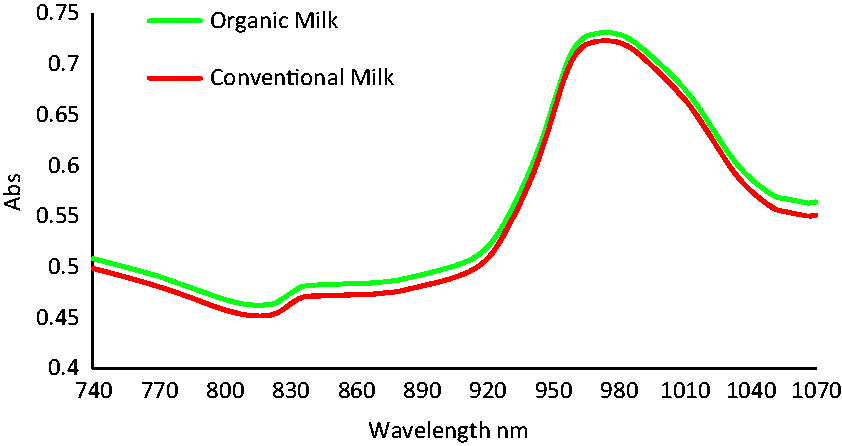
In order to examine the underlying reasons for the separation of the organic and conventional milk samples, the spectral data were correlated with the fatty acid composition data.
4
The results are shown in Figure 5. C14:0 (myristic acid), C16:0 (palmitic acid), and C18:1 (oleic acid) together account for more than 50% of the total fatty acids. They all show higher concentrations in conventional milk than in organic milk. In the 740–920 nm wavelength range the correlation is relatively constant and the absorbance readings correlate primarily with larger fatty acids, including C18:1. In the 950–1040 nm range, other fatty acids start to play a role as well. These are mainly the shorter chain fatty acids. C16:0 also shows a distinct correlation with absorbance readings in this spectral range.
Correlation plot of spectral data acquired with the Scio device and the fatty acid composition of the organic and conventional milk samples.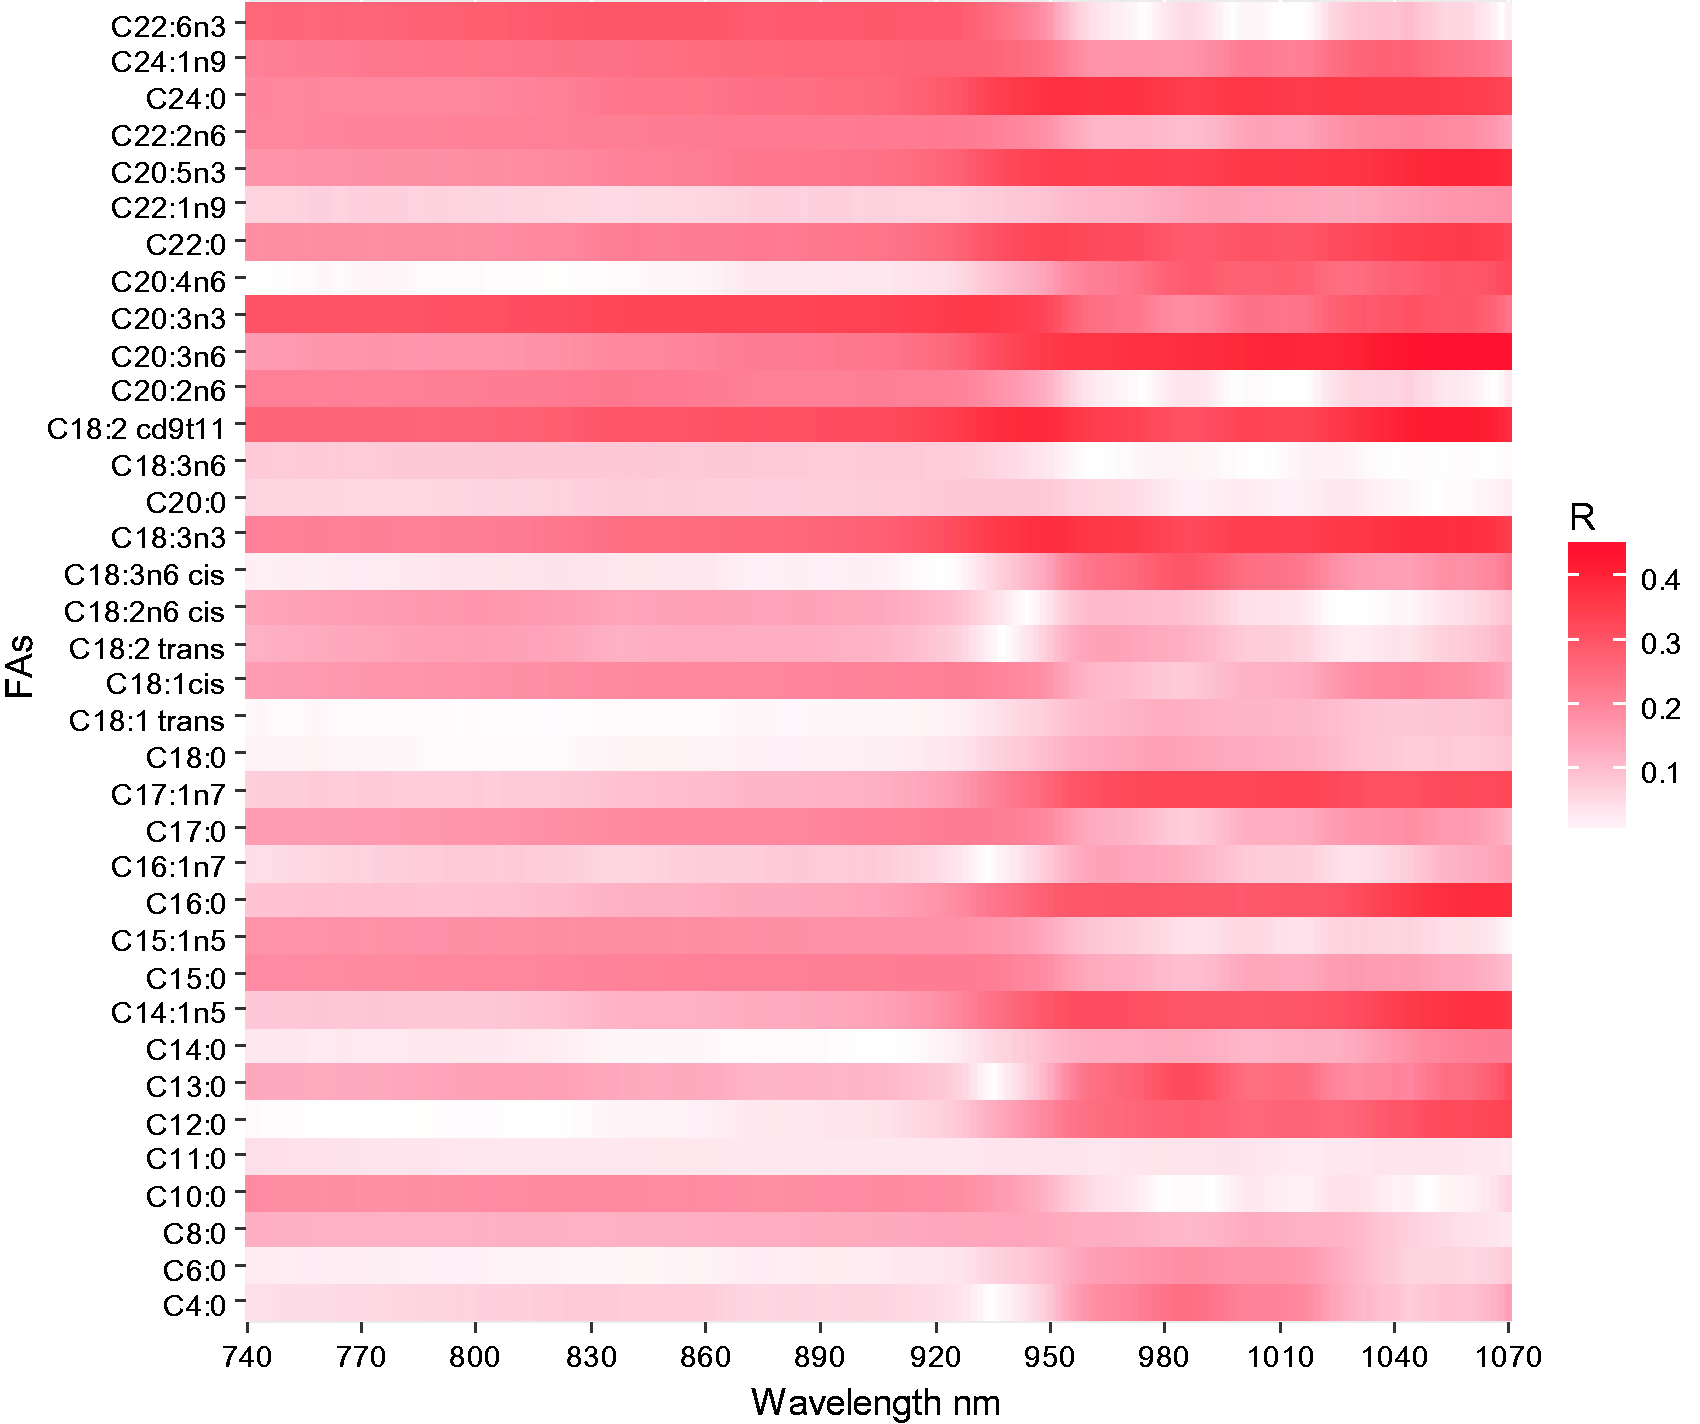
Concluding remarks
Our previous study showed that professional NIRS-based handheld devices present similar performance as a benchtop equivalent in terms of distinction of organic and conventional retail milks. We presented in this article the next step, the evaluation of a consumer device. It does show separation between organic and conventional milks, but the difference is not as distinct as with the other devices. On the other hand, it is a major step forward to be able to generate some relevant information on the production identity of milks with a consumer device.
Outlook
Developments with regard to miniaturization of devices which allows us to bring a device to the sample, instead of the other way around, are very interesting. There are sensitive, robust devices with a wide wavelength range which are aimed at the professional market, but also more simple devices are sold that are available in the citizen price range. Obviously, performance and price of devices in both groups differ. However, the fact that one can generate compositional information of a sample beyond a laboratory without years of training is a major step forward. First attempts to integrate this kind of sensor technology in smart phones have been made, and when sensitivity and robustness increases over the next few years, citizen food authenticity science is around the corner.
Footnotes
Declaration of conflicting interests
The author(s) declared no potential conflicts of interest with respect to the research, authorship, and/or publication of this article.
Funding
The author(s) received no financial support for the research, authorship, and/or publication of this article.