
Abstract
Fentanyl and fentanyl analogs are the drugs most often implicated in opioid overdose fatalities. Law and drug enforcement agencies are actively working to remove fentanyl-containing drugs from circulation; however, detection in the field can be challenging. Portable Raman spectroscopy is a valuable tool for identifying fentanyl, but the traditional method of identifying compounds requires comparison to a reference library on the system, which can limit the ability to detect novel fentanyl analogs. To overcome this challenge, a spectral barcoding technique was validated using fentanyl and a range of fentanyl analogs in addition to non-fentanyl confusants. Compared to traditional Raman techniques using an internal system library for identification, the spectral barcoding technique was better at identifying fentanyl-containing compounds while ruling out benign samples. Ultimately, this spectral barcoding technique allows for better identification in a constantly changing landscape of fentanyl analogs.
This is a visual representation of the abstract.
Introduction
Fentanyl is a powerful synthetic opioid that has fueled the ongoing opioid crisis and is responsible for a majority of opioid overdose deaths. 1 In the United States of America, mortality due to synthetic opioids has increased rapidly over the last decade, increasing from 5927 deaths in 2015 to 76 385 deaths in 2024, an increase of nearly 1300%. 2 Similarly, reporting from U.S. forensic laboratories documented 130 165 fentanyl samples in 2022 3 compared to 5541 in 2014. 4 Fentanyl is particularly insidious among opioids because it is fatal in extremely low quantities and is often present in illegal or illicit drugs without the user's knowledge. 5 Thus, it is important for drugs containing fentanyl or fentanyl analogs to be identified, confiscated, and destroyed; the seizure of fentanyl by law enforcement is directly associated with reduced overdose mortality rates. 6
In the U.S., law enforcement agencies typically encounter illicit fentanyl and its analogs in one of three main forms: high purity powder, low purity powder, and tablets.7–9 High purity powders are typically seized at mail and international carrier facilities with purities over 90%. Low purity powders are typically seized near the border between U.S. and Mexico and often have purities in the 5–25% range. Tablets are typically recovered during street level drug seizures and commonly have purities in the 1.5–3% range. The balance of these samples can be made up of a variety adulterants or diluents such as carbohydrate compounds like lactose, mannitol, and inositol or medicinal compounds such as acetaminophen, dipyrone, or xylazine. Samples can also contain a variety of dyes which not only can alter the visual appearance of a sample but can also interfere with some detection equipment.10,11
Given the variety of forms that samples can take, accurately identifying fentanyl and fentanyl analogs in the field remains a challenge. However, a number of portable spectroscopy-based techniques, including Raman spectroscopy, have proven to be effective tools for detecting and identifying these compounds. 12 Raman spectroscopy is highly fieldable, requiring little sample preparation and only a short period of time for analysis. Additionally, it is highly specific and non-destructive, which allows for additional laboratory confirmation. Raman spectroscopy has previously been validated as a fieldable method for analyzing counterfeit and suspected illegal substances,10,13 and is capable of detecting fentanyl in those substances.14–20
Raman spectroscopy uses a library of known spectra to identify compounds in the sample being analyzed. The chemical structure of fentanyl (Figure 1) consists of four main components: an aniline ring (cyan), a piperidine ring (purple), an N-propionyl group (green), and a phenethyl group (red). The replacement or substitution of any of these functional groups creates fentanyl analogs of varying toxicity, many of which have been found in illicit drugs.21,22 Worldwide crackdown on specific precursors can cause trafficking organizations to shift to other synthetic routes or analogs. The U.S. Drug Enforcement Agency explicitly schedules 46 different fentanyl compounds but has a catch-all for any “fentanyl-related substances, their isomers, esters, ethers, salts and salts of isomers, esters and ethers,” meaning that drug interdiction agencies are tasked with detecting analogs which may not have been previously characterized. 23 In fact, roughly 10% of narcotics identified by federal, state, and local forensic laboratories in 2022 were fentanyl analogs, comprising more than 25 000 samples identified in addition to the 130000 fentanyl samples previously discussed. 3 The dynamic nature and ever-growing number of fentanyl analogs poses a challenge for Raman detection instruments because of the need to maintain an up-to-date internal spectral library to accurately identify the components of illicit samples. 19 As new analogs emerge and gain prominence, it is not always feasible, cost-effective, or timely to acquire a sample of the new compound, add a new element to the library, and disseminate the new library to operators in the field. Instead, it is preferable to have a screening method that is both sensitive and specific, i.e., capable of classifying unknown fentanyl analogs while minimizing false alarms on other benign unknowns.

Chemical structures for (a) fentanyl, (b) sufentanil, (c) carfentanil, (d) alfentanil, and (e) remifentantil. Other fentanyl analogs can be created by altering the phenethyl group (red), the piperdine ring (purple), the aniline ring (cyan), or the N-propionyl group (green).
Spectral barcoding is technique that overcomes the need for a spectral library by instead utilizing a binary classification system to turn spectral data into a barcode. Spectral barcoding was first developed as a hybrid deconvolution strategy for screening resin polymers,24–26 but has been expanded for use with Raman spectroscopy, including surface-enhanced Raman spectroscopy (SERS).27–29 This technique is particularly advantageous for identifying novel or previously unknown compounds that do not have an existing library spectrum. Previously, spectral barcoding has been used to identify an extremely wide range of compounds, including fatty acids, 30 herbal medications, 31 rice, 32 and counterfeit drugs.33,34 During the COVID-19 pandemic, spectral barcoding was used to identify SARS-CoV-2 variants. 35 Other human health applications have included the identification of oral Candida species, 36 to assist with the diagnosis of colon cancer, 37 and for molecular diagnostics.29,38,39 Spectral matching has also been used to identify counterfeit drugs, but that particular technique exploits inherent characteristics of the drugs being tested rather than using a barcoding strategy, which limits the applicability of the technique. 40 Here, we combine spectral barcoding techniques with Raman spectroscopy to demonstrate a method for classifying samples as fentanyl or non-fentanyl.
Experimental
Materials and Methods
All spectra were collected using a Pendar X10 handheld Raman spectrometer (Pendar Technologies, USA). The system uses shifted-excitation Raman difference spectroscopy (SERDS) with two excitation lasers at approximately 825 nm. 41 Some illicit drug samples can experience high levels of fluorescence from inefficient synthesis reactions or dyes within the material, however using the difference of the spectra collected using the two excitation wavelengths, the instrument is able to reconstruct the traditional Raman spectrum with greatly reduced interference from fluorescence or ambient light. All data analysis was performed using the reconstructed spectra.
Samples
The spectral data were divided into two groups: The first contained long integration scans which were provided by Pendar Technologies and were used to perform the initial analysis and generate the barcode libraries; this dataset is referred to throughout as high signal-to-noise ratio (SNR). The second group contained data collected using the system's automated scan feature. This is the procedure an operator would typically use to collect a spectrum from an unknown material and was used on samples that were synthesized by the U.S. Army Combat Capabilities Development Command Chemical Biological Center (DEVCOM CBC) Agent Chemistry laboratory. Using this method, total scan times were typically 1–10 s. The data in this second group, referred to as low SNR, was used as validation to assess the real-world performance of the barcode technique. All spectra in both groups covered 275–1849 cm–1 with an instrument resolution of 8–10 cm–1.
Each group was further divided into a fentanyl class which contained spectra collected from fentanyl and fentanyl analogs in various free base or salt forms and a non-fentanyl class which contained all other spectra. A small subset of 28 fentanyl precursors, degradation products, and non-fentanyl based synthetic opioids which could not be cleanly placed into either class was identified. These chemicals contain some fentanyl-like structures but are not themselves fentanyls. There was concern that including them in model development would add undesirable features into whichever class the chemicals were placed. Additionally, ambiguity in scoring (i.e., would placing a utopiod like U-47700 into the fentanyl class be a correct classification because it is a true synthetic opioid or would it be a misclassification because it does not have the chemical structure of a fentanyl analog?) led to the decision to exclude these 28 chemicals from analysis.
Since the intended usage is for customs inspection or hazardous material analysis, the non-fentanyl spectra contained a mixture of common laboratory materials, pharmaceutical compounds, illicit drugs, chemical warfare agents, explosives, and toxic industrial chemicals–materials. After dividing the data, the high SNR set contained 208 fentanyl spectra and 1796 non-fentanyl spectra. The low SNR data contained 218 non-fentanyl spectra and 132 individual fentanyl spectra (from 10 different analogs/salts of varying purities and synthetic routes).
Barcode Procedures
Creating spectral barcodes is a method of converting Raman peak intensities into binary values that uniquely identify key spectral features. Four different barcoding methods were examined.
The first method was intensity thresholding. In this technique, a percentage threshold is set between the maximum and minimum intensities of the spectrum. Intensity values above the threshold are set to 1 and intensities below threshold are set to zero.
The second method was area thresholding. In this technique, the total area under the spectrum is calculated. An intensity threshold is again used, but the threshold value is set to ensure a set percentage of the spectral area is above threshold (and set to 1) with the remainder of the below threshold intensities set to 0.
For the third and fourth methods, the first and second derivatives of the spectra were calculated, respectively. An intensity threshold was then set where above threshold values were set to 1 and below threshold values were set to zero.
An example of the barcoding process is shown in Figure 2. The original spectrum is shown in Figure 2a with an arbitrary threshold shown as the horizontal red dashed line. Figure 2b shows the resulting barcode where all intensity values above the threshold are set to 1 and all remaining values are set to 0.

Barcoding example showing (a) carfentanil oxalate spectrum thresholded (red dashed line) and (b) corresponding carfentanil oxalate barcode spectrum.
One non-barcoding approach was explored. As a control, the average of all the fentanyl class spectra was calculated. This average spectrum was used for comparison to the barcode techniques.
Results and Discussion
Average Spectrum
All the high SNR fentanyl spectra (n = 208) were averaged together to create a single spectrum (Figure 3a). The correlation coefficient between the average spectrum to each of the high SNR spectra was calculated using the following series of equations:
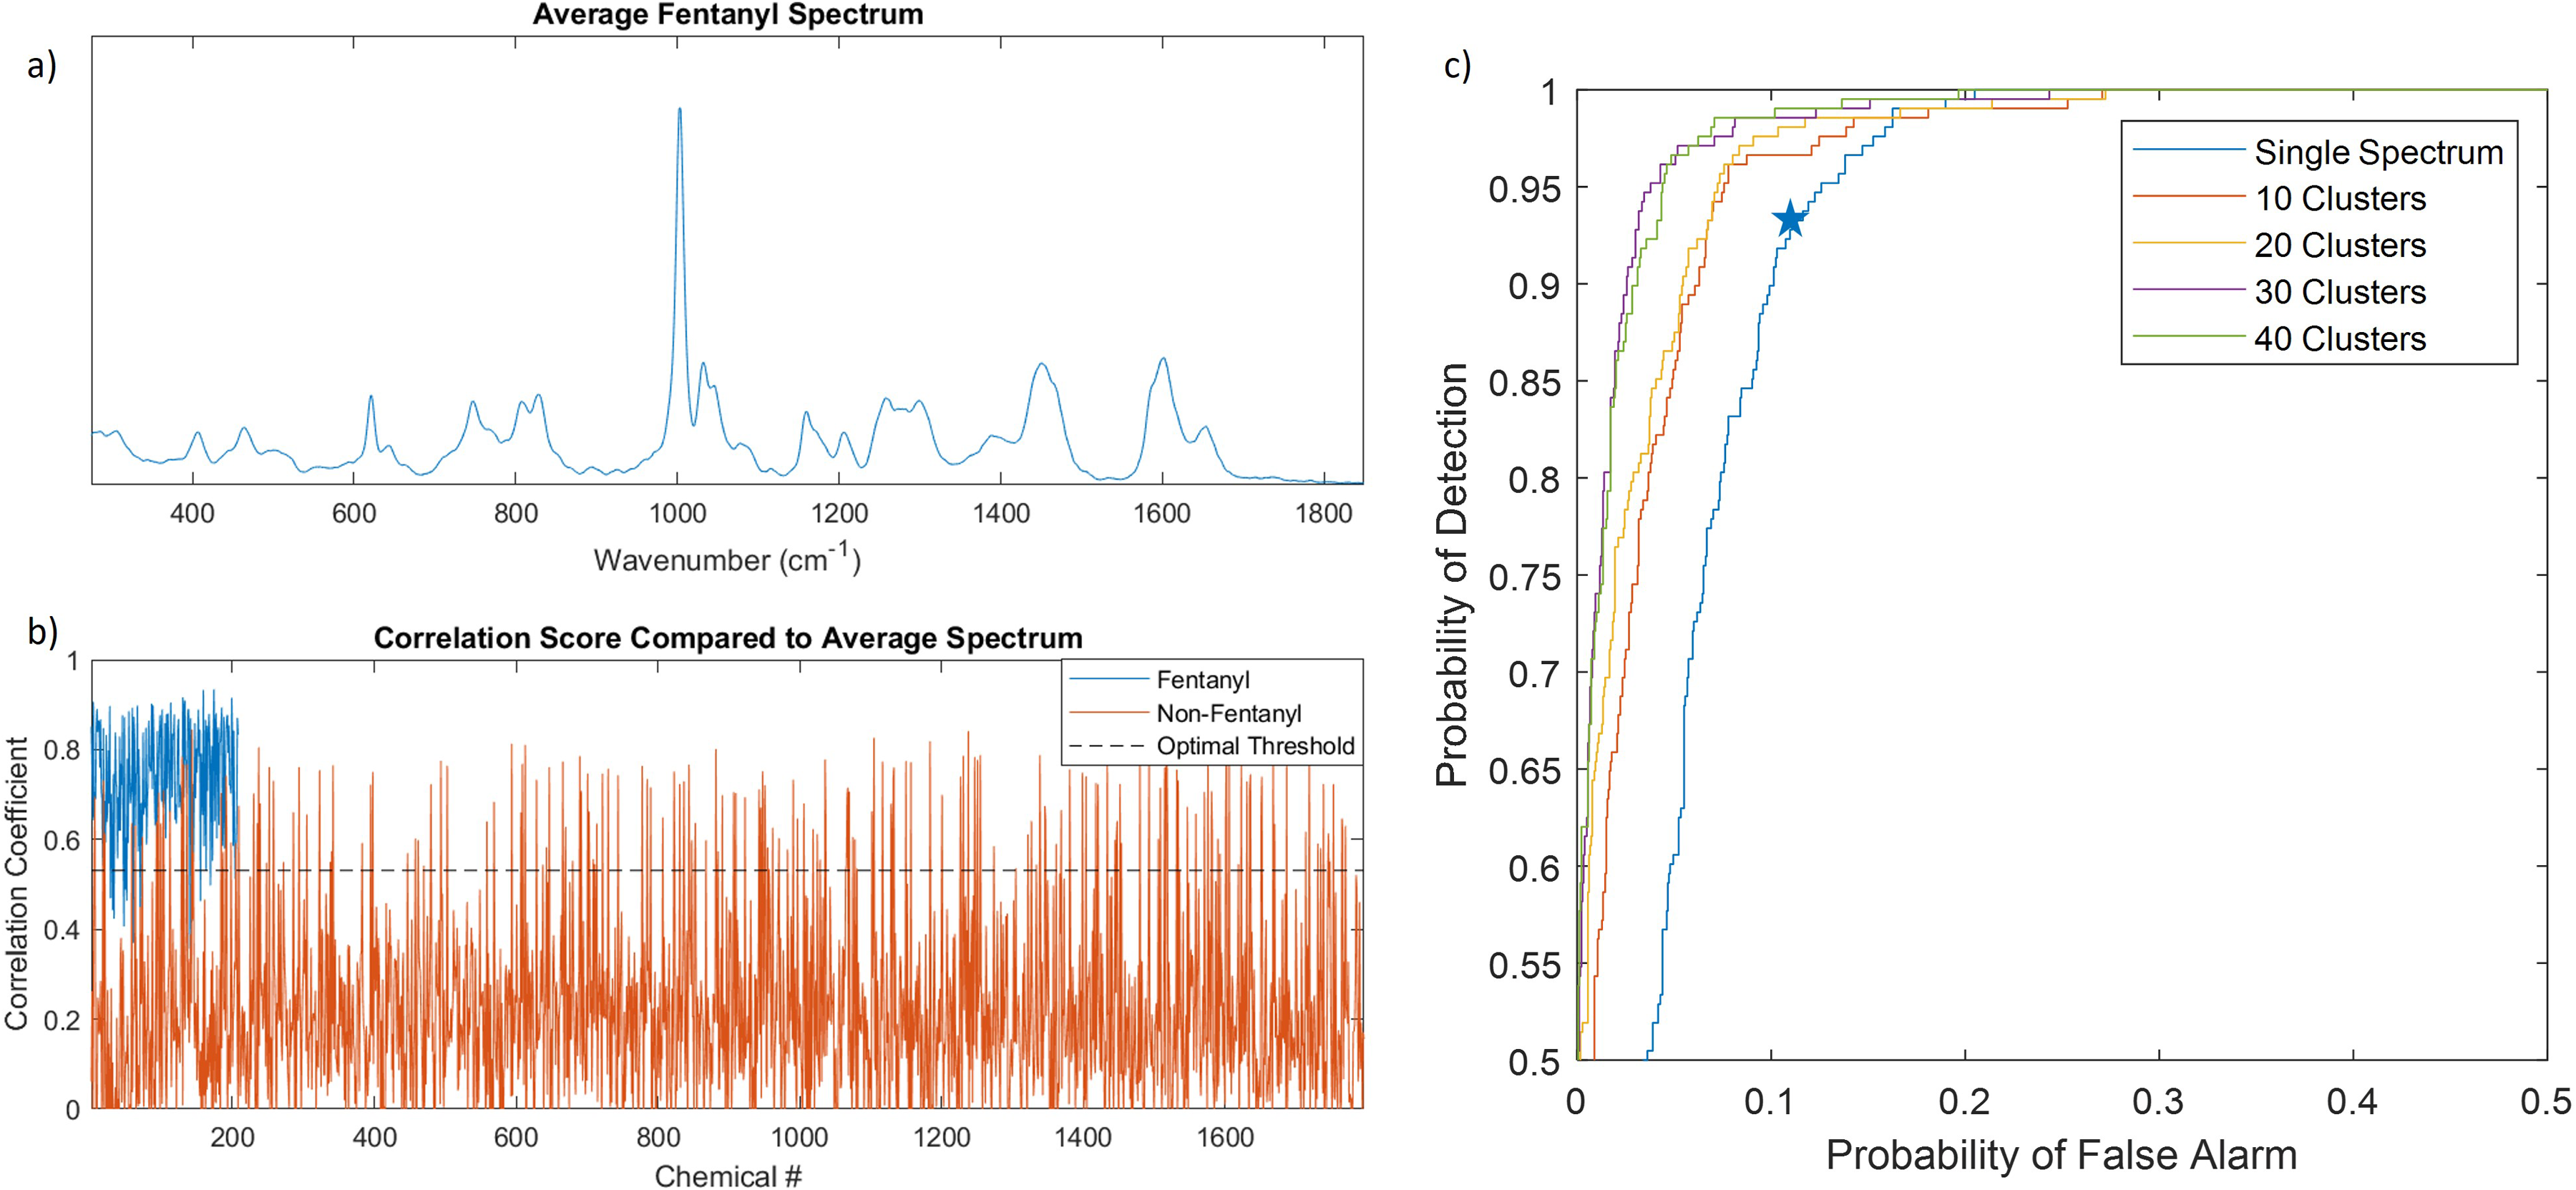
(a) Average of all high SNR fentanyl spectra. (b) correlation coefficient between the average fentanyl spectrum and all 208 fentanyl spectra (blue) and 1796 non-fentanyl spectra (red), and (c) ROC curve showing the PD and PFA tradeoff when comparing the high SNR spectra to different cluster sizes of average spectra. The optimum point for the single spectrum is marked with the star.
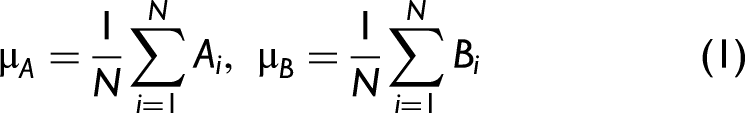
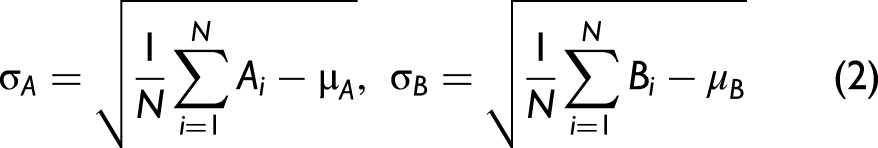

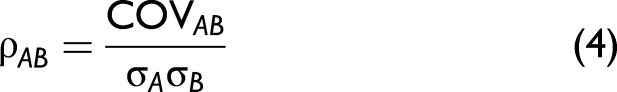
Figure 3b shows the correlation score between the single average fentanyl spectrum and each of the 2004 high-SNR spectra. The correlation scores against the fentanyl compounds are shown in blue while the scores against non-fentanyl compounds are shown in red. Using these values, it is possible to generate a receiver operating characteristic (ROC) curve shown in Figure 3c to visualize the tradeoff between the probability of detection (PD) and the probability of false alarm (PFA). The upper left corner of the ROC curve corresponds to a perfect detection system with 100% PD and 0% PFA. The location on the ROC curve that is closest to this point (minimized Euclidian distance) is the optimum point on the ROC which is the best combination of PD and PFA. The optimum point to maximize PD while minimizing PFA resulted in a PD of 93% and a PFA of 11% and is marked with a star in Figure 3c. Comparing the same average spectrum to the low-SNR data gives comparable results with a PD of 94.7% and PFA of 7.3%.
Since certain fentanyl analogs have similar changes to their functional groups it was expected that there would be spectrally similar subclasses. To exploit this and improve performance, more than one average spectrum was explored using K-means clustering to automatically group and average like spectra. Figure 3c shows that as the number of spectral clusters was increased the PD improved while reducing the PFA. This result is not surprising; however, even with large clusters, the false alarm rate remained higher than desired (approximately 5% with 40 clusters). Additionally, using a large number of these clustered average spectra may not be robust against emerging fentanyl analogs or offer a significant benefit over the traditional method of including each fentanyl analog in the library as its own entry. To overcome these limitations, a barcode method was employed.
Barcoding Analysis
All 2004 high-SNR spectra were barcoded. The barcodes of the 208 fentanyl spectra and 1796 non-fentanyl spectra were then averaged (Figure 4). These averaged barcodes show which spectral features are common in the two classes. Values closer to 1 (e.g., 1000 cm–1 for fentanyl- related compounds) indicate that above threshold spectral features were present in nearly 100% of the spectra. Likewise, values closer to 0 mean that there were few spectral features above threshold at a given Raman shift. The common non-fentanyl features are more distributed with most points falling between 0.4 and 0.6 meaning there were no strong peaks indicative of this class which makes sense due to the wide variety of chemical compounds in this class. It should be noted that the plots in Figure 4 were all generated using the intensity thresholding method. The different barcoding methods result in different intermediate results; however, the same procedure was followed with all barcoding techniques.

Averages of the barcoded spectra for (a) fentanyl-related compounds and (b) non-fentanyl related compounds.
The difference between the feature plots shown in Figure 4 was calculated and is shown in Figure 5a. Values greater than zero are more likely to be fentanyl and are set to 1 to generate the library barcode. Conversely, values less than zero correspond to features that are more likely to be non-fentanyl and are set to 0 in the library barcode. The farther the value is from zero, the more likely that a given feature is related to the given class. To take advantage of this relationship, the absolute value of the difference features (Figure 5b) was used to give more weight to these regions. This was done using the weighted correlation coefficient defined in Eqs. 5–8:
42


(a) The difference between the common fentanyl barcode features and common non-fentanyl barcode features (blue) and the library barcode (black). (b) The absolute value of the difference features used as weight when calculating the weighted correlation.
The calculation of the weighted correlation coefficient is similar to the traditional Pearson correlation definition shown in Eqs. 1–4, but each point of the spectrum is multiplied by a scalar value defined by the weight vector, w, which is shown in Figure 5b. Again, A and B are the two spectra expressed as N point vectors. The weighted mean value, μ
w
, for each spectrum is defined in Eq. 5. The weighted mean is used to determine the weighted standard deviation, σ
w
, for each spectrum using Eq. 6. The weighted covariance,
The weighted correlation coefficient was calculated between the library barcode and barcodes generated from the 2004 high-SNR spectra with the results being shown in Figure 6a. The fentanyl and non-fentanyl classes show better separation using the barcode method than using the average spectrum (Figure 6a) which consequently results in a better optimal PD–PFA tradeoff as shown in the ROC curve in Figure 6b. The optimal PD–PFA (maximizes the PD and minimizes the PFA; closest to the upper left corner of the ROC curve) for the intensity thresholded barcode technique improved compared to the average spectrum technique from a PD of 93.3% to 97.6% while reducing the PFA from 11.1% to 1.5%.

(a) The weighted correlation coefficient between the fentanyl library barcode and all 208 fentanyl barcodes (blue) and 1796 non-fentanyl barcodes (red) generated using intensity thresholding, and (b) ROC curve showing the PD and PFA tradeoff of both the barcode technique (yellow and purple) and single average spectrum (blue and red). Note: The high SNR average spectrum (blue) is the same as the single spectrum result shown in Figure 3c.
To apply the same procedure to the low SNR spectra, an 11-point mean filter was applied to the spectra to reduce noise prior to barcoding. All low SNR barcoding analyses were performed against library barcodes that were generated from the high SNR spectra. Figure 7 shows the barcode representation of all the low SNR spectra defined using the four different barcode methods. The top of the figure shows the barcode library. The middle section (between the red lines) shows the barcodes for the fentanyl compounds, and the non-fentanyl chemicals are shown at the bottom. ROC curves are generated for each barcoding method to determine the optimal PD and PFA for both the high and low SNR data and is shown in Table I.
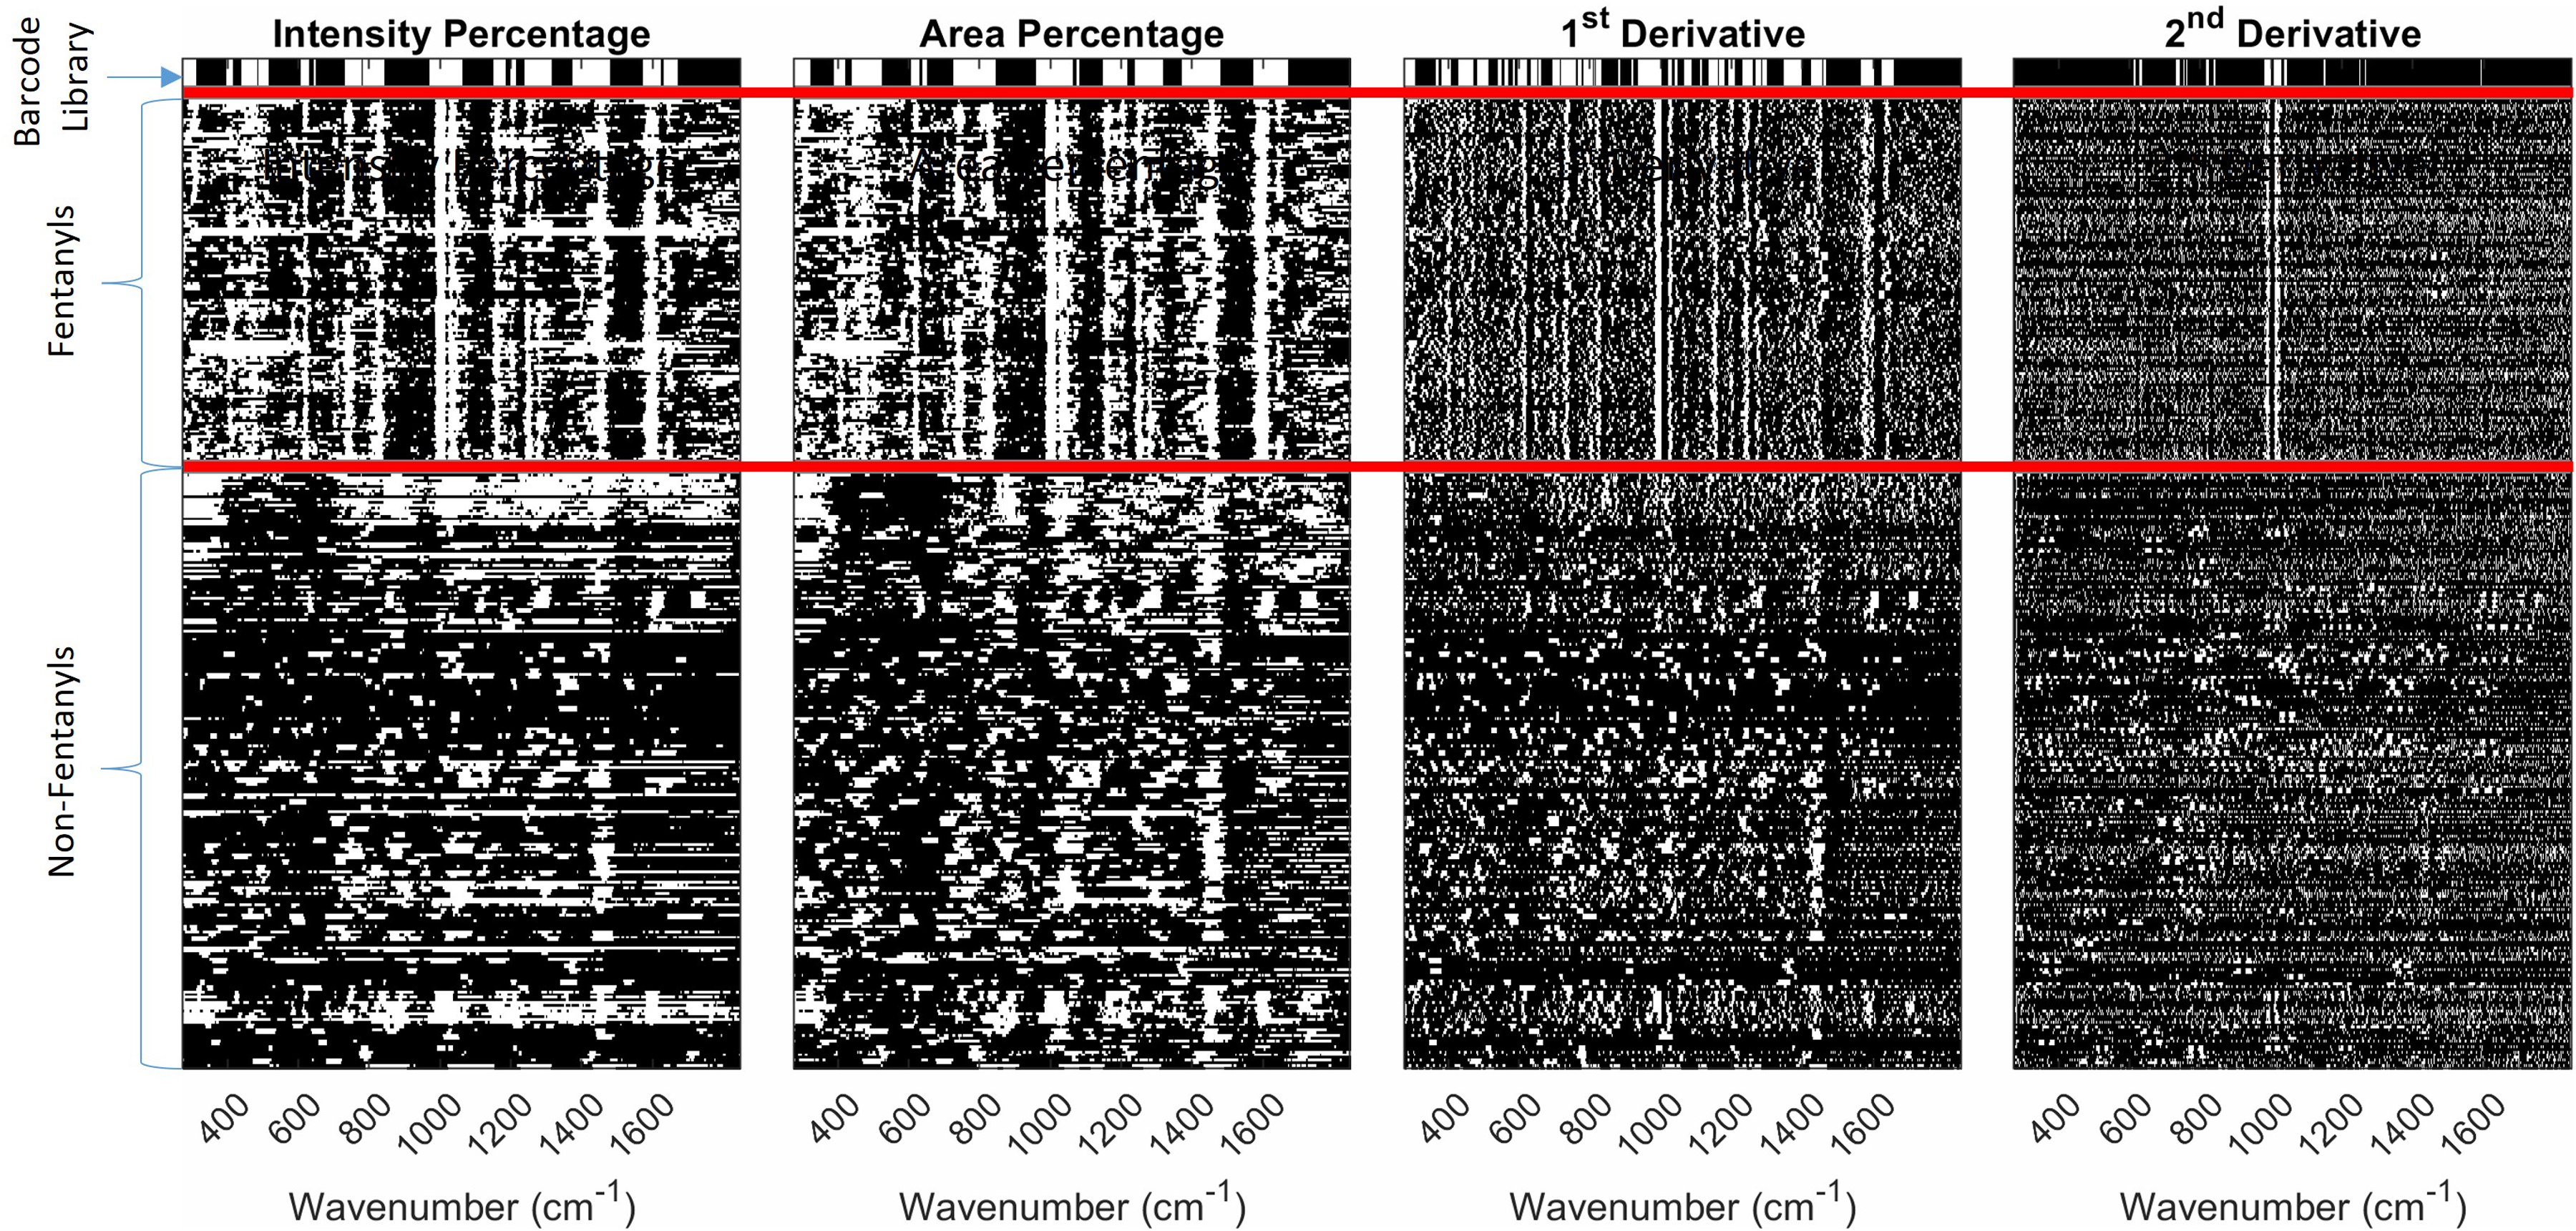
Barcode representation of all low SNR spectra using the four barcoding techniques. The library barcode generated by the using the high SNR data is shown at the top, followed by all the fentanyl barcodes, then non-fentanyl barcodes.
Optimized PD–PFA for each classification method.

Generally, the performance between the intensity thresholding, area thresholding, and first-derivative methods provided comparable results; however, the intensity threshold method had the lowest PFA against the high SNR data.
Although the ability to discriminate between the two classes results in a similar PD and PFA for the high and low SNR data, it should be noted that the specific threshold to obtain these results is different. Figure 8 shows the library and high and low SNR barcodes for all the fentanyl (left) and non-fentanyl (right) compounds. In the middle is the weighted correlation coefficients for each barcode comparison. The detection threshold to distinguish the high SNR data is larger than the threshold for the low SNR data.

Comparison of the library, high-SNR, and low-SNR barcodes for the fentanyl compounds (left) and non-fentanyl compounds (right). The middle shows the weighted correlation coefficient for each spectrum.
Conclusion
In this paper, we have demonstrated two methods to distinguish fentanyl samples from non-fentanyl samples which could be applied to new fentanyl analogs. The average spectrum method works in a manner similar to most fielded detection systems thus making it easier to implement within existing equipment. However, this method was less accurate than the barcode method. Conversely, the barcode method was able to provide high PD and low PFA but used a processing method significantly different from most sensors. The spectral barcode approach simplifies the detection problem into a binary classifier of fentanyl or non-fentanyl. Instead of focusing on individual peaks or overall spectral correlation the spectral barcode provides the location of potential spectral information. When this is aggregated for the two classes it provides locations of spectral information that are more likely to be related to fentanyl and fentanyl analogs compared to non-fentanyl chemicals. Focusing on just these regions to make the classification led to the higher PD and lower PFA when compared to the average spectrum approach.
While this work was conducted using conventional Raman spectroscopy on high purity powder samples similar to those that are intercepted at international mail facilities, the barcoding technique described here could potentially be used with SERS for increased sensitivity which would be advantageous for detecting trace levels of fentanyl and fentanyl analogs contained within adulterant materials. Additional analyses could also be conducted using real-world samples, such as confiscated illicit pills or other substances that are suspected to contain fentanyl or fentanyl analogs to further broaden the utility of this barcoding technique. Importantly, this work provides an avenue for detecting novel fentanyl substances that would allow field detection to keep up with the moving target of illicit narcotics.
Footnotes
Acknowledgments
The authors want to thank Pendar Technologies for providing spectral data to support this work. This research was funded by the Department of Homeland Security Science and Technology Directorate project number 70RSAT19KPM000048.
Declaration of Conflicting Interests
The author(s) declared no potential conflicts of interest with respect to the research, authorship, and/or publication of this article.