
Abstract
Introduction
High-dose Vitamin C has shown significant anti-tumor effects in various cancers, including hematological malignancies. However, its therapeutic efficacy against acute lymphoblastic leukemia (ALL) remains underexplored.
Methods
ALL cell lines and normal bone marrow mononuclear cells were treated with Vitamin C to assess cell viability, apoptosis, proliferation, and cell cycle progression. Colony formation assays evaluated long-term growth. Additionally, transgenic mouse models were employed to evaluate the in vivo antitumor activity of high-dose Vitamin C in ALL. Western blotting, ROS detection 2′,7′-Dichlorofluorescin diacetate (DCFH-DA), and RNA sequencing with GSEA were conducted to explore Vitamin C’s mechanism of action.
Results
Our results demonstrated that high-dose Vitamin C exhibited potent cytotoxicity toward ALL cells at relatively low concentrations (200 μM) while sparing normal human bone marrow mononuclear cells even at concentrations as high as 1 mM. Vitamin C effectively inhibited ALL cell line proliferation, induced apoptosis, and disrupted cell cycle progression. We further identified that the increased expression of Solute Carrier Family 23 Member 1 (SLC23A1) in ALL cells enhanced their sensitivity to Vitamin C. In SLC23A1 knockout cells, treatment with 200 μM Vitamin C significantly restored cell viability and reduced apoptosis compared to controls. Mechanistically, high-dose Vitamin C induced apoptosis in ALL cells by activating the ER stress response through the PERK/CHOP pathway.
Conclusion
Taken together, our findings suggest that high-dose Vitamin C demonstrated significant anti-leukemic effects in ALL, showing cytotoxicity at 200 μM. Furthermore, SLC23A1 may serve as a potential biomarker for predicting the therapeutic response to Vitamin C treatment in ALL patients.
Introduction
Acute lymphoblastic leukemia (ALL) is a highly aggressive hematological malignancy characterized by the clonal proliferation of lymphoid progenitor cells in both the bone marrow and extramedullary sites.1,2 In adults, ALL remains a formidable challenge, marked by a high relapse rate despite intensive multi-agent chemotherapy regimens. Emerging therapeutic agents, such as blinatumomab and ofatumumab, have shown promise in improving patient outcomes and reducing the risk of relapse. However, the prognosis post-relapse remains poor. 3 A significant barrier to advancing curative strategies for ALL patients is the absence of agents that selectively target leukemic cells while sparing normal hematopoietic tissue. Thus, there is an urgent need for novel therapeutic options and treatment combinations that are both more specific and less toxic.
Vitamin C (VC), or L-ascorbic acid, is an essential dietary micronutrient crucial for various physiological processes, including antiviral responses, collagen synthesis, and cellular oxidative metabolism. 4 High-dose VC has been proposed as a potential anticancer agent for over a century.5–7 Recent studies have highlighted the efficacy of VC and its selective cytotoxicity toward hematological malignancies, demonstrating that VC can induce toxicity in leukemic cells while minimizing damage to normal cells. For instance, Darwiche et al. observed that low-dose VC (250 μM) effectively targeted chronic lymphocytic leukemia (CLL) B-cells without affecting healthy B-cells. 8 In the context of acute myeloid leukemia (AML), research indicates that VC treatment can mimic Tet2 restoration, thereby blocking leukemia progression.9,10 VC’s cellular uptake occurs via sodium-dependent VC co-transporters and glucose transporters, with the SLC23A family playing a significant role in its anti-tumor effects. 11 Liu et al. demonstrated that SLC2A3 knockdown in AML cells reduced VC uptake, promoted leukemia progression, and hindered Tet2 restoration. 12 Recent studies have shown that VC can promote the proliferation of NK and T cells, thereby enhancing immune responses.13,14 Additionally, VC has demonstrated a synergistic effect when combined with various chemotherapeutic agents or targeted therapies used in the treatment of hematological neoplasms. For instance, VC supplementation has been shown to increase tumor cells’ sensitivity to arsenic trioxide (As2O3), 15 tyrosine kinase inhibitors, 16 and inhibitors targeting BTK, PLCG2, and BCL2. 8 Furthermore, VC supplementation enhances the effectiveness of radiotherapy, sensitizing tumor cells to treatment.17,18 However, the effects of VC on ALL cells have not been thoroughly investigated, prompting our study to evaluate VC’s therapeutic activity in this context.
The molecular mechanisms underlying high-dose VC-induced cytotoxicity in ALL remain largely unexplored. Pharmacologically, VC targets several mechanisms that tumor cells exploit for survival and growth, including epigenetic regulation, oxygen sensing, epithelial-to-mesenchymal transition, immunomodulation, and kinase activity regulation. 7 A recent study found that high-dose VC induced apoptosis in the MCF-7 breast cancer cell line through endoplasmic reticulum (ER) stress. 19 Choi et al. similarly reported that VC inhibits breast cancer growth via IRE/JNK/CHOP-related ER stress pathway. 20 ER stress is crucial for correcting misfolded and unfolded proteins resulting from oncogenic stress. 21 However, prolonged ER stress can trigger apoptotic pathways, such as Caspase-12-mediated apoptosis, leading to cell death. 22 Thus, identifying agents that induce apoptosis via ER stress represents a novel therapeutic approach for cancer treatment. The anti-cancer effects of high-dose VC and its relationship with ER stress in ALL remain undefined.
In this study, we conducted a series of in vitro and in vivo experiments demonstrating that high-dose VC effectively inhibits growth and induces apoptosis in ALL cells. Mechanistically, our findings reveal that high-dose VC triggers sustained ER stress and activates the Protein Kinase R-like Endoplasmic Reticulum Kinase (PERK) pathway, leading to the upregulation of C/EBP Homologous Protein (CHOP) and subsequent cell apoptosis. While preclinical data on VC’s anti-cancer effects are promising, further research is essential to fully elucidate the underlying mechanisms, particularly their influence on the tumor microenvironment and immune system modulation. Clinical trials are crucial to optimize dosage, administration methods, and treatment protocols, with the goal of translating these findings into effective adjunctive therapies for patients with ALL.
Materials and methods
Microarray data analysis
Gene expression datasets from the Leukemia MILE study were obtained from the Blood Spot website (https://servers.binf.ku.dk/bloodspot).23,24 The raw data (matrix files) were normalized using the “normalizeBetweenArrays” function within the limma package (https://bioconductor.org/packages/release/bioc/html/limma.html). 25 All analyses were conducted using R (version 4.0.3).
Cell lines and cell culture
The acute myeloid leukemia (AML) cell lines used in this study included THP1, MV4, U937, K562, MOLM13, KASUMI-1, and HL60. The acute lymphoblastic leukemia (ALL) cell lines included KOPN8, RS4, NALM6, and REH, all provided by Professor Zhigang Zhao (Tianjin First Central Hospital, Tianjin, China). Additionally, three other ALL cell lines—SEM, 697, and RCH-ACV—were provided by Professor Feng Pan (Stanford University, USA). All cell lines were routinely cultured at 37°C in RPMI-1640 or DMEM medium supplemented with 10% fetal bovine serum (FBS).
Normal control bone marrow mononuclear cells were obtained from bone marrow transplant donors. Mononuclear cells were isolated using human peripheral blood lymphocyte separation medium (Lymphocyte Separation Medium (Human) from Solarbio). The cells were cultured at a concentration of 2 × 10^6/mL in StemSpan serum-free expansion medium supplemented with 100 μg/mL stem cell factor (SCF), 50 μg/mL Flt3 ligand (Flt3L), 25 μg/mL granulocyte colony-stimulating factor (G-CSF), and 25 μg/mL interleukin-3 (IL-3) at 37°C and 5% CO2.
Cell viability assay
Cells were plated in 96-well plates at a density of 3000 to 4000 cells per well (100 µL) in RPMI-1640 supplemented with varying doses of Vitamin C (VC; Sigma, Cat. # A4034) and 10% FBS. The CellTiter-Lumi™ assay (Promega, GPL7571) was performed to assess the effect of VC on cell viability, and the IC50 values were calculated as previously described. 11
Cell apoptosis assay
Cells were treated with 2 µM VC or a vehicle control for 72 h and subsequently stained with the Annexin V-FITC/PI Apoptosis Detection Kit (Beyotime Biotechnology, C1062M) following the manufacturer’s protocol. Apoptotic cells were quantified by flow cytometry. Each experiment was conducted in triplicate.
Cell proliferation assay
Cells were treated with 2 µM VC or a vehicle control for 72 h, followed by staining with the BeyoClick™ EdU Cell Proliferation Kit with Alexa Fluor 488 (Beyotime Biotechnology, C0071S) according to the manufacturer’s instructions. Proliferating cells were assessed by flow cytometry, with each experiment performed in triplicate.
Cell cycle assay
For the cell cycle analysis, cells were treated with 2 µM VC or vehicle control for 72 h and stained using the Cell Cycle and Apoptosis Analysis Kit (Beyotime Biotechnology, C1052) according to the manufacturer’s protocol. Cell cycle distribution was analyzed by flow cytometry, with experiments conducted in triplicate.
Colony formation assay
Cells (1500 to 2000 per well) were seeded in 6-well plates with MethoCult™ H4431 (STEMCELL Technologies, 04431) and treated with different doses of VC for 10–12 days. Cell colonies were visualized and documented using a microscope.
Animal studies
In vivo studies were conducted in compliance with the Animal Ethical and Welfare Committee of Tianjin Medical University Cancer Institute and Hospital. Mice were sourced from SPF (Spfbiotech, Beijing Biotechnology) and housed in a specific pathogen-free environment with no more than five mice per cage. To test the effect of VC, 2 × 10^4 NALM6 cells were injected intravenously into the tail vein of 6 mice per group of 6 to 8-week-old female NSG mice (NOD-Prkdcscid-Il2rgeml) mice. 26 NSG mice were acquired from Spfbiotech. After 3 days, mice were randomly divided into two groups: one receiving freshly prepared VC (sodium ascorbate in 400 µL PBS, 4 g/kg body weight) via intraperitoneal injection (IP) twice daily,34,50,51 while the control group received PBS under the same regimen. White blood cells from peripheral blood of mice on day 18, 22 and 26, and the proportion of CD19-positive cells was measured. To assess the effect of VC on leukemic progression, flow cytometry was employed to analyze the expression of CD19 on peripheral blood cells. Mouse mortality and the proportion of peripheral blood CD19+ cells were recorded. In this study, the VC dosage for experimental animal models was set at 4 g/kg, slightly exceeding the conventional intravenous dose (1.5 g/kg) used in clinical trials. 27 This adjustment accounts for key pharmacokinetic differences between rodents and humans, including metabolic rate and drug distribution, ensuring comparable systemic exposure. Additionally, achieving sufficient tissue concentrations is essential for investigating VC’s therapeutic mechanisms. However, the optimal clinical dosage for patients requires further validation through translational studies incorporating dose normalization and safety assessments.
Western blot analysis
Cells (4-5 × 10^5 per well) were cultured in 6-well plates with RPMI-1640 containing 10% FBS. After treatment with various doses of VC for designated time points, cells were lysed, and lysates were subjected to Western blot analysis.
Detection of reactive oxygen species (ROS)
Cells (5 × 10^5 per well) were seeded in 6-well plates and incubated in RPMI-1640 with 200 µM VC for 2–4 h. After washing, cells were re-suspended in serum-free medium containing 10 µM 2′,7′-Dichlorofluorescin diacetate (DCFH-DA) and incubated at 37°C for 60 min in the dark. Cells were then washed and analyzed by flow cytometry. To eliminate cellular ROS, 200 μM N-acetylcysteine (NAC; Sigma, Cat. # A7250) was included in the medium.
Ascorbic acid assay
For ascorbic acid measurement, 5 × 10^6 cells were used. The cell pellet was lysed using a pre-lysis buffer (Abcam: ab113474), and the ascorbic acid levels in the supernatant were determined following the manufacturer’s instructions. 12
RNA sequencing
THP1 cells were collected and sequenced after being treated with PBS and VC (200 µM) for 24 h. The total amounts and integrity of RNA were assessed using the RNA Nano 6000 Assay Kit of the Bioanalyzer 2100 system. The image data measured by the high-throughput sequencer are converted into sequence data (reads) by CASAVA base recognition. Raw sequencing reads (fastq format) were first processed through in-house Perl scripts. The reference genome and gene model annotation files were downloaded from genome website directly. The genome index was built using Hisat2 (v2.0.5) and paired-end clean reads were aligned to the reference genome using Hisat2 (v2.0.5). Differential expression analysis between two conditions/groups (two biological replicates per condition) was performed using the DESeq2 R package (1.20.0).
Gene set enrichment analysis (GSEA)
Following data pre-processing, Gene Set Enrichment Analysis (GSEA) was conducted to identify enriched biological pathways and gene sets enriched in VC-treated samples. Enrichment analyses were performed using GSEA software (version 4.3.2, 2023) with 1000 permutations. The merged gene expression matrices were uploaded, and VC-treated samples were designated as the “phenotype” for analysis. The gene set databases used in this study were obtained from the Molecular Signatures Database (MSigDB) (https://software.broadinstitute.org/gsea/msigdb/index.jsp), which includes Gene Ontology (GO) terms, KEGG pathways, and immunological signature gene sets. The results were evaluated based on false discovery rate (FDR) corrections, with an FDR threshold of 0.05 for statistical significance.28,29
Statistical analysis
Data are presented as mean ± standard deviation (SD). Comparisons between two groups were performed using Student’s t-test for normally distributed data. For multiple-group comparisons, one-way analysis of variance (ANOVA) was used, followed by post-hoc Tukey’s test for pairwise comparisons. Survival differences were evaluated using the log-rank test, and Kaplan-Meier survival curves were plotted for visual representation. Statistical analyses were performed using SPSS (version 19.0.1, IBM), and meta-analysis of survival data was conducted using GraphPad Prism software (version 9.3, 2022). A P-value <0.05 was considered statistically significant.
Results
High-dose vitamin C (VC) can inhibit the activity of ALL cell lines
High-dose VC has been shown to have anti-tumor effects in various types of cancers, including acute myeloid leukemia (AML).7,30 In this study, we used CellTiter-Lumi™ assay to detect the proliferation and survival of AML and acute lymphoblastic leukemia (ALL) cell lines treated with different concentrations of Vitamin C (VC). As shown in Figure 1(a), all AML and ALL cell lines demonstrated sensitivity to VC, with 50% inhibitory concentration (IC50) values ranging from 139.6 μM to 572.4 μM. Interestingly, we found that ALL cell lines were more sensitive to VC, with the IC50 values ranging between 98.45 μM and 290.20 μM, whereas the IC50 values for AML cell lines ranged from 339.5 to 600.6 μM (Figure 1(a)). We also found that a 1 mM concentration of VC had almost no effect on the activity of normal human bone marrow mononuclear cells (Figure 1(a)). ALL cell lines exhibit greater sensitivity to Vitamin C (VC) compared to AML. (A) AML and ALL cell lines are treated with different VC concentrations for the indicated durations, and cell viability is assessed using the CellTiter-Lumi™ assay. The left panel shows the dose-response curves for AML (green) and ALL (blue) cell lines. The Y-axis represents the percentage of cell viability (%), and the X-axis represents VC concentration (μmol/L). The middle panel compares the IC50 values between ALL and AML cell lines. The Y-axis represents IC50 (μmol/L), and the X-axis indicates cell types. The right panel shows the viability of bone marrow mononuclear cell samples from three healthy donors treated with VC. The Y-axis represents cell viability (%), and the X-axis represents VC concentration (μmol/L). (B–D) Apoptosis, proliferation, and cell cycle distribution are analyzed by flow cytometry after treating RS4 (ALL), NALM6 (ALL), and MOLM13 (AML), THP1 (AML) cell lines with VC for 72 h. (B) Apoptosis analysis is performed at VC concentrations of 100, 200, and 500 µmol/L. The Y-axis indicates percentage of apoptotic cells (%), and the X-axis shows VC concentration (μmol/L). (C) Proliferation analysis. (D) Cell cycle distribution is evaluated with distinct phases represented by different colors: Sub-G1 (purple), G0/G1 (blue), S (red), and G2/M (green). The X-axis indicates the percentage of cells in each phase (%), and the Y-axis shows VC concentration (μmol/L). (E) Colony formation assay is performed to assess the long-term effect of VC on leukemia cell growth. The upper panel quantifies colony numbers following treatment with negative control (NC), 100, 200, and 500 μM VC for 2 weeks. The Y-axis indicates colony number, and the X-axis represents VC concentration (μmol/L). The lower panel presents representative images of colony formation under different VC concentrations. Statistical significance: ns, no significance; *P < 0.05; **P < 0.005; ***P < 0.005; ****P < 0.0005.
Having observed VC sensitivity in leukemia cell line, we determined the impact of high-dose VC treatment on proliferation, cell cycle progression and apoptosis using flow cytometry. We chose two ALL cell lines (RS4 and NAML6) and two AML cell lines (MOLM13 and THP1) for further analysis. The results showed that VC could significantly induce apoptosis in ALL cell lines at concentrations of 100 μM, 200 μM and 500 μM. There were clear differences in apoptotic sensitivity to VC treatment when its concentration increased from 100 μM to 200 μM. But a higher concentration (500 μM) exerted only a weaker effect on the AML cell lines (Figure 1(b)). The VC-induced proliferation inhibition in ALL cell lines showed a clear concentration-dependent effect, whereas it had almost no effect on the proliferation of the AML cell lines at VC concentrations ranging from 100 μM to 500 μM (Figure 1(c)). In ALL cell lines, treatment with 200 μM or 500 μM VC for 24 h resulted in a decreased percentage of cells in S phase with an increased proportion of cells in the G0/G1 phase (Figure 1(d)). Similarly, the cell cycle analysis showed that VC had a more significant inhibitory effect on ALL cell lines compared to AML cell lines (Figure 1(d)).
To further confirm the difference in VC-mediated cytotoxicity between ALL and AML, we conducted a colony formation assay. The results also showed that high-dose VC inhibited colony formation in both AML and ALL cell lines in a dose-dependent manner, with ALL cell lines exhibiting a lower colony formation ability at the same VC concentration (Figure 1(e)). Taken together, these observations suggest that high-dose VC can inhibit the activity, induce apoptosis and perturb cell cycle progression of leukemic cell lines, especially ALL cell lines.
High-dose vitamin C has anti-leukemic activity in preclinical ALL models
Based on the consistent and robust in vitro response of ALL cell lines to high-dose VC inhibition, we tested high-dose VC in preclinical mouse models of ALL. We employed the NALM6 cell line in mice, a well-characterized preclinical model that mimics the pathogenesis and progression of human ALL. To administer high-dose VC or the control PBS solution, we selected a dose of 4 g/kg, which has been previously evaluated in a phase I clinical trial and two preclinical studies as well tolerated and safe.34,50,51 Remarkably, our experiments revealed that systemic administration of high-dose VC twice daily over a duration of 3-4 weeks significantly reduced the total number of CD19+ cells in the peripheral blood of NALM6-engrafted mice, indicating a potent anti-leukemia effect (Figure 2(a)). In addition, the survival time of the animals treated with high-dose VC was significantly longer than that of the PBS-treated group, indicating that high-dose VC could prolong the lifespan of ALL-bearing mice in a preclinical context (Figure 2(b)). These findings support the notion that high-dose VC could be a promising therapeutic agent for leukemia and warrant further investigation in clinical trials. VC inhibits disease progression in transgenic mouse models. (A) The left panel shows the gating strategy for flow cytometry analysis. The right panel quantifies the proportion of CD19+ cells in peripheral blood of mice on the 18th, 22nd, and 26th day, with the Y-axis indicating percentage of CD19+ cells (%), and the X-axis showing time (days). (B) Kaplan-Meier survival curves compare overall survival between VC-treated and PBS control groups. The Y-axis represents percent survival (%), and the X-axis represents time (days). Statistical significance: ns, no significance; *P < 0.05; **P < 0.005; ****P < 0.0005.
Expression of SVCT-1 and its impact on sensitivity to vitamin C
Our studies have confirmed that ALL cell lines were more sensitive to VC than AML cell lines, and VC exerted a weaker effect on the activity of normal human bone marrow mononuclear cells (Figure 1(a)). However, the mechanisms underlying high VC sensitivity to ALL cells remained little known. Previous studies have indicated that the VC transporter proteins sodium-dependent Vitamin C transporters (SVCTs) and glucose transporters (GLUTs) or their encoding genes play a significant role in the anti-tumor effects of VC.10,11 Therefore, we sought to determine whether these genes are related to the sensitivity of ALL.
To confirm our hypothesis, we analyzed the gene expression of SVCTs and GLUTs in ALL, AML, and normal hematopoietic cells by using the publicly available Bloodspot gene expression database (Figure 3(a)). The results showed that the expression of SVCTs encoding genes appeared to be significantly increased in both ALL and AML patients, while the expression of GLUTs encoding genes appeared to be decreased in both. Of note, changes in the expression of Solute Carrier Family 23 Member 1 (SLC23A1) were particularly apparent (Figure 3(b)). SVCT-1 protein expression correlates with both VC intake and sensitivity. (A-B) Heatmaps and histograms of the expression levels of sodium-dependent Vitamin C transporters (SVCTs) and glucose transporters (GLUTs) in normal, AML, and ALL primary cells. Columns represent cell types, and rows represent transporter genes. Color intensity corresponds to mRNA expression levels. (C) The left panel shows a western blot analysis of SVCT-1 protein in seven AML and four ALL cell lines. (D) The panel presents the correlation between SVCT-1 expression levels and IC50 values for VC, with the Y-axis indicating SVCT-1 expression and the X-axis showing the IC50 values (μmol/L). (E) Western blot analysis of SVCT-1 protein expression after VC treatment. (F) Cytoplasmic VC level is measured using the ascorbic acid assay kit. Cells (RS4, NALM6, THP1, and MOLM13) are treated with 200 μM VC for 6 h. (G) Western blot analysis of SVCT-1 protein expression in RS4 cells following SLC23A1 knockout. (H-I) Apoptosis and proliferation are evaluated by flow cytometry in the indicated cells after treatment with 200 μM VC for 72 h. The Y-axes indicate the percentage of apoptotic or proliferating cells (%), and X-axes indicate treatment conditions. (J) Cytoplasmic VC levels are measured following SLC23A1 knockout and after 6 h of treatment with 200 μM VC treatment. The Y-axis indicates intracellular VC concentration (nmol/L per 10^6 cells), and the X-axis indicates treatment conditions. Statistical significance: ns, no significance; *P < 0.05; **P < 0.005; ***P < 0.005; ****P < 0.0005.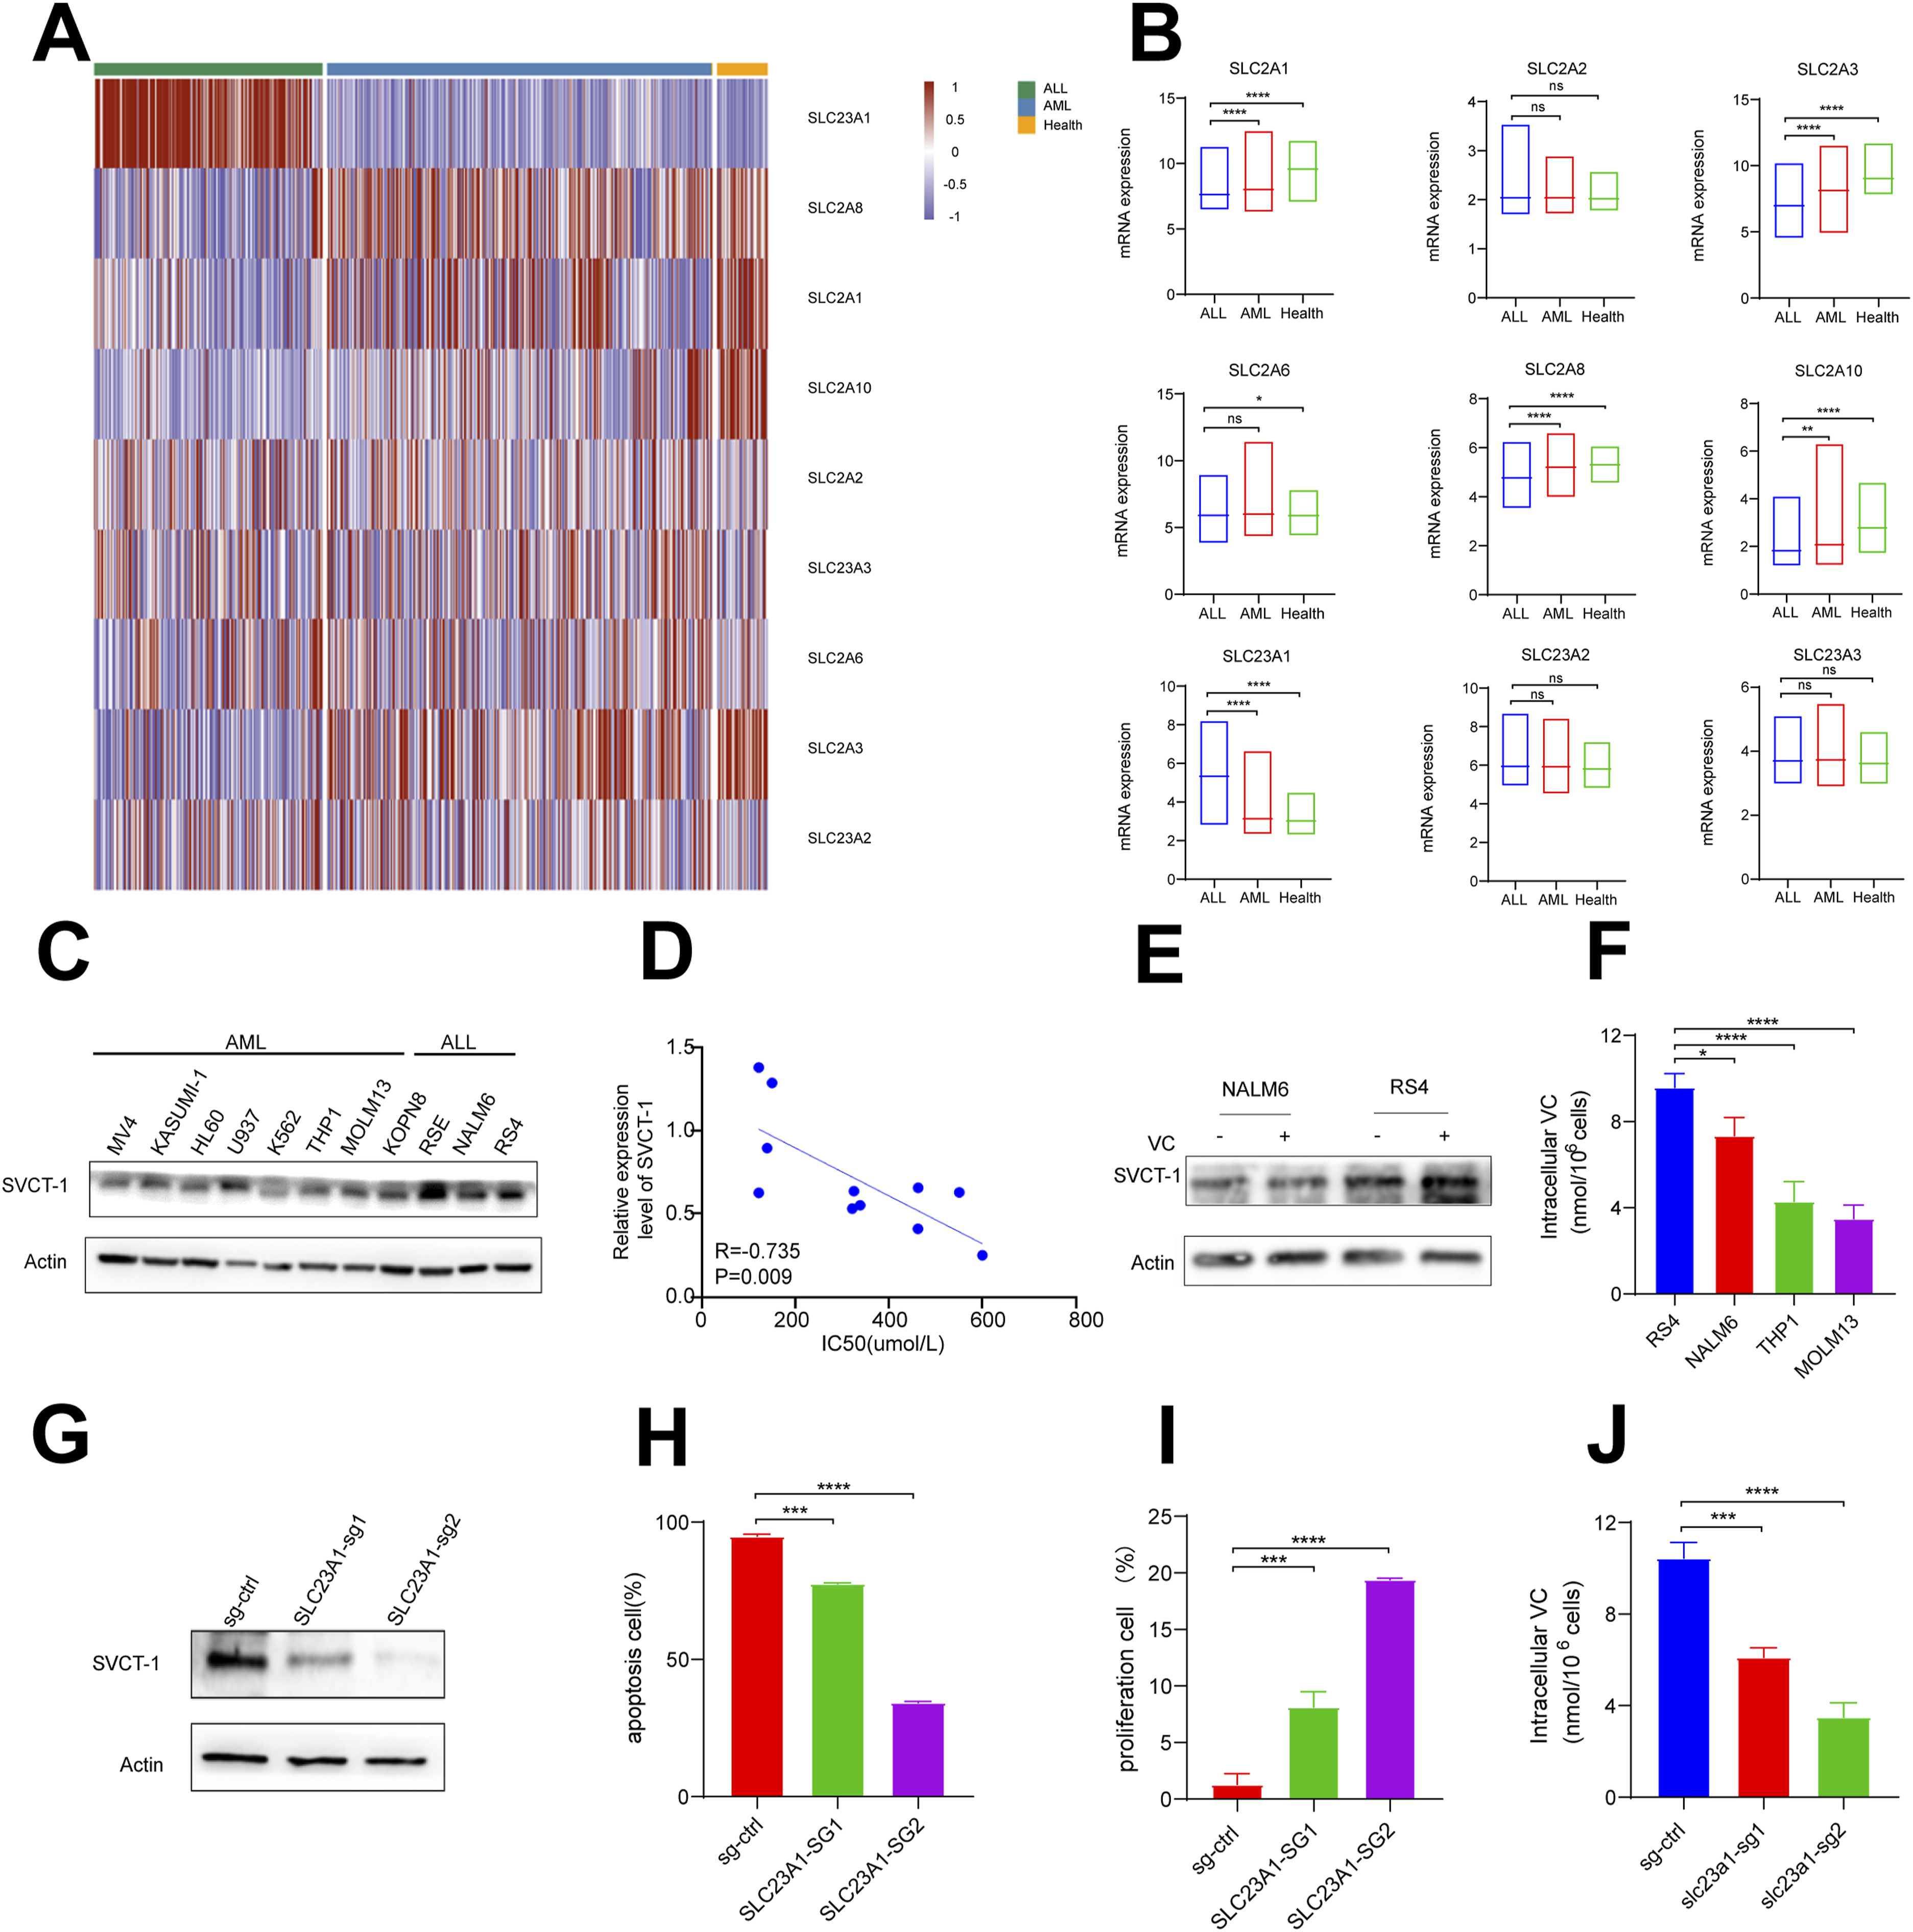
Then we evaluated the protein expression levels of SLC23A1 in 7 AML cell lines and 4 ALL cell lines (Figure 3(c)). Consistent with the database, the average expression level of SVCT-1 protein was higher in ALL cell lines than in AML cell lines. Next, we hypothesized that elevated SVCT-1 expression in ALL cells might account for the observed higher sensitivity to VC. Correlation analysis showed a significant positive correlation between SVCT-1 protein expression and the IC50 of VC (Figure 3(d)). As a transporter protein, we also found no significant difference in SVCT-1 protein expression after VC treatment (Figure 3(e)). We hypothesized that the difference in sensitivity to VC between ALL and AML cell lines is due to differential VC uptake levels. Therefore, we measured the intracellular VC levels in 2 AML (MOLM13 and THP1) cell lines and 2 ALL cell lines (RS4 and NALM6). The results showed that ALL cell lines had significantly higher VC uptake levels than AML cell lines (Figure 3(f)).
To further assess whether the SLC23A1 is directly implicated in the sensitivity to VC, RS4 cells were transfected with SLC23A1-specific CRISPR-CAS9 to knock out SLC23A1expression. Western blotting at 48 and 72 h post-transfection confirmed a marked reduction in SLC23A1 compared to the control (Figure 3(g)). Therefore, VC was added to the culture medium at 72 h post-transfection and cell viability was assessed 24 h later. Flow cytometry revealed that SLC23A1 knockout significantly reduced the effectiveness of VC in inhibiting proliferation and promoting apoptosis (Figure 3(h) and (i)) as well as the significantly decreased intracellular VC uptake (Figure 3(j)), suggesting that SLC23A1 contributes to cellular sensitivity to VC. In conclusion, the expression of SLC23A1 is strongly correlated with VC uptake and sensitivity in ALL cells.
High-dose vitamin C does not alter ROS levels in ALL cell lines
Previous studies have suggested that VC, acting as an oxidant, may generate intracellular reactive oxygen species (ROS) through Fenton reactions, leading to cellular damage and impair cellular function.
31
To functionally evaluate ROS changes in the leukemic cell lines, we directly measured the ROS level after treatment with VC. We observed no significant differences in ROS levels in either ALL or AML cell lines following treatment with VC at a concentration of 200 μM, as shown in Figure 4(a). To further confirm that the anti-leukemic activity of VC in ALL is entirely unrelated with ROS, we utilized the N-acetylcysteine (NAC), a ROS inhibitor. The results showed that the anti-tumor ability of VC was not significantly reduced by NAC treatment, as revealed in Figure 4(b) and (c). These results suggest that high-dose VC does not cause significant intracellular ROS accumulation in either ALL or AML cell lines. VC does not trigger ROS accumulation in ALL and AML cell lines. (A) ALL and AML cell lines are treated with 200 μM VC for 2–4 h, followed by a 1-h incubation with the ROS-sensitive fluorescent dye DCF-DA. ROS-positive cells are quantified by flow cytometry. The pink area represents the negative control (NC), while the blue area indicates VC-treated cells. Corresponding bar plots show the ROS-positive cell counts on the Y-axis. (B-C) Cell apoptosis and proliferation was evaluated by flow cytometry in NALM6 and RS4 cell lines treated with 200 μM VC alone or in combination with 200 μM N-acetylcysteine (NAC) for 72 h. The Y-axes indicate percentage of apoptotic or proliferating cells (%), and X-axes indicate treatment conditions. Statistical significance: ns, no significance; ****P < 0.0005.
High-dose vitamin C induces apoptosis in ALL cells via activation of the ER stress response
To investigate the transcriptional effects of high-dose VC in ALL, we performed RNA sequencing on RS4 cells treated with 200 µM VC for 24 h. Heatmap analysis revealed 233 upregulated and 367 downregulated genes (Figure 5(a)). KEGG enrichment analysis demonstrated significant enrichment of apoptosis-related pathways among differentially expressed genes. Of these, the endogenous apoptotic pathway, driven by endoplasmic reticulum stress, displayed the highest degree of activation, highlighting its potential dominance in mediating programmed cell death in this context. (Figure 5(b)) VC induces apoptosis in ALL cells via activation of the ER stress response. (A) Heatmap displays the significantly differentially expressed genes (DEGs) in ALL cells treated with VC compared to PBS. (B) KEGG pathway enrichment analysis of DEGs in VC- and PBS- treated ALL cells. (C) GSEA of DEGs between VC- and PBS-treated ALL cells. (D) Western Blot analysis of ER stress-related proteins in RS4 cells following 72 h of 200 μM VC treatment. (E-F) Apoptosis and proliferation are evaluated by flow cytometry in RS4 cells treated with 200 μM VC alone or in combination with 200 μM 4-Phenylbutyric acid (4-PBA) for 72 h. The Y-axes indicate percentage of apoptotic or proliferating cells (%), and the X-axes indicate treatment conditions. (G) Western blot analysis of ER stress-related proteins in RS4 cells treated with VC alone or in combination with 4-PBA. Statistical significance: ns, no significance; ***P < 0.005; ****P < 0.0005.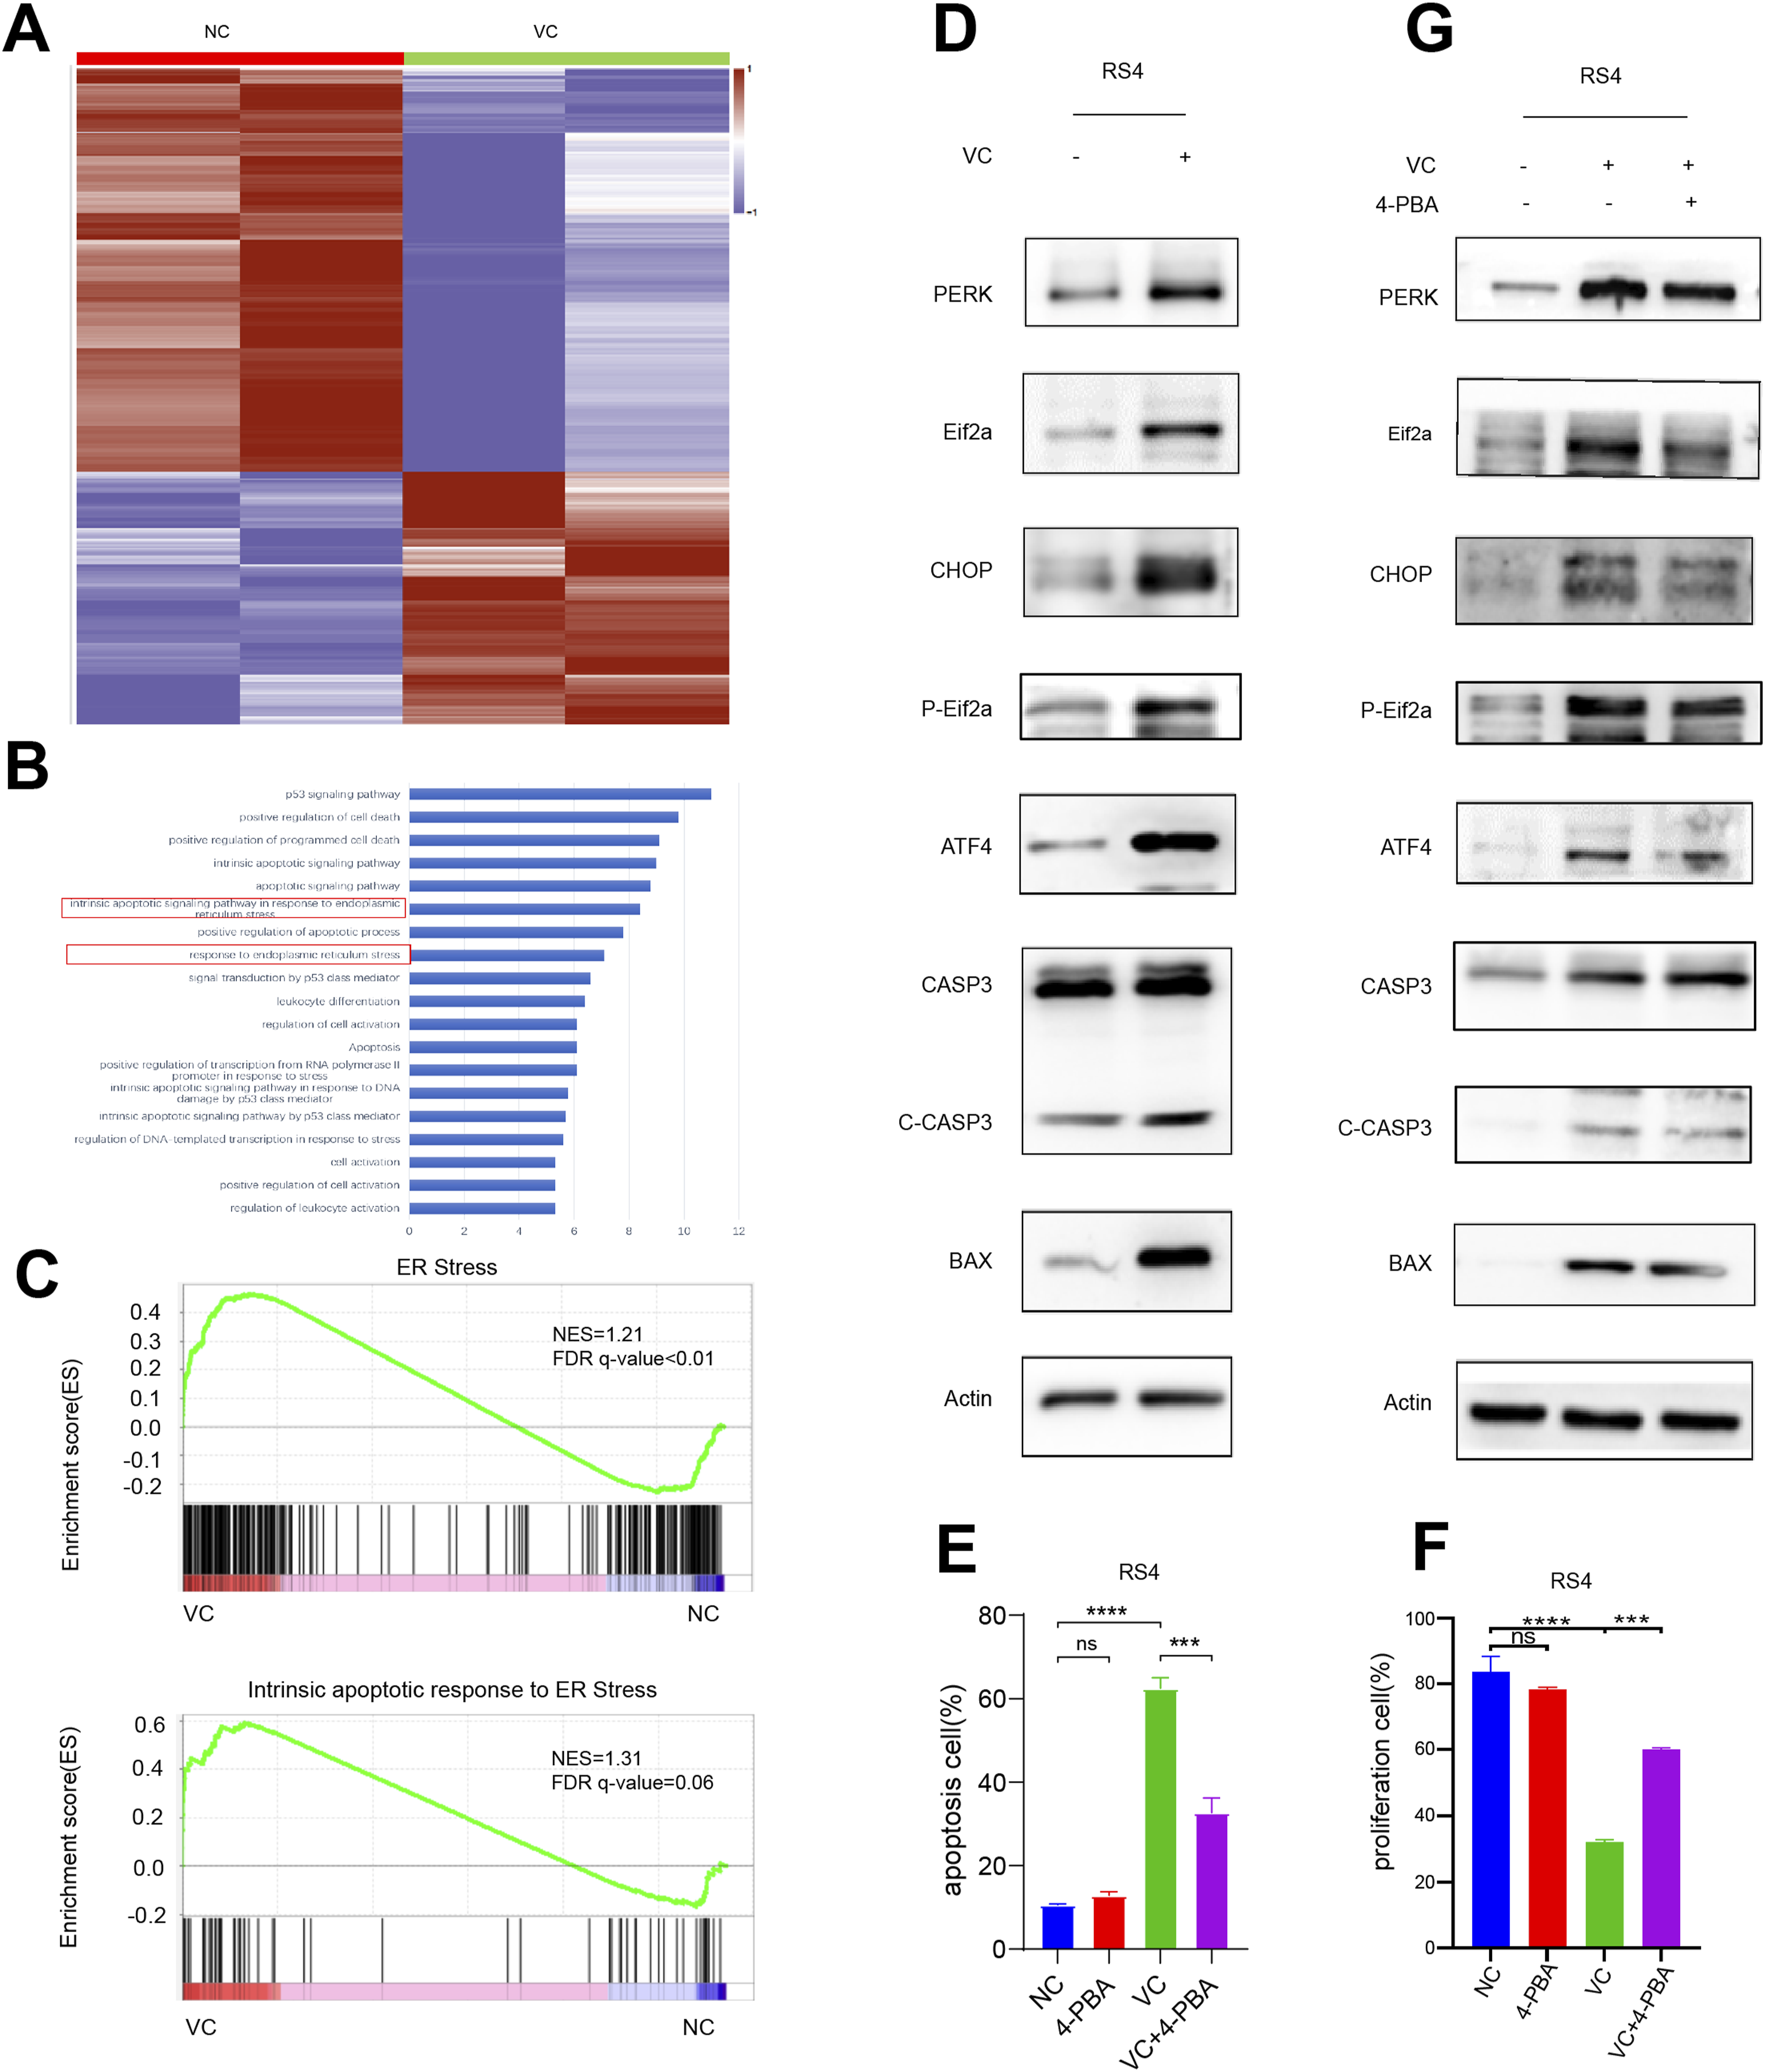
While some altered pathways related to cell cycle and cell division were also observed in other malignant cell lines, the enrichment of gene sets linked to the ER stress pathway and its associated apoptosis warranted particular attention. Gene Set Enrichment Analysis (GSEA) further supported this observation, showing notable enrichment of gene sets related to ER stress and apoptosis in the VC treatment group (Figure 5(c)).
The ER stress response is mediated by three key signaling sensors: PERK, ATF6, and IRE1α. The PERK/CHOP pathway is a crucial component of ER stress-induced apoptosis. CHOP, a target protein of ATF4, regulates the expression of apoptosis-related proteins.32,33 To functionally evaluate the alterations in the ER stress-induced apoptosis pathway, we assessed the expression levels of PERK pathway proteins and apoptosis-related markers following VC treatment. Notably, we observed marked increases in the ER stress-related proteins PERK, ATF4, and CHOP after 72 h of treatment with 200 µM VC. Furthermore, phosphorylation of eIF2α, along with apoptosis-related proteins BAX and Caspase-3, also showed significant elevation (Figure 5(d)).
To further confirm the role of ER stress as a mechanism underlying VC-induced apoptosis in ALL cells, we evaluated the effect of chemically inhibiting ER stress. Upon administration of 4-Phenylbutyric acid (4-PBA), an ER stress inhibitor, the apoptosis and inhibition of proliferation induced by VC were significantly reversed (Figure 5(e) and (f)). Correspondingly, CHOP and other apoptosis-related proteins were markedly decreased (Figure 5(g)). These results suggest that VC treatment triggers sustained ER stress, which activates the PERK/eIF2α pathway, leading to upregulation of CHOP and subsequent induction of apoptosis in ALL cells.
Discussion
In this study, we evaluated the efficacy of Vitamin C (VC) as a therapeutic drug for ALL and investigated its mechanism of action in ALL treatment. Our experimental results show that VC can significantly inhibit the activity of AML and ALL cell lines. Compared to AML, ALL is more sensitive to VC, and at the lethal dosage, VC has little effect on the viability of normal mononuclear cells. We found that this phenomenon is closely related to the expression of the VC transporter solute carrier family 23 member 1(SLC23A1); ALL cell lines have higher levels of SLC23A1 protein expression, resulting in more VC accumulation in the cells in the same amount of time. Previous studies have shown that VC can kill tumor cells by promoting ROS aggregation.34,35 However, the results of our study show that VC does not cause significant intracellular ROS aggregation in ALL and AML at a concentration of 200 μM, but it can induce ALL cell death through ER stress response via PERK/CHOP pathway.
Numerous studies have demonstrated the promising anti-cancer activity of pharmacological VC across various malignancies, including leukemia, melanoma, colon cancer, non-small-cell lung cancer, breast cancer, and glioma.7,36,37 In this study, we present functional and mechanistic data that provide substantial preclinical evidence supporting the use of VC in treating ALL. Our findings indicate that VC effectively inhibits cell proliferation and cycle progression while inducing apoptosis in ALL cells. Importantly, we observed minimal toxicity of VC on normal bone marrow mononuclear cells and in murine models. While our study demonstrates the anti-leukemic effects of high-dose VC in ALL cell lines, we acknowledge the limitations of using cell line models in translating these findings to clinical settings. Cell lines lack the complexity of the tumor microenvironment and patient heterogeneity. Future studies using patient-derived xenografts or clinical samples will be necessary to validate these findings in a more physiologically relevant context.
VC exerts its anti-cancer effects through multiple mechanisms, including the elimination of reactive oxygen species (ROS), selective ROS production that enhances cytotoxicity against cancer cells, impairment of glucose metabolism, epigenetic regulation, and downregulation of hypoxia-inducible factors (HIF) in tumor cells. 31 Recent studies have reported that pharmacological VC significantly inhibits mTOR pathway activation and promotes GSK3-FBXW7-mediated Rictor ubiquitination and degradation in a ROS-dependent manner, subsequently inducing autophagy and suppressing tumor growth. 38 Additionally, VC has been shown to trigger cytotoxicity in thyroid carcinoma cells by increasing ROS levels and altering metabolic pathways. 39 Other reports indicate that VC induces cell death via ROS generation, cytosolic calcium signaling, and PKC activation. 40 However, our study did not observe significant increases in intracellular ROS levels in ALL cell lines following VC treatment, suggesting that further investigation is necessary to elucidate the precise mechanisms by which VC inhibits ALL cell activity. We propose that the observed lack of ROS involvement in VC-induced apoptosis may be attributed to differential uptake mechanisms of VC. The two primary forms of VC, reduced L-ascorbic acid (LAA) and oxidized dehydroascorbic acid (DHA), enter cells through SVCTs and GLUTs, respectively. Previous studies have demonstrated that DHA can promote ROS accumulation. 35 However, our data indicate that the expression of SVCTs, particularly SLC23A1, is significantly elevated in ALL cells compared to AML cells (Figure 3), suggesting a preferential uptake of LAA rather than DHA. This preferential uptake may mitigate excessive ROS generation while still allowing VC to exert its anti-leukemic effects. This finding implies that ALL cells may primarily accumulate LAA through enhanced SVCT-mediated uptake, leading to apoptosis through ROS-independent mechanisms such as ER stress. To further validate this hypothesis, we plan to conduct in vitro and in vivo experiments comparing the effects of LAA and DHA in future studies.
To explore the transcriptional targets of VC and its modulation of key cancer pathways, we conducted RNA sequencing and found significant enrichment of the ER stress pathway and its associated apoptotic responses in VC-treated cells. Tumors often present genetic, transcriptional, and metabolic abnormalities that create a microenvironment conducive to the accumulation of misfolded proteins in the endoplasmic reticulum (ER), leading to ER stress and activation of the unfolded protein response (UPR). 41 Tumor cells can adapt to ER stress through various mechanisms, including transcriptional reprogramming and degradation of misfolded proteins, which may promote survival under stress. 42 However, prolonged ER stress can switch cells from a pro-survival to a pro-death response, resulting in apoptotic or autophagic cell death. Identifying agents that trigger apoptosis via ER stress could represent a novel therapeutic strategy in cancer treatment. 43 For instance, proteasome inhibitors have been shown to induce unresolved lethal ER stress. 44
The ER stress response involves three key transmembrane proteins: PERK, IRE1, and ATF6. Sustained ER stress can induce death signals through these pathways, making the abnormal activation of ER stress sensors and their downstream signaling critical for tumor growth, metastasis, and responses to therapies.32,45 For example, L-ascorbic acid has been reported to inhibit breast cancer growth by inducing IRE1/JNK/CHOP-related ER stress. 20 In our study, VC was found to upregulate ER stress-related proteins and apoptosis markers, ultimately inducing apoptosis. This effect is not unique to VC, as other therapeutic agents have also been shown to prevent tumor formation through ER stress mechanisms.46–48 In our study, we observed a significant increase in the expression of PERK, ATF4, and CHOP following VC treatment, along with enhanced phosphorylation of eIF2α, a downstream target of PERK. These results suggest that VC-induced ER stress primarily activates the PERK/CHOP axis. Future investigations incorporating eIF2α and ATF6 will be essential to provide a more comprehensive understanding of the ER stress-related mechanisms triggered by VC. Our findings indicate that VC disrupts protein homeostasis independently of oxidative stress, likely through direct impairment of protein folding, which leads to sustained activation of the unfolded protein response (UPR) and subsequent apoptotic cell death.
To confirm the role of ER stress in VC-induced apoptosis, we evaluated whether chemical inhibition of ER stress could reverse the response of ALL cells to VC. The ER stress inhibitor 4-Phenylbutyric acid (4-PBA) partially restored the activity of ALL cells, as demonstrated by a reduction in the number of apoptotic cells when treated with both 4-PBA and VC compared to VC alone. Nevertheless, the partial reduction in VC’s anticancer effects upon ER stress inhibition suggests that additional mechanisms may contribute to VC’s cytotoxicity, potentially involving alterations in intracellular metabolism or epigenetic regulation.
Intravenous administration of high-dose VC has shown promise in improving survival among patients with advanced cancers due to its selective toxicity. However, its therapeutic efficacy is often limited by slow autoxidation. Combining VC with chemotherapy, targeted therapy, or immunotherapy may enhance its antitumor effects. Previous studies have indicated that VC synergistically enhances the therapeutic impact of agents such as ibrutinib, idelalisib, and venetoclax in chronic lymphocytic leukemia (CLL) 8 and promotes responses in acute myeloid leukemia (AML). 49 Increasing evidence also suggests that VC may enhance immunotherapies, including CAR T-cell therapy and immune checkpoint inhibitors. 50 Although our study primarily investigates VC as monotherapy in ALL, future studies should explore its combination with other therapeutic strategies. Additionally, potential resistance mechanisms to VC should be considered. Reduced expression or dysfunction of VC transporters such as SLC23A1 may limit intracellular VC accumulation, while increased antioxidant capacity, such as glutathione (GSH) upregulation, could counteract oxidative stress. Furthermore, activation of alternative survival pathways, including PI3K/AKT or NF-κB signaling, may enable leukemia cells to evade VC-induced apoptosis. Understanding these resistance mechanisms will be crucial for optimizing VC-based therapeutic strategies in ALL.
Our findings suggest that SLC23A1 expression levels may serve as a predictive biomarker for the efficacy of high-dose VC treatment in ALL. Patients with higher SLC23A1 expression may exhibit greater intracellular VC uptake, leading to enhanced anti-leukemic effects. Therefore, assessing SLC23A1 levels in patient samples could help identify individuals who are more likely to benefit from VC therapy. Future clinical studies should focus on integrating SLC23A1 expression profiling into treatment decision-making to develop more personalized and effective VC-based therapies for ALL patients.
Conclusions
In conclusion, our study provides comprehensive preclinical evidence that Vitamin C (VC) effectively inhibits growth and induces apoptosis in ALL cells. Mechanistically, we demonstrated that VC treatment triggers sustained ER stress and activates the PERK pathway, leading to upregulation of CHOP and subsequent apoptosis. We also identified that the expression of SLC23A1, which correlates with VC uptake, enhances the sensitivity of ALL cells to VC, suggesting that SLC23A1 may serve as a potential biomarker for predicting the efficacy of VC treatments. These findings highlight the potential for personalized treatment strategies using SLC23A1 expression to optimize VC therapy in ALL. However, we acknowledge the limitations of our study, which primarily examined the effects of VC at the cellular level. To establish the therapeutic efficacy of VC in a clinical setting, in vivo studies and clinical trials are necessary to confirm its safety and effectiveness in patient populations.
Supplemental Material
Supplemental Material - High-dose vitamin C potently induces apoptosis in acute lymphoblastic leukemia by activating ER stress response
Supplemental Material for High-dose vitamin C potently induces apoptosis in acute lymphoblastic leukemia by activating ER stress response by Hui meng Sun, Yanan Jiang, Kaiping Luo, Dong hui Xing, Yixin Zhai, Xiang He, Wenqi Wu and Zhigang Zhao in Human & Experimental Toxicology
Footnotes
Acknowledgments
The authors sincerely thank all participants who contributed to this study. We extend our gratitude to the laboratory members for their technical support and insightful discussions. Special thanks to the Tianjin Natural Science Foundation Key Project (grant number 23JCZDJC00340) for their financial support.
Ethical statement
Author contributions
Conceptualization and design were performed by ZGZ. The vitro experiments were performed by H S, Y J and K L. In addition, H S, W W, and Y Z conducted the experiments in vivo. H S, Y J and K L analyzed the results and wrote the manuscript. H S and D X contributed to figure visualization. X H and YX Z contributed Collection and Assembly of Data. All authors contributed to the article and approved the submitted version.
Funding
The authors disclosed receipt of the following financial support for the research, authorship, and/or publication of this article: This study was funded by the Tianjin Natural Science Foundation Key Project (grant number 23JCZDJC00340).
Declaration of conflicting interests
The authors declared no potential conflicts of interest with respect to the research, authorship, and/or publication of this article.
Data Availability Statement
No datasets were generated or analyzed during the current study. All relevant data are provided within the manuscript.
Supplemental Material
Supplemental material for this article is available online.
References
Supplementary Material
Please find the following supplemental material available below.
For Open Access articles published under a Creative Commons License, all supplemental material carries the same license as the article it is associated with.
For non-Open Access articles published, all supplemental material carries a non-exclusive license, and permission requests for re-use of supplemental material or any part of supplemental material shall be sent directly to the copyright owner as specified in the copyright notice associated with the article.