
Abstract
Introduction
Alcoholic liver disease poses a severe threat to human health. The thyroid hormone Triiodothyronine (T3) is closely related to liver metabolism. This study investigated the effect and mechanism of T3 in alcoholic liver injury.
Methods
Acute alcoholic liver injury model was established in mice by alcohol administration. Alcoholic liver fibrosis models were established in vivo and in vitro using hepatic stellate cells (HSC)-T6 cells and mice. The role and regulatory mechanism of T3 in the occurrence and progression of alcoholic acute liver injury and fibrosis were analyzed by evaluating key factors involved in cell proliferation and apoptosis, inflammatory response, oxidative stress, and autophagy using histopathological staining.
Results
The results showed that T3 at low and medium concentrations reduced inflammation and oxidative damage in acute alcoholic liver injury and inhibited HSC activation and delayed the onset and progression of alcoholic liver fibrosis in mice. T3 inhibited the PI3K/AKT and NF-κB signal pathway, increased Nrf2 expression levels, and restored liver autophagy. However, high T3 concentrations had the opposite effect.
Discussion
Optimal T3 concentrations protects the liver from alcoholic liver injury by inhibiting inflammatory response and oxidative stress injury and by restoring hepatocyte proliferation, apoptosis, and autophagy.

Keywords
Introduction
Alcoholic liver disease (ALD), caused by alcohol exposure, is the leading cause of morbidity and mortality associated with liver disease worldwide, posing a significant threat to human life and health. 1 Approximately 23.6 million people worldwide suffered from alcohol-related cirrhosis in 2017, with 10% of them experiencing decompensation. 2 Alcohol exposure can cause acute liver injury and progressive ALD. Short-term heavy drinking can cause severe acute liver injury, whereas long-term heavy drinking leads to a series of liver damage known as ALD. This damage progresses from simple alcoholic fatty liver and alcoholic hepatitis to alcoholic liver fibrosis (ALF), liver cirrhosis, and, in the advanced stages of chronic liver disease, hepatocellular carcinoma (HCC). Many ALD-affected individuals have no clinical symptoms in its early stages, potentially leading to underestimation of morbidity and mortality. 2 Currently, there is no ideal treatment for ALD. Therefore, ALD needs increased clinical attention, with efforts directed toward achieving early detection, diagnosis, and treatment whenever possible.
The metabolic function of the liver and its high alcohol sensitivity cause nearly 95% of consumed alcohol to be metabolized in the liver. 3 Metabolites generated during alcohol metabolism can induce liver damage, triggering inflammatory reactions and oxidative stress injuries that persist throughout the onset and progression of acute alcoholic liver injury and liver fibrosis.
The metabolism of thyroid hormone (TH) is as closely intertwined with liver function as alcohol metabolism, with T3 being particularly significant. Approximately 80% of T3, a form of TH activity, is derived from T4 deiodination in the liver. 4 Alcohol consumption can damage liver structure and function, consequently affecting TH levels in the body. Therefore, abnormal TH levels are commonly observed in patients with liver disease. TH promotes cell proliferation; reduces liver inflammation, oxidative stress injuries; and reduces liver fibrosis severity, thereby playing a hepatoprotective role.5–7 Additionally, it shows obvious antifibrosis properties in conditions such as pulmonary fibrosis8,9 and myocardial fibrosis.10,11 Conversely, TH is reported to induce a hypermetabolic state in the liver, exacerbating primary liver injury, 12 and also promote liver fibrosis by stimulating hepatic stellate cell (HSC) activation. 13 The relationship between TH and various liver diseases is rarely reported. This study first explored the role of T3 in acute alcoholic liver injury by constructing a mouse model, and preliminarily explored the effect and mechanism of T3 through histopathological staining and western blot. Further exploration will be conducted on the role of T3 in the occurrence and development of alcoholic liver fibrosis. To this end, cell models and mouse models of alcoholic liver fibrosis will be constructed, and the role and corresponding molecular mechanisms of T3 in alcoholic liver fibrosis will be demonstrated through methods such as cell immunofluorescence staining, histopathological staining, and western blot. To provide accurate and non-invasive biomarkers for the early diagnosis of ALD, and to offer new insights and theoretical frameworks for its prognosis and treatment.
Material and methods
Experimental reagents
We purchased 3,3′,5-Triiodo-L-thyronine (≥95% HPLC) from Sigma-Aldrich, USA. Aspartate transaminase (AST), alanine transaminase (ALT), and superoxide dismutase (SOD) detection kits were purchased from Nanjing Jiancheng Bioengineering Institute. The malondialdehyde (MDA) test kit was sourced from Servicebio, Wuhan. Lieber–DeCarli Alcohol Liquid Feed was purchased from Jiangsu Nantong Trophy Co., Ltd. ELISA test kits for TT3 and TT4 were obtained from Quanzhou Ruixin Biotechnology Co., Ltd. AKT, p-AKT, and Nrf2 primary antibodies were purchased from Proteintech Group (Wuhan, China). p-PI3K-p85 primary antibody was obtained from Cell Signaling Technology (CST, USA). GAPDH, Bcl2, and Caspase9 primary antibodies were purchased from HuaBio Co., Ltd. (Hangzhou, China). The remaining antibodies were purchased from Santa Cruz Biotechnology (USA).
Cell viability detection
In all experiments, the cell density was set at 10−5 cells per mL, and the absorbance values (optical density value) of cells in each group were measured using the CCK-8 method.
Establishment of acute and chronic liver injury models induced by alcohol in vivo and in vitro
Establishment of ALF model using HSC-T6 cell model
HSC-T6 cells were treated with ethanol solutions, with concentrations of 0, 100, 200, 250, 300, 350, 400, 500, and 1000 mmol/L for 24 h. The ethanol solution that resulted in the highest relative activity was chosen as the modeling concentration for the subsequent experiment.
Determination of intervention time and concentration of T3 in vitro model
After ethanol stimulation, HSC cells were treated with T3 concentrations of 0, 10−11, 10−10, 10−9, 10−8, 10−7, 10−6, 10−5, and 10−4 mol/L. The T3 concentration that showed the lowest activity in HSC cells was selected as the intervention concentration for subsequent in vitro acute and chronic liver injury experiments.
Alcohol-induced acute liver injury and hepatic fibrosis in mice
C57BL/6N mice (6–8 weeks old, male, SPF grade, weighing 18 ± 22 g) were procured from Beijing Vital River Laboratory Animal Technology Co., Ltd. as experimental subjects. Mice were maintained following Institutional Animal Care and Use Committee guidelines. They were housed in conditions with a temperature of 22°C–25°C and humidity maintained at 40–60%, under a 12-h light/12-h dark cycle. All animal experiments were performed in compliance with the ARRIVE (Animal Research: Reporting of In Vivo Experiments) guidelines and approved by the Laboratory Animal Welfare and Ethical review of Henan Institute of Science and Technology under protocol number [approval no. HAUST-024-M1113001]. All efforts were made to minimize animal suffering and the number of animals used in this study.
In the acute experiment, 35 mice were randomly divided into five groups: the control group (Control), model group (Model), and three T3 intervention groups (25 μg/kg [T3-L], 50 μg/kg [T3-M], and 100 μg/kg [T3-H]). Intraperitoneal injections of T3 solution of 25 μg/kg, 50 μg/kg, and 100 μg/kg were administered for 7 days, followed by a single oral infusion of a 50% ethanol solution to establish a mouse model of acute alcoholic liver injury. 14
In the chronic experiment, 80 mice were randomly divided into six groups: the control group (Control), ALF model group (ALF), three T3 intervention groups (25 μg/kg [T3-L], 50 μg/kg [T3-M], and 100 μg/kg [T3-H]), and the T3 control group (T3-C, a T3 injection dose of 100 μg/kg). The ALF model in mice was established by feeding Lieber–DeCarli liquid (36% alcohol calorie ratio in the alcohol liquid feed, while control liquid feed was provided to control group and T3-C group of mice) for 8 weeks, combined with a 31.5% ethanol solution (up to 5 g/kg body weight, administered 2–3 times a week; the two control groups were not exposed to alcohol). 15 Starting from the sixth week, intraperitoneal T3 injection (once a day) was administered continuously for 3 weeks.
Cellular immunofluorescence staining
At a density of 1 × 10³ cells per mL, the cells were evenly seeded in confocal Petri dishes. Once the cells adhered to the dish wall, ethanol was added to activate HSCs. Subsequently, the activated HSC was treated with T3 for 24 h. After intervention, HSCs were fixed using paraformaldehyde fixation solution for 30 min, permeabilized with 0.5% Triton X-100 at room temperature for 25 min, and incubated with goat serum for 60 min at room temperature. The primary antibody (1: 200) and the secondary antibody were then sequentially applied to the HSCs to bind to the antigens. Finally, DAPI staining was used for nuclear localization. After completing all the procedures, fluorescence images were captured using a confocal microscope.
Detection of related protein expression by western blotting
Proteins were extracted from HSC cells, and mouse liver tissues. An equal amount of protein (10 μg for cell protein and 50 μg for tissue protein) was separated using constant voltage SDS-PAGE. Subsequently, the proteins were transferred to NC membrane using the constant current wet transfer method. The membrane was then blocked, incubated with the primary and secondary antibodies, and finally, the bands were visualized using enhanced chemiluminescence. Grayscale analysis of the protein bands was performed using ImageJ software. GAPDH was chosen as an internal reference protein, the grayscale values of the target proteins in each group were compared with those of GAPDH.
Histopathological staining
After dissecting the intact liver, paraffin sections were prepared for hematoxylin and eosin (HE) staining, liver glycogen periodic acid-Schiff (PAS) reagent staining, Sirius Red staining, and immunohistochemical staining. The primary antibody used for immunohistochemistry was diluted at a ratio of 1:100. Five fields of tissue under a 200x field of view were selected for cell necrosis evaluation, with a scoring criteria of 0- no necrosis; Level 1- There are 1 to 2 areas of necrosis; Level 2- There are 2 or more necrotic areas present; Level 3- Large areas of necrosis appear. The results of PAS staining and Sirius Red staining were analyzed using Image software. In immunohistochemical staining, Image software was used to evaluate the average fluorescence intensity value.
Determination of serological indices
The serum used in the study was collected from mouse blood through the posterior orbital sinus and centrifuged at high speed. The levels of AST, ALT, TT3, and TT4 were measured according to the manufacturer’s instructions.
Statistical analysis
The data are presented as mean with SD. One-way ANOVA was used for all normally distributed continuous data, followed by post-hoc tests using GraphPad Prism software for statistical analysis. For data that did not conform to a normal distribution, a nonparametric rank-sum test was used to analyze group differences. We considered P < 0.05 was considered significant.
Results
Appropriate T3 concentration can reduce alcohol-induced acute liver injury in mice
We constructed an acute alcoholic liver injury model in mice to explore the role of T3. HE staining (Figure 1A and C) and glycogen PAS staining (Figure 1B and D), part of liver pathological section staining, and serum ALT activity results (Figure 1E) revealed significant liver damage in the model group (P < 0.01). This was evidenced by disordered hepatocyte arrangement, loose and ballooned cytoplasm, inflammatory cell infiltration, and substantial loss of liver glycogen. In the T3-L and T3-M intervention groups, transaminase activity in mice decreased (P < 0.01 or P < 0.05), indicating liver function recovery and partial reversal of the aforementioned pathological changes. Moreover, T3-H group did not show any liver protection. Additionally, TT3 and TT4 levels in mouse serum showed decreased TH levels in the model group (Figure 1H and I), which increased to varying degrees after T3 intervention, although the change in TT4 levels was not pronounced. Additionally, the SOD enzyme activity and MDA content indicated successful reduction of oxidative stress levels in the mouse liver by all three doses of T3 (Figure 1F and G). Effect of T3 on acute alcoholic liver injury in mice. (A, C) HE staining of liver tissue in each group. (B, D) Liver glycogen PAS staining of liver tissue in each group. (E) Serum ALT activity detection. (F) SOD activity detection in liver tissue. (G) MDA content detection in liver tissue. (H) TT3 level detection in serum. (I) TT4 level detection in serum. Data are presented as mean ± SD. Compared with the control group, **P < 0.01, *P < 0.05. Compared with the model group, ##P < 0.01, #P < 0.05. ALT: alanine transaminase; HE: hematoxylin and eosin staining; MDA: malondialdehyde; PAS: periodic acid-Schiff; SOD: superoxide dismutase. All experiments were repeated at least three times.
T3 regulated hepatocyte proliferation, apoptosis, inflammation, and Nrf2 signal pathway in mice with acute alcoholic liver injury
To further explore the potential mechanism of T3 in acute alcoholic liver injury in mice, we investigated the protein expression levels of related factors in the liver, including those involved in cell proliferation and apoptosis, inflammation, the NF-κB signal pathway, and the antioxidant Nrf2 signal pathway. Western blotting revealed that low and medium concentrations of T3 reduced alcohol-induced cell apoptosis, with a significant decrease in Bax and Caspase3 expression levels (P < 0.01). T3 also restored hepatic cell proliferation, as evidenced by significantly higher expression levels of PCNA than that of the model group (P < 0.01). Additionally, T3 decreased TNF-α expression levels in the liver (P < 0.01), inhibited NF-κB phosphorylation levels and p-IKB expression levels in the NF-κB signal pathway (P < 0.01 or P < 0.05), and restored Nrf2 expression activity in the antioxidant pathway (Figure 2). Conversely, in the T3-H group, cell apoptosis factors including Bax and Caspase3 increased, with levels close to those of the model group (P > 0.05). Protein expression in liver tissue in acute alcoholic liver injury. (A) Western blot strip chart. (B) TNF-α expression level. (C) p-IKB expression level. (D) NF-κB phosphorylation level. (E) Bax expression level. (F) Caspase3 expression level. (G) PCNA expression level. (H) Nrf2 expression level. Data are presented as mean ± SD. Compared with the control group, **P < 0.01. Compared with the model group, ##P < 0.01, #P < 0.05. All experiments were repeated at least three times.
T3 inhibited activation and proliferation of HSCs induced by alcohol and promoting their apoptosis
The hepatoprotective effect of T3 in acute alcoholic liver injury has aroused our interest in the ALF model. First, we investigated the alcohol concentration that could activate HSCs (Figure 3A). Following treatment of HSC-T6 cells with ethanol solutions of 0, 100, 200, 250, 300, 350, 400, 500, and 1000 mmol/L for 24 h, the corresponding cell viabilities were 100%, 121%, 145%, 115%, 106%, 90%, 87%, 84%, and 61%, respectively. Notably, 200 mmol/L ethanol had the most pronounced effect on HSC activation, with a 45% increase in cell viability. At this concentration, the expression level of α-SMA, a marker of HSC activation, significantly increased (P < 0.01) (Figure 3D), thus it was selected as the concentration for alcohol stimulation to activate HSCs. Similarly, T3 concentrations ranging from 10−11 mol/L to 10−4 mol/L were used to treat alcohol-activated HSCs for 24 h, revealing that 10−7 mol/L T3 had the most significant inhibitory effect on HSC activation (Figure 3B). Effect of T3 on the activation of HSCs. (A) Determination of alcohol action concentration in vitro experiments. HSCs were stimula ted with ethanol concentrations of 0, 100, 200, 250, 300, 350, 400, 500, and 1000 mmol/L f or 24 h, and cell viability was observed. Alcohol concentrations resulting in the highest cell viability were selected for subsequent experiments. (B) Determination of optimal concentr ation for T3 action. HSCs were stimulated with 200 mmol/L ethanol for 24 h followed by adding T3 with different concentration of 10−11, 10−10, 10−9, 10−8, 10−7, 10−6, 10−5, and 10−4 mol /L for 24 h. T3 concentrations resulting in the lowest cell viability were selected for subseq uent experiments. (C) Western blot strip chart. (D) α-SMA expression level. (E) Collagen-Ⅰ expression level. (F) PCNA expression level. (G) Bax expression level. (H) TNF-α express ion level. (I) AKT phosphorylation level. (J) NF-κB phosphorylation level. (K) Cellular im munofluorescence staining for LC3-II expression. Green fluorescence indicates positive ex pression. (L) Cellular immunofluorescence staining for p62 expression. Green fluorescence indicates positive expression. (M) Western blot strip chart of cell autophagy. (N) LC3-Ⅱ expression level. (O) p62 expression level. Data are presented as mean ± SD. Compared with the control group, **P < 0.01, *P < 0.05. Compared with the model group, ##P < 0.01. HSC, hepatic stellate cells. All experiments were repeated at least three times.
The protein expression levels of α-SMA and Collagen-I, both fibrosis factors, indicated a significant decrease in the expression levels of both factors (P < 0.01) (Figure 3C–E), suggesting inhibition of HSC activation by T3. Subsequently, cell proliferation, apoptosis, and inflammation evaluated by assessing the expression levels of PCNA, Bax, and TNF-α showed that T3 decreased the activated HSC proliferation, accelerated the activated HSC apoptosis process, and reduced the proinflammatory factor TNF-α expression levels (Figure 3C, F–H).
T3 can inhibit the activation of AKT/NF-κB signal pathway and restore autophagy during HSC activation
The potential mechanism of T3 on HSC activation was further investigated. The expressions of key factors in the AKT/NF-κB signal pathway and cell autophagy were evaluated by western blotting and immunofluorescence staining. We observed that T3 inhibited the phosphorylation of AKT and NF-κB, thereby reducing their activation levels (Figure 3C, I, J). Furthermore, T3 restored the autophagy marker protein LC3-II expression level (Figure 3K, M and N) and decreased the autophagy ligand protein p62 expression level (Figure 3L, M and O).
Optimal concentration of T3 delayed the onset and progression of ALF in mice
The ALF model in vivo was established by intragastric administration of alcohol liquid feed combined with high-dose alcohol exposure for multiple times (Figure 4A). The degree of liver fibrosis in mice was evaluated based on increased serum transaminase activity, elevated proportion of red-stained collagen fibers in Sirius Red staining, and enhanced expression of fibrosis factors (Figure 4B–K). In this study, serum transaminase activity, collagen fiber content, and fibrosis factor expression in liver tissue were significantly lower in the T3-L and T3-M groups than that in the model group (P < 0.01), indicating that T3 could delay the onset and progression of ALF in mice. Conversely, indicators in the T3-C group resembled those in the control group (P > 0.05), implying that high T3 concentrations did not promote fibrosis in normal liver. However, fibrosis factors in the T3-H group did not show a dose-dependent trend of further decrease. Effect of T3 on ALF in mice. (A) Construction diagram of a mouse ALF model. (B) Serum ALT activity detection. (C) Serum AST activity detection. (D and E) Immunohistochemical results of Desmin in liver tissue. (F) Western blotting strip chart of fibrosis factors. (G) α-SMA expression level. (H) Collagen-Ⅰ expression level. (I) PDGF expression level. (J and K) Sirius Red staining of liver tissue in each group. (L) TT3 level detection in serum. (M) TT4 detection level in serum. (N and O) HE staining of liver tissue in each group. (P and Q) Liver glycogen PAS staining of liver tissue in each group. (R) SOD activity detection in liver tissue. (S) MDA content detection in liver tissue. Data are presented as mean ± SD. Compared with the control group, **P < 0.01, *P < 0.05. Compared with the model group, ##P < 0.01, #P < 0.05. In figure E, J, N and Q, (A) Control group; (B) ALF group; (C) T3-L group (T3 = 25 μg/kg); (D) T3-M group (T3 = 50 μg/kg); (E) T3-H group (T3 = 100 μg/kg); (F) T3-C group (T3 control group, T3 = 100 μg/kg). ALF: alcoholic liver fibrosis; AST: aspartate transaminase. All experiments were repeated at least three times.
HE and PAS staining (Figure 4N–Q) revealed that in the Control group and T3-C group, liver cords were neatly arranged, hepatic sinusoids were appropriately sized, hepatic lobule structure was clear, hepatocyte morphology was normal and intact, nuclei size was uniform, and liver glycogen content was abundant. In contrast, the model group showed blurred hepatic lobule boundaries, narrowed hepatic sinusoids, disordered hepatocyte arrangement, cytoplasmic loosening, varying nucleus sizes, fat vacuoles of different sizes, inflammatory cell infiltration, and punctate necrosis, with a significant loss of liver glycogen. Compared with the model group, these pathological changes were less severe (P < 0.05) in the T3 intervention group, indicating significantly lower liver injury levels. Therefore, T3 can reduce liver injury resulting from prolonged alcohol exposure.
Moreover, serum TH levels in the model group were lower than those in the Control group (P < 0.01), particularly TT3 levels (P < 0.01). Compared with the model group, TT3 levels partially recovered in the T3 intervention group with exogenous T3 supplementation although TT4 levels decreased to a higher extent (Figure 4L and M).
Effects of T3 on hepatocyte apoptosis, inflammation, and oxidative stress in mouse ALF
The role of T3 in the ALF model in vivo was further examined. Western blotting and immunohistochemistry were used to assess protein expression level, including cell apoptosis-related factors and proinflammatory factors. In the T3 intervention group, the expression level of Bax (Figure 5A and H), Caspase9 (Figure 5A and I), cleaved-caspase3 (Figure 5J and K), and TNF-α (Figure 5A and B) decreased (P < 0.01), whereas the expression level of the apoptosis inhibitor Bcl2 (Figure 5A and G) was restored (P < 0.01). Notably, high T3 concentrations did not show superior effects in inhibiting inflammatory responses and hepatocyte apoptosis. Liver oxidative stress levels were evaluated by biochemical methods (Figure 4R and S), revealing increased SOD activity and decreased MDA content in the T3 intervention group (P < 0.01). Protein expressions of related factors in liver tissue in mice ALF. (A)All western blot strip charts. (B) TNF-α expression level. (C) PI3K phosphorylation level (D) AKT phosphorylation level. (E) p-IKB expression level. (F) NF-κB phosphorylation level. (G) Bcl2 expression level. (H) Bax expression level. (I) Caspase9 expression level. (J and K) Immunohistochemical results of cleaved-caspase3 in liver tissue. (L) Nrf2 expression level. (M) LC3-Ⅱ expression level. (N) p62 expression level. (O) Immunohistochemical results of LC3-II in liver tissue. Data are presented as mean ± SD. Compared with the control group, **P < 0.01. Compared with the model group, ##P < 0.01. In figure K and O, (A) Control group; (B) ALF group; (C) T3-L group (T3 = 25 μg/kg); (D) T3 -M group (T3 = 50 μg/kg); (E) T3-H group (T3 = 100 μg/kg); (F) T3-C group (T3 control group, T3 = 100 μg/kg). All experiments were repeated at least three times.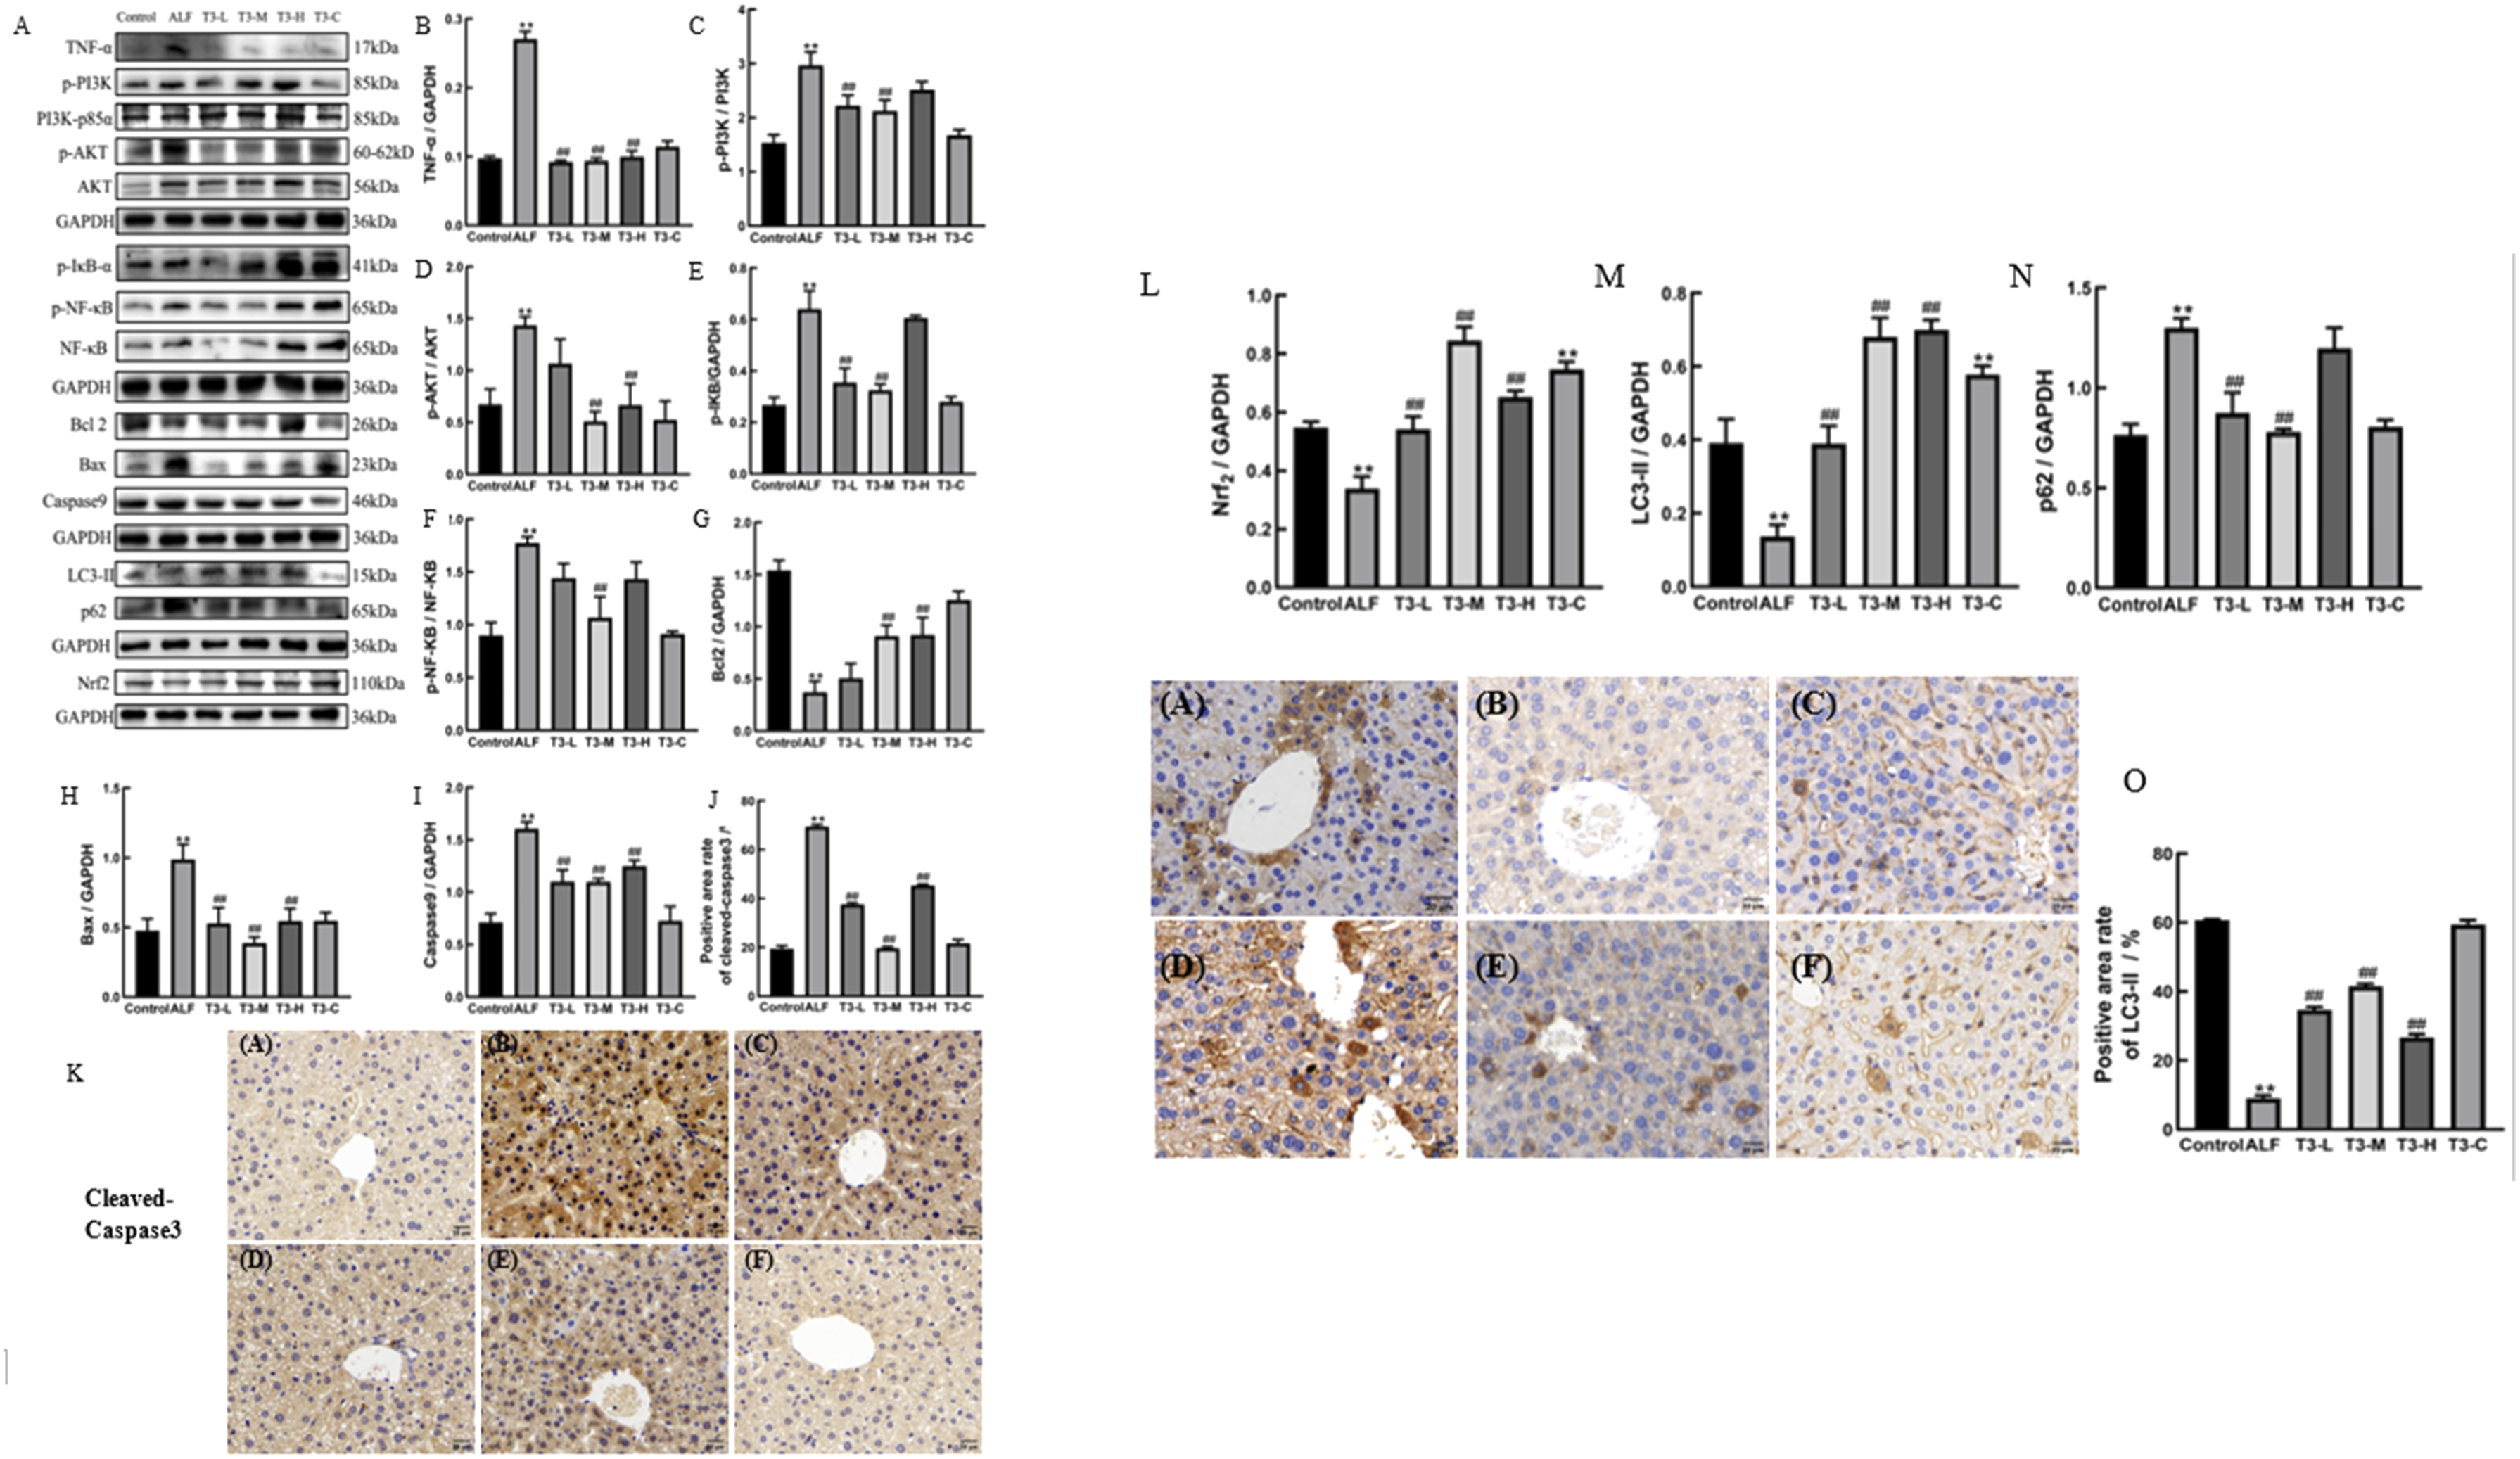
Optimal concentration of T3 can restore liver autophagy by inhibiting the inflammation, and alleviate liver oxidative stress injury
The potential mechanism of action of T3 during the formation of ALF was investigated. Factors related to certain signal pathways and cell autophagy in the liver were assessed through western blotting and immunohistochemistry. In the model group, the phosphorylation levels of PI3K, AKT, NF-κB and the expression levels of p-IKB and p62 increased significantly (Figure 5A, C–F and N; P < 0.01), whereas the expression levels of Nrf2 and LC3-II decreased significantly (Figure 5A, L, M and O; P < 0.01). The expression patterns of these proteins in the T3-L and T3-M intervention groups showed an opposite trend compared with that of the model group. Similarly, high T3 doses did not show a superior effect.
Discussion
The high morbidity and mortality, heavy social and economic burden, complex pathogenic mechanism of ALD, and lack of noninvasive and inexpensive diagnosis and treatment require more attention in clinical and basic research. Moreover, current diagnostic and treatment approaches are still in their infancy, highlighting the necessity for noninvasive and cost-effective solutions. This study aimed to explore the potential effects of T3 on acute liver injury and liver fibrosis induced by alcohol and to explore the underlying mechanisms.
Alcohol consumption leads to a significant increase in serum ALT and AST enzyme activity levels because of extensive liver cell damage, resulting in the release of intracellular transaminases into the blood circulation. Acute alcoholic liver injury is characterized by inflammatory cell infiltration, cytoplasm loosening, structural destruction, and obvious loss of liver glycogen. In this study, after a single intragastric administration of alcohol, the pathological changes align with those seen in other models of acute alcoholic liver injury, confirming the successful establishment of the mouse model. Additionally, alcohol causes hepatocytes to generate excessive free radicals, disrupting the body’s oxidant–antioxidant balance. 16 The body possesses various antioxidants to counteract cellular damage caused by lipid peroxidation resulting from free radical overproduction. Among these, SOD can regulate internal environment homeostasis. MDA reflects lipid peroxidation levels, and its excessive accumulation compromises membrane integrity and physiological function, serving as a critical indicator of oxidative stress response.17–19 In this study, T3 restored SOD activity and decreased MDA content, indicating that T3 significantly inhibited alcohol-induced liver oxidative stress injury. In summary, T3 demonstrates a protective effect in acute alcoholic liver injury.
Excessive ROS can activate the PI3K/AKT signaling pathway, which in turn activates NF-κB, promoting the inflammatory response regulated by NF-κB. ROS plays a crucial regulatory role in ALD.16,20,21 In this study, the phosphorylation levels of PI3K, AKT, and NF-κB were significantly increased in the model group, indicating that this pathway also contributes to the promotion of inflammatory responses in alcohol-induced liver injury and fibrosis. T3 can inhibit alcohol-induced liver injury and fibrosis by reducing the activation of the PI3K/AKT pathway, thereby decreasing the NF-κB signaling pathway activation.
Nrf2 is a key regulator in the antioxidant system of the body, modulating downstream antioxidants, such as SOD and glutathione, to maintain oxidant–antioxidant balance in the body.18,22 Several studies have shown that oxidative damage can be reduced and diseases can be treated by enhancing or restoring the activity of the damaged Nrf2 signaling pathway. In this study, we observed the phenomenon of oxidative damage caused by alcohol, prompting us to investigate its regulation by Nrf2. To address this, we examined Nrf2 expression levels in liver tissues, and the results showed that T3 could also reduce alcohol-induced oxidative stress injury by restoring the Nrf2 activity.
The core of hepatic fibrosis is the activation and proliferation of HSC. Upon stimulation by alcohol, HSCs located in the space of Disse are activated and become proliferative myofibroblasts, secreting a large amount of fibrinogen, including HSC activation marker proteins such as α-SMA and collagen, and extracellular matrix. The liver undergoes prolonged repeated fiber repair, altering its structural composition and promoting the onset and progression of hepatic fibrosis, which also changes the properties of the extracellular matrix. 23 The antifibrosis fibrotic property of T3 has previously been observed in lung and myocardial fibrosis. Through the detection of profibrosis factors such as α-SMA, PDGF, Collagen-I, and Desmin, this characteristic in the liver has been validated once again.
In the development of alcohol-induced chronic liver disease, liver autophagy is reported to be impaired, accelerating chronic liver disease progression. 24 Research on the mechanism of pulmonary fibrosis has shown that over activation of the PI3K/AKT pathway can inhibit autophagy, resulting in excessive p62 accumulation. 25 P62 is a multifunctional protein serving as a signal center, playing a crucial role in regulating inflammation and oxidative stress. 26 Excessive p62 can induce NF-κB activation and fibrosis gene expression, while also regulating the antioxidant Nrf2 signaling pathway. 27 Therefore, we aimed to determine whether T3 regulates ALF through this mechanism. The results showed that T3 intervention decreased the PI3K/AKT pathway activation, restored liver autophagy function, reduced abnormal p62 accumulation, decreased NF-κB signaling pathway activation, and restored the antioxidant Nrf2 signaling pathway.
However, the high T3 concentration did not demonstrate an ideal protective effect on the liver in the mouse models of alcoholic acute liver injury and liver fibrosis, which might be related to the high metabolic state induced by T3 in the liver. Nevertheless, intervention with an optimal T3 concentration can reduce alcoholic acute liver injury by decreasing hepatocyte apoptosis, promoting cell proliferation, and inhibiting liver inflammation and oxidative stress injury. T3 can also delay the onset and progression of ALF by inhibiting inflammatory reactions and oxidative stress injury and by regulating cell proliferation, apoptosis, and autophagy. These findings on the hepatoprotective role of T3 in ALD could offer a new approach and fundamental theoretical basis for the diagnosis and treatment of ALD in future. Most studies on liver injury and liver fibrosis focus on drug targets for anti-inflammation and anti-fibrosis. In contrast, this study turns attention to thyroid hormones, which are involved in whole-body metabolism. It innovatively intervenes in alcohol-induced liver injury from the perspectives of anti-inflammation and autophagy regulation, attempting to protect the liver by adjusting the body’s own metabolism. Currently, there is a lack of ideal treatment methods for alcoholic liver disease. If the T3 therapy can be successfully translated into clinical applications, it will fill some of the treatment gaps and improve the prognosis of patients.
Although this study explored the effects of T3 on alcoholic liver injury using in vitro and in vivo models respectively, certain limitations still exist. The in vitro model lacks overall systematicity, which may lead to deviations between the research results of the mechanism of action of T3 on hepatic stellate cells (HSCs) in in vitro experiments and the actual situation in vivo. In addition, in in vitro experiments, T3 can directly act on HSCs, but the range of action of T3 in vivo is very wide, which may result in certain differences in the experimental results between in vitro and in vivo studies. Further in - depth research on the role and mechanism of T3 in alcoholic liver injury is still needed in the future.
In conclusion, our study suggested that the relationship between thyroid hormone T3 and liver disease was investigated, particularly focusing on alcoholic acute liver injury and liver fibrosis. This study identified that T3 had a dual role in alcoholic liver disease in both in vivo and in vitro models. Low and medium T3 concentrations demonstrated a capacity to mitigate acute and persistent liver inflammation and oxidative damage caused by alcohol by causing a protective effect in cases of acute alcoholic liver injury and alcoholic liver fibrosis. T3 achieved this by inhibiting the PI3K/AKT and NF-κB signaling pathways, restoring liver autophagy and the antioxidant system, thus reducing alcohol-induced liver damage. Conversely, high T3 dose had an adverse effect in mice with alcoholic liver disease.
Footnotes
Acknowledgments
The authors extend their gratitude to all individuals who participated in this study.
Statements and declarations
Funding
The author(s) disclosed receipt of the following financial support for the research, authorship, and/or publication of this article: This work was supported by National Natural Science Foundation of China (82170606), Basic Research Project of Key Scientific Research Projects of Universities in Henan Province (23ZX006), and 2023 Henan Province Central Guidance and Local Science and Technology Development Fund (Z20231811030).
Conflicting interests
The author(s) declared no potential conflicts of interest with respect to the research, authorship, and/or publication of this article.