
Abstract
Background & Aims
The liver is a vital organ responsible for numerous metabolic processes, which can be significantly impacted by long non-coding RNAs (lncRNAs) and microRNAs (miRNAs). These ribonucleic acid (RNA) molecules have been shown to play a crucial role in regulating gene expression, and their dysregulation has been implicated in numerous liver disorders. Our study aimed to investigate the diagnostic accuracy of plasmacytoma variant translocation-1 (PVT-1), microRNA-29a/29b (miR-29a/miR-29b), and inflammatory biomarkers [ interleukine-6 (IL-6), tumor necrosis factor-alpha (TNF-α), transforming growth factor-beta (TGF-β), and insulin growth factor-1 (IGF-1)] as diagnostic and prognostic biomarkers for liver cirrhosis. Therefore, understanding the mechanisms by which lncRNAs and miRNAs influence liver metabolism is of paramount importance in developing effective treatments for liver-related diseases.
Methods
Serum samples were collected from 164 participants, comprising 114 cirrhotic patients with varying grades (35 grade I, 35 grade II, and 44 grade III) and 50 healthy controls. PVT-1 and miR-29a/miR-29b expression was analyzed by reverse transcription-quantitative polymerase chain reaction (RT-PCR), while the serum levels of inflammatory biomarkers were assessed using enzyme-linked immunosorbent assay (ELISA).
Results
The study participants exhibited notable differences in PVT-1 and miR-29a/miR-29b expression. ROC analysis revealed excellent discriminative power for PVT-1 and miR-29a/miR-29b in distinguishing cirrhotic patients from healthy controls.
Conclusion
This study demonstrates the promising potential of PVT-1 and miR-29a/miR-29b as early diagnostic biomarkers for liver cirrhosis detection, requiring further validation in larger cohorts. Our findings also reinforce the diagnostic value of circulating inflammatory biomarkers (IL-6, TNF-α, TGF-β, and IGF-1) levels for liver cirrhosis screening.
Introduction
Liver and gastrointestinal diseases are the primary causes of health problems and fatalities in the Middle East, with liver cirrhosis ranking among the top four reasons for mortality in the region. 1 The mortality rate caused by cirrhosis in Egypt is unacceptably high. 2 Different types of liver disorders at various stages impose a huge economic and psychological burden on governments and society. It is crucial to acknowledge and take appropriate measures for prevention and treatment. 3 Hence, it is imperative to precisely identify and diagnose these diseases at various stages to tackle this pressing issue.
Cytokines have a crucial impact on the activation and stimulation of hepatic stellate cells (HSCs) in the liver, which leads to fibrosis. 4 Fibrosis is the precursor to cirrhosis, the final stage of chronic liver disease. Non-coding ribonucleic acids (ncRNAs) and cytokines play critical roles in the onset and progression of liver fibrosis, ultimately leading to cirrhosis. 5 The activation of hepatic stellate cells is a critical event in the progression of fibrosis in the liver, contributing considerably to the pathophysiology of cirrhosis.
Interleukine-6 (IL-6), transforming growth factor-beta (TGF-β), and tumor necrosis factor-alpha (TNF-α) are among the inflammatory mediators involved in the onset and progression of liver disorders. 6 However, despite extensive research, the association between inflammatory cytokines and liver diseases remains inconsistent. Duan et al., 6 and Bocsan et al., 7 found a positive association between cirrhosis and inflammatory cytokines, while Martínez-Esparza et al., 8 found either negative or no association.
NcRNAs are functional RNA molecules that do not code for protein; they are categorised into several types, such as micro ribonucleic acids (miRNAs) and long noncoding ribonucleic acids (lncRNAs). 9 These groups are recognized as highly valuable clinical biomarkers and potential therapeutic targets. 10 lncRNAs are a crucial component of the genome that were once wrongly dismissed as insignificant. Abnormal lncRNA expression levels play a significant role in various disorders. 11 While their involvement in cancer has been extensively studied, their connection to metabolic disorders and comorbidities like liver disease has recently been discovered.
Plasmacytoma variant translocation-1 (PVT-1), a long non-coding RNA in human chromosome 8q24.21 region, inhibits podocyte injury and apoptosis in diabetic nephropathy via forkhead box A1 (FOXA1). 12 It also promotes fatty acid synthesis and inhibits their oxidation in obesity. 13 PVT-1 has been strongly implicated in the progression of endometrial, bladder, and ovarian cancers. 14
miRNAs modulate cellular activities such as fibrosis, inflammation, and lipid and glucose metabolism in the liver via post-transcriptional events. 15 It is a well-known fact that miRNAs fine-tune normal liver functions and prevent the development of liver diseases. 16 However, alteration in miRNA expression can lead to various liver diseases, such as hepatocellular carcinoma, fibrosis, and cirrhosis. 17 Therefore, comprehending the role of miRNAs in liver disease is essential for developing effective treatments for these conditions.
Epithelial-mesenchymal transition (EMT) in metabolic disorders and various diseases has recently received attention from researchers and clinicians. The regulatory factors of EMT appear to worsen the prognosis of many disorders. Several factors, including IL-6, TGFβ-1, insulin-like growth factor-1 (IGF-1), fibroblast growth factor, epidermal growth factor, and hepatocyte growth factor, can contribute to EMT. The pathways that control EMT can change based on the characteristics of the disorders since EMT variables are frequently variable and tissue-dependent.
Inflammatory conditions can have negative outcomes by triggering EMT. Herein, we analyzed three potential factors known to trigger EMT: IL-6, IGF-1, and TGF-β1. We chose these three cytokines because they are often associated with inflammation, fibrosis, and poor prognosis in patients diagnosed with liver cirrhosis. This study aimed to explore the diagnostic accuracy of PVT-1, miR-29a/miR-29b, and their crosstalk with inflammatory biomarkers (IL-6, TNF-α, TGF-β, and (IGF-1), which are associated with increased cirrhotic grade features in cirrhotic patients.
Methods and materials
This study included 114 adult Egyptian patients with liver cirrhosis who were recruited from the Tropical Medicine Department of Beni-Suef University Hospital. The clinical, imaging, and laboratory results were analysed to confirm the diagnosis of cirrhosis. Before participating in the study, none of the patients had received radiation or chemotherapy. At admission, the Child-Pugh grading was used to determine the extent of liver cirrhosi . 18 The study included 50 healthy volunteers with no history of liver diseases in the healthy control group. All patients had a comprehensive clinical evaluation and laboratory tests to diagnose liver cirrhosis. The imaging examinations, including abdominal ultrasonography with Doppler and upper endoscopy, were performed. Patients were excluded if they had non-alcoholic steatohepatitis, malignancies, diabetes mellitus (DM), thyroid dysfunction, or autoimmune hepatitis. The Helsinki Declaration’s ethical principles were followed by the protocol, which was authorized by the Medical Ethics and Human Clinical Trial Committee of Beni-Suef University. Written informed consent was obtained from subjects before entering the study, and all participants signed an informed consent agreement after the purpose of the study was explained. The clinical variables were collected: age, sex, smoking history, and etiology of cirrhosis.
Sample collection
All subjects underwent laboratory evaluation at admission, and Fasting venous blood samples (10 mL) were collected.
Measurements of blood parameters
CBC included platelet, WBC, RBC, and Hb% estimations assessed. A portion of blood was allowed to clot and centrifuged for 5 min to isolate the serum used for the measurement of Liver function tests, including serum total and direct bilirubin, serum albumin, and ALT levels, in addition to renal function test (blood urea, serum creatinine).
ELISA for IGF-1, TNF-α, and IL-6 expression levels
Serum levels of IGF-1, TNF-α, and IL-6 were analyzed with ELISA kits from Elabscience Biotechnology Inc. (USA), Avi-Bion (Orgenium Laboratories, Finland), and Beyotime Institute of Biotechnology Co., Ltd (Shanghai, China), respectively; following the manufacturer’s instructions.
Real-time PCR for PVT-1, miR-29a/29b
RNA was extracted using a Direct-zol RNA Miniprep Plus kit (Cat# R2072, ZYMO RESEARCH CORP., USA) and assessed for quality and quantity with a Beckman dual spectrophotometer (USA). Thermo Fisher Reverse Transcription Kit from Waltham, Massachusetts, USA; used for reverse transcription. Along with the target-specific miScript primers assay for miRNA-29a & miRNA-29b versus the matching housekeeping gene RUN U6B, the miScript SYBR® Green PCR Kit (Qiagen, Germany. Cat. No. 218073) is a component of the miScript PCR system. The qRT-PCR cycler was programmed with the following cycling: denaturation at 94°C, annealing at 55°C and extension at 70°C and these steps were repeated for 40 cycles in Rotor-gene qRT-PCR system thermocycler (Qiagen, USA). All reactions were run in triplicate. The PCR data sheet presents the Ct values for miRNA-29a and miRNA-29b versus the housekeeping gene RUN U6B. Additionally, it includes the Ct values for PVT1 versus the housekeeping gene GAPDH. The relative quantification (RQ) is quantified and normalized to the housekeeping gene according to delta-delta Ct (ΔΔCt). We calculated the RQ of each gene by taking 2−∆∆Ct, according to Livak and Schmittgen. 19
Western blot analysis for TGF-B expression level
The Protein Extraction Kit ReadyPrepTM (catalog #163–2086) from Bio-Rad Inc. was used to add to each sample of lysed cells from every group; protein analysis was performed for each sample using the Bradford assay (Bio Basic Inc., Canada), followed by polyacrylamide gel electrophoresis (SDS-PAGE). The protein bands were transferred using the Bio-Rad Trans-Blot Turbo. Later, TGF-β primary antibodies (Rockland, Philadelphia, USA) were added to the membrane and incubated overnight. A secondary antibody that was HRP-conjugated was treated to the membrane. Finally, the blots were treated with a chemiluminescent substrate (Clarity TM Western ECL substrate Bio-Rad catalog#170-5060). Normalized protein levels were detected using the Harlow and Lane 20 method and compared to beta-actin control samples on a ChemiDoc MP imager.
Statistical analysis
The mean and standard error were presented as descriptive statistics, and One-way ANOVA was used to compare various groups, with Tukey’s post-hoc for pairwise comparisons. The statistical analysis was performed with version 22 of the Statistical Package for Social Science (SPSS).
Results
Clinical and laboratory features of the enrolled participants
The demographic data age, gender, and liver function profile among study participants.

Hb, WBC, PLT, ALT, albumin, and creatinine levels are represented as Mean ± SEM. GI (child A patients): GII (child B patients); and GIII (child C patients). According to the Tukey’s multiple range test, the different letters (a, b,c, and d) indicate statistical significance where p < .05. Values which share the same superscript symbol (a, b,c, and d) are not significantly different where p > .05. ALT: Alanine transaminase; and Hb: Hemoglobin; PLTs: Platelets; WBC: White blood cells.
Comparison of the serum expression levels of IL-6,TNF-α, IGF-1, TGF-β, PVT-1, miR-29a, and miR-29b in the different studied groups
Changes in the levels of IL-6, TNF-α, IGF-1, and TGF-β among study participants.
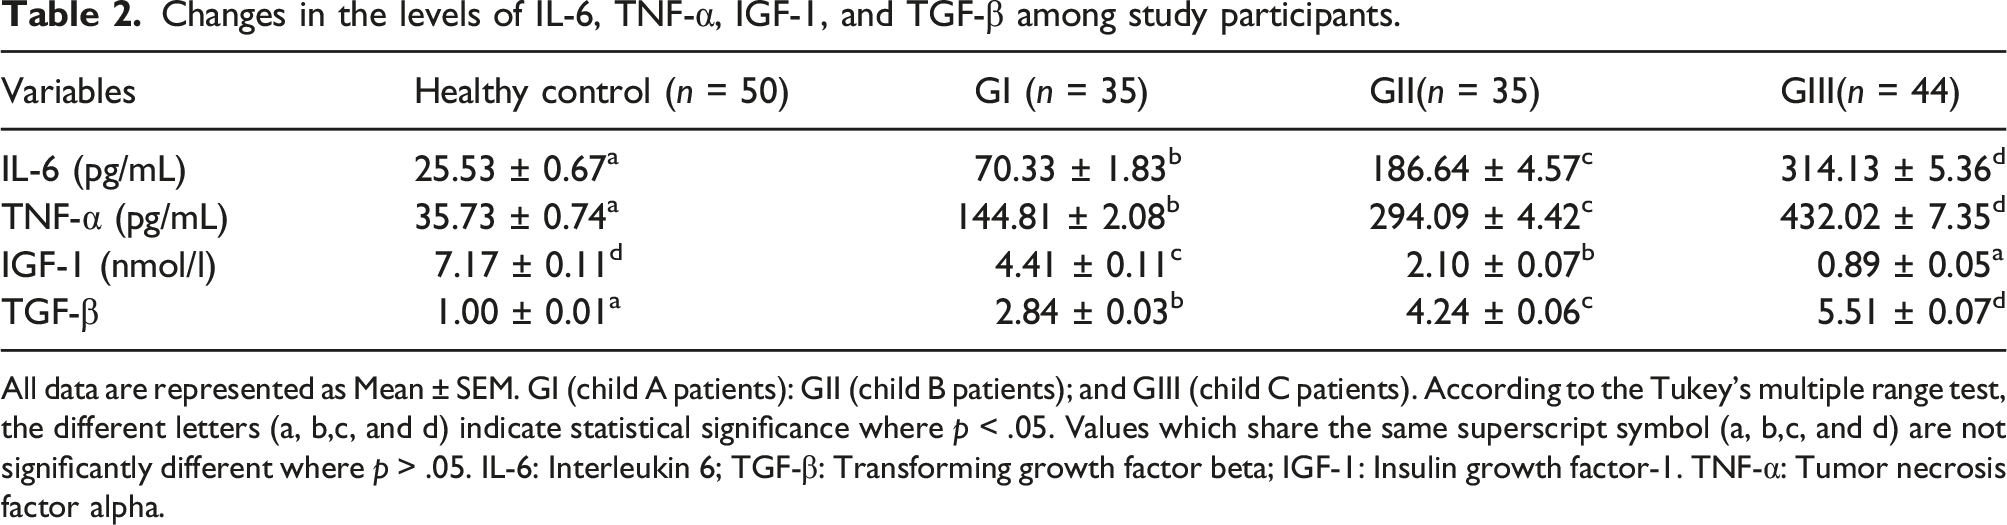
All data are represented as Mean ± SEM. GI (child A patients): GII (child B patients); and GIII (child C patients). According to the Tukey’s multiple range test, the different letters (a, b,c, and d) indicate statistical significance where p < .05. Values which share the same superscript symbol (a, b,c, and d) are not significantly different where p > .05. IL-6: Interleukin 6; TGF-β: Transforming growth factor beta; IGF-1: Insulin growth factor-1. TNF-α: Tumor necrosis factor alpha.

Relative expression of TGF-β, PVT-1, miR-29a, and miR-29b levels among study participants.
Correlation of IL-6, TNF-α, TGF-β, IGF-1 With PVT-1, miR-29a, and miR-29b expression among study participants
The correlation between IL-6, PVT1, miR-29a, TGF-β, TNF-α and IGF1 among study participants.

** Significant linear correlation at p < .01 (2-tailed).
ROC analysis to investigate the diagnostic efficacy of serum PVT-1, miR-29a, and miR-29b in differentiating cirrhosis patients from healthy control subjects
A ROC curve was assembled to estimate the diagnostic value of PVT-1, miR-29a, and miR-29b as biomarkers for cirrhotic patients relative to healthy subjects. The AUC for PVT-1 was 0.999 (95% CI = 0.997-1.001, p < .001), with 98.26% sensitivity and 100% specificity (Figure 2(a)). Furthermore, the AUC of miR-29a was 0.991 (95% CI = 0.975-1.007, p < .001), with a sensitivity of 99.13% and specificity of 98% (Figure 2(b)). Also, the AUC of miR-29b was 0.999 (95% CI = 0.998–1.001, p < .001), with a sensitivity of 97.37% and a specificity of 100% (Figure 2(c)). Receiver operating characteristic curves (ROC) for PVT-1, miR-29a, and miR-29b discrimination between cirrhotic patients and healthy participants. (a): ROC for PVT-1. (b): ROC for miR-29a, (c): ROC for miR-29b
ROC curve analysis revealed that serum PVT-1, miR-29a, and miR-291b have a prognostic value in discriminating cirrhotic patients with grade III from those of grades I and II
The current results demonstrated that using PVT-1 to diagnose cirrhotic patients with grade III yielded an AUC of 0.968 (95% CI = 0.942–0.995, p < .001), with a sensitivity of 95.56% and a specificity of 87.14% (Figure 3(a)). Furthermore, the AUC value for miR-29a was 0.987 (95% CI = 0.972-1.003, p < .001), with a sensitivity of 95.56% and specificity of 95.71% (Figure 3(b)). MiR-29b demonstrated 100% sensitivity and specificity with an AUC of 1 (p < .001) (Figure 3(c)). Receiver operating characteristic curves (ROC) for PVT-1, miR-29a, and miR-29b discrimination between cirrhotic patients with grade III from those of grade I and II. (a): ROC for PVT-1. (b): ROC for miR-29a. (c): ROC for miR-29b.
Discussion
Cirrhosis is the final stage of liver fibrosis caused by a prolonged healing process following a liver injury, leading to chronic liver diseases. 21 In addition, cirrhosis is a burden on the individual and public health.
In developed countries, liver cirrhosis is the most frequent liver disease. 22 The molecular and biochemical crosstalk between inflammatory biomarkers and noncoding RNA expression and its implication in liver cirrhosis is still a mystery. Research that sheds light on the significant roles of ncRNAs in initiation liver diseases can help to understand these molecular mechanisms and develop novel diagnostic biomarkers and therapeutic targets for these patients. This study aims to link miRNA regulation with the immuno-inflammatory mechanism for liver cirrhosis and to explore the novel functional role of miR-29a/miR-29b in liver cirrhosis.
In this study, TNF-α, and IL-6 expression levels were significantly higher in the sera of patients with liver cirrhosis compared to the healthy control group. Zanetto et al. 23 supported our findings by reporting that systemic inflammation indicates the progression of liver cirrhosis. In vitro studies have shown that liver resident macrophages, hepatic stellate cells, and hepatocytes express inflammatory cytokines and chemokines during liver stress and injury. 24 Circulating immune cells contribute to increased inflammatory cytokine levels in chronic liver disease, 25 leading to muscle wasting, decreased growth hormone levels, and immune cell recruitment, resulting in significant muscle atrophy. 26
IL-6 is a potent cytokine that impacts the body through various mechanisms. Elevated levels of IL-6 are strongly associated with increased morbidity and disease activity in a range of chronic disorders, like hepatocellular carcinoma and liver cirrhosis. 27 In our study, IL-6 levels in cirrhotic patients were significantly higher than in healthy controls. IL-6 was positively correlated with TNF-α in study participants. The positive correlation suggests that IL-6 levels are closely related to liver inflammation status. 28
Zhao et al. 29 stated that TNF-α levels correlate with the severity of hepatic inflammation, fibrosis, and liver damage, promoting both hepatocyte cell death and proliferation. In our study, the concentration of TNF-α in the sera of cirrhotic patients was higher than in the control group (p < .05). Fontes-Cal et al. 30 reported that patients with mild liver inflammation had elevated levels of TNF-α in their serum and suggested that this cytokine could be utilized as a predictor of liver inflammation.
TGF-β regulates inflammation, promotes tissue repair, and controls adhesion molecules on parenchymal cells to inhibit leukocyte activation and infiltration. 31 Moreover, TGF-β inhibits proliferation, differentiation, and survival of cells by blocking proinflammatory cytokines.
Our study found that patients with cirrhosis had significantly lower levels of IGF-1 compared to healthy controls. Moreover, IGF-1 expression correlated negatively with IL-6, TNF-α, and TGF-β. IGF-1, which is known to be a cytoprotective hormone, is primarily produced in the liver and plays a crucial role in regulating cell senescence, survival, and proliferation. 32 Our findings were consistent with those of.33,34 Reduced IGF-1 expression levels in liver cirrhosis are multifactorial and may be related to hepatocellular dysfunction, malnutrition, oxidative damage, altered lipid metabolism, and insulin resistance. Reduced IGF-1 levels lead to GH resistance, decreased GHR expression, and feedback circuits at endocrine and paracrine loops. 35
Limited knowledge of ncRNA target recognition hampers understanding the connection between ncRNAs and liver cirrhosis. ncRNAs modulate their biological functions via the mRNA of their multiple target genes. 36 In the current study, we detected statistically significant higher values of the relative expression levels of lncRNA-PVT1 in cirrhotic patients compared to healthy controls. Patients with grade III showed considerably higher values of PVT-1 than those with grades I and II (p < .001). Zhang et al. 37 and Wang et al. 38 concurred with our findings that the lncRNA PVT1 acts as a regulator of various complications associated with metabolic disorders, including apoptosis and inflammation. According to He et al., 39 PVT1 is highly expressed in human colorectal cancer (CRC) tissues. Although several studies have demonstrated the significance of PVT1 in CRC, the exact mechanism remains unclear. 40
In fibrotic liver tissue and activated hepatic stellate cells (HSC), PVT1 expression was upregulated. 41 Furthermore, PVT1 can function as a miR-152 ceRNA. Zheng et al. 42 reported that PVT1 binds to miR-152 competitively and methylates PTCH1 to inhibit its expression. This activation of the hedgehog pathway leads to the promotion of EMT and HSC activation in liver cirrhosis.
Remarkably, serum miR-29a levels were considerably down-regulated in liver cirrhosis patients as compared to healthy controls, and low levels of miR-29a/miR-29b were linked to advanced stages of the disease. The molecular mechanism underlying lower serum levels of miR-29a in cirrhosis patients is unknown. miR-29a has previously been shown to have antifibrotic properties, and its hepatic loss and secretion during liver disease are shown to be associated with liver fibrosis.43,44 Although the exact mechanism of miRNA regulation in serum is still unknown, the remarkable regulation of miR-29a in cirrhosis patients’ serum may have implications for the disease’s clinical manifestations. Through the TGF-β/SMAD-CTGF signaling network, miR-29b can inhibit the expression of ECM genes in HSCs, the production of type I collagen, and HSC activation.
We assessed the diagnostic performance and accuracy of lncRNA PVT1, miR-29a, and miR-29b using ROC analysis and area under the curve (AUC). Our findings showed that these non-coding RNAs (ncRNAs) have a significant ROC performance and AUC curve in cirrhotic patients. ncRNAs demonstrate a high sensitivity rate in diagnosing liver cirrhosis. The ROC and AUC revealed that these ncRNAs might be used as biomarkers to indicate the prognosis and severity of liver cirrhosis. Similarly, the study of Fouda et al., 45 who analyzed the combination of the microRNA panel (miRNA-200, miRNA-21, miRNA-29a, and miRNA-335) significantly improved the diagnostic ability of HCC patients and exhibited good diagnostic performance. Several approaches and techniques have been used to identify and quantify ncRNAs, resulting in discrepancies between reported results. In light of these contradictory findings, the role of lncRNA PVT1, miR-29a, and miR-29b in liver diseases remains unknown, and further research is required to identify their diagnostic and prognostic value as biomarkers for liver cirrhosis.
A recently discovered regulatory network shows that long non-coding RNAs (lncRNAs) and messenger RNAs (mRNAs) engage in cross-talk by competing for shared miRNA response elements. 46 Additionally, Alshahrani et al. 47 stated that lncRNAs function as competing endogenous RNAs (ceRNAs) to sequester miRNAs, thus regulating the distribution of miRNA molecules on their targets post-transcriptionally. Our research has confirmed that the reduced levels of miR-29a and miR-29b are a direct result of sponging and negative regulation by lncRNA-PVT1. We have also established a strong correlation between the expression of lncRNA PVT1 and miR-29a/29b in cirrhotic patients. These findings imply that changes in the expression of lncRNA PVT1 may significantly impact the expression of miR-29a/29b, emphasizing the potential clinical significance of lncRNA PVT1 regulation.
In conclusion, lncRNA PVT1 contributes to the etiology of liver cirrhosis by dual regulation of the miR-29a/b-IL-6/TNF-α/IGF-1/TGF-β axis. Undoubtedly, the current study has some shortcomings in the experimental design. Firstly, patients with liver cirrhosis who were included in the study were limited in terms of sample size. Second, the study design was retrospective. Further studies are necessary to establish the underlying etiology of liver cirrhosis with greater certainty.
Footnotes
Author Contributions
Conceptualization: N.A.H and S.N.A; Methodology: N.A.H.; S.E.K., A.K.K., S.N.A Investigation: S. A.K.K., S.A.D., E.Y., and N.A.H.; Data curation: N.A.H.; E.Y., and S.A.D.; Formal analysis: N.A.H., S.E.K., and A.K.K.; Resources: S.N.A., E.Y., S.A.D., and NA.H. ; Validation: N.A.H. , A.K.K., and S.N.A.; Supervision: N.A.H, and S.N.A.; Writing-Original draft: N.A.H, E.Y., and S.A.D.; Writing-review and editing: N.A.H
Declaration of conflicting interests
The author(s) declared no potential conflicts of interest with respect to the research, authorship, and/or publication of this article.
Funding
The author(s) received no financial support for the research, authorship, and/or publication of this article.