
Abstract
Adipose tissue is the main organ that stores lipids and it plays important roles in metabolic balance in the body. We recently reported in Human and Experimental Toxicology that the combined exposure to BPA and fructose may interfere with energy metabolism of adipose tissue. However, it is still unclear whether the combined exposure to BPA and fructose has the possibility to induce lipid remodeling in adipose tissue. In the present study, we performed a widely targeted quantitative lipidomic analysis of the adipose tissue of rats after 6 months of BPA and fructose combined exposure. We totally determined 734 lipid molecules in the adipose tissue of rats. Principal component analysis (PCA) showed the group of the combined exposure to higher-dose (25 μg/kg every other day) BPA and fructose can be distinguished from the groups of control, higher-dose BPA exposure and fructose exposure clearly. Partial least squares-discriminant analysis (PLS-DA) and univariate statistical analysis displayed lipids of PC(18:0_ 20:3), TG(8:0_14:0_16:0), TG(12:0_14:0_16:1), TG(10:0_16:0_16:1), TG(12:0_ 14:0_18:1), TG(14:0_ 16:0_16:1), TG(14:0_14:1_16:1), TG(8:0_ 16:1_16:2), TG(14:1_16:1_ 16:1), TG(16:1_18:1_18:1), TG(16:0_16:1_20:4) and TG(15:0_18:1_ 24:1) may contributed the most to the discrimination. These findings indicated that combined exposure to BPA and fructose has the potential to cause lipid remodeling in adipose tissue.
Introduction
Bisphenol A (BPA), also known as 2,2-bis(4-hydroxyphenyl)propane, is a common industrial chemical with quite high levels of production. It is often used in food and beverage packaging, medical equipment, electronics, flame retardants, adhesives, building materials, automobiles, and paper coatings. 1 Currently, BPA can be detected in the vast majority of the general population,2,3 prompting public concern about the safety of BPA exposure. As a typical environmental endocrine disruptor, the potential effects of BPA have been extensively evaluated in multiple organs and biological systems, including its capacity for disrupting reproduction and development as observed in rodents, 4 augmenting carcinogenesis, 5 and increasing the risk of vascular atherosclerosis. 6 However, most studies mainly focus on the health effects of BPA exposure alone, while there are relatively few studies on the combined effects of BPA and other risk factors, such as fructose, another health hazard that is being consumed in large quantities by the population.
High fructose corn syrup (HFCS) has been widely used as one of the most popular sweeteners in soft drinks, cakes, and packaged foods since the 1970s because of its low production cost and long shelf life. In sugary beverages containing HFCS, fructose accounts for 60.6% ± 2.7% of the total sugar content. 7 Therefore, many people consume large amounts of fructose, and it is believed that excessive consumption of fructose may be one of the important risk factors for obesity and cancer. 8 However, similar to BPA, most studies have focused on the single-factor effect of fructose, while there are few studies on the combination of fructose and other risk factors.
Studies have shown that the average concentration of BPA in sugary beverages was 1.0 ng/mL and that in canned foods it was 40.3 ng/g. 9 This means that people can be exposed to BPA and fructose simultaneously. An appropriate amount of fructose is believed to be harmless to human health; however, several studies in recent years have demonstrated the combined toxicity of a low dose of BPA and a daily dose of fructose on the liver,10,11 heart 12 and sperm. 13
Adipose tissue exerts vital functions that critically maintain energy balance by storing and expending energy, as well as secreting adipocytokines that systemically modulate glycolipid metabolism.14,15 Lipids are the major constituents of adipose tissue, and the composition of lipids in adipose tissue is a good marker of the metabolic state. Lipids such as fatty acids in adipose tissue may be used as good biomarkers for atherosclerosis and ischemic stroke.16,17 However, it is not clear whether a combination of BPA and fructose damages the lipid composition of adipose tissue. In this context, we proposed that BPA and fructose might interact with the lipid composition in white adipose tissue. We evaluated the lipidomics changes after long-term combined exposure to BPA and fructose in the present study. A widely targeted approach of UPLC-QqQMS-based lipidomics was conducted to obtain the lipid profile of white adipose tissue. To our knowledge, this work is the first report of an interference effect on lipid composition of white adipose tissue caused by the combined exposure to BPA and fructose.
Materials and methods
Materials and equipment
Bisphenol A, formic acid and fructose (purity ≥99%) were purchased from Sigma-Aldrich, USA. Methanol and acetonitrile (HPLC grade) were purchased from Merck, China. Ultra Performance Liquid Chromatography (UPLC, CBM30 A) was purchased from Shimadzu, Japan. Tandem mass spectrometry (MS/MS, Applied Biosystems 6500 QTRAP) was purchased from SCIEX, USA. C30 column (2.6 μm, 2.1 mm*100 mm) was purchased from Thermo, USA. Lipid standard products were purchased from Sigma-Aldrich, USA. The solution of standard products is dissolved in methanol and diluted to different gradient concentration using 70% methanol before UPLC-MS/MS detection.
Animals and sample collection
Thirty-six three-week-old male SD rats [Purchased from Hunan SJA Laboratory Animal Co.; Ltd, Changsha, China; License: SYXK(Hunan)-2019-0014] were maintained in temperature- and light-controlled (14 h/10 h light/dark cycle) conditions at the Laboratory Animal Center of School of department of zoology, University of South China, a facility approved by the association for assessment and accreditation of laboratory animal care [License: SYXK(Hunan)-2020-0002]. Animals had free access to food and water. The animals were acclimated to the laboratory for 1 week prior to the start of the experiments and were randomized into vehicle control group, lower-dose group and higher-dose group (n = 6 rats/group). Fresh BPA dosing solutions for rats were prepared in corn oil. The animals in vehicle control, lower-dose, and higher-dose of BPA exposure groups were given gavage administration of 0.1 mL of corn oil containing 0, 0.25, 25 μg/kg BPA18,19 every other day for 6 months. The drinking water of animals in fructose control group was replaced with 5% fructose water 10 for 6 months (The dissolution ratio is: 5g fructose in 100 mL water, freshly prepared every day); animals of fructose and lower-dose of BPA combined exposure group were given gavage administration of 0.1 mL of corn oil containing 0.25 μg/kg BPA every other day, and the drinking water was replaced with 5% fructose water for 6 months; animals of fructose and higher-dose of BPA combined exposure group were given gavage administration of 0.1 mL of corn oil containing 25 μg/kg BPA every other day, and the drinking water was replaced with 5% fructose water for 6 months.
Using this gavage method, none of the rats died, and no injuries in the stomach, esophagus, or trachea were found. Before adipose tissue samples were collected, all animals were fasted for more than 12 h.
All animal experiments were carried out in accordance with the U.K. Animals (Scientific Procedures) Act 1986 and associated guidelines, EU Directive 2010/63/EU for animal experiments or the National Research Council’s Guide for the Care and Use of Laboratory Animals. Furthermore, the reporting of animal testing experiments complied with the ARRIVE guidelines. All procedures performed in this study were in accordance with the ethical standards of the Ethics Committees of Affiliated Nanhua Hospital, University of South China (NO. 2021-ky-173).
Lipids extraction
After anesthesia was administered, rats were sacrificed and the retrorenal fat pads of six rats of every group were separated and the blood vessels were removed under microscope. Fat samples from each group were cut into small pieces and mixed evenly, and then grinded into powder in pulverizer after a few minutes of liquid nitrogen freezing. For lipidomics analysis, 1 mL methanol: MTBE (one-third, v/v) and 20 μL lipid internal standard mixture were added into about 50 mg visceral adipose tissue freeze-drying powder; then vortexed for 1 h, ultrasounded for 5 min, and added in 500 μL water, and centrifuged at the speed of 12,000 r/min for 10 min at 4°C; the supernatant was then concentrated to powder, and the powder was resuspended in 100 μL mixed solution of isopropanol: acetonitrile (1:1) before UPLC-MS/MS detection. 20 Three pooled fat samples of each group were tested in present study.
UPLC-MS detection
Mobile phase: mobile phase A, acetonitrile/water (60/40, v/v) (containing 0.1% formic acid and 10 mmol/L ammonium formate); mobile phase B, acetonitrile/isopropanol (10/90, v/v) (containing 0.1% formic acid and 10 mmol/L ammonium formate); and the flow rate was 0.35 mL·min−1. The gradient conditions of the mobile phase were as follows: 0 min for A/B 80:20 (v/v), 2 min for 70:30 (v/v), 4 min for 40:60 (v/v), 9 min for 15:85 (v/v), 14 min for 10:90 (v/v), 15.5 min for 5:95 (v/v), 17.3 min for 5:95 (v/v), 17.5 min for 80:20 (v/v), and 20 min for 80:20 (v/v). The temperatures of the column and autosampler were maintained at 45°C and 4°C, respectively. The injection volume is 2 μL. Triple quadrupole scans were acquired on a triple quadrupole-linear ion trap mass spectrometer, equipped with an ESI Turbo Ion-Spray interface, operating in a positive or negative ion mode. The ESI source operation parameters were as follows: source temperature 500°C; Mass spectrum voltage 5500 V (−4500V for negative ion mode). The scanning detection of ion pairs were depended on the optimized declustering potential and collision energy. The chromatographic peaks were corrected manually to ensure the accuracy of quantitative determination according to the information of retention time and peak shape.
Statistical analysis
Mann-Whitney U Tests were performed using SPSS software (Version: 21, IBM, USA) to evaluate differences in the contents of lipids between groups generated from raw mass spectrum data. Principal component analysis (PCA) and partial least squares-discriminant analysis (PLS-DA) were performed using SIMCA 13.0 software (Umetrics, Sweden) to analyze the information of lipids in different group. The significance level was variable importance in projection (VIP, generated from PLS-DA model) > 1 and p (generated from Mann-Whitney U Test) ≤ 0.05.
Results
The high stability of the instrument provides an important guarantee for the repeatability and reliability of the lipomics data. In the present study, we used a mixed solution of the testing sample as the QC (Quality Control) samples. By overlapping the total ion flow chromatogram (TIC) and the correlation analysis of the same QC sample, good stability of the UPLC-QqQMS can be acquired during sample detection (Supplementary Figure 1).
In the present study, we quantitatively analyzed 34 classes of 734 lipid molecules, including TG, DG, PE, PC, PE-O, FFA, LPC, Cer, PE-P, CAR, SM, LPE, PS, PC-O, PI, HexCer, PG, LNAPE, LPS, LPC-O, LPI, LPG, SPH, Eicosanoid, LPE-P, Cert, DG-O, PA, MG, BA, CoQ, LPA, Cholesterol, and PMeOH in white adipose tissue. Supplementary table 1 displayed lipid name, class, length, degree of unsaturation, Q1 mass (Da), molecular weight, ionization model and formula of the 734 lipid molecules.
BPA and fructose combined exposure changes the composition of common membrane lipids and storage lipids
As shown in Figure 1(b), triglyceride (TG, 83.17%) was the most abundant lipid, followed by diglyceride (DG, 13.63%) among all lipid molecules. With approximately 56.78%, phosphatidylcholine (PC) was the dominant lipid class of common membrane lipids, followed by phosphatidylserine (PS) with approximately 18.76%, phosphatidylethanolamine (PE) with approximately 7.36%, and phosphatidylinositol (PI) with approximately 4.88% (Figure 1(b) and (c)). Combined exposure to BPA and fructose reduced PC and lysophosphatidylcholine (LPC) while increased PE-P and hexosylceramide (HexCer, Figure 1(a)). Lipid class composition of white adipose tissue after combined exposure of BPA and fructose for 6 months. (a) Common membrane lipids; (b) Proportion of TGs, DGs and other lipids; (c) Proportion of lipids other than TGs and DGs; Annotation of “a'', p ≤ .05 versus vehicle control group; annotation of “b'', p ≤ .05 versus fructose control group; annotation of “c'', p ≤ .05 versus lower-dose of BPA exposure group; annotation of “d'', p ≤ .05 versus higher-dose of BPA exposure group; annotation of “e'', p ≤ .05 versus fructose and lower-dose of BPA combined exposure group; significant difference was tested using rank-sum test (Mann-Whitney U Test).
BPA or fructose exposure alone, and the combined exposure to higher-dose BPA and fructose changed the lipids in adipose tissue significantly
As shown in Figure 2(a), the control group, lower-dose BPA and higher-dose BPA exposure group can be clearly distinguished in PCA score plots. In Figure 2(b), the fructose exposure group was significantly different from the control group. In Figure 2(d), the group of combined exposure to higher-dose BPA and fructose can be distinguished from the control group, higher-dose BPA exposure group and the fructose exposure group clearly. However, the group of combined exposure to lower-dose BPA and fructose can not be distinguished from the fructose alone exposure group clearly (Figure 2(c)). In order to identify the lipid molecules that contribute the most to differentiation, we further applied the PLS-DA model to analyze the data of 734 lipid molecules. As shown in Figure 3, the PLS-DA plots for different doses of BPA exposure (Figure 3(a)), fructose alone exposure (Figure 3(c)), lower-dose BPA and fructose combined exposure (Figure 3(e)) and higher-dose BPA and fructose combined exposure (Figure 3(g)) displayed clear distinction among corresponding groups. However, the permutation tests showed the PLS-DA model for lower-dose BPA and fructose combined exposure might be invalid because not all the blue Q2-values to the left were lower than the original points to the right (Figure 3(f)). Scores plot generated from PCA. (a) BPA exposure alone; (b) fructose exposure alone; (c) the combine exposure to lower-dose BPA and fructose; (d) the combine exposure to higher-dose BPA and fructose. Scores plot generated from PLS-DA. (a) BPA exposure alone; (b) 20 permutation test for the PLS-DA model of the comparison among the groups of BPA exposure alone; (c) fructose exposure alone; (d) 20 permutation test for the PLS-DA model of the comparison among the group of fructose exposure alone; (e) the combine exposure to lower-dose BPA and fructose; (f) 20 permutation test for the PLS-DA model of the comparison among the group of the combine exposure to lower-dose BPA and fructose; (g) the combine exposure to higher-dose BPA and fructose; (H) 20 permutation test for the PLS-DA model of the comparison among the group of the combine exposure to higher-dose BPA and fructose.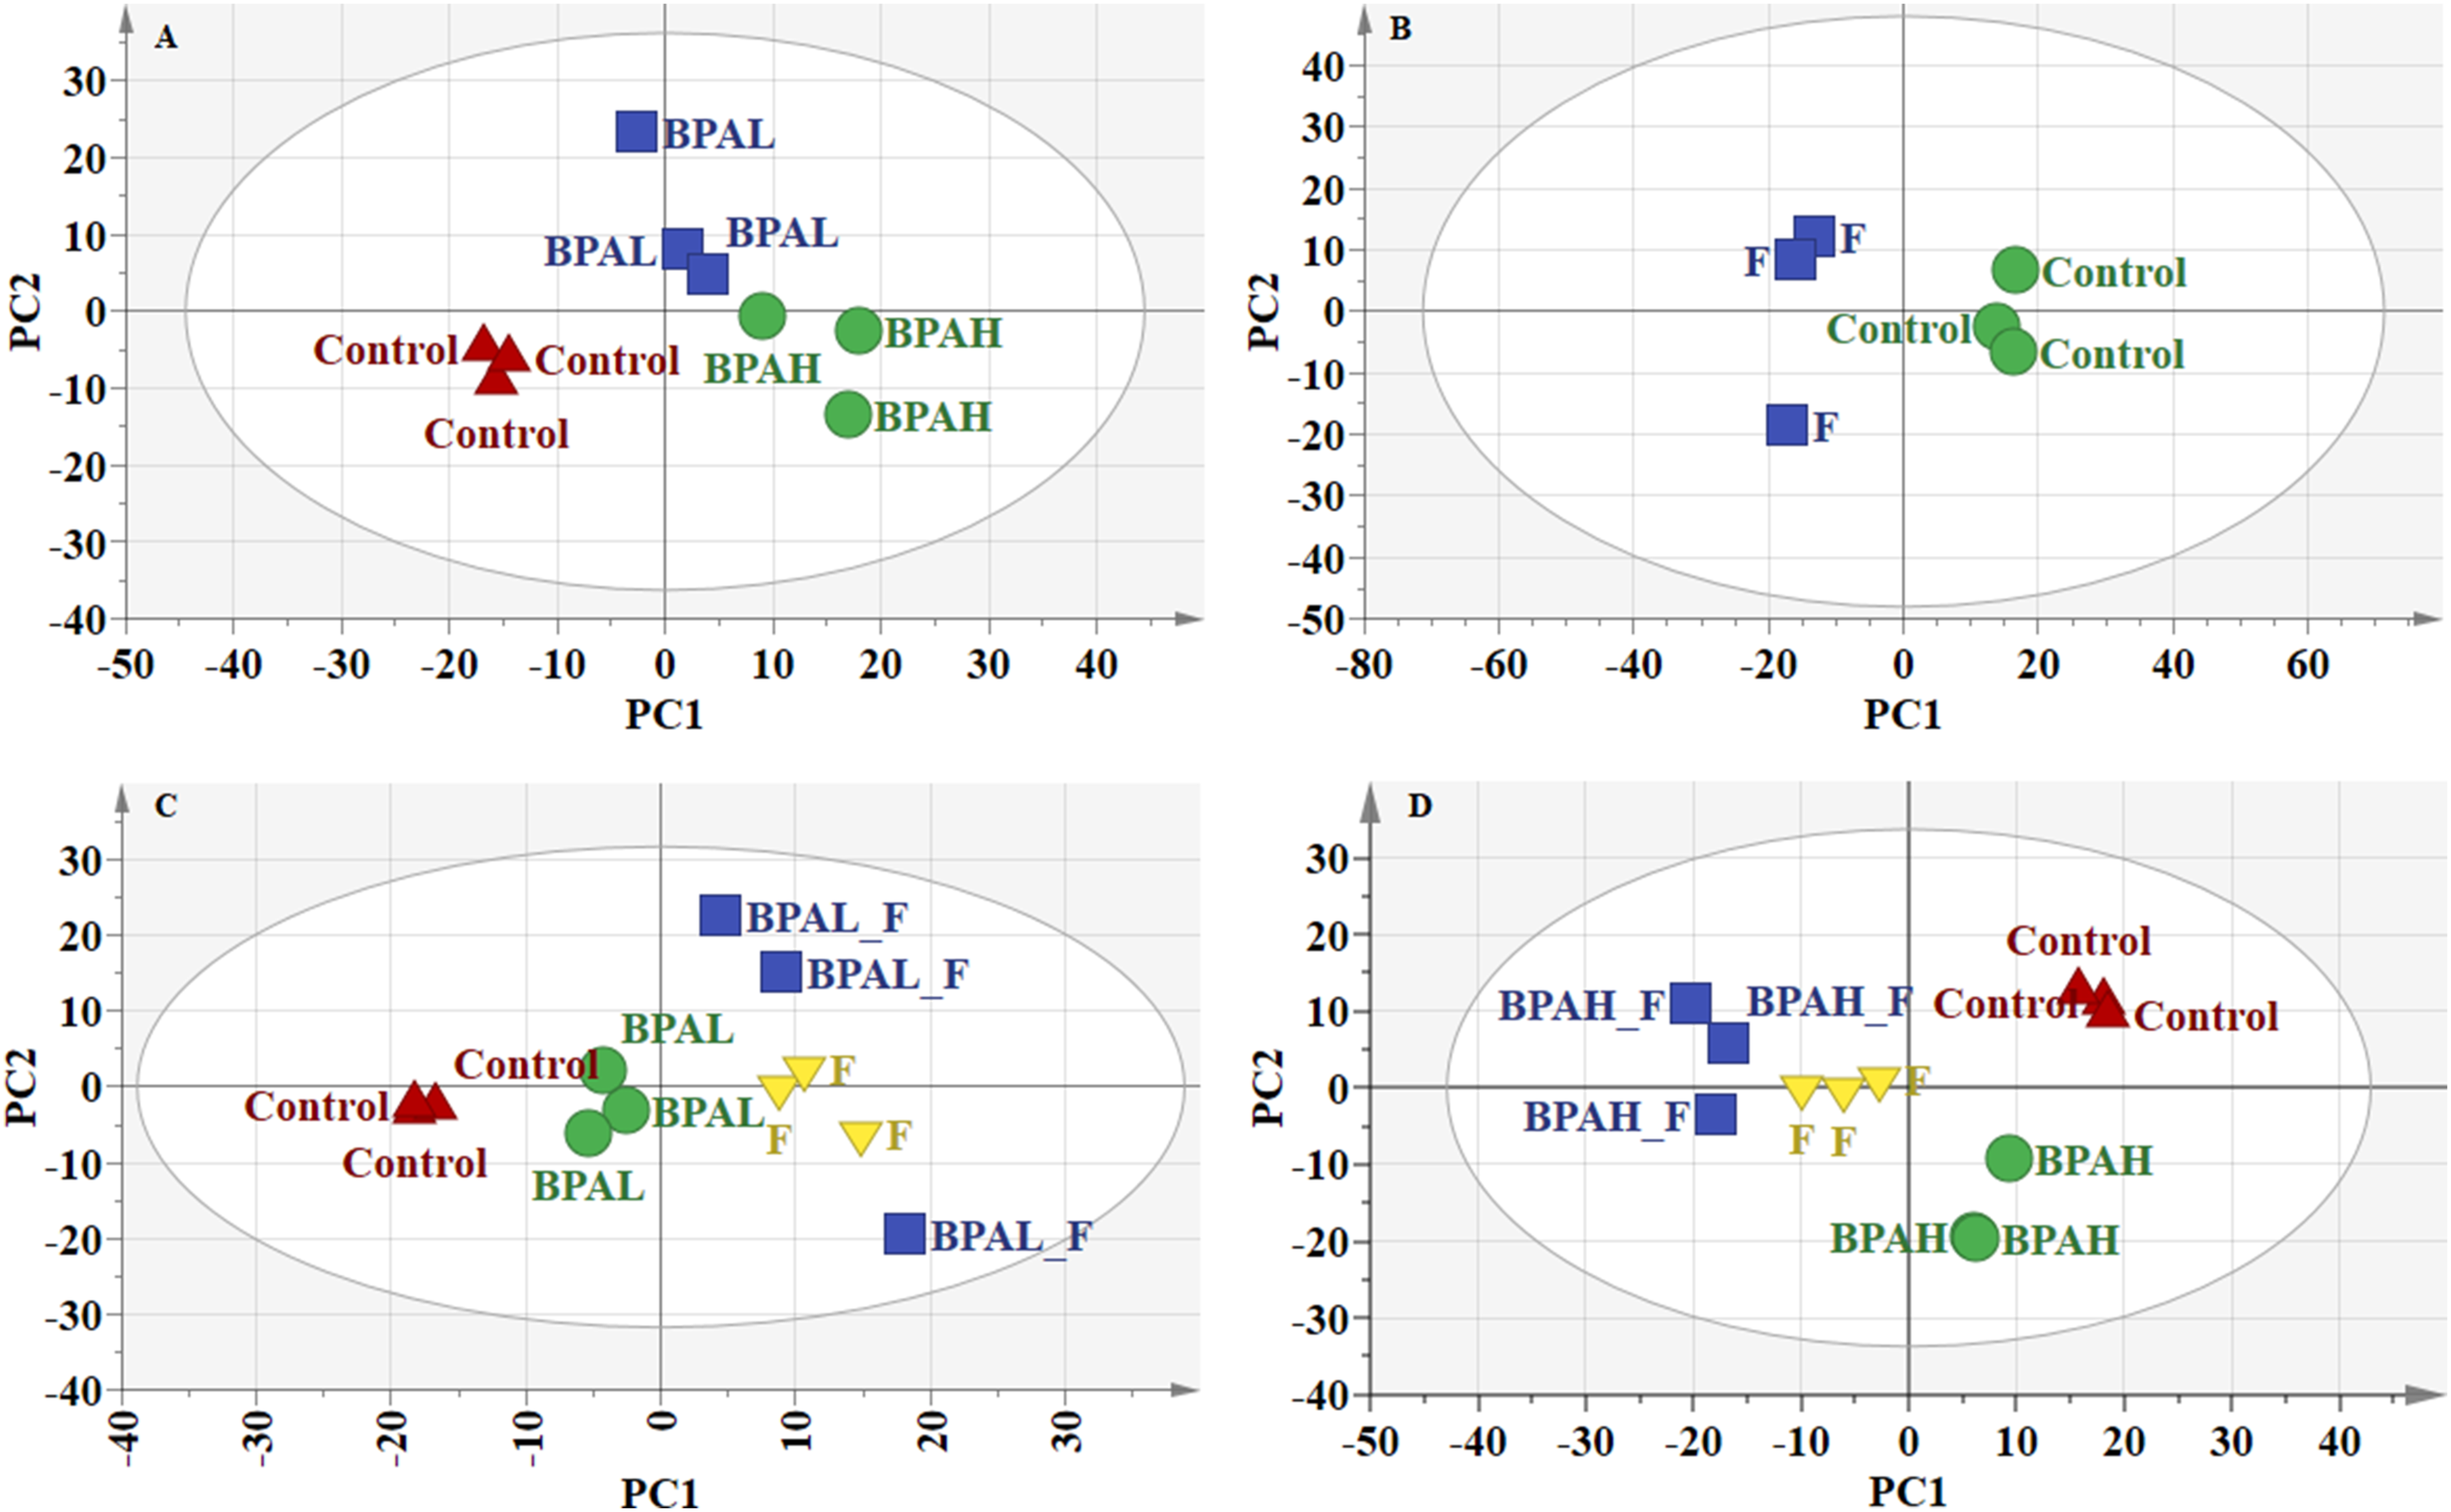

BPA exposure leads to dose-dependent changes in five lipid molecules
As shown in Figures 4 and 5 lipid molecules with VIP >1 from PLS-DA model (Figure 3(a) and (b)) and p ≤ .05 from Mann-Whitney U Test in adipose tissue including CainitineC3:0, PC(19:0_20:4), PE(18:1_18:0), TG(14:0_14:1_18:1) and TG(14:1_16:0_16:1) changed in a dose-dependent manner after BPA exposure. Among them, cainitineC3:0 showed a dose-dependent increase, while PC (19:0_20:4), PE (18:1_18:0), TG (14:0_14:1_18:1), and TG (14:1_16:0_16:1) showed a dose-dependent decrease. Typically changed lipids in adipose tissue after BPA exposure alone. Annotation of “a'', p ≤ .05 versus vehicle control group; annotation of “b'', p ≤ .05 versus with lower-dose BPA exposure group; significant difference was tested using Mann-Whitney U Test. Changes in the content of TGs with different length of fatty acyl chains after BPA and fructose exposure. Annotation of “a'', p ≤ .05 versus vehicle control group; annotation of “b'', p ≤ .05 versus fructose control group; annotation of “c'', p ≤ .05 versus lower-dose of BPA exposure group; annotation of “d'', p ≤ .05 versus higher-dose of BPA exposure group; annotation of “e'', p ≤ .05 versus fructose and lower-dose of BPA combined exposure group; significant difference was tested using Mann-Whitney U Test.

Exposure to fructose alone induced over 2-fold changes in 39 lipid molecules
Lipids with significant changes in adipose tissue caused by long-term of fructose exposure.

adata was presented in the form of “Mean ± SD”.
bgenerated from Mann-Whitney U Test.
cgenerated from PLS model.
dthe ratio of mean values of two groups.
BPA and fructose caused adipose tissue triglyceride molecules remodeling
Figure 5 displayed changes in the content of TGs with different length of fatty acyl chains after BPA and fructose exposure. The alone exposure to fructose caused the content of TGs with total carbon atoms number of 38, 40, 41, 42, 43, 44, 45, and 46 in the fatty acyl chains decreased significantly, while the content of TGs with total carbon atoms number of 53, 55, 56, 57, 58, 60 and 62 in the fatty acyl chains increased significantly (Figure 5). Lower-dose BPA exposure alone caused the content of TGs with 40 carbon atoms in the fatty acyl chains decreased significantly while the content of TGs with total carbon atoms number of 56 and 58 in the fatty acyl chains increased significantly. Higher-dose BPA exposure alone caused the content of TGs with total carbon atoms number of 38, 40, 42, 43 and 44 in the fatty acyl chains decreased significantly while the content of TGs with total carbon atoms number of 56, 57, 58 and 60 in the fatty acyl chains increased significantly (Figure 5). However, no significant dose-response relationship was found in the different doses of BPA exposure.
As shown in Figure 5, the content of TGs with total carbon atoms number of 38, 40, and 46 in the fatty acyl chains decreased significantly, while the content of TGs with a total number of 60 carbon atoms in the fatty acyl chains increased significantly after the combined exposure to higher-dose BPA and fructose compared with the control group, the fructose alone exposure group, the higher-dose BPA alone exposure group and the lower-dose BPA and fructose combined exposure group.
Lipid biomarkers for the combined exposure to higher-dose BPA and fructose
As shown in Figure 6, 12 lipid molecules including PC(18:0_20:3), TG(8:0_14:0_ 16:0), TG(12:0_14:0_16:1), TG(10:0_16:0_16:1), TG(12:0_14:0_18:1), TG(14:0_ 16:0_16:1), TG(14:0_14:1_16:1), TG(15:0_18:1_24:1), TG(8:0_16:1_16:2), TG(14:1_16:1_16:1), TG(16:1_18:1_18:1) and TG(16:0_16:1_20:4) significantly changed (VIP >1 and p ≤ .05) after the combined exposure to higher-dose BPA and fructose. Among them, TG(15:0_18:1_24:1), a triglyceride molecule containing very long fatty acyl chains (more than 22 carbon atoms), significantly increased after the combined exposure to higher-dose BPA and fructose; while other TGs with medium and long fatty acyl chains have significantly decreased after the combined exposure to higher-dose BPA and fructose. Typically changed lipids in adipose tissue after higher-dose BPA and fructose combined exposure. Annotation of “a'', p ≤ .05 versus vehicle control group; annotation of “b'', p ≤ .05 versus higher-dose BPA exposure group; annotation of “c'', p ≤ .05 versus fructose alone exposure group; significant difference was tested using Mann-Whitney U Test.
Discussion
Humans consume more fructose now than ever before in recorded history, which is related to the rising incidence of obesity and cancer. 8 The pathogenesis of obesity is very complex and is worth exploring in depth. A single risk factor is not enough to explain their high incidence. 21 Combined exposure to BPA and fructose is a very common phenomenon in the general population, and there is concern whether combined exposure to BPA and fructose exerts synergistic effects on health. Previously, Monika and colleagues found that BPA in combination with fructose induced fat infiltration in the liver using whole-body imaging. 10 Subsequently, Ren and colleagues reported that combined exposure to fructose and BPA increased lipogenesis and decreased lipolysis in the liver, accompanied by dyslipidaemia, insulin resistance and hepatic fat accumulation. 11 The liver is the main source of lipid synthesis, and adipose tissue is the largest organ for lipid storage. Since combined exposure affects lipid synthesis in the liver, how does combined exposure affect lipid storage in adipose tissue?
In the present study, we applied 5% fructose (w/v) to simulate common fructose exposure level (the common soft drinks contain 9%–13% sucrose, therefore, the content of fructose is about 5% in common soft drinks). 10 The retrorenal fat pad is one of the most abundant white adipose tissues in the body. We recently reported that the combined exposure to BPA and fructose did not affect the animal body weight, blood glucose level and insulin level of rats, but might interfere with the energy metabolism of adipose tissue from the retrorenal fat pad of rat. 18 The lipidome profile of adipose tissue is shaped by different physiological and environmental factors, and these changes impact the way adipocytes regulate whole-body energy metabolism. 14 However, there are few studies about the combined effect on lipid composition caused by BPA and fructose exposure in adipose tissue. The aim of the present study was to determine whether combined exposure to BPA and fructose can remodel the lipidomic profile of white adipose tissue.
In adipocytes, α-phosphoglycerol is converted into dicarbonyl phosphoglycerol (phosphatidyl acid, PLA) by added with two molecules of fatty acyl-CoA. The catalytic enzyme involved in this process is transacylase. Then, under the action of phosphatidyl phosphatase, the phosphate molecule is removed and 1,2-diglyceride (DG) is produced. Finally, under the action of transacylase, one molecule of fatty acyl chain is added to DG and TG is formed. The fatty acyl of TG molecule mainly comes from FFAs, which can be prolonged by the condensation with acetyl CoA in mitochondria and microsome. In the present study, we found fructose alone exposure, lower-dose BPA exposure, and higher-dose BPA exposure may cause the content of TGs with shorter fatty acyl chains (total number of carbon atoms ≤46) decreased significantly, while the content of TGs with longer fatty acyl chains (total number of carbon atoms ≥53) increased significantly. The combined exposure to higher-dose BPA and fructose could aggravate the effect on the decrease in TGs with 38, 40, and 46 carbon atoms in the fatty acyl chains and the increase in TGs with 60 carbon atoms in the fatty acyl chains. Previous studies have reported that C16 fatty acyl chains may be replaced by C18 fatty acyl chains in adipose tissue depots from high-fat diet-induced obese mice. 22 We speculated that fructose or BPA could promote the conversion of shorter fatty acyl into longer fatty acyl for increasing the storage of TGs with longer fatty acyl chains in adipose tissue, and the combined exposure to higher-dose BPA and fructose exacerbated this effect.
In adipose tissue, FFAs mainly come from the lipolysis of TGs. It has been reported that adipose tissue-derived FFAs can initiate myeloid cell accumulation, which is a major component of the metainflammation of obesity. 23 FFAs have been considered as the main bridge between obesity, metabolic syndrome, and atherosclerotic vascular disease.24,25 The decrease in TGs with shorter fatty acyl chains also means the release of shorter chain FFAs (C14-C20) increased from adipose tissue. The increase of TGs with longer fatty acyl chains may be related to local re-esterification in adipocyte after extension of short chain fatty acids. 26 However, further in-depth research is needed.
Long term exposure to 5% fructose caused significant lipid remodeling in adipose tissue, with significant decrease in lipids such as PC, PC-O, LPC, LPS, TG, LPA, LPE, DG, PI and Cer which contains fatty acyl chain of 8:0, 10:0, 12:0, 14:0, 14:1, 16:0, 16:1, 16:2, 18:0, 18:1, 18:2, 18:3, 20:0, 20:2, 20:3, 20:4, 21:0, 22:3, 22:4 or 22:6. Fatty acids with 8, 10 and 12 carbon atoms are described as medium chain fatty acids; fatty acids with 14, 16, 18, 20, 21 carbon atoms are described as long chain fatty acids; fatty acids with more than 22 carbon atoms are described as very long chain fatty acids. 27 In the present study, fructose may promote the release of medium and long-chain fatty acids from adipose tissue. Previous study has confirmed that medium-chain triglyceride reinforced the hepatic damage caused by fructose intake in mice. 28 Further research should be carried out on the relationship between the remodeling of lipids containing medium and long-chain fatty acyl caused by fructose exposure and major human diseases of metabolism such as obesity and diabetes.
The reference doses for BPA of the current U.S. Environmental Protection Agency and European Food Safety Authority are 50 μg/kg/day and 4 μg/kg/day, respectively. 1 In the present study, we evaluated the following exposure doses in the tolerable daily intake (TDI) range: 0.25 μg/kg/every other day, a dose 32 times lower than the preliminary European Food Safety Authority (EFSA) TDI, and a higher dose (25 μg/kg/every other day), which was 4 times lower than the reference dose (RfD) of 50 μg/kg/day corresponding to the U.S. Food and Drug Administration (FDA) (2008). In 2016, the European Commission mandated EFSA to re-evaluate the risks of BPA in foodstuffs to public health. 29 A reference point (RP) of 8.2 ng/kg BPA per day was identified for the critical effect on Th17 cells in mice. The EFSA Panel on Food Contact Materials, Enzymes and Processing Aids (CEP) applied an overall uncertainty factor of 50 to the RP, and a TDI of 0.2 ng BPA/kg per day was established. 29
Lipids such as PC, PE and TGs with the carbon atom number between 14 and 20 in the fatty acyl chain had a trend of dose-dependent decrease after long term BPA exposure. Ke and colleagues found that the expression levels of key enzymes of lipolysis, adipose triglyceride lipase (Atgl) and hormone-sensitive lipase (Hsl), were increased in visceral adipose tissue from BPA-exposed rats after fasting. 30 Lipid-containing PEs in adipose tissue are biomarkers related to insulin resistance. 31 Based on the results of the present study, BPA significantly interfered with lipid metabolism at a level 625-62,500 times higher than the new EFSA TDI.
Interestingly, both BPA and fructose lead to a significant increase in carnitine in adipose tissue. Fructose caused carnitineC4-OH (hydroxybutyrylcarnitine), carnitineC3:1-2OH (malonylcarnitine) and carnitineC14:1 (tetradecenoylcarnitine) increased by more than 2 times. Increase of tetradecenoylcarnitine means incomplete beta-oxidation of a trans-fatty acid such as elaidic acid. 32 Hydroxybutyrylcarnitine is metabolized by beta-ketothiolase, and the increase of hydroxybutyrylcarnitine means fructose may lead to a inhibition of beta-ketothiolase in adipose tissue, which may affect isoleucine catabolism and ketone body metabolism. 33 The accumulation of malonylcarnitine means the specific disruption of fatty acid oxidation caused by the entry of long chain acylcarnitines into mitochondria, as well as mitochondrial malonyl-CoA decarboxylase suppression. 34 We found earlier that exposure to BPA resulted in a dose-dependent increase in carnitineC3:0 (propionylcarnitine) in adipose tissue. Propionylcarnitine exhibits a high affinity for the enzyme carnitine acetyl transferase (CAT) which can convert propionylcarnitine into propionyl CoA and free carnitine. 35 The elevation of popionylcarnitine induced by BPA exposure may be related to the inhibition of CAT. 36 Since the beta-oxidation of fatty acid in adipose tissue was damaged by fructose and BPA, there are generally two possibilities for the fate of fatty acids in adipose tissue: firstly, they are released into the circulation in the form of free fatty acids and then obtained by other tissues or organs such as the liver, thereby increasing the risk of fat accumulation in other tissues or organs; secondly, they become more stable fatty acids with longer chains and are re-esterified into TGs, which continue to be accumulated in adipose tissue, thereby promoting the differentiation of adipocytes.
Both higher-dose BPA and fructose could reduce content of 10 fat molecules such as TG(8:0_14:0_ 16:0), TG(12:0_14:0_16:1), TG(10:0_16:0_16:1), TG(12:0_14:0_ 18:1), TG(14:0_ 16:0_16:1), TG(14:0_14:1_16:1), TG(8:0_16:1_16:2), TG(14:1_ 16:1_16:1), TG(16:1_18:1_18:1) and TG(16:0_16:1_20:4). And the combined exposure to higher-dose BPA and fructose made this decreasing trend more severe. Interestingly, the fatty acyl chains with 14 carbon atoms have seven occurrences, and the fatty acyl chains with 16 carbon atoms have 14 occurrences among these fat molecules. These findings indicated BPA and fructose may have higher probability to reduce TGs containing fatty acyl chains of 14 or 16 carbon atoms. And TG(15:0_18:1_24:1), a fat molecule has simultaneously one fatty acyl chain with odd number of carbon atoms and another fatty acyl chain with more than 22 carbon atoms, may be served as a biomarker for adipocyte differentiation induce by the combined exposure to BPA and fructose.
The consumption of fructose has increased rapidly since the introduction of high fructose corn syrup (HFCS) in 1967. 37 The average fructose intake continuously increased from 37 g/day to 49 g/day between 1977 and 2004 in United States. 38 The average per capita sugar consumption progressively increased from 56 g/day to 65 g/day in the 1986–2007 period according to the International Sugar Organization reports. 39 Within the Dutch National Food Consumption Survey 2007–2010, median fructose intake was 46 g/day in the Dutch population aged 7–69 years. 40 In China, the average dietary fructose intake of Chinese residents aged 45 and above was 8.29 g/d. 41 The health issues such as obesity, dyslipidemia, hypertension and cardio-metabolic syndrome caused by fructose exposure have been widely concerned.42–44 We recently reported that fructose exposure may induce disorders in amino acid metabolism. 45 Human body is mainly exposed to both BPA and fructose through plastic bottled beverages containing HFCS or sucrose. Due to the universality of exposure to BPA and fructose, studying the synergistic effect of BPA and fructose is of great significance. The hypothesis that BPA can exacerbate the health damage caused by fructose may bring new research propositions in the future.
Concluding remarks
We performed a widely targeted quantitative lipidomic analysis of the adipose tissue of SD rats after 6 months of BPA and fructose combined exposure. The results obtained enabled changes in the lipid profile related to the combined exposure of BPA and fructose in adipose tissue to be identified and typical lipid biomarkers of BPA and fructose to be assessed, thus displaying a detailed signature of lipid metabolism in adipose tissue induced by long-term exposure to BPA combined with fructose. Lipid biomarkers in adipose tissue, such as PC(18:0_20:3), TG(8:0_14:0_ 16:0), TG(12:0_14:0_16:1), TG(10:0_16:0_16:1), TG(12:0_14:0_18:1), TG(14:0_ 16:0_16:1), TG(14:0_14:1_16:1), TG(15:0_18:1_24:1), TG(8:0_16:1_16:2), TG(14:1_16:1_16:1), TG(16:1_18:1_18:1) and TG(16:0_16:1_20:4), were observed to be significantly associated with the combined exposure to higher-dose BPA and fructose. Herein, we illustrated that the combined exposure to higher-dose BPA and fructose may have higher probability to reduce TGs containing fatty acyl chains of 14 or 16 carbon atoms, providing sufficient potential capacity to generate novel hypotheses of the mechanisms of lipid remodeling induced by combined exposure to BPA and fructose.
Supplemental Material
Supplemental Material - Widely targeted quantitative lipidomics reveal lipid remodeling in adipose tissue after long term of the combined exposure to bisphenol A and fructose
Supplemental Material for Widely targeted quantitative lipidomics reveal lipid remodeling in adipose tissue after long term of the combined exposure to BPA and fructose by Yonghong Tang, Guifang Ou, Ouyan Rang, Xu Liu, Xiaocheng Liu, Xinru Qin, Guojuan Li, Qing Yang and Mu Wang in Human & Experimental Toxicology
Footnotes
Appendix
Author contributions
Mu Wang, Yonghong Tang and Qing Yang designed the experimental plan. Mu Wang performed the experiments, analyzed the data, and wrote the manuscript. Yonghong Tang participated in data analysis. Guifang Ou, Ouyan Rang, Xu Liu, Xiaocheng Liu, Xinru Qin, Guojuan Li performed the experiments. Yonghong Tang and Qing Yang reviewed and edited the manuscript. All authors reviewed and approved the final manuscript.
Declaration of conflicting interests
The author(s) declared no potential conflicts of interest with respect to the research, authorship, and/or publication of this article.
Funding
The author(s) disclosed receipt of the following financial support for the research, authorship, and/or publication of this article: This work was supported by the Key Project of Hunan provincial science and technology innovation (No. 2020sk1012); Natural Science Foundation of Hunan Province (No. 2022JJ30547); the excellent youthful project Scientific research of Hunan Provincial Department of Education: (No. 20B491); "4310" cultivation program of clinical medicine research of Hengyang Medical School, University of South China [HengYiFa (2021) No. 1].
Ethical statement
Supplemental Material
Supplemental material for this article is available online.
References
Supplementary Material
Please find the following supplemental material available below.
For Open Access articles published under a Creative Commons License, all supplemental material carries the same license as the article it is associated with.
For non-Open Access articles published, all supplemental material carries a non-exclusive license, and permission requests for re-use of supplemental material or any part of supplemental material shall be sent directly to the copyright owner as specified in the copyright notice associated with the article.