
Abstract
Introduction
A high caloric diet and sedentary lifestyle are traditional risk factors for obesity. The most prescribed remedy for obesity is dietary restriction and increased exercise; however, the obesity pandemic remains unabated and is increasing worldwide. 1 Therefore, the role of environmental obesogens has become increasingly important in recent years. Studies have suggested that in utero or lifetime exposure to xenobiotic chemicals, such as bisphenol A (BPA), a typical environmental endocrine disruptor (EDC), can alter the programming of metabolic homeostasis and create conditions favourable for obesity. 2 However, the health effects caused by exposure to many potential EDCs can be unclear because most existing studies were designed to measure the impact of a single chemical without accounting for the impacts generated by multiple exposures. 3
In the past, only a small amount of fructose could be obtained from ripe fruits. However, with the development of the modern food industry, many fructose-containing drinks can easily be consumed since high-fructose corn syrup (HFCS) has been widely used in food sweeteners since the 1970s. High fructose intake is associated with the rising incidence of obesity and cancer, causing public concern. 4 Since fructose is widely used in soft drinks, cakes, and packaged foods, the risk of combined exposure to BPA and fructose is significantly heightened. Studies have shown that the average concentration of BPA was 1.0 ng/mL in sugary beverages and 40.3 ng/g in canned foods. 5 Therefore, research that examines the interactive effect of combined exposure to BPA and fructose on metabolism is important.
Adipose tissue is essential for maintaining energy balance in the body, as the tissue secretes biologically active adipocytokines. Previous studies have shown that adipocytokines, such as leptin and adiponectin, are associated with combined exposure to BPA and fructose. 6 However, fewer studies have examined alteration in other equally important adipocytokines, such as apelin, omentin-1, asprosin, apelin 13, irisin, and adipocyte fatty acid-binding protein (a-FABP), following combined exposure to BPA and fructose. Single exposure to fructose can alter the expression of genes involved in lipid synthesis and hexose uptake in adipocytes, promote adipocyte differentiation, accelerate adiponectin secretion and lipid synthesis, and disrupt glucose metabolism.7–11 Single exposure to BPA can interfere with the response of adipocytes to insulin signalling, 12 change the expression of key enzymes involved in adipocyte differentiation and lipid synthesis in children, 13 increase the number and size of adipocytes in prepubertal children by upregulating genes related to fat and insulin production, 14 and start the process by which adipocytes differentiate through epigenetic mechanisms. 15 However, it remains unclear whether the combination of BPA and fructose generates novel toxic characteristics in adipose tissue. To support the claim that environmental obesogens combined with fructose may cause serious injuries related to the development of obesity-associated disorders, the effects of these factors on adipose tissue should be examined.
Previous studies have demonstrated that combined exposure to BPA and fructose increased the accumulation of fat in rat liver 16 and inhibited oxidative phosphorylation and mitochondrial respiratory-related protein expression in rat cardiomyocytes. 17 Exposing young rats to low doses of BPA and fructose induced the upregulation of gene expression, controlling angiogenesis and vascular tension in heart tissue. 18 Lin and colleagues found that combined exposure to BPA and fructose aggravated abnormal liver lipid metabolism in developing rats. 19 SÖ and colleagues reported that combined exposure to BPA and fructose may aggravate sperm damage. 20 Combined exposure to BPA and fructose can also induce morphological changes and inflammation in liver tissue, increase lipid content in hepatocytes, and enhance the deposition of collagen and reticular fibres. 6 In addition, several previous studies have investigated this effect, and the activation of PPARγ and its downstream genes may be the mechanistic link. 21 However, studies that provide detailed information on the changes in adipose tissue caused by combined exposure to BPA and fructose are limited.
In the present study, 7 serum adipocytokines, including apelin, omentin-1, adiponectin, asprosin, apelin 13, irisin, and a-FABP, were measured by enzyme-linked immunosorbent assay (ELISA), and a targeted approach of UPLC-QqQMS-based metabolomics was conducted to determine the energy metabolic status of white adipose tissue from SD rats after 6 months of combined exposure to BPA and fructose. The correlation between serum adipocytokines and the target energy metabolome in white adipose tissue was subsequently calculated. This study will help researchers clarify the mechanism of adipose-derived metabolic damage caused by combined exposure to BPA and fructose.
Materials and methods
Materials and equipment
Bisphenol A, formic acid and fructose (purity ≥99%, Sigma-Aldrich, St. Louis, MO, USA), methanol (Merck, China), acetonitriles (Merck, China), Ultra Performance Liquid Chromatography (UPLC, ExionLC™ AD), tandem mass spectrometry (MS/MS, Applied Biosystems 6500+ QTRAP), ACQUITY UPLC BEH Amide column (1.7 µm, 100 mm × 2.1 mm i.d.), 57 standards (
Animals and sample collection
All animal experiments were carried out in accordance with the U.K. Animals (Scientific Procedures) Act 1986 and associated guidelines, EU Directive 2010/63/EU for animal experiments or the National Research Council's Guide for the Care and Use of Laboratory Animals. Furthermore, the reporting of animal testing experiments complied with the ARRIVE guidelines. Thirty-six three-week-old male SD rats (specific pathogen free, body weight 60–70 g) [Hunan SJA Laboratory Animal Co.; Ltd, Changsha, China; License: SYXK (Hunan) -2019-0014] were maintained in temperature- and light-controlled (14 h/10 h light/dark cycle) conditions at the Laboratory Animal Center of School of Department of Zoology, University of South China, a facility approved by the Association for Assessment and Accreditation of Laboratory Animal Care [License: SYXK (Hunan) -2020-0002]. The environment was controlled at a temperature between 20 and 22°C, with a range of 50%–60% humidity. The rats were housed in individual cages and had access to food and water ad libitum. The food was regular feed provided by the animal department of the University of South China.
Fresh BPA dosing solutions for rats were prepared in corn oil. All doses were expressed as micrograms per kilogram (μg/kg) of body weight for the respective drugs. The administered dose was determined based on the body weight measured prior to administration. The animals were acclimated to the laboratory for 1 week prior to the start of the experiments and were randomized into six groups (n = 6 rats/group), which are described below.
Vehicle control group (
Each group of rats was provided with a 1000 mL glass bottle of water per day. Using this gavage method, none of the rats died, and no injuries were observed in the stomach, oesophagus, or trachea. Before serum and adipose tissue samples were collected, all animals were fasted for more than 12 h. After anaesthesia was administered, femoral artery blood samples from rats were collected into a 1.5 mL centrifuge tube without anticoagulants. Blood samples were centrifuged for 10 min at 3000×g and 4°C. Serum was collected into microtubes and stored at −80°C. The rats were euthanized at the end of the experiment. All procedures performed in this study followed the ethical standards of the Ethics Committees of Affiliated Nanhua Hospital, University of South China (Ethical approval number: 2021-KY-173).
Metabolite extraction
Adipose samples from the retrorenal fat pad of each group were separated carefully, cut into small pieces and mixed. The small pieces of pooled adipose tissue from each group were transferred into a steel vessel, and a steel ball was added and then frozen in liquid nitrogen for 20 min. The samples frozen by liquid nitrogen were homogenized twice at 30 Hz for 30 s. Fifty milligrams of homogenized powder was accurately weighed into a new centrifuge tube, and 500 µL of a 70% methanol/water (−20°C precooling) mixture was added. 22 The lyophilized powder of adipose tissues with methanol extract was oscillated for 5 min at 2500 r/min and left for 5 min. After centrifugation at 4°C and 12,000 r/min for 5 min, 400 μL of supernatant was absorbed into a new centrifuge tube and placed in a refrigerator at −20°C for 30 min. After centrifugation at 4°C at 15,000 r/min for 20 min, 200 μL of supernatant was used for UPLC‒MS/MS analysis. UPLC‒MS/MS testing was performed with three biological replicates of the pooled adipose samples in each group.
UPLC‒MS/MS-based quantitative analysis
Mobile phase A was ultrapure water (containing 10 mM ammonium acetate and 0.3% ammonia); mobile phase B was 90% acetonitrile/water (v/v); and the flow rate was 0.4 mL·min-1. The gradient conditions of the mobile phase were as follows: 0–1.2 min for A/B 5:95 (v/v), 8 min for A/B 30:70 (v/v), 9–11 min for A/B 50:50 (v/v), and 11.1–15 min for A/B 5:95 (v/v). The temperatures of the column and autosampler were maintained at 40°C and 4°C, respectively. The injection volume was 2 μL. The ESI source temperature was 550°C; the curtain gas was set at 35 lbf/in2; and the mass spectrum voltage was 5500 V (−4500 V for negative ion mode). The ion pairs for multiple reaction monitoring (MRM) analysis were dependent on the optimized declustering potential and collision energy. The chromatographic peaks were corrected manually. Standard curves were drawn for 0.01, 0.02, 0.05, 0.1, 0.2, 0.5, 1, 2, 5, 10, 20, 50, 100, 200, 500, 1000, 2000, 5000, and 10,000 ng/mL of the 57 metabolites involved in energy metabolism using the concentration of external standard as the abscissa and the area of external standard peak as the ordinate.
Serum enzyme-linked immunosorbent assay (ELISA) analysis and fasting blood glucose detection
Apelin, omentin-1, adiponectin, asprosin, apelin 13, irisin, a-FABP and insulin in the serum from each animal were detected by ELISA with a double antibody one-step sandwich method. Serum samples (10 μL), standard samples and horseradish peroxidase-labelled antibodies were added to the wells precoated with antibodies against the above adipocytokines. The substrate 3,3′,5,5′-tetramethylbenzidine (TMB) was converted to blue under peroxidase catalysis and to yellow under the action of acid. The absorbance (OD value) at 450 nm was measured using a microplate reader, and the concentrations of these adipocytokines were calculated by standard curves (r2 ≥ 0.99).
Fasting blood glucose levels were detected by a portable blood glucose metre (purchased from Mindray Medical International Co., Ltd, China) according to operational manual.
Statistical analysis
T tests (normal distribution data) or Kruskal‒Wallis tests (nonnormal distribution data) were performed using SPSS software (Version: 21, IBM, USA) to evaluate differences in the contents of metabolites and adipocytokines between groups generated from raw mass spectrum data, and the significance level was p ≤ 0.05. A principal component analysis (PCA) model was used to visually examine intergroup differences. The metabolite content data were exported to SIMCA-P 14.1 software (Umetrics, Umeå, Sweden), unit-variance scaled, and analysed for principal components (PCs). The fraction of the explained variation in a PC is given by R2X. The significance of the PCs was controlled by multiple-fold cross-validation (Q2), a default function in SIMCA. The correlations between the metabolites and adipocytokines were measured by Pearson correlation coefficient and were visualized by heatmap in Heml software (Version: 1.0.3.7), which is a software dedicated to drawing heatmaps (https://hemi.biocuckoo.cn/).
Results
Quality control and instrument stability in UPLC‒MS/MS analysis
The mixed standard solution was used as a quality control (QC) sample. During UPLC‒MS/MS analysis, a QC sample was inserted every 10 test samples. The stability of the instrument during the project test can be judged by overlapping the total ion flow chromatogram (TIC) from the QC samples. In the present study, the TIC overlap was high, and the retention time and peak intensity were consistent, indicating that the instrument was stable during this project (Supplementary Figure 1). The determination coefficient (r2) of the standard curve regression equation of each metabolite was over 0.98 (Supplementary Table 1), indicating that the correlation coefficients for the standard curve regression equation were good.
Combined exposure to BPA and fructose did not affect the animal body weight, blood glucose level and insulin level but may affect the liver weight and liver index
Changes in animal body weight, content of blood glucose and insulin, liver weight and liver index after BPA and fructose combined exposure.

ap < 0.05 generated by Kruskal-Wallis test, compared with control group.
Detected and undetected metabolites
Among 57 metabolites, 39 metabolites were accurately quantified, and 18 metabolites, including acetyl-CoA, succinyl-CoA, ADP, oxaloacetate, alpha-ketoglutaric acid, c-di-AMP,
Effects of BPA and fructose exposure on metabolites and adipocytokines
Combined exposure to lower-dose BPA and fructose significantly altered energy metabolism in adipose tissue
The content of 39 metabolites detected in white adipose tissue by UPLC-MS/MS in MRM mode after BPA and fructose combined exposure.

ap < 0.05 versus Control.
bp < 0.05 versus BPAL.
cp < 0.05 versus BPAH.
dp < 0.05 versus F.
ep < 0.05 versus BPAL+F.

Scores plot generated from PCA. (a) BPA exposure alone, (b) fructose exposure alone, (c) the combine exposure to lower-dose BPA and fructose, and (d) the combine exposure to higher-dose BPA and fructose.
Combined exposure to lower-dose BPA and fructose significantly increased the level of intermediates in glycolysis and purine metabolism
BPA exposure caused the levels of Metabolites with dose-dependent relationship to BPA alone or combined BPA and fructose. (a) p < 0.05 versus Control, (b) p < 0.05 versus BPAL, (c) p < 0.05 versus BPAH, (d) p < 0.05 versus F, (e) p < 0.05 versus BPAL+F. Metabolites significantly changed by higher-dose BPA alone and combined BPA and fructose. (a) p < 0.05 versus Control, (b) p < 0.05 versus BPAL, (c) p < 0.05 versus BPAH, (d) p < 0.05 versus F, (e) p < 0.05 versus BPAL+F. Metabolites declined at lower BPA level and increased at higher BPA level. (a) p < 0.05 versus Control, (b) p < 0.05 versus BPAL, (c) p < 0.05 versus BPAH, (d) p < 0.05 versus F, (e) p < 0.05 versus BPAL+F.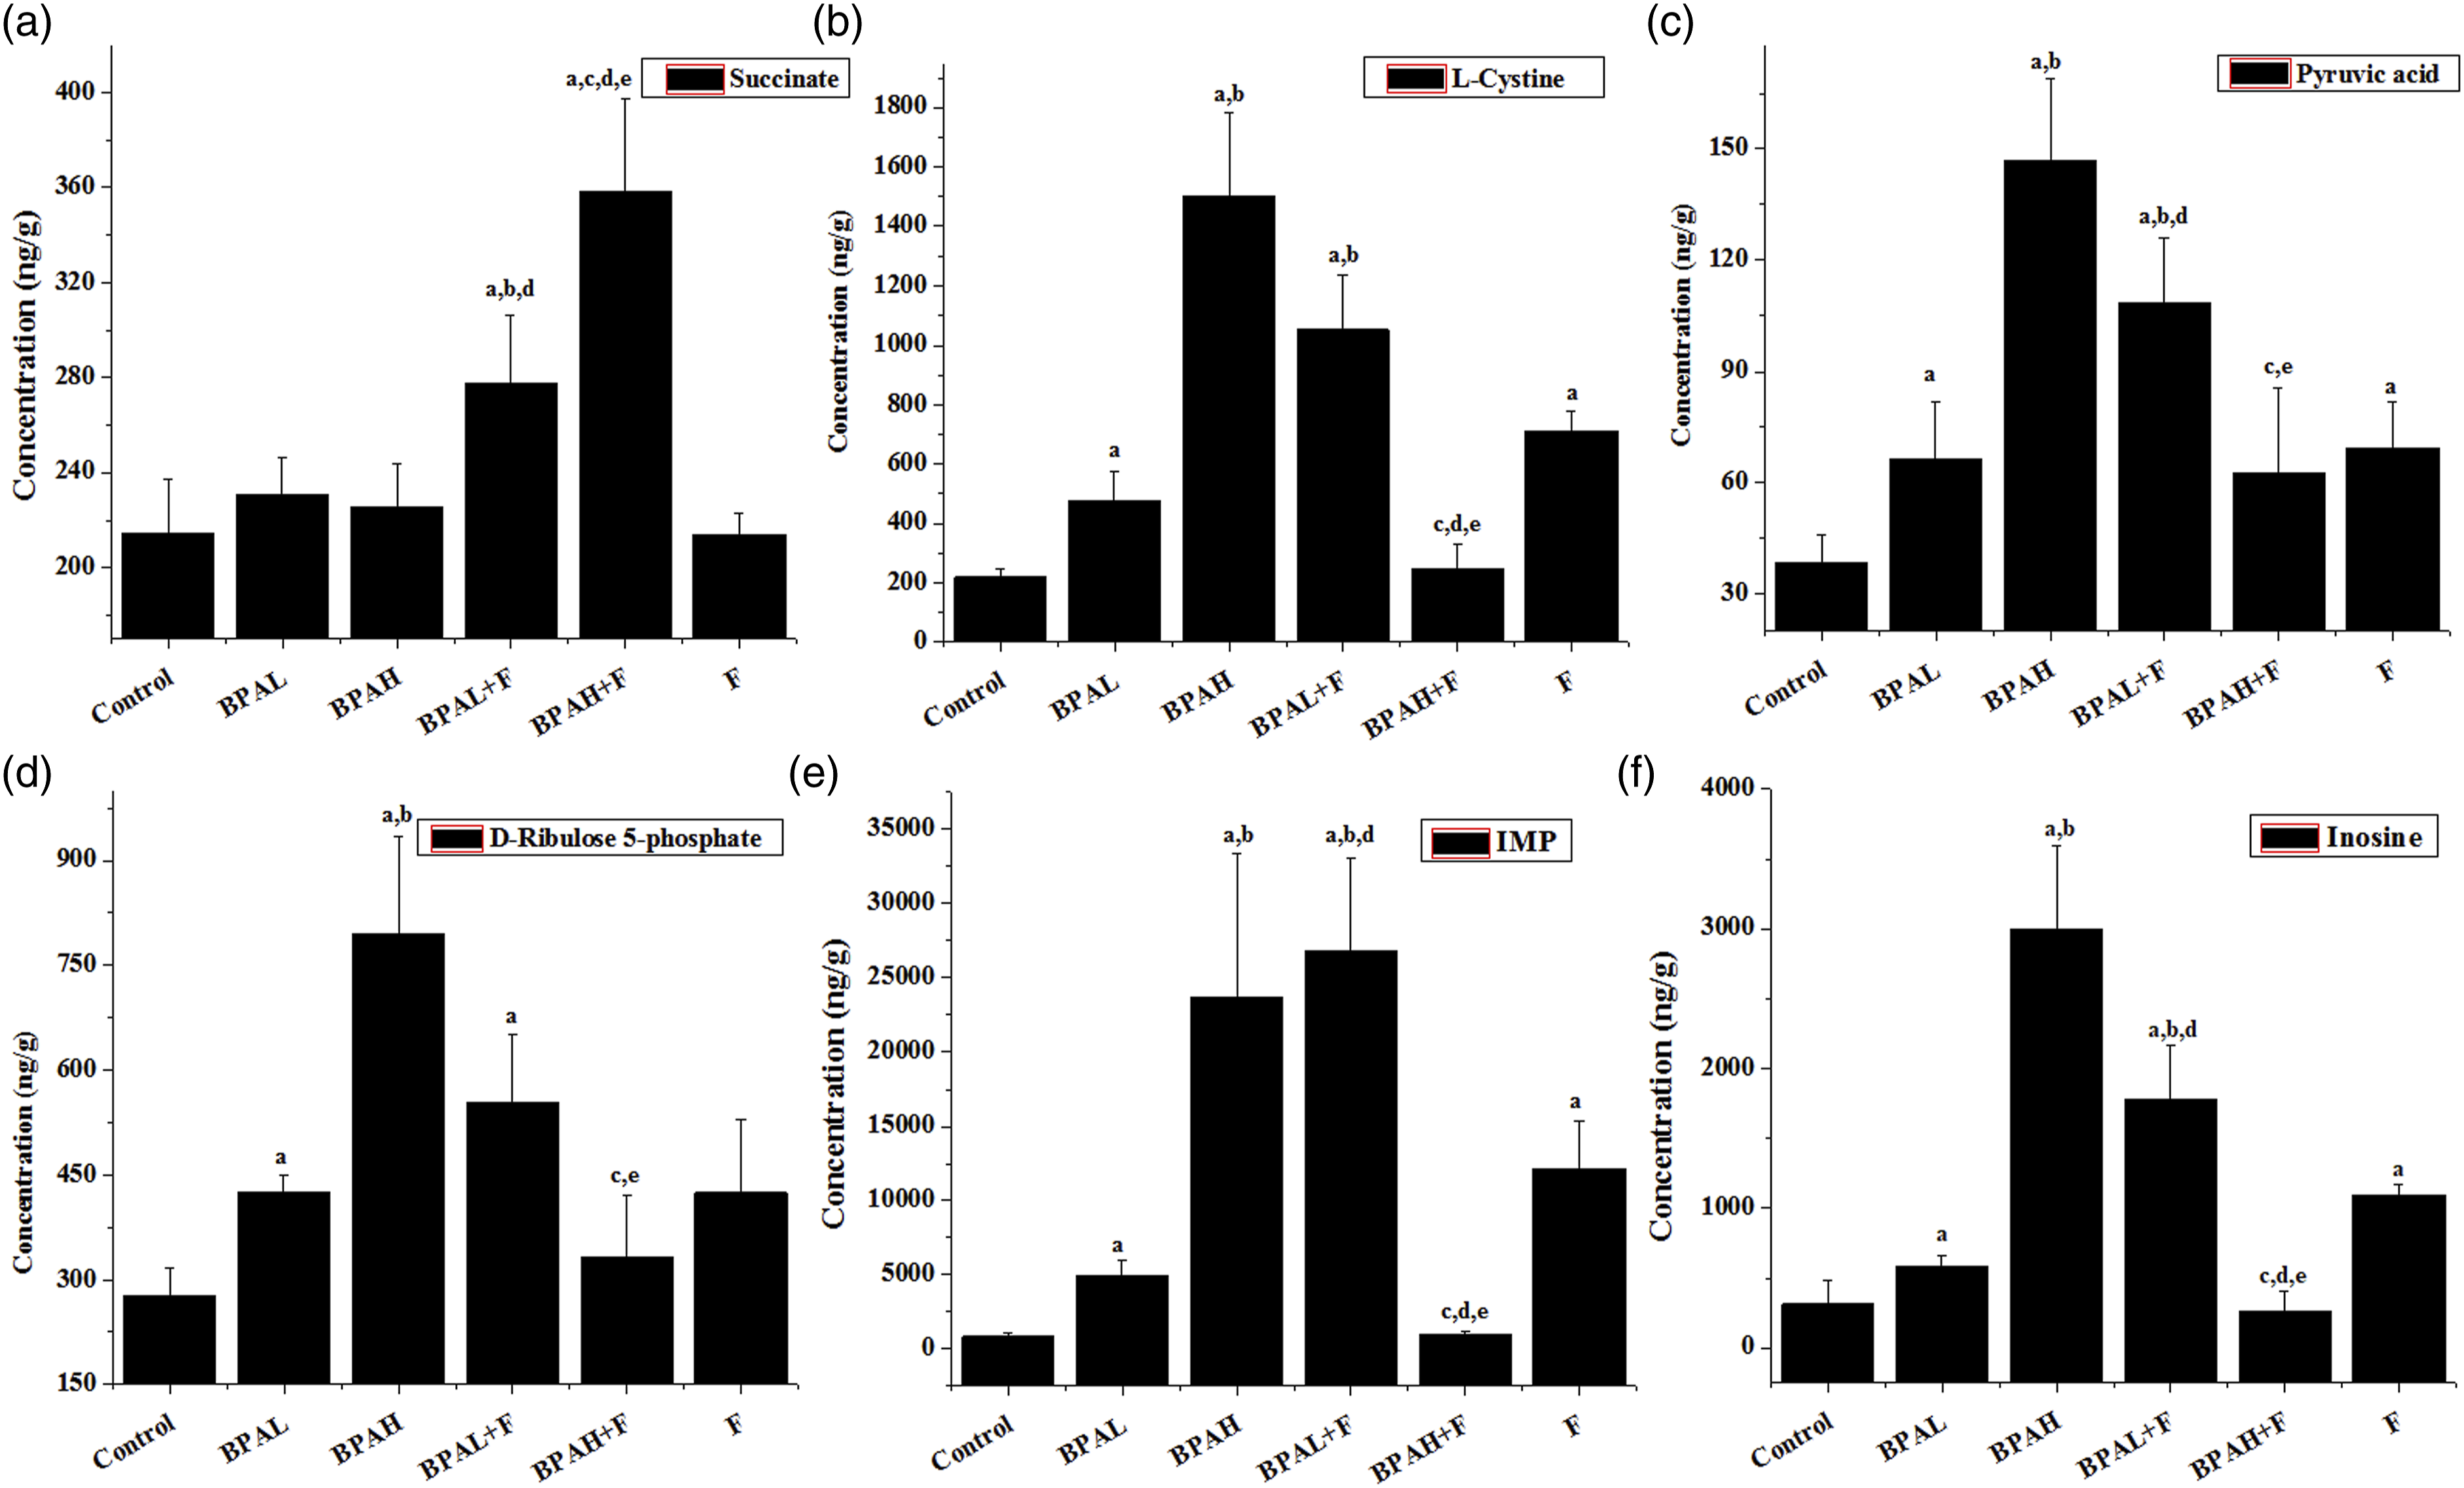


Fructose exposure significantly altered 7 adipocytokines, and BPA and fructose may exhibit synergistic effects on omentin-1 and apelin 13
Long-term exposure to 5% fructose caused a significant decrease in the levels of omentin-1, apellin, irisin and apellin13 (Figure 5(a), (d), (f) and (g)), while the level of adiponectin, a-FABP and asprosin (Figure 5(b), (c) and (e)) significantly increased. Exposure to BPA did not affect omentin-1 and apelin 13 levels (Figure 5(a) and (g)). Exposure to BPA or fructose alone caused a significant increase in a-FABP levels; however, the combined exposure to BPA and fructose did not impact a-FABP compared with the control group or fructose alone exposure group (Figure 5(c)). Exposure to lower-dose BPA or fructose decreased irisin levels significantly; however, compared with the control group or fructose alone exposure group, the combined exposure to BPA and fructose did not impact irisin levels (Figure 5(f)). Omentin-1 was increased after lower-dose BPA combined fructose exposure, and apelin 13 was decreased in a dose-dependent manner in the combined exposure to BPA and fructose groups (Figure 5(a) and (g)). Alteration of 7 adipocytokines after BPA or/and fructose exposure. (a) p < 0.05 versus Control, (b) p < 0.05 versus BPAL, (c) p < 0.05 versus BPAH, (d) p < 0.05 versus F, (e) p < 0.05 versus BPAL+F.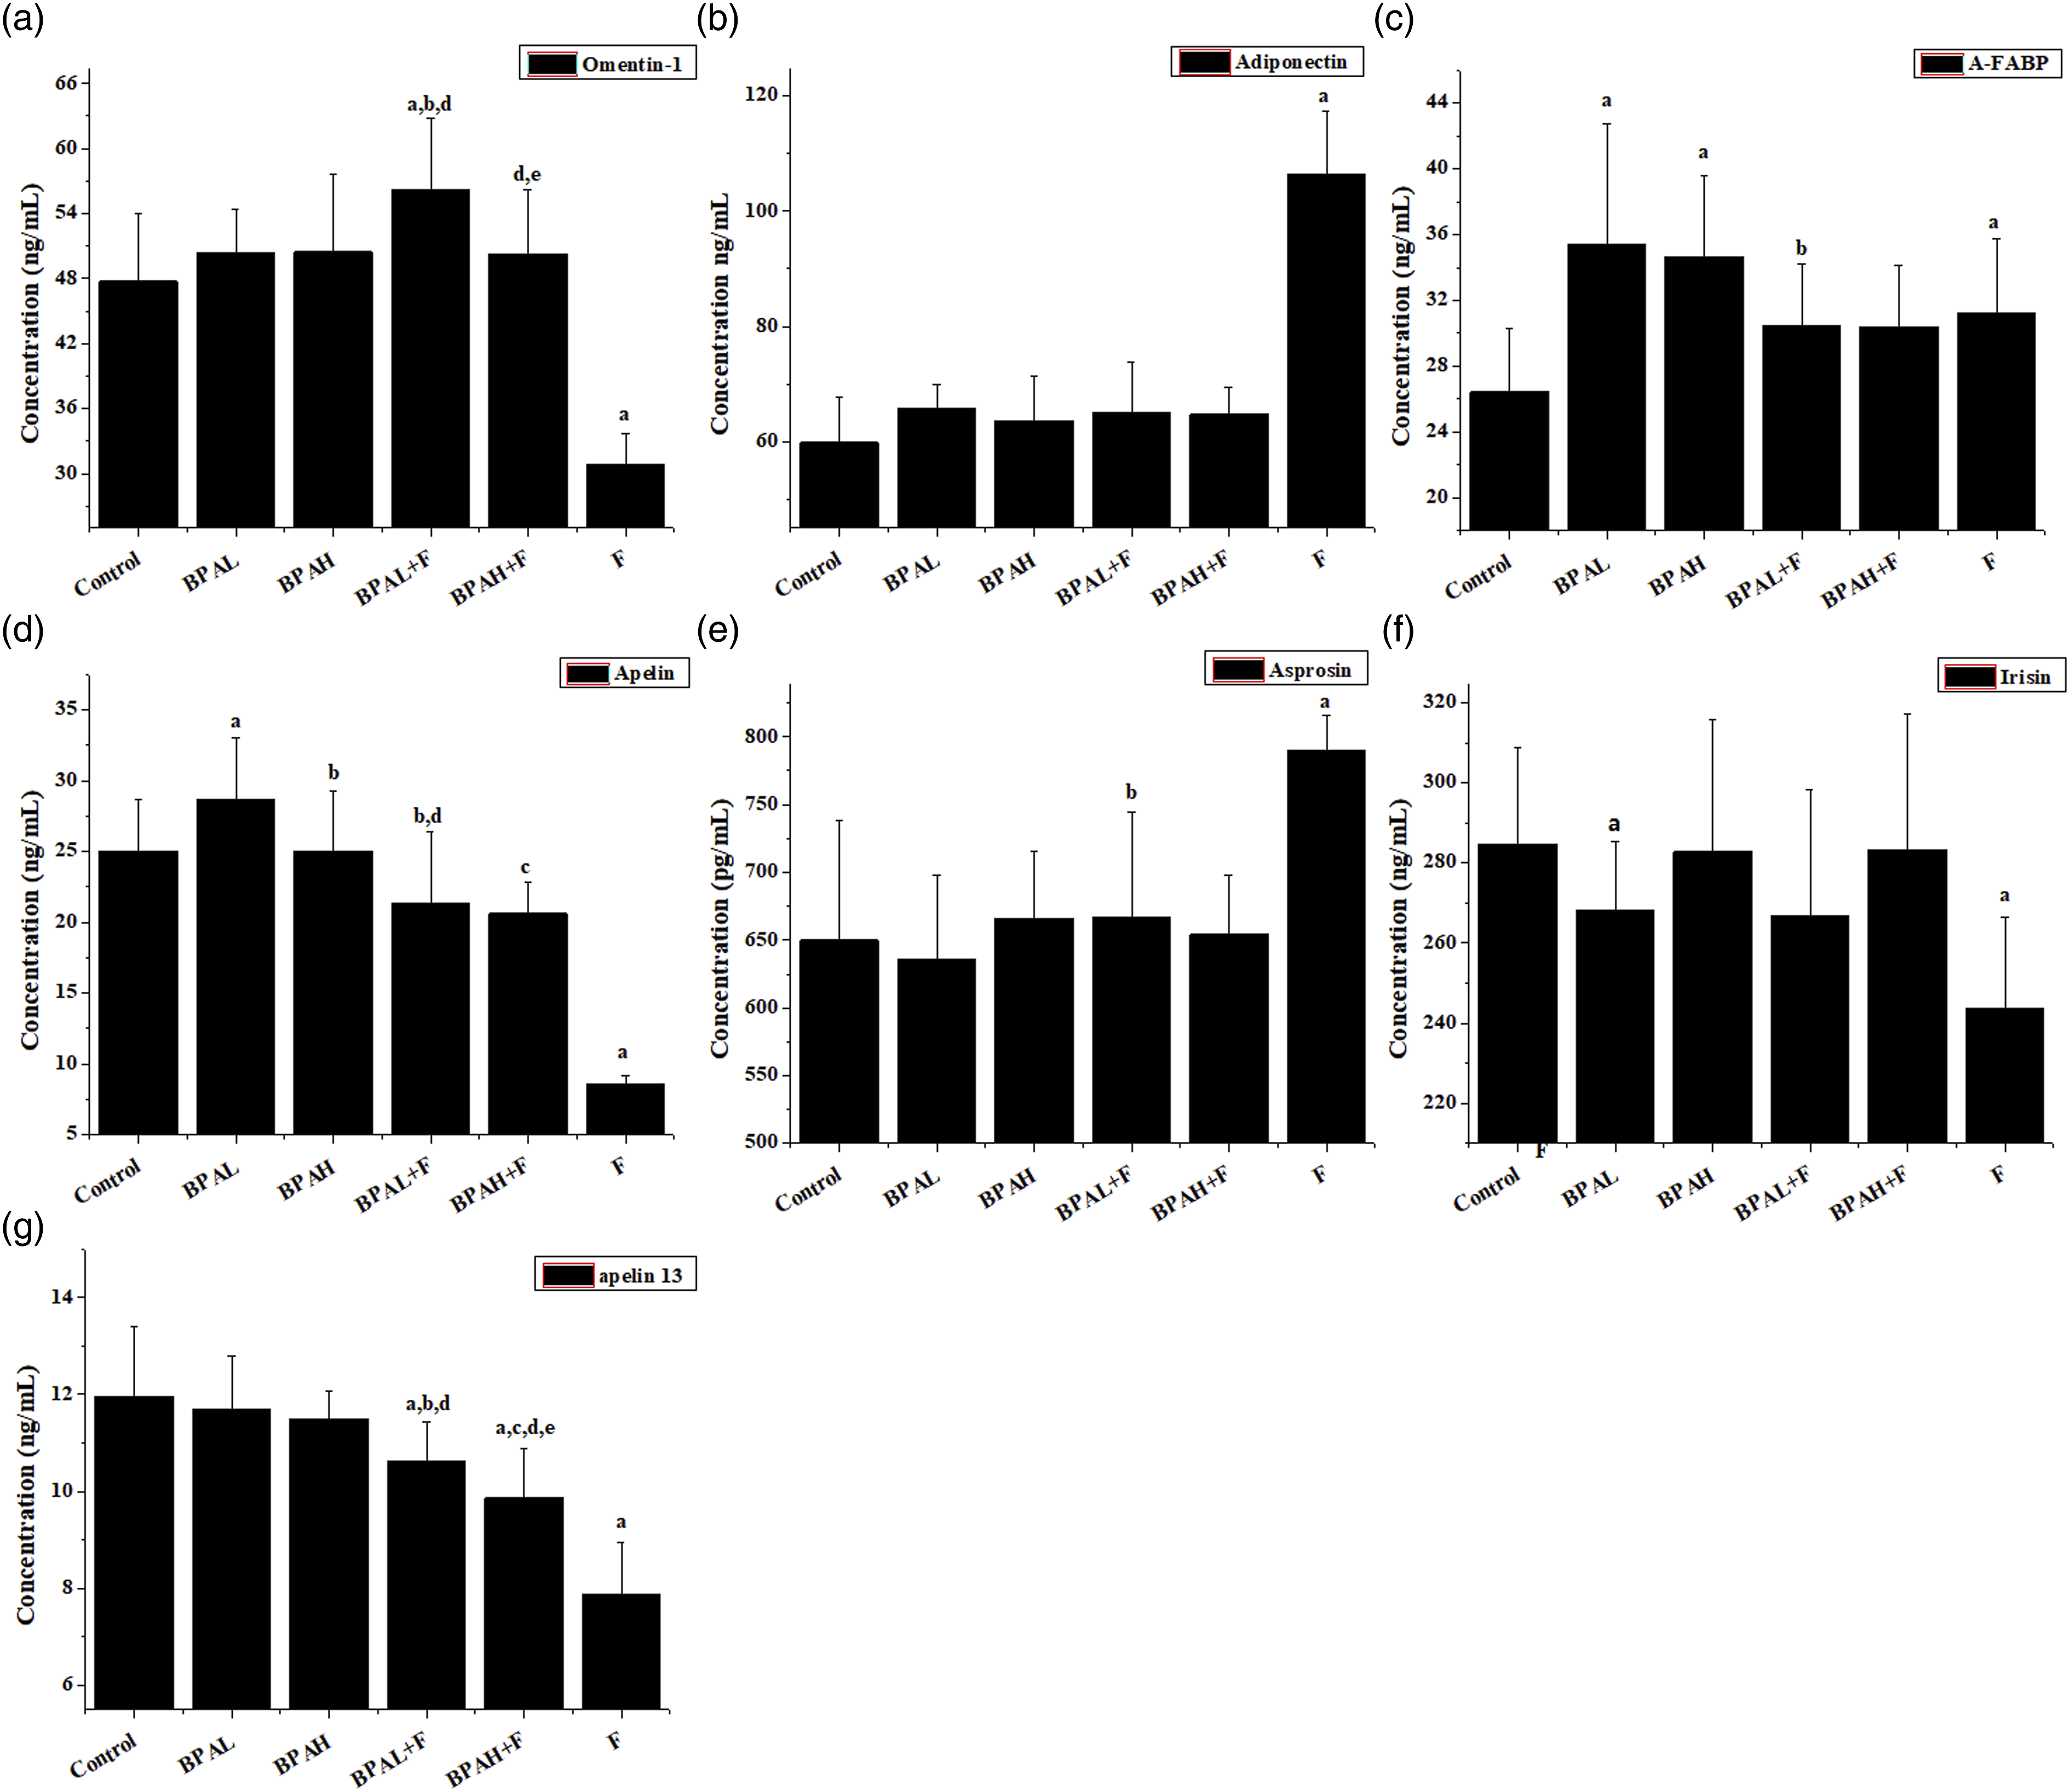
Correlations between adipocytokines and energy metabolism
Correlation analysis revealed some novel associations between adipocytokines and energy metabolism during exposure to BPA and/or fructose (Figure 6). The details were as follows: asprosin was significantly correlated with phosphoenol-pyruvic acid (r = 0.45, p < 0.05); omentin-1 was significantly correlated with ornithine (r = −0.59, p < 0.05), phenyllactate (r = 0.52, p < 0.05), Heat map of the correlation between target metabolite and adipocytokine.
Discussion
In the present study, the goal was to investigate whether metabolic damage in adipose tissue was aggravated by combined exposure to BPA and fructose and to determine the mechanism biomarkers that are closely related to combined exposure.
White adipose tissue functions as a dynamic endocrine organ, releasing various adipokines that play a crucial role in regulating metabolic homeostasis and multiple physiological processes.
23
The interference of environmental endocrine disruptors, such as BPA, in whole-body homeostasis mainly results from damage to the metabolic regulation of adipose tissue. Targeted metabolomics can provide accurate quantitative information on key metabolites that participate in specific metabolic pathways of adipose tissue. Fructose metabolism in the body exhibits the following characteristics: first, fructose enhances glycolysis, promoting processes to store rather than use energy. Second, fructose undergoes rapid phosphorylation after entering cells and decreases the concentration of intracellular phosphate, which activates AMP deaminase-2. As a result, the degradation of AMP to IMP and eventually uric acid is triggered.
24
In the present study, the combined exposure to lower-dose BPA and fructose significantly increased pyruvic acid, ATP, AMP, IMP, inosine, and
BPA or fructose exposure alone did not affect succinate; however, the combined exposure to BPA and fructose specifically increased succinate in a dose-dependent manner. Succinate, an archetypal respiratory substrate, performs many functions other than energy metabolism and could act as a signal biomarker similar to hormones and cytokines, which have been involved in many serious diseases in recent years.27–30 In white adipose tissue, succinate binds to its receptor SUCNR1 and acts as a lipolysis inhibitor, thereby exacerbating the accumulation of lipids.
28
Based on the dose-dependent increase in succinate, the succinate-SUCNR1 axis may play an important role in lipid accumulation induced by combined exposure to BPA and fructose. Furthermore,
As an endocrine organ, the secretion of biologically active cytokines is among the most important functions of adipose tissue. It was reported that 2 h of exposure to 1 and 10 nM BPA did not influence leptin and adiponectin secretion from adipocytes. 31 However, 24 h of exposure to 10 nM BPA reduced the expression of fatty acid-binding protein 4 (FABP4) and adiponectin in adipocytes. 32 Twenty-eight days of exposure to BPA significantly increased adiponectin and decreased leptin in rat serum; 33 however, the exposure dose was 18 mg/kg per day, which was much higher than the level of environmental exposure. Humans are consistently exposed to BPA at low levels in the environment. 34 Therefore, studying the toxic effects of long-term, low-dose exposure to BPA may be important. In this study, long-term exposure to BPA did not affect adiponectin levels, which contradicts previous studies.31–33 We speculate that this discrepancy may result from the low dosage of BPA used, which did not impact adiponectin at the whole-animal level.
A-FABP exhibits a high affinity for fatty acids, which can promote the transport of long-chain fatty acids and deposit triglycerides in adipocytes.
35
Exposure to BPA or fructose alone for 6 months significantly increased the level of a-FABP. The combined exposure to BPA and fructose did not have a synergistic effect on a-FABP. Targeted metabolomics analysis demonstrated a strong negative correlation between A-FABP and 12 metabolites, including
Apelin is an endogenous ligand of the specific receptor APJ (G protein-coupled receptor protein related to angiotensin-Ⅱ protein 1) that is isolated and purified from bovine gastric secretions. Apelin is generally considered an adipose-derived polypeptide hormone that performs several important functions, including protecting the vascular system and enhancing glucose metabolism. 36 BPA could increase apelin levels in human ovarian cancer cells, 37 and bisphenol F (BPF), a substitute for bisphenol A (BPA), could decrease apelin levels in 3T3-L1 adipocytes. 38 In the present study, a 6-month exposure to BPA at an environmental level (0.25 μg/kg every other day) resulted in a significant increase in apelin levels in vivo, potentially indicating that lower-dose BPA exposure induces a hormetic effect. However, the serum apelin levels in the higher-dose BPA exposure group (25 μg/kg every other day) were similar to those in the normal control group. Compared to the BPA exposure group, the fructose exposure group achieved a much stronger inhibition of apelin and apelin 13 (an active form of apelin). Compared to fructose exposure and BPA exposure, the combined exposure to BPA and fructose resulted in weaker and stronger inhibition of apelin and apelin 13, respectively. Notably, the levels of apelin 13 decreased in a dose-dependent manner following combined exposure to BPA and fructose. Further association analysis revealed that apelin and apelin 13 were significantly negatively correlated with ornithine and phosphoenolpyruvic acid. Ornithine is a crucial metabolite involved in the urea cycle, while phosphoenolpyruvic acid participates in the formation of pyruvic acid, a key metabolite in lipid production. The decrease in apelins following combined exposure to BPA and fructose strongly predicted that urea and lipid production would increase. Lipid accumulation caused by BPA and fructose combined exposure was found in a previous study. 19 However, the effect of BPA combined with fructose on the urea cycle has not yet been reported.
Irisin is a polypeptide hydrolysed from fibronectin type III domain containing 5 (FNDC5), which provides an important protective effect against many metabolic diseases, such as type 2 diabetes, obesity, osteoporosis, and MAFLD.
39
The most important function of irisin is to transform white adipocytes into brown adipocytes, increasing energy consumption.
40
Previous studies have found that fructose could reduce the expression of irisin,
41
which was consistent with our findings. In the present study, we found that 6 months of exposure to BPA at a lower dose caused irisin levels to decrease significantly, indicating that long-term, lower-dose BPA exposure may prevent white adipose tissue from browning by reducing irisin; as a result, energy consumption is suppressed. Combined BPA and fructose exposure did not have a significant effect on irisin. Additionally, we observed a positive correlation between irisin and
Interestingly, fructose affected all 7 adipocytokines studied in our study. As a nutrient for daily intake, fructose exposure alone significantly increased asprosin, adiponectin and a-FABP levels and significantly decreased omentin-1, irisin, apelin and apelin 13 levels. Therefore, measures to limit the excessive intake of fructose should be implemented. The adipocytokine secretion profile is based on the function of adipose tissue. Long-term fructose exposure induced significant changes in the adipocytokine profile, indicating that fructose exposure significantly altered the function of adipose tissue. The changes in these adipocytokines may result from adaptation to fructose-induced energy storage. In addition, exposure to fructose alone and a high dose of BPA combined with fructose significantly reduced liver weight and liver index, indicating that liver damage may result from fructose and a high dose of BPA combined with fructose; however, further research data are needed.
The reference doses for BPA of the current U.S. Environmental Protection Agency and European Food Safety Authority are 50 μg/kg/day and 4 μg/kg/day, respectively. 42 However, Hass and colleagues proposed that 4 μg/kg/day may not sufficiently protect humans from endocrine-disrupting effects due to the effects on behaviour, early sexual and mammary gland development, and sperm count observed in rats.43–45 In the present study, we evaluated the following exposure doses in the tolerable daily intake (TDI) range: 0.25 μg/kg/every other day, a dose 32 times lower than the preliminary European Food Safety Authority (EFSA) TDI, and a higher dose (25 μg/kg/every other day), which was 4 times lower than the reference dose (RfD) of 50 μg/kg/day corresponding to the U.S. Food and Drug Administration (FDA) (2008). In 2016, the European Commission mandated EFSA to re-evaluate the risks of BPA in foodstuffs to public health. 46 A reference point (RP) of 8.2 ng/kg BPA per day was identified for the critical effect on Th17 cells in mice. The EFSA Panel on Food Contact Materials, Enzymes and Processing Aids (CEP) applied an overall uncertainty factor of 50 to the RP, and a TDI of 0.2 ng BPA/kg per day was established. 46
Based on the results of this study, BPA significantly interfered with energy metabolism at a level 30 times lower than the old EFSA TDI but approximately 625 times higher than the new EFSA TDI. Therefore, further research is needed to determine whether the new EFSA TDI is sufficiently safe. Second, the administration of 5% fructose for 6 months exerted a significant impact on 7 adipocytokines, highlighting the need to exercise caution regarding long-term and excessive fructose consumption. Succinate, as a specific metabolite in adipose tissue to BPA and fructose combined exposure, caused adverse health effects; thus, succinate may be a novel intervention target for combined BPA and fructose exposure.
Supplemental Material
Supplemental Material - Impact of combined chronic exposure to low-dose bisphenol A and fructose on serum adipocytokines and the energy target metabolome in white adipose tissue
Supplemental Material for Impact of combined chronic exposure to low-dose bisphenol A and fructose on serum adipocytokines and the energy target metabolome in white adipose tissue by Xiaocheng Liu, Guojuan Li, Jing Zhong, Ouyan Rang, Guifang Ou, Xinru Qin, Yonghong Tang and Mu Wang in Human & Experimental Toxicology
Footnotes
Author contributions
Mu Wang designed and performed the experiments, analyzed the data and wrote the manuscript. Xiaocheng Liu, Ouyan Rang, Guifang Ou, Xinru Qin performed the experiments. Guojuan Li, Jing Zhong, Yonghong Tang reviewed and edited the manuscript. All authors reviewed and approved the final manuscript.
Declaration of conflicting interests
The author(s) declared no potential conflicts of interest with respect to the research, authorship, and/or publication of this article.
Funding
The author(s) disclosed receipt of the following financial support for the research, authorship, and/or publication of this article: This work was supported by the Key Project of Hunan provincial science and technology innovation (No. 2020sk1012); Natural Science Foundation of Hunan Province (No. 2022JJ30547); the excellent youthful project Scientific research of Hunan Provincial Department of Education: 20B491; “4310” cultivation program of clinical medicine research of Hengyang Medical School, University of South China [HengYiFa (2021) No. 1-2-7].
Ethical statement
Supplemental material
Supplemental material for this article is available online.
References
Supplementary Material
Please find the following supplemental material available below.
For Open Access articles published under a Creative Commons License, all supplemental material carries the same license as the article it is associated with.
For non-Open Access articles published, all supplemental material carries a non-exclusive license, and permission requests for re-use of supplemental material or any part of supplemental material shall be sent directly to the copyright owner as specified in the copyright notice associated with the article.