
Abstract
The dual peroxisome-proliferator-activated receptor (PPAR) α/γ agonist tesaglitazar has been shown to produce fibrosarcomas in rats. Here, the authors studied morphology, proliferation, differentiation, and inflammation markers in adipose tissue from rats exposed to 1, 3, or 10 µmol/kg tesaglitazar for 2 or 12 weeks, including recovery groups (12 weeks treatment followed by 12 weeks recovery), and 3 or 10 µmol/kg tesaglitazar for 24 weeks. Subcutaneous white and brown fat revealed reversible dose-related histopathological alterations and after 12 and 24 weeks developed areas of thickened skin (fatty lumps). There was a dose-dependent increase in proliferation of interstitial cells in white and brown fat as shown by increased mitotic index in all dose groups after 2 weeks. This was limited to the high dose after 12 and 24 weeks in white fat. Gene expression analyses showed that while tesaglitazar induced differentiation of adipose tissue characterized with a switch in cyclin D1 and D3 mRNA by 12 weeks, longer exposure at high doses reversed this differentiation concurrent with a reappearance of early adipocyte and inflammatory markers. These data suggest that sustained increased turnover of mesenchymal cells in adipose tissues, concomitant with onset of inflammation and fibrosis, drives development of fibrosarcomas in rats treated with tesaglitazar.
Introduction
Peroxisome-proliferator-activated receptors (PPARs) are nuclear receptors involved in regulating lipid, glucose, and insulin metabolism (Yki-Jarvinen 2004). PPARs are ligand-activated transcription factors of the nuclear hormone receptor subfamily. Three PPAR isotypes, α, δ, and γ, have been reported in most vertebrates. PPARα is present in liver, brown fat, kidney, heart, skeletal muscle, immune system, intestine, and retina. PPARα agonists have effects on maintenance of lipid levels, especially triglycerides and high-density lipoproteins (HDL) (Klaunig et al. 2003). PPARγ is present in adipose tissue, endothelial cells, tissues of the immune system, and several epithelial tissues such as the urothelium and the intestine (Klaunig et al. 2003). In mammals, alternative promotor usage and differential splicing of the Pparg gene yield two isoforms, γ1 and γ2. PPARγ2 is expressed exclusively in adipocytes and plays a role in differentiation and in the expression of enzymes of lipogenesis. Tesaglitazar is a dual agonist of PPARα and γ that improves both lipidemic and glycemic abnormalities in preclinical models of Type 2 diabetes and metabolic syndrome (Oakes et al. 2005). Tesaglitazar was discontinued from further development in May 2006 as data from phase III clinical trials showed that its benefit-risk profile was unlikely to give an advantage over currently available therapies.
Preclinical carcinogenicity studies have revealed that several PPARγ and dual PPARα/γ agonists induce fibrosarcomas or liposarcomas and urinary bladder tumors in rats and hemangiosarcomas in mice (Hardisty et al. 2007; Tannehill-Gregg et al. 2007). We have previously reported that tesaglitazar at the dose of 10 µmol/kg induced subcutaneous mesenchymal tumors in rats that were classified as fibrosarcomas (Hellmold et al. 2007). Fibrosarcoma is a malignant tumor that arises in soft tissues (i.e., muscle, connective tissues, blood vessels, joints, and adipose tissue). In an initial investigative study, we observed a proliferative effect on interstitial mesenchymal cells in white and brown adipose tissue at the high dose (10 µmol/kg) that was sustained for at least 12 weeks (Hellmold et al. 2007). Since tesaglitazar has been shown to lack genotoxic activity in a standard battery of regulatory tests (AstraZeneca data on file), the mechanism for tumor formation by tesaglitazar and other PPARγ agonists is considered to be epigenetic.
PPARγ and PPARα/γ agonist exposure in rats has been associated with adipogenesis and a sustained proliferation in the subcutaneous fat (Hardisty et al. 2007). There are currently two potential hypotheses concerning this sustained proliferation. One is that exposure to PPARγ agonists has a direct effect on the adipocytes, while the second hypothesis contends that the PPARγ agonist exposure exerts an indirect effect mediated by cytokine/hormone production by other cell types (Hardisty et al. 2007). In this study, we have characterized the proliferative effect further with regard to dose response, long-term effects, and reversibility. In addition, potential mechanisms by which tesaglitazar causes proliferation were investigated and samples were taken for gene expression analyses of a selected set of markers for adipocyte proliferation and differentiation. The data reveal that prolonged treatment with high doses of tesaglitazar in rats results in a sustained cell proliferation of poorly differentiated interstitial mesenchymal cells and the reemergence of early preadipocyte markers (cyclin D1 and C/EBPβ) and inflammatory markers (IL-1β and TNF-α) in both fatty lumps and white adipose tissue. These changes precede in time the development of neoplastic changes.
Materials and Methods
Test Substance
Tesaglitazar ((S)-2-ethoxy-3-[4-({4-[methylsulphonyloxy] phenethyl}oxy)phenyl] propanoic acid) was synthesized by AstraZeneca, Mölndal, Sweden. The test substance was dissolved in vehicle, which consisted of 5 mM sodium hydrogen carbonate buffer solution, pH 8.5.
Animals and Dosing
Male Wistar Hannover Galas rats were obtained from Taconic M&B A/S (Lille Skensved, Denmark). The animals were allowed to acclimatize for 2 weeks before study start and were eight to nine weeks of age at the start of dosing. The animals were housed five rats per cage by sex and dose. Each cage was supplied with sterilized whitewood shavings. Water and food (RM1 (E) SQC diet, supplied by Special Diets Services Limited; Stepfield, Witham, Essex, UK) was supplied ad libitum. There was automatic control of light cycle, temperature, and humidity; light hours were 0700 to 1900 h; and target ranges for temperature and humidity were 20°C ± 2°C and 50 ± 15%, respectively. The study was designed using current guidelines for repeat dose toxicity studies issued by the European Medical Agency, Organization of the Ministry of Health, Labour and Welfare and Food and Drug Administration. Approval from the animal research ethics committee had been obtained for using these animals in preclinical safety studies. Ten male rats per group were administered vehicle or tesaglitazar by daily oral gavage applying the following dosing regimens; 0, 1, 3, or 10 µmol/kg (0, 0.41, 1.23, and 4.1 mg/kg) for 2 or 12 weeks and 3 or 10 µmol/kg (0, 1.23, and 4.1 mg/kg) for 24 weeks. The daily dose volume was 10 ml/kg. Additional groups received tesaglitazar (3 and 10 µmol/kg) for 12 weeks followed by 12 weeks recovery before necropsy. The doses of tesaglitazar were based on a two-year rat carcinogenicity study (Hellmold et al. 2007), in which the highest dose of 10 µmol/kg produced a statistical increase in fibrosarcomas in male rats, whereas the low dose of 1 µmol/kg did not.
Plasma Concentration of Tesaglitazar
Blood for determination of exposure of the substance was taken during the last week of dosing in all groups from four animals per group at three hours after the last dose (at approximate Cmax). The plasma concentration of tesaglitazar in rats was determined by reversed phase liquid chromatography and mass spectrometric detection in blood.
Immunohistochemical Staining for BrdU
BrdU was administered via subcutaneous mini-osmotic pumps (ALZET® Osmotic Pumps, Durect Corporation, Cupertino, CA, USA), at a dose of 15 mg/kg/day, for 7 days before sacrifice. To assess proliferation, the degree of BrdU incorporation in cells in the white and brown adipose tissues was determined by immunohistochemistry, using the staining module Discovery XT from Ventana Medical Systems (Tucson, AZ, USA). All solutions for deparaffinization, pretreatment, counterstaining, detection, and rinsing steps were supplied by Ventana Medical Systems. In brief, paraffin-embedded sections from the subcutaneous white fat (mammary gland area), white fatty lumps, and brown fat (interscapular area) were cut at approximately 4 to 6 µm on SuperFrost slides. Both heat (40 min at 96°C in pH 8) and enzyme digestion (Protease 0,02 U/ml 4-8 min) were used as pretreatment. The primary antibody (mouse anti BrdU, No. M0744, Dako) was added manually at a dilution of 1/50 in PBS. The secondary antibody (biotinylated goat anti-mouse IgG, No. E0433, Dako) was automatically dispensed at a dilution of 1/250 plus 5% normal goat serum in Discovery Ab Diluent (Ventana Medical Systems). The immunohistochemical staining was visualized with diaminobenzidine chromogen (DAB, provided by Ventana Medical Systems), and counterstaining was performed with hematoxylin. After the staining, the slides were dehydrated in rising concentration of ethanol and mounted in Cytoseal XYL (No. 8312-4 Richard-Allan Scientific). Incorporation of BrdU, as identified by positive nuclear immunostaining with the anti-BrdU antibody, was evaluated using a semi-quantitative assessment method. The number of positively labeled cells within each tissue section was estimated using the following grading system: 0 = no labeling, 1 = occasional BrdU-positive cells, 2 = scattered BrdU-positive cells, 3 = moderate number of BrdU-positive cells, 4 = numerous BrdU-positive cells. All BrdU-stained slides were coded and the evaluation performed “blind” as to sample treatment.
Pathology
Animals were euthanized under isoflurane and N2O anesthesia and scheduled for necropsy on the same day the final dose was given. Brain, heart, and liver were weighed. The following samples from fat tissue were taken at necropsy: white subcutaneous ventral fat (mammary gland area), brown subcutaneous fat (interscapular area), mesenteric white fat, perirenal white fat, and subcutaneous fatty lumps (when noticed during necropsy). The tissues were fixed and preserved in neutral buffered formalin. After embedding in paraffin, sections were cut at 4 µm thickness, stained with hematoxylin and eosin, and evaluated by light microscopy.
Total RNA Extraction and TaqMan Low Density Array
Total RNA was extracted using RNeasy Micro Kit (Qiagen Nordic, Sollentuna, Sweden) according to the manufacturer’s protocol. The extracted RNA was eluted in 14 µl RNase-free water, 2 µl was used for RNA analysis using the Pico LabChip (Agilent 2100 Bioanalyzer, Agilent Technologies, Santa Clara, CA, USA), and the rest was stored at 80°C for later reverse transcription–polymerase chain reaction (RT-PCR) analysis. The amount of total RNA was measured with NanoDrop ND-1000 Spectrophotometer (NanoDrop® ND-1000 Technologies, Rockland, DE, USA). All primers and probes were ordered and loaded on low-density array by Applied Biosystems. Three internal control genes, 18S rRNA, GAPDH, and β-actin, were included on the array. Of these, β-actin showed least variance and least tendency toward treatment-related effects and was chosen as internal control for the subsequent analyses. The following gene products were amplified: 18SrRNA (Hs99999901_s1), actin-β (Rn00667869_m1), glyceraldehyde–3-phoshate dehydrogenase (Rn99999916_s1), cyclinD1 (Rn00432359_m1), cyclinD3 (Rn00562751_m1), CD36 antigen (Rn00580728_m1), CCAAT/enhancer binding protein (c/EBP), alpha (Rn00560963_s1), CCAAT/enhancer binding protein (c/EBP), beta (Rn00824635_s1), interleukin1-beta (Rn00580432_m1), peroxisome proliferator activated receptor gamma (Rn00440945_m1), tumor necrosis factor superfamily, member2 (Rn00562055_m1), and relative quantification using the 5’-nuclease PCR assay (TaqMan® gene expression assay, Applied Biosystems, Stockholm, Sweden).
The CT values (i.e., the number of cycles needed to overcome a preset threshold level of fluorescence) were analyzed using the SDS 2.2 software (Applied Biosystems). Each sample was analyzed as duplicates. The mean CT value for a given amplified sequence in a sample was subtracted from the mean CT value of the internal control gene (β-actin mRNA), measured in the same sample. This value is designated ΔCT. The expression level for each sample was calculated as −2ΔCT. This value was expressed as the percentage of the mean expression levels in the appropriate control group.
Statistical Analysis
Statistical analysis of BrdU scores was performed with the nonparametric Kruskal-Wallis test, followed by the Mann-Whitney U-test, two-tailed distribution. In the case of all animals within one group receiving identical scores, the Mann-Whitney U-test could not be used as applied in the GraphPad Prism 4 software. Accordingly, only the Kruskal-Wallis analysis was performed in such cases. A p value of < 0.05 was considered to be statistically significant. All statistical analyses on BrdU scores were performed using the GraphPad Prism 4 software. Gene expression results were analyzed with a parametric one-way analysis of variance (ANOVA) followed by Dunnett’s posttest comparing all treated groups with the relevant control.
Results
Exposure, In Vivo Observations, and Gross Pathology
Analysis of tesaglitazar in plasma revealed that the exposure to tesaglitazar increased proportional with increasing doses (0, 1, 3, and 10 µmol/kg); Cmax values ranged from 1.06 µM to 25.7 µM and were similar to exposure levels in the previous carcinogenicity study (Hellmold et al. 2007). The body weights were not affected in the tesaglitazar groups; however, animals dosed with tesaglitazar at 3 and 10 µmol/kg for 24 weeks showed statistically significant increases of food consumption during part of or the whole dosing period. Other findings associated with chronic dosing of PPARα/γ agonists in rodents, such as liver and heart weight increases, occurred as expected and have previously been described for tesaglitazar (Hellmold et al. 2007). Analysis of plasma showed decreases in cholesterol, triglycerides, and glucose in all dose groups receiving tesaglitazar and at all timepoints, which was in line with previously reported data (data not shown). Thickened areas of the skin (subcutaneous fatty lumps) located interscapular, axillary, and/or inguinal were found in all animals at the highest dose level (10 µmol/kg) by weeks 12 and 24 and also appeared in 50% of the rats at the intermediate dose level (3 µmol/kg) by week 24. The rats in the low dose group (1 µmol/kg) did not develop any fatty lumps. The fatty lumps were totally reversed in the recovery group (data not shown).
Microscopic Pathology
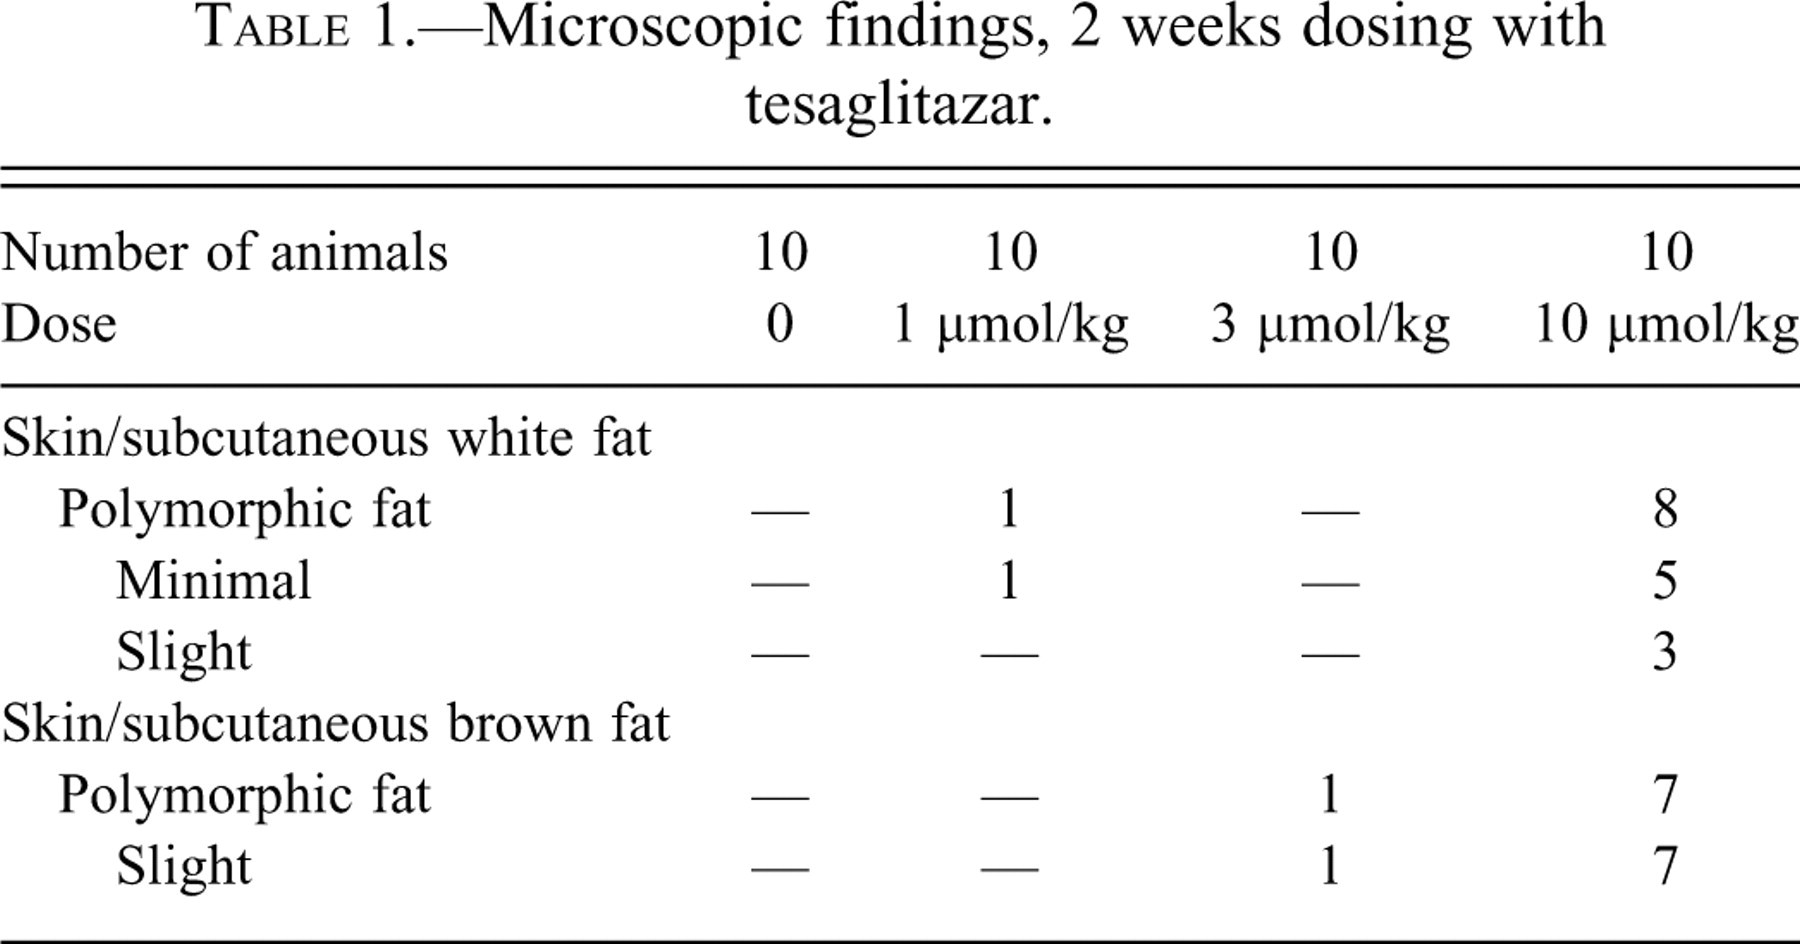
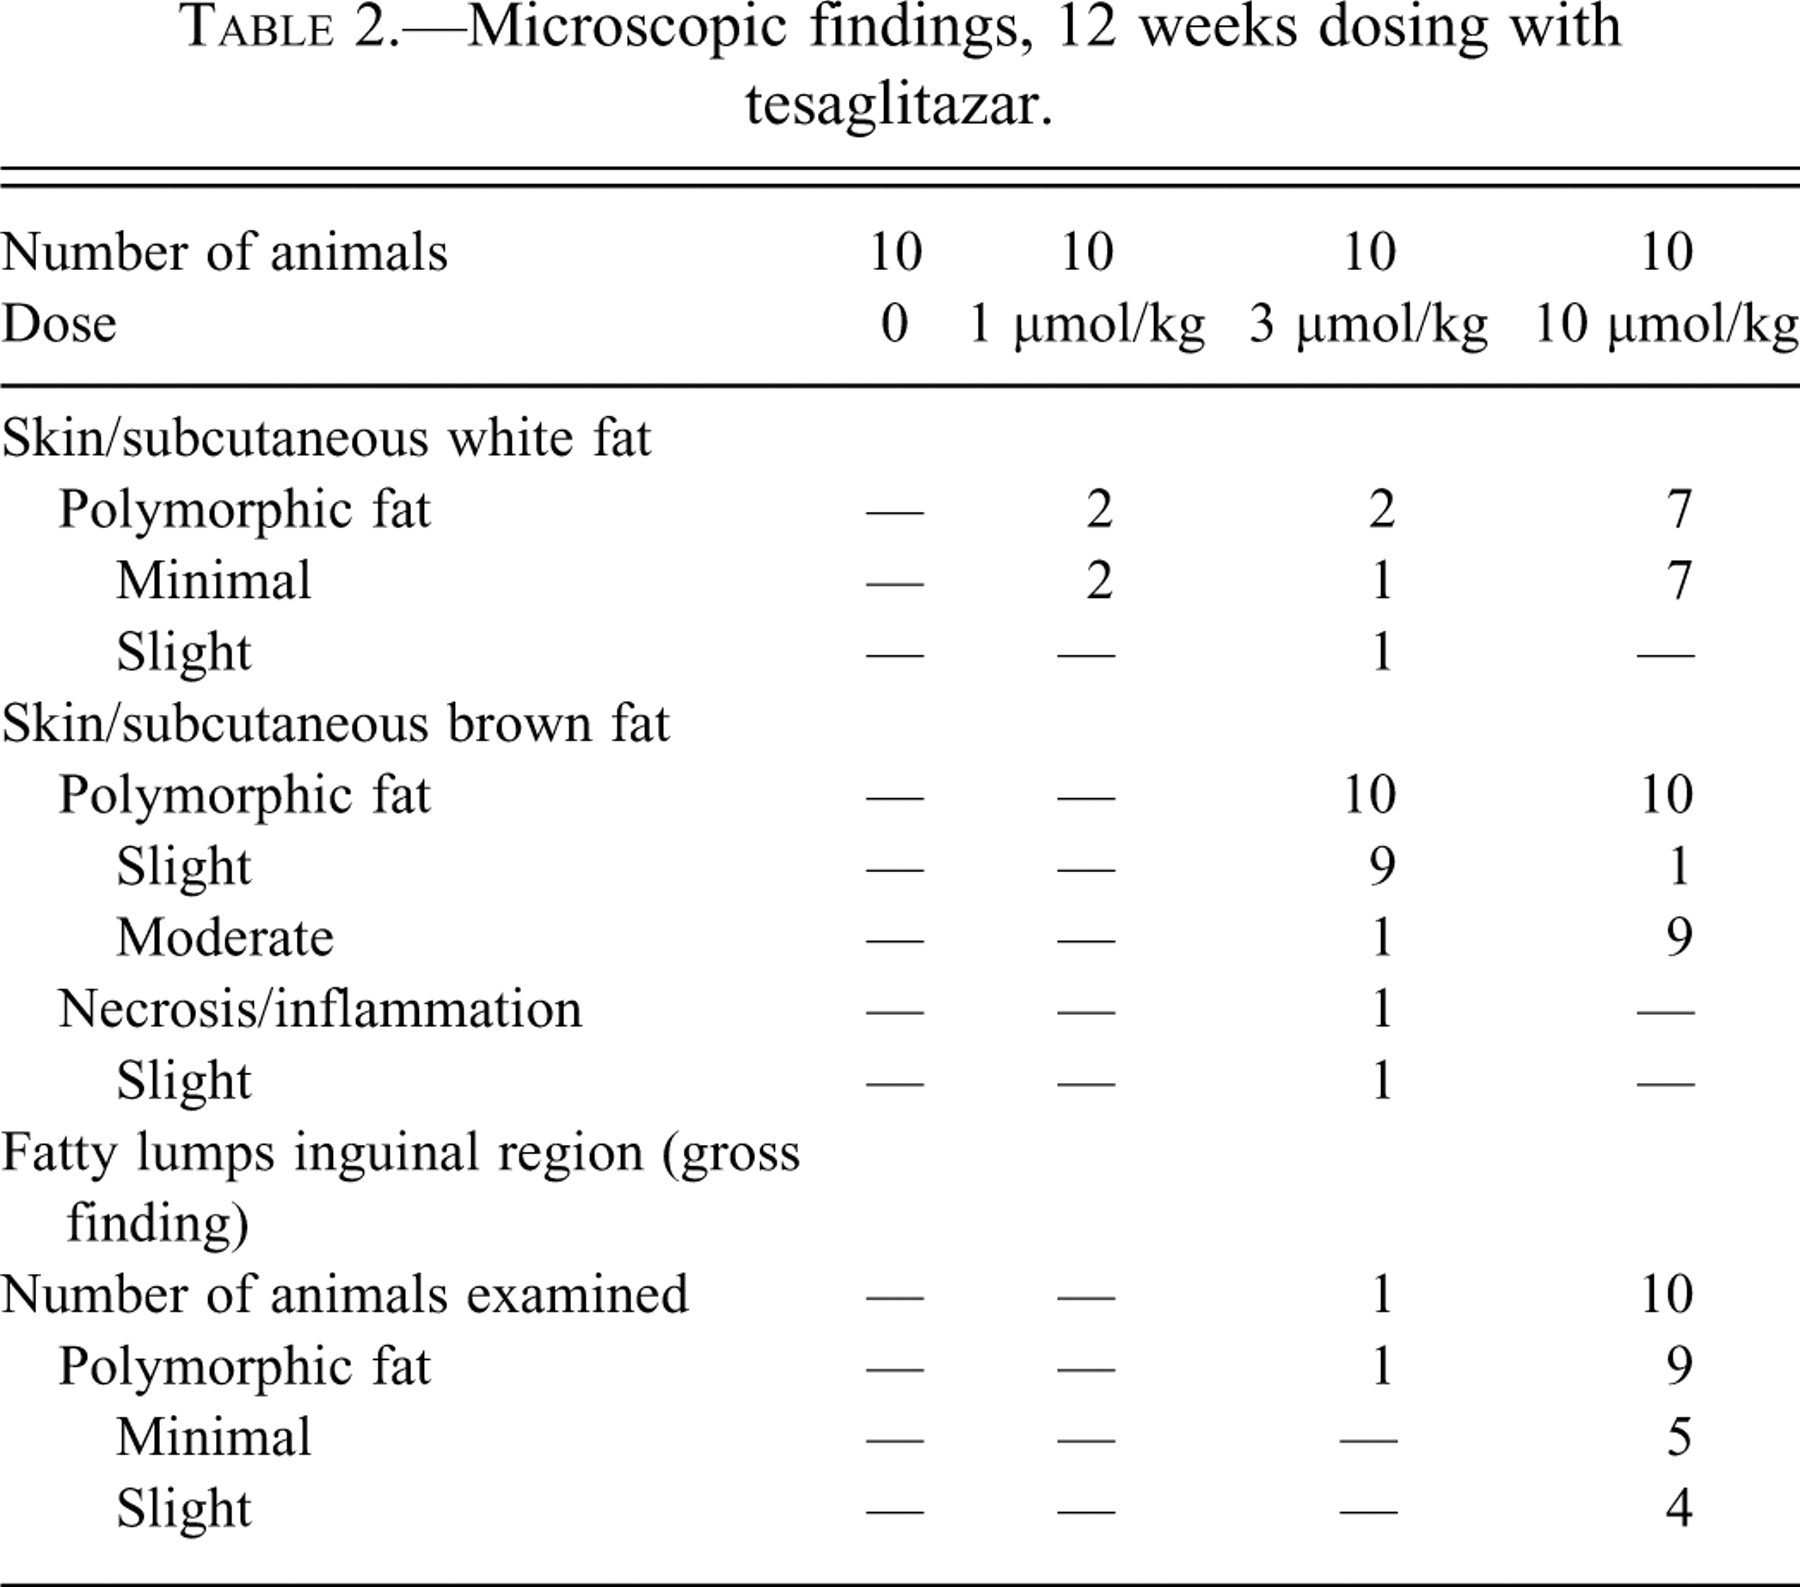
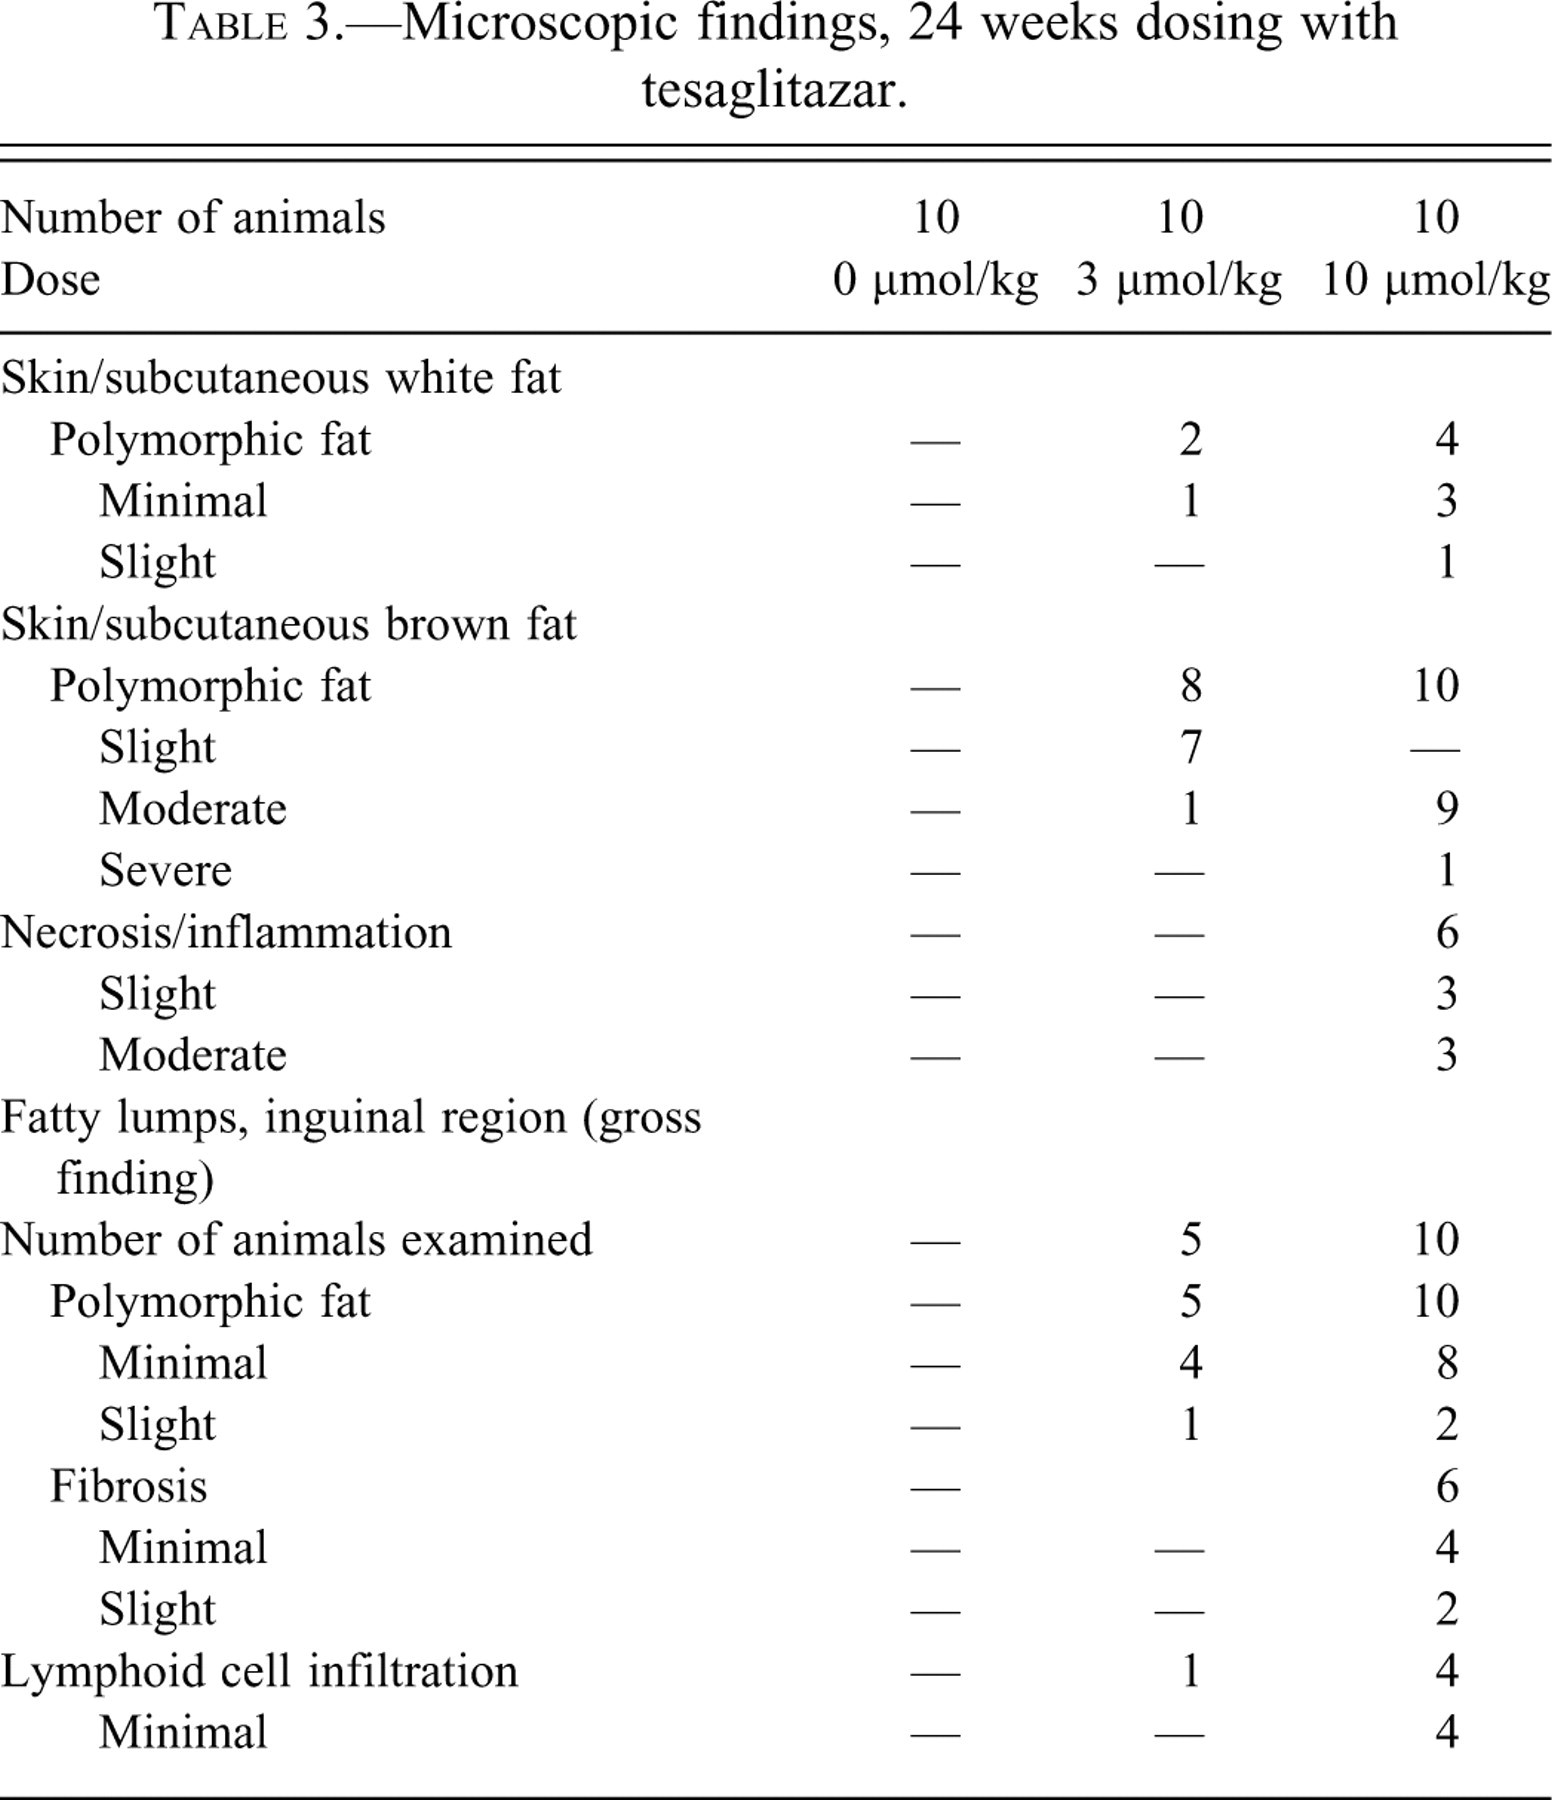
All of the pathological changes occurring weeks 2, 12, and 24 in white and brown fat after dosing with tesaglitazar are summarized in Tables 1 through 3. The normal microscopic appearance of white and brown fat is illustrated in Figures 1A and D.
Microscopic findings, 2 weeks dosing with tesaglitazar.
Microscopic findings, 12 weeks dosing with tesaglitazar.
Microscopic findings, 24 weeks dosing with tesaglitazar.
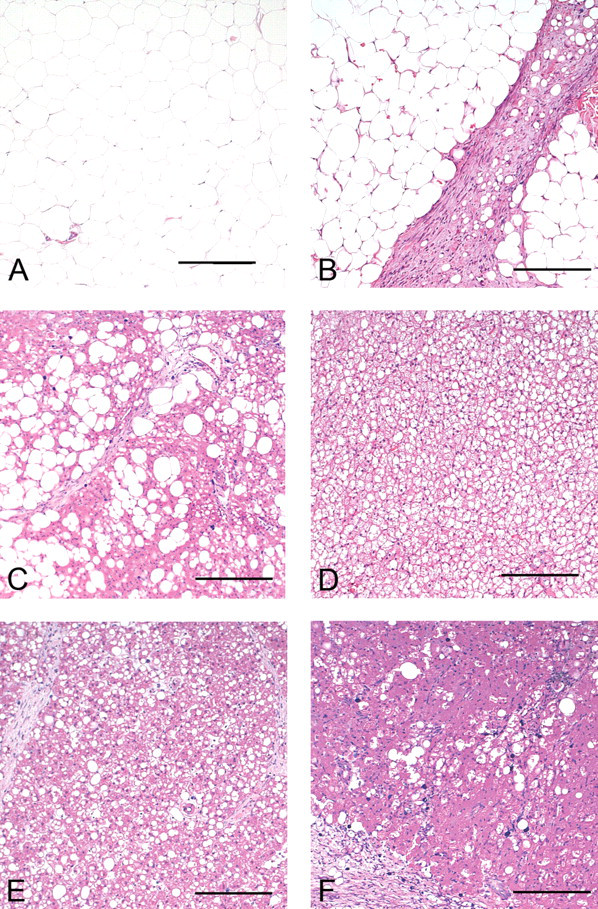
Microscopic pictures (hematoxylin and eosin) of normal subcutaneous white adipose tissue (A) from animal receiving vehicle for 2 weeks. The white fat cells are of approximately the same size and every cell contains one fat vacuole. Subcutaneous fatty lumps with fibrosis (B) between polymorphic fat cells without inflammatory infiltration. Animal received tesaglitazar (10 µmol/kg) for 24 weeks. Subcutaneous fatty lumps (C) with moderate polymorphism of the adipose tissue and infiltration of inflammatory cells is seen together with fibrosis from animal receiving tesaglitazar (10 µmol/kg) for 24 weeks. Normal brown adipose tissue from animal receiving vehicle for 2 weeks (D). Polymorphic brown adipose tissue (E) with fat vacuoles of varying size is seen. The animal received tesaglitazar (10 µmol/kg) for 12 weeks. Brown adipose tissue showing pronounced polymorphism with areas of fibrosis and inflammatory cell infiltration (F) in an animal receiving tesaglitazar (10 µmol/kg) for 24 weeks. All scale bars = 200 µm.
After 2 weeks of treatment, polymorphic fat, characterized by variability in the size of adipocytes, increased number of small cytoplasmic fat vacuoles, and increased eosinophilia of the cytoplasm of adipocytes, occurred in both subcutaneous white and brown fat, mainly in the high dose (defined in the discussion and illustrated in Figure 1B and E, Table 1).
After 12 weeks of treatment, the incidence and severity of polymorphic fat in the high-dose group increased for the brown fat, whereas there was a slight decrease of polymorphic fat in white fat. In addition, rats in the intermediate-dose group (3 µmol/kg) showed polymorphism in both white and brown fat, and a few rats in the low dose (1 µmol/kg) for white fat only (Table 2). The morphology of fatty lumps was microscopically indistinguishable from white subcutaneous adipose tissue with the same appearance of polymorphic fat. White and brown fat polymorphism, including fatty lumps, was reversible and could not be observed after the 12-week recovery period.
After 24 weeks, there was almost a 50% reduction in the incidence of polymorphic white fat in the high-dose group, compared with the 2-week timepoint (Table 3). In contrast, the polymorphism in brown fat further increased and areas of necrosis and inflammation occurred in the brown fat (Figure 1E-F). The fat polymorphism in the fatty lumps was comparable with the findings at 12 weeks, but in addition, areas of fibrosis and lymphoid cell infiltration occurred in the high-dose rats (Figure 1C).
Effects on Proliferation
In the white and brown adipose tissues, and in the subcutaneous fatty lumps, the majority of BrdU-positive cells were identified as interstitial mesenchymal cells. Dosing with tesaglitazar caused a statistically significant increase in BrdU-positive cells in white adipose tissue at all dose levels at 2 weeks (Figure 2A). By 12 weeks, the proliferative effect decreased drastically and was only statistically significant for the high-dose group (Figure 2B), which was in accordance with our previous study (Hellmold et al. 2007). At 24 weeks, the number of BrdU-positive cells in the white adipose tissue at 3 and 10 µmol/kg returned to levels almost similar to controls (Figure 2C). As shown in Table 4, the number of proliferating cells in fatty lumps in the high dose group was higher (7 out of 10 animals scored ≥ grade 2 in BrdU staining) than that observed in normal white adipose tissue of the same individuals (2/10 animals scored ≥ grade 2); still this change did not reach statistical significance (p > .05, Mann-Whitney U-test). However, in comparison with the vehicle group, there was a significant (p < .01 Mann-Whitney U-test) increase in the number of proliferating cells in fatty lumps of high-dose animals as compared with normal white adipose tissue. After 12 weeks recovery, there was a complete reversibility of the proliferative effect in white adipose tissue (data not shown).
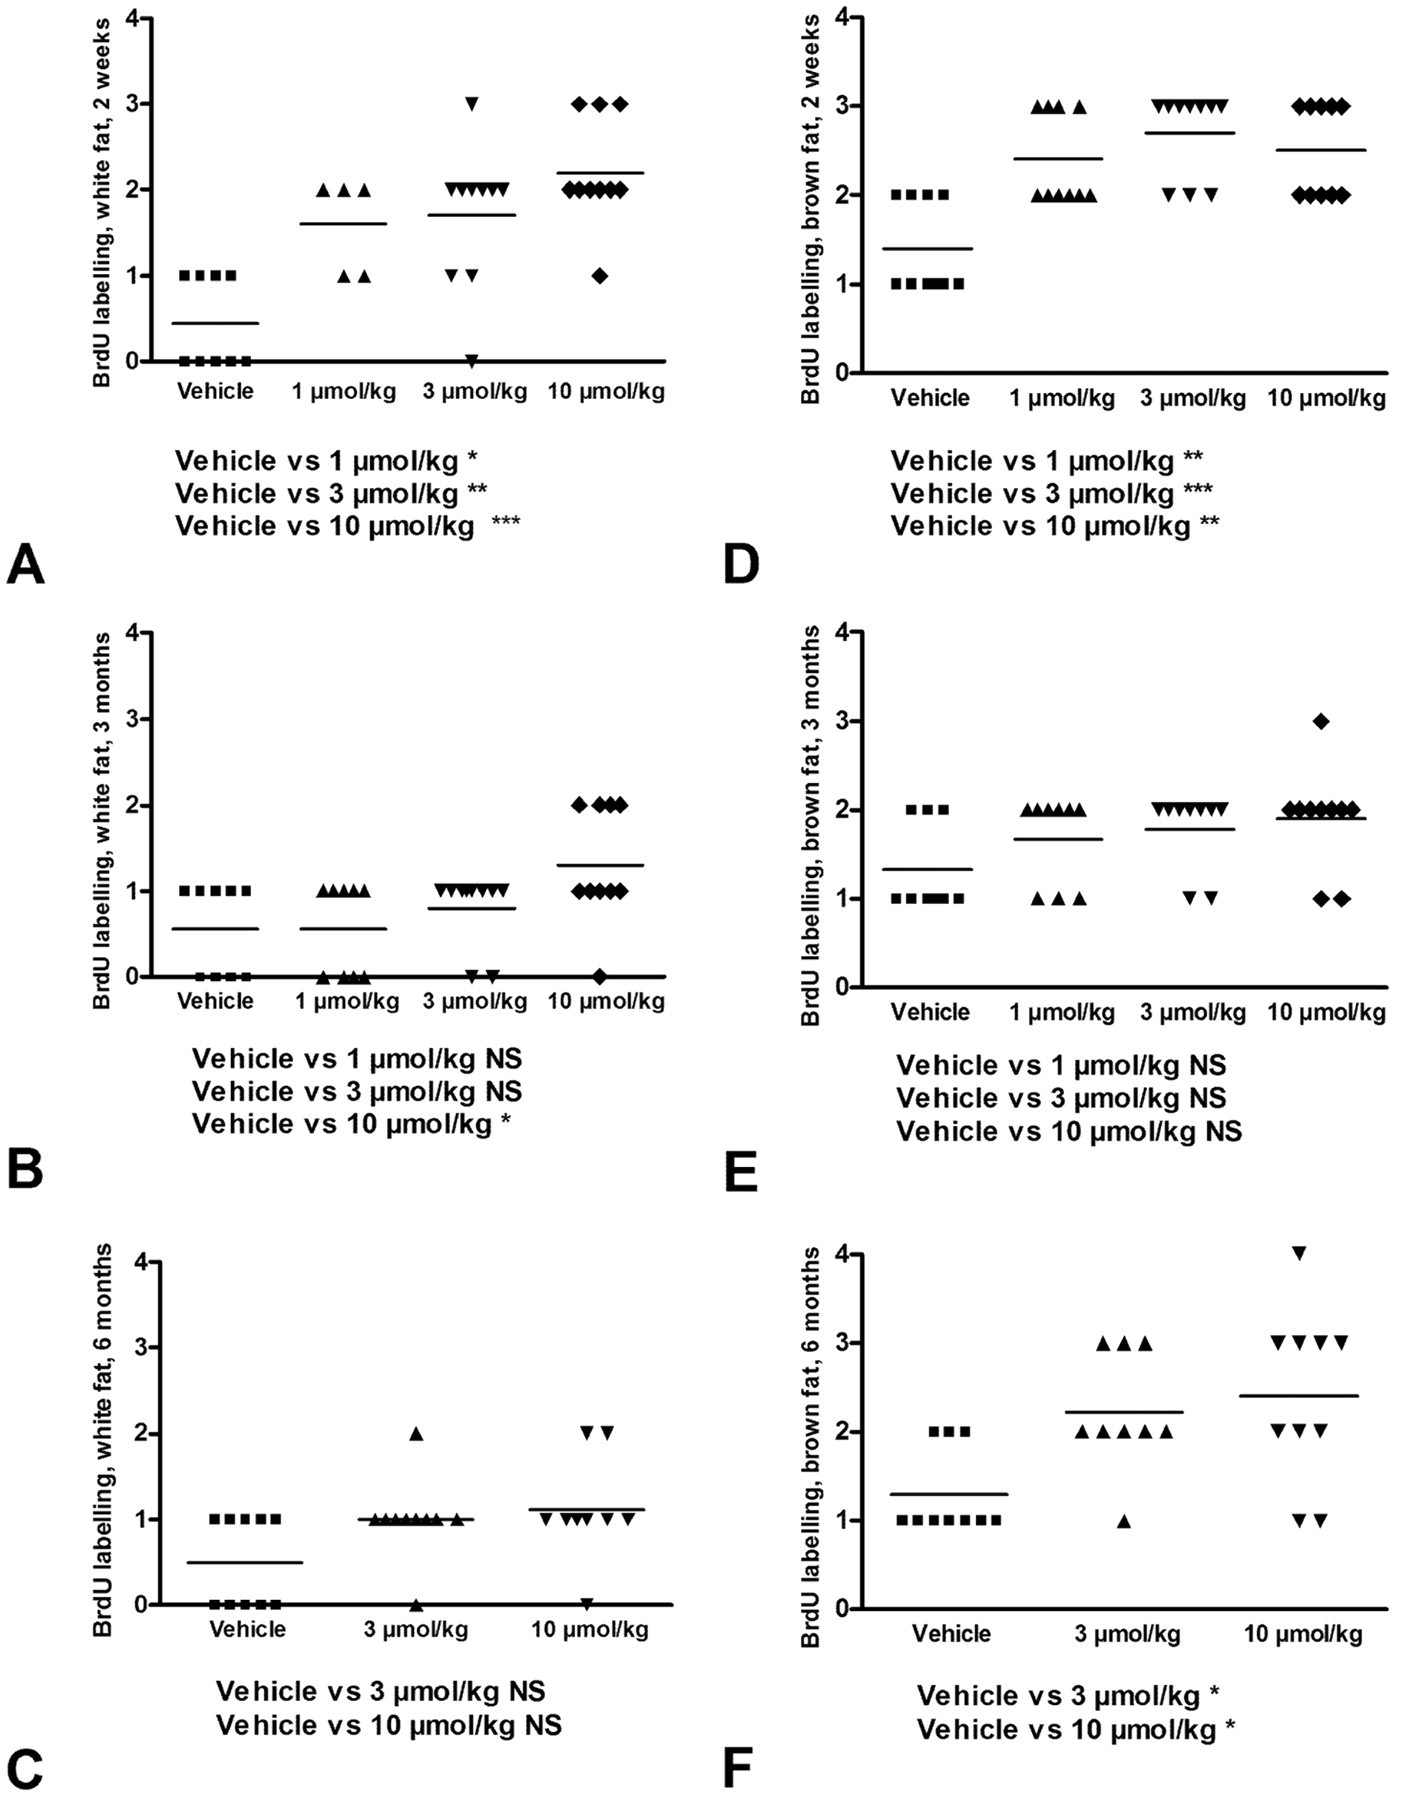
Semi-quantitative estimation of number of BrdU-positive cells in white (A, B, C) and brown (D, E, F) adipose tissue following 2 (A, D), 12 (B, E), or 24 weeks (C, F) dosing with tesaglitazar. Figures on Y-axis refer to the grading system used, where 0 = no labeling, 1 = occasional BrdU-positive cells, 2 = scattered BrdU-positive cells, 3 = moderate number of BrdU-positive cells, and 4 = numerous BrdU-positive cells. Horizontal bar = mean value.
BrdU counting per individual animal at 24 weeks.
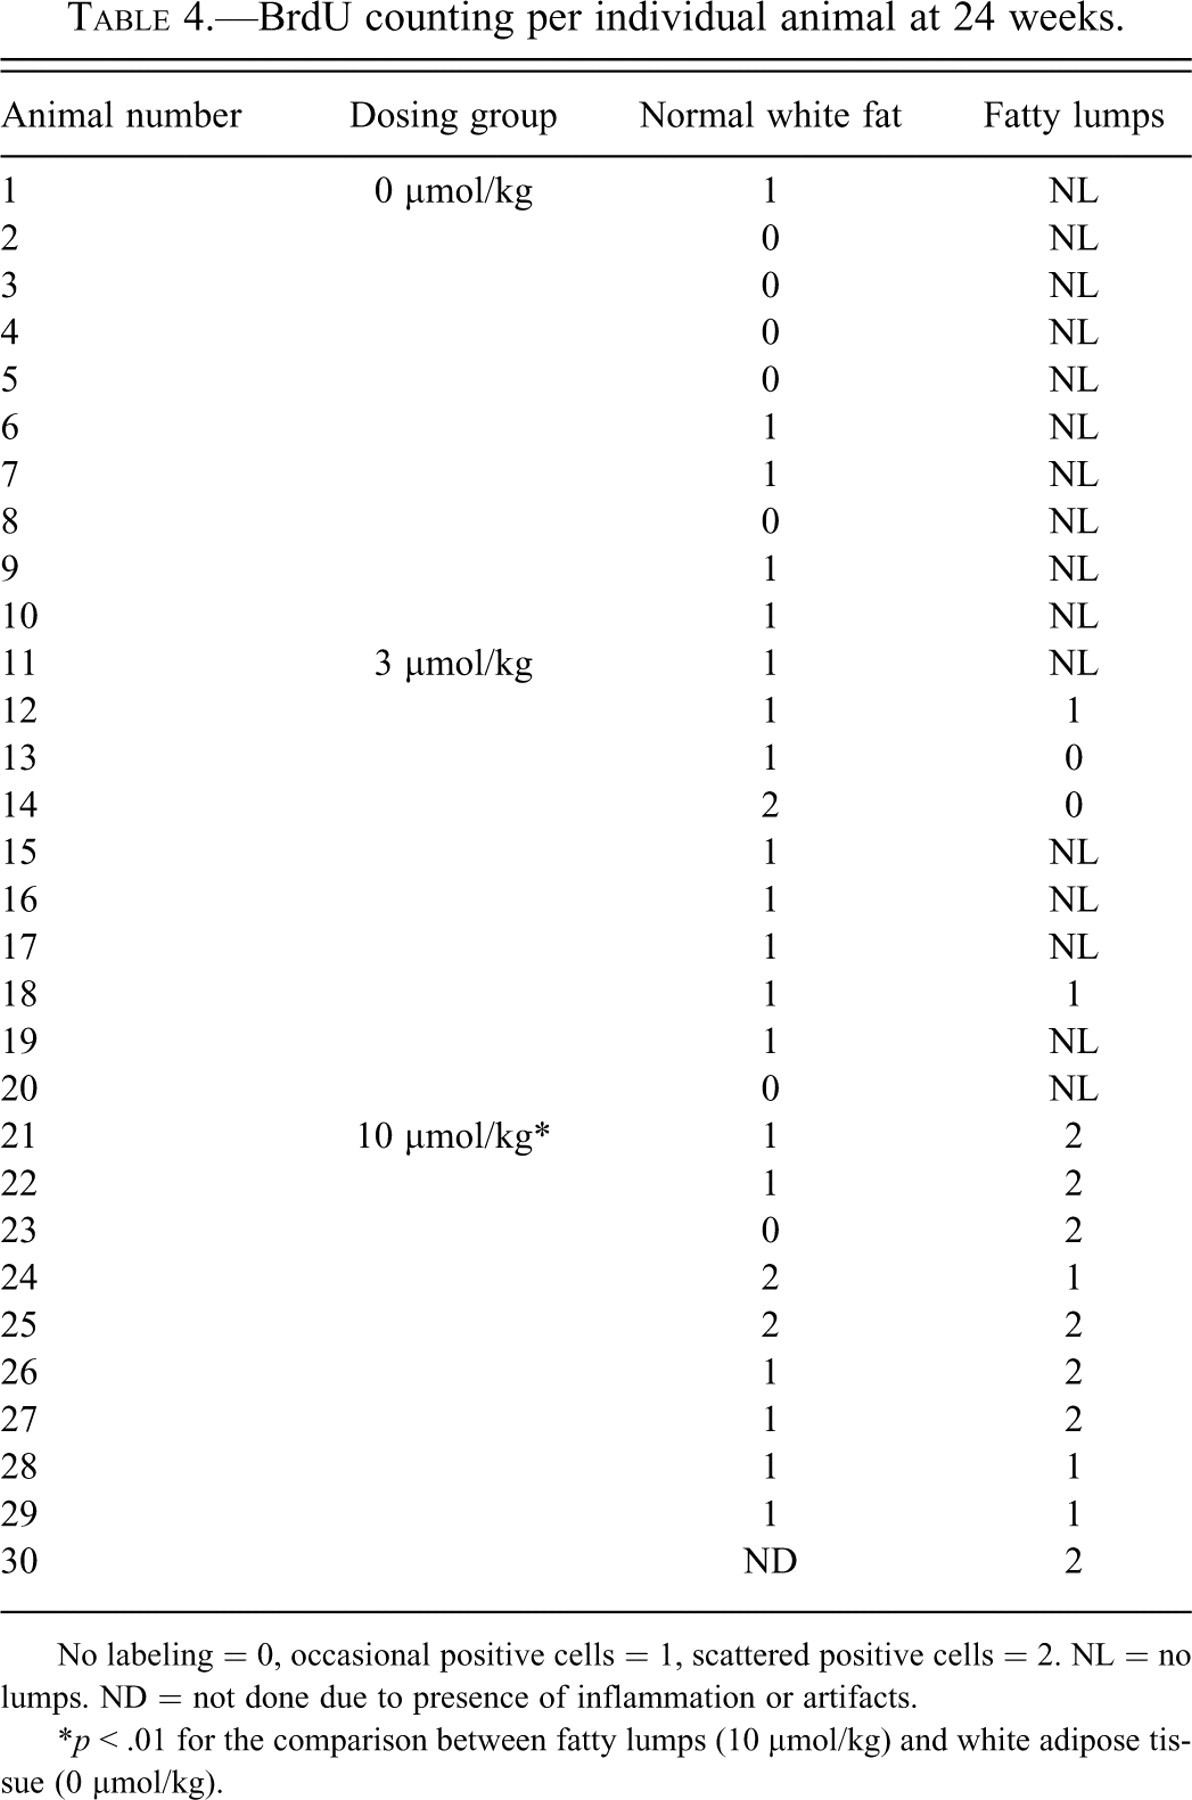
No labeling = 0, occasional positive cells = 1, scattered positive cells = 2. NL = no lumps. ND = not done due to presence of inflammation or artifacts.
*p < .01 for the comparison between fatty lumps (10 µmol/kg) and white adipose tissue (0 µmol/kg).
In the brown adipose tissue, tesaglitazar caused a significant increase in BrdU-positive cells at all dose levels at 2 weeks (Figure 2D). Unlike white adipose tissue, the increase in BrdU-positive cells was not sustained at 12 weeks (Figure 2E). However, at 24 weeks, the number of BrdU-positive cells was again significantly and dose-dependently increased at both intermediate- and high-dose levels (3 and 10 µmol/kg) (Figure 2F).
Gene Expression Analysis
To better understand the potential mechanisms that underlie the morphological changes described previously, we used a TaqMan low-density array to measure a selection of genes that have been shown to be of importance in adipocyte proliferation and differentiation from previous in vitro and in vivo studies (Bertile et al. 2003; Evans, Barish, and Wang 2004; Farmer 2006; Gesta, Tseng, and Kahn 2007; Lee, Olson, and Evans 2003). The CD36 gene, which is induced by ligand-activated PPARγ (Zhou et al. 2008), was included in the analysis in order to monitor the direct transcriptional effects on PPARγ of tesaglitazar in adipose tissue (Figure 3 ). CD36 mRNA expression showed a significant induction at 2 weeks, although only in the high-dose group. At the 12- and 24-week timepoints, CD36 mRNA expression was significantly increased both in white fat and in subcutaneous fatty lumps, in all dose groups. Expression of PPARγ, an important transcription factor for adipocyte differentiation, followed a cyclic pattern during the time course and was significantly reduced at the low and intermediate dose groups (1 and 3 µmol/kg) at 2 weeks, whereas the high dose was not different from vehicle-treated animals at this timepoint (Figure 4 ). In contrast, at 12 weeks, the PPARγ expression was increased in all dose groups relative to the vehicle group, although the high-dose group did not reach statistical significance. Again at 24 weeks, no difference in PPARγ expression for the intermediate and high-dose groups was observed, compared with the control group.
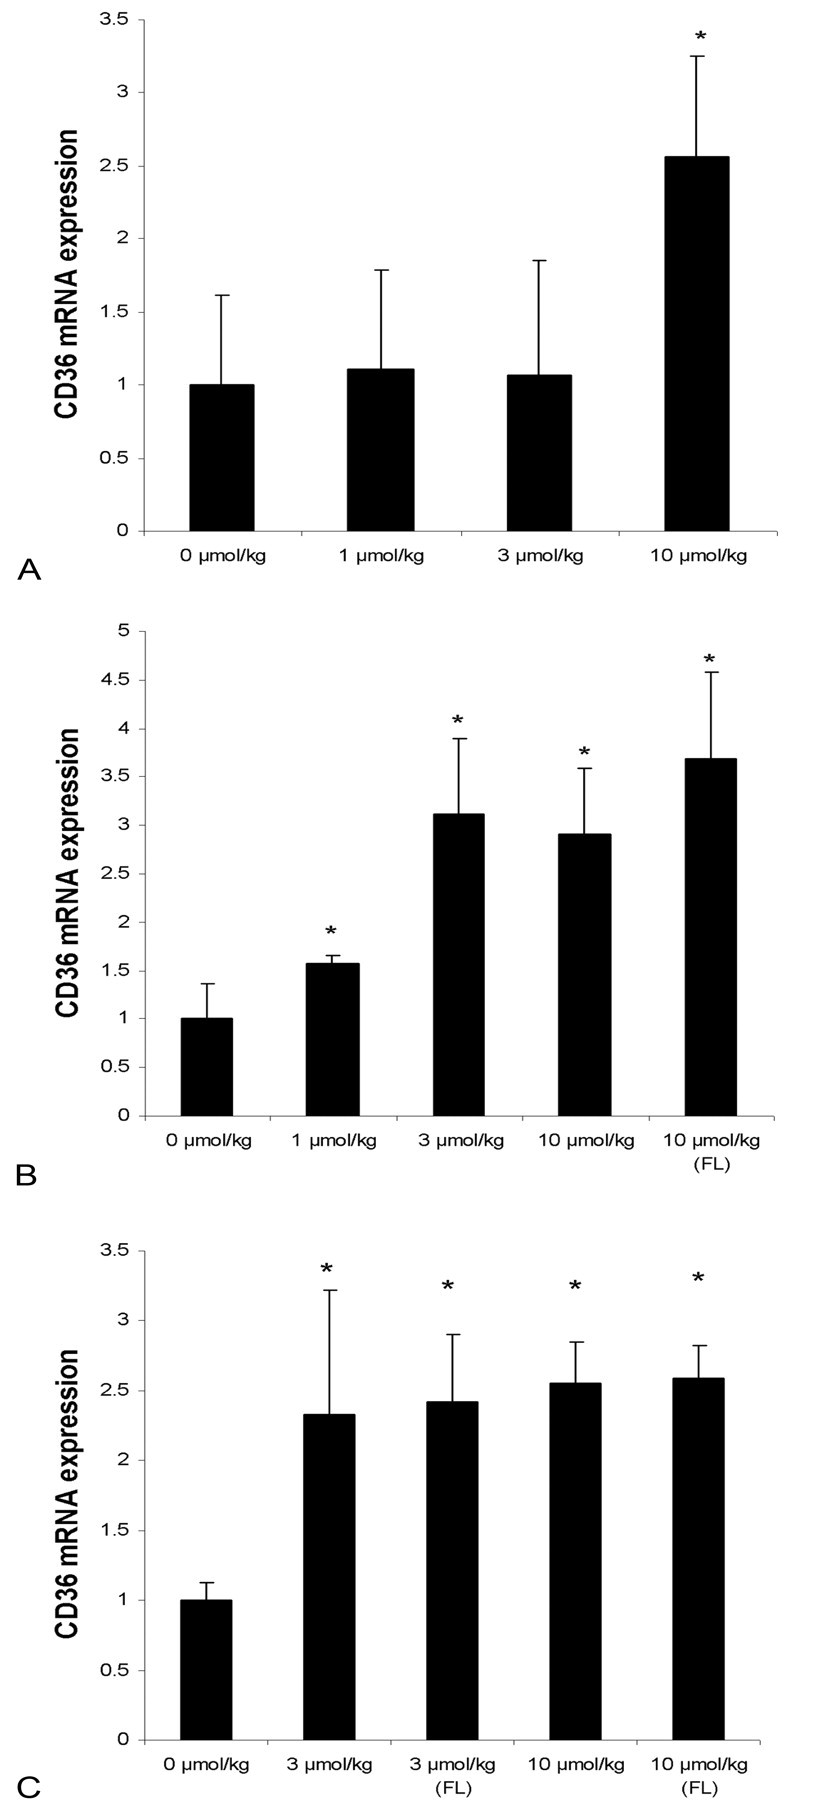
Relative mRNA expression (fold induction) of the CD36 gene in white adipose tissue and subcutaneous fatty lumps (FL) after dosing with tesaglitazar (1-10 µmol/kg). 0 µmol/kg represents the vehicle group. A, B, and C diagrams are data from 2, 12, or 24 weeks, respectively. Diagram bars represent mean ± SD values and asterisks (*) a statistically significant difference toward vehicle group, p < .05.
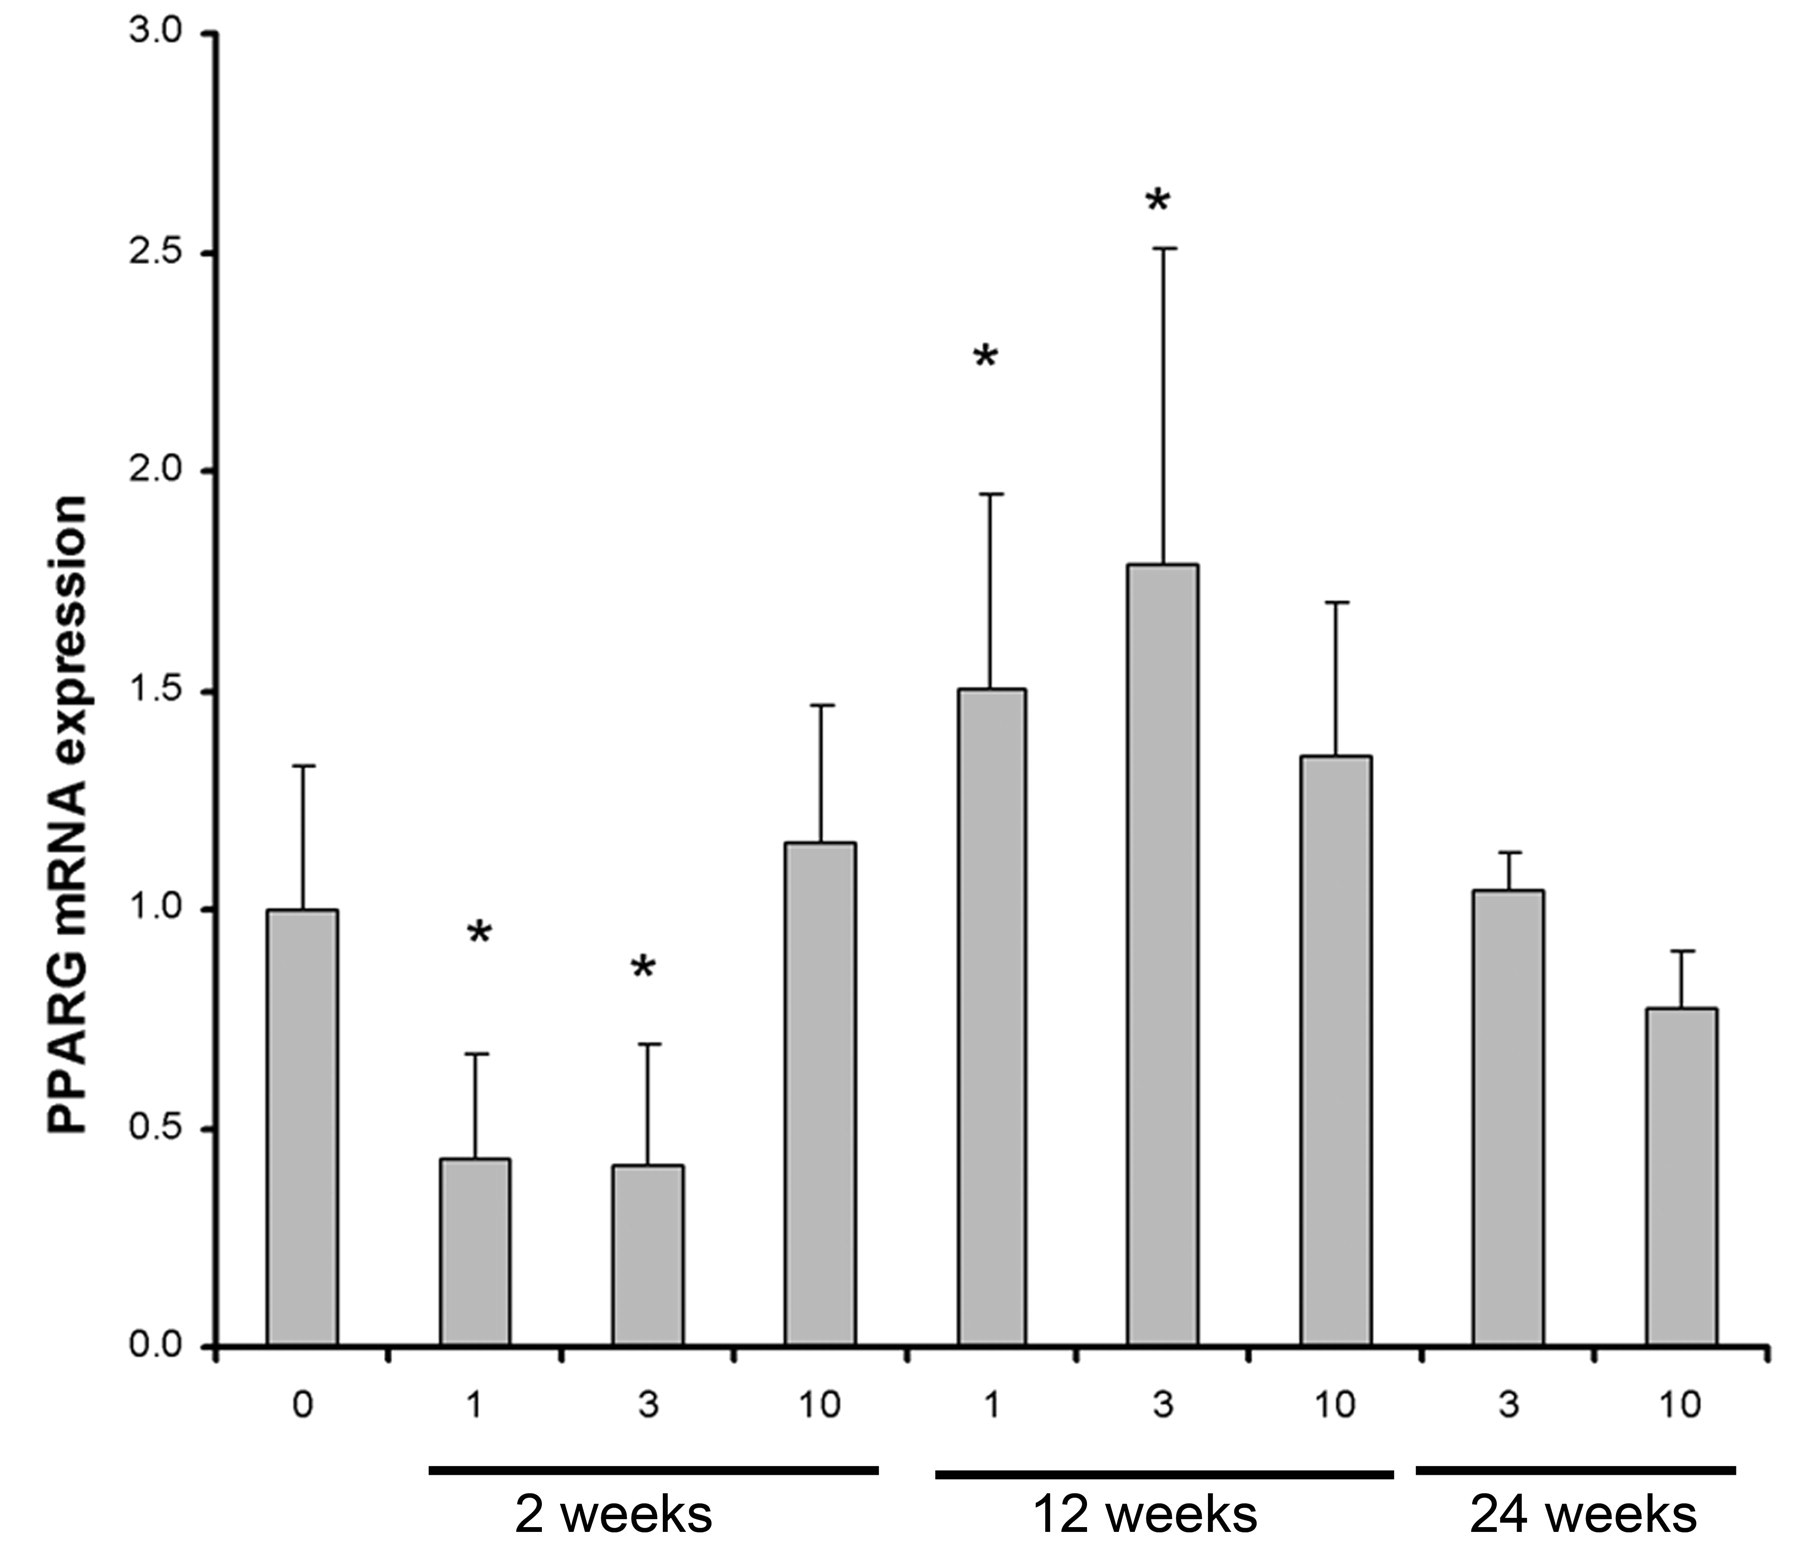
Relative mRNA expression (fold induction) of PPARγ in white adipose tissue after dosing with tesaglitazar (1-10 µmol/kg) for 2, 12, or 24 weeks. 0 µmol/kg represents the vehicle group. Diagram bars represent mean ± SD values and asterisks (*) a statistically significant difference toward vehicle group, p < .05.
Analysis of mRNA expression of cyclin D1 and cyclin D3 could potentially serve as an indicator for the proliferative state of the adipocyte population. Both the expression and the variability in cyclin D1 and D3 expression were significantly reduced in the control group as a function of time in white adipose tissue (supplemental material). Dosing with tesaglitazar did not alter the expression of cyclin D1 or cyclin D3 mRNA after 2 weeks in white adipose tissues (Figure 5A); however, by 12 weeks there was a significantly increased expression of cyclin D3 and reduced expression of cyclin D1 in all dose groups (Figure 5B). In white adipose tissue, this cyclin D switch remained at 24 weeks, albeit slightly less pronounced (Figure 5C), whereas in fatty lumps, cyclin D1 and cyclin D3 expression was not statistically different from controls.
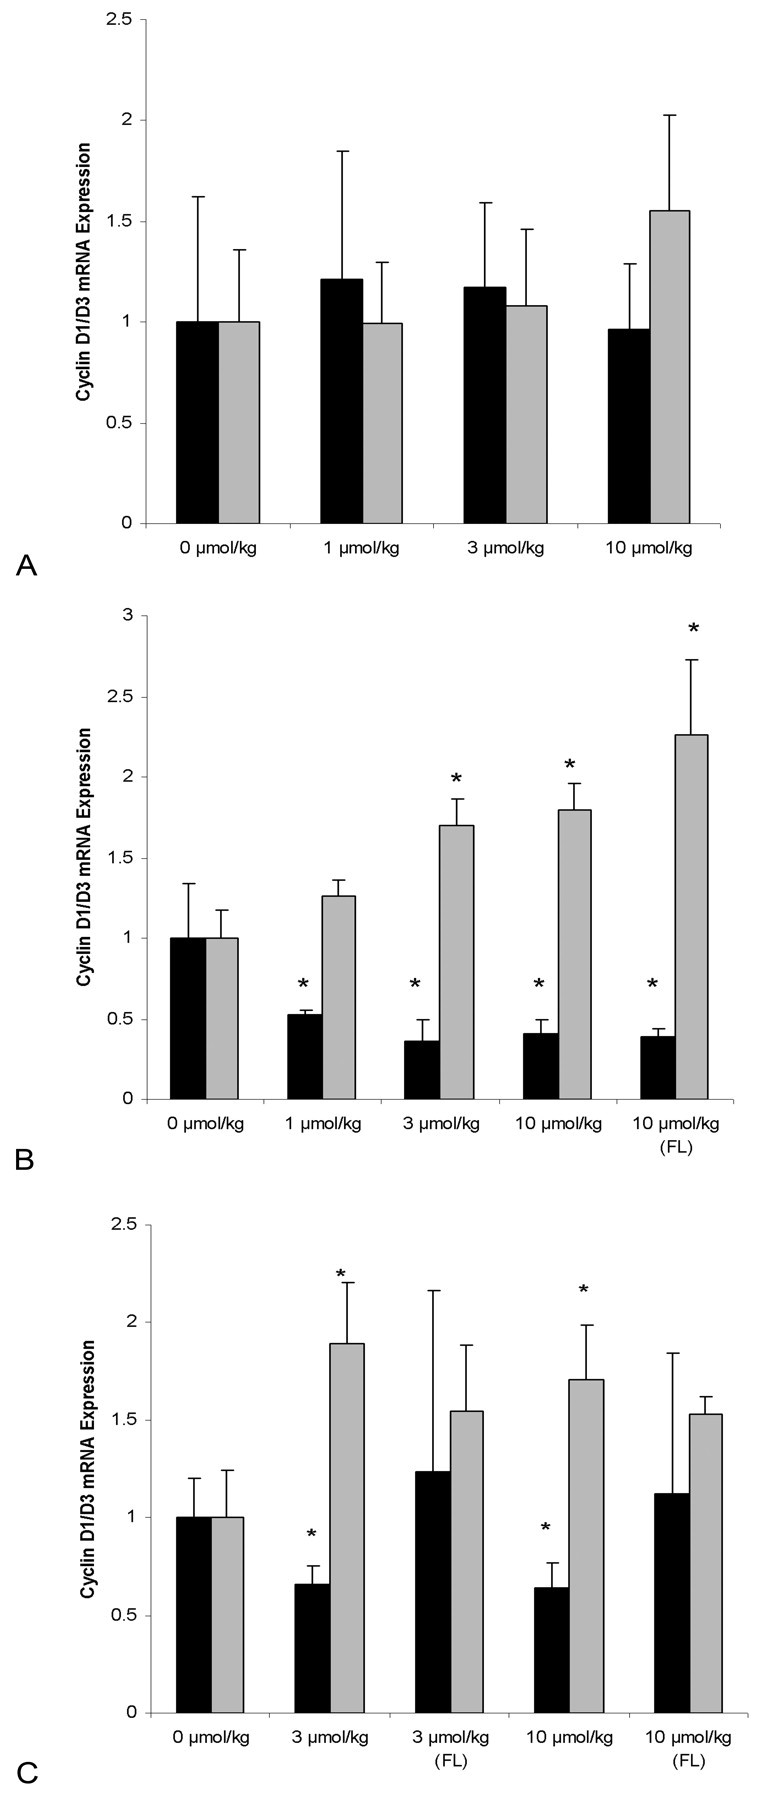
Relative mRNA expression (fold induction) of cyclin D1 (black bar) and Cyclin D3 (gray bar) in white adipose tissue and subcutaneous fatty lumps (FL) after treatment with tesaglitazar (1-10 µmol/kg). 0 µmol/kg represents the vehicle group. A, B, and C diagrams are data from 2, 12, or 24 weeks, respectively. Diagram bars represent mean ± SD values, and asterisks (*) represent a statistically significant difference toward vehicle group, p < .05.
Regarding C/EBP and PPARγ transcription factors: there were no statistically significant changes at 2 weeks (Figure 6A) in either of the genes (C/EBPα, C/EBPβ). At 12 weeks, only C/EBPα was significantly increased in white fat, but not in subcutaneous fatty lumps (Figure 6B). At 24 weeks, a significant increase of C/EBPβ was observed in both fat types (Figure 6C). The expression was also significantly higher in subcutaneous fatty lumps than in regular subcutaneous white fat depots at both intermediate and high-dose groups. The expression of C/EBPα was still elevated in white fat, but this was not statistically significant when compared to the control group. However, a significant increase of C/EBPα was observed at 24 weeks in subcutaneous fatty lumps, a gene that remained unaffected after the 12-week dosing period.
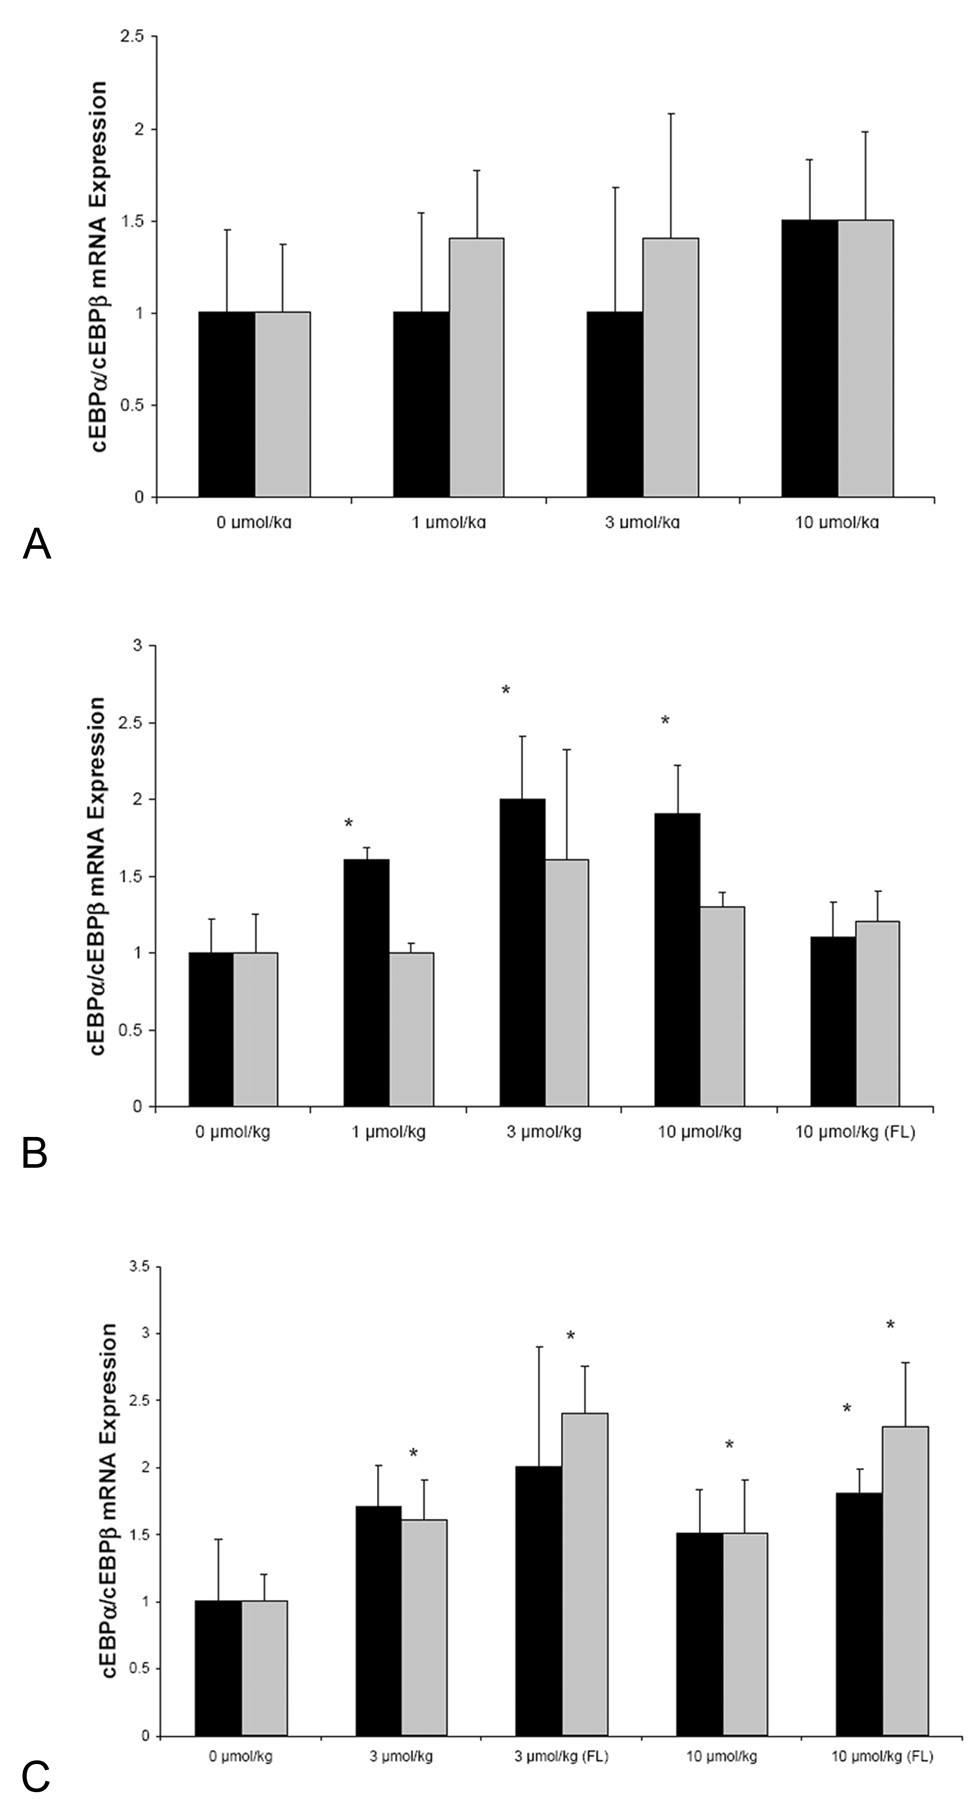
Relative mRNA expression (fold induction) of c-EBPα (black bar) and c-EBPβ (grey bar) in white adipose tissue and subcutaneous fatty lumps (FL) after dosing with tesaglitazar (1-10 µmol/kg). 0 µmol/kg represents the vehicle group. A, B, and C diagrams are data from 2, 12, or 24 weeks, respectively. Diagram bars represent mean ± SD values and asterisks (*) a statistically significant difference toward vehicle group, p < .05.
The expression of the proinflammatory cytokines IL-1β and TNF-α were measured as markers of local inflammatory response (Figure 7 ). At 24 weeks only, there was a statistically significant induction of IL-1β in both regular white fat and in fatty lumps in the high-dose group (Figure 7A). In addition, TNF-α was induced in fatty lumps both in the intermediate and high-dose groups at this time period only (Figure 7B).
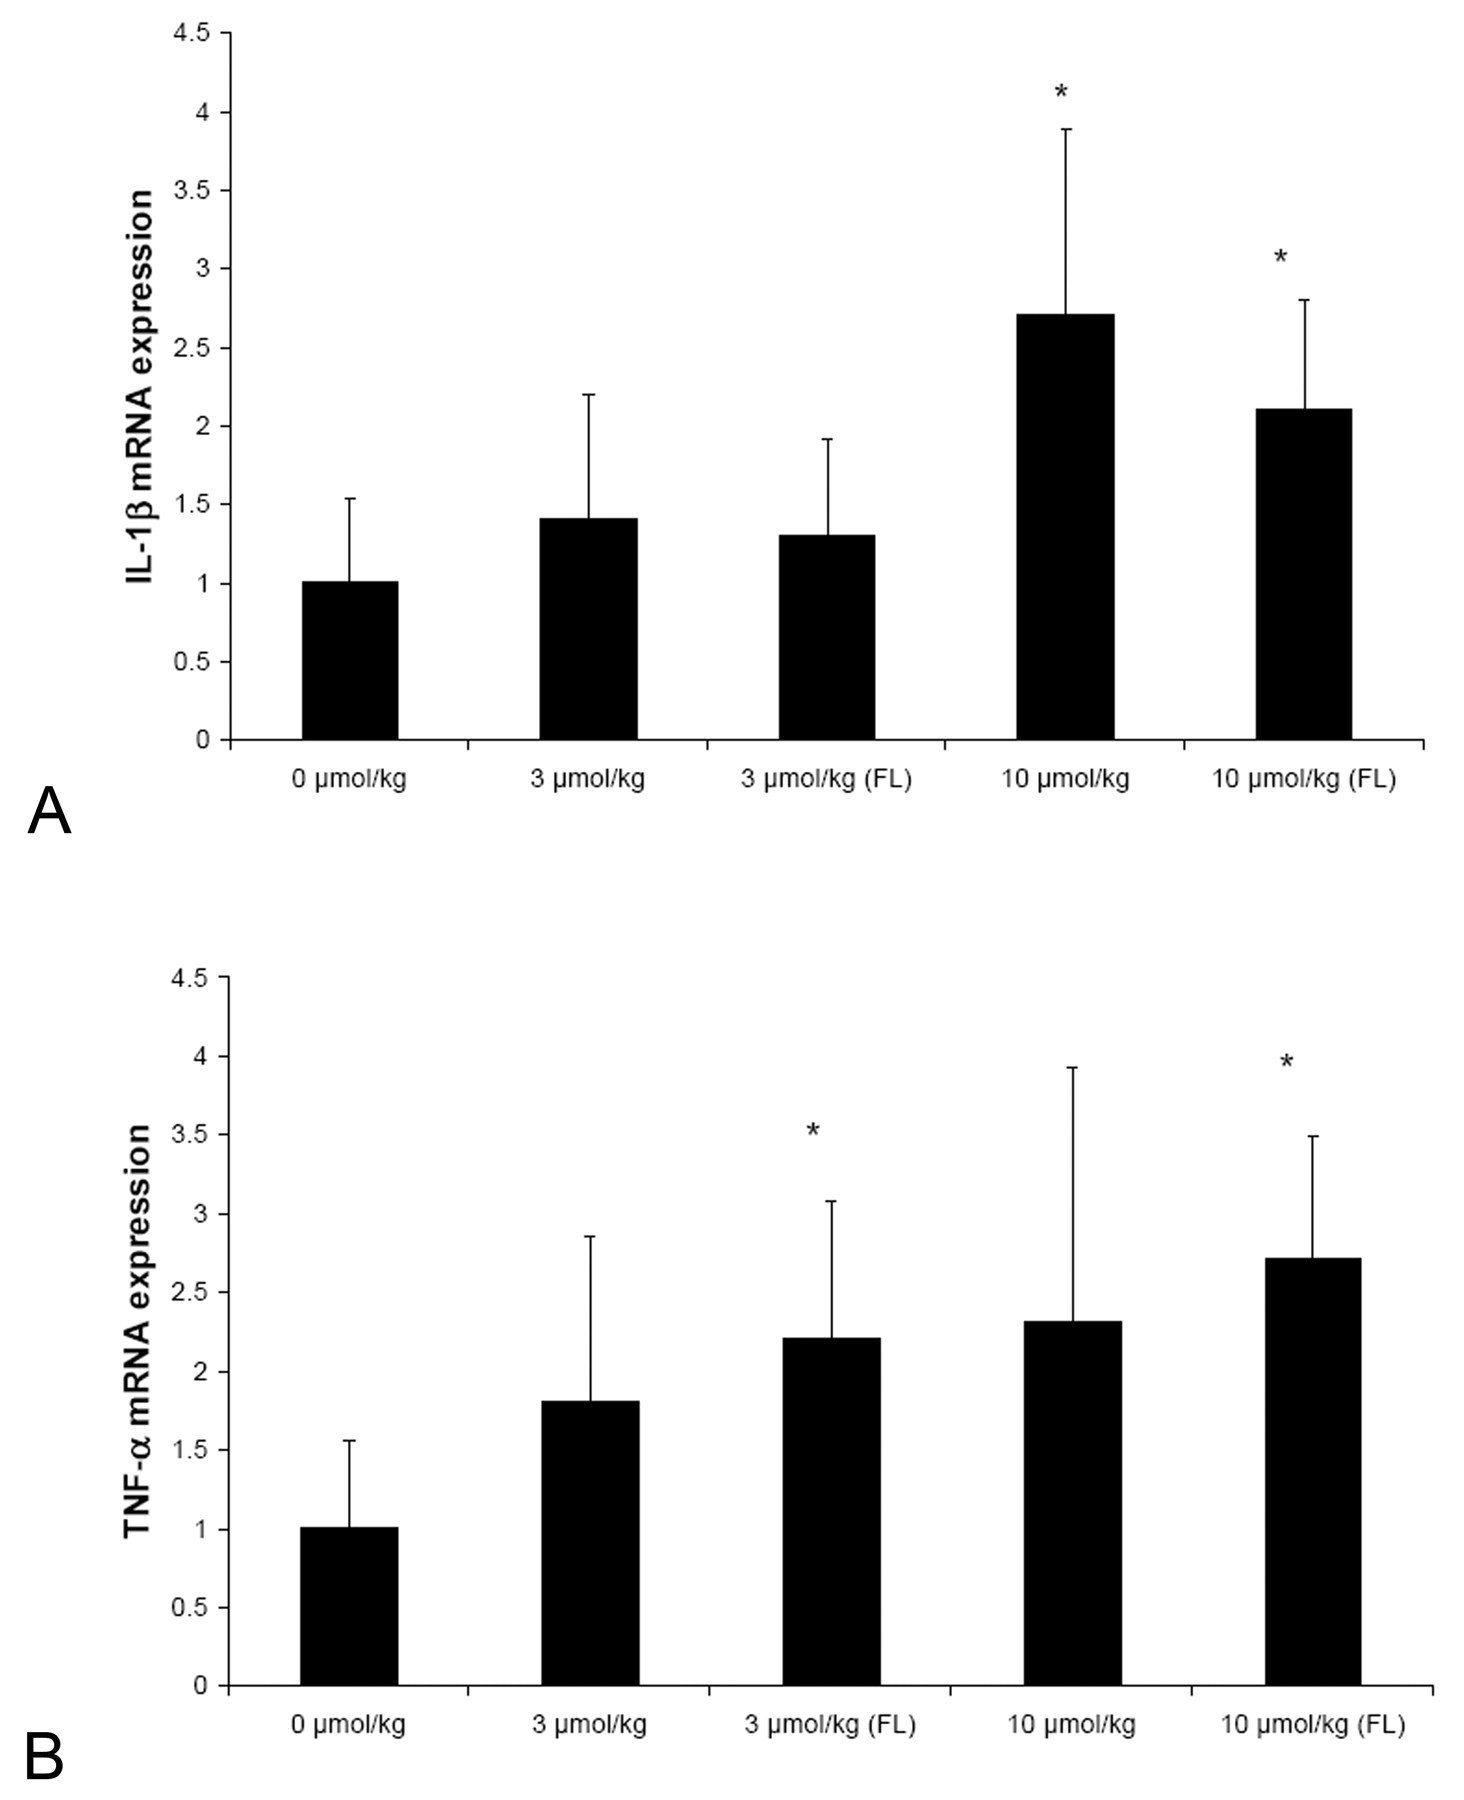
Relative mRNA expression (fold induction) of TNF-α (A) and IL-1β (B) in white adipose tissue and subcutaneous fatty lumps (FL) after dosing with tesaglitazar (1-10 µmol/kg) for 24 weeks. 0 µmol/kg represents the vehicle group. Diagram bars represent mean ± SD values and asterisks (*) a statistically significant difference toward vehicle group, p < .05.
Discussion
In a previous carcinogenicity study with the PPARα/γ agonist, tesaglitazar, the high dose (10 µmol/kg) caused mesenchymal tumors (fibrosarcomas) with an incidence of 13 out of 50 in male rats and 5 out of 50 in female rats (Hellmold et al. 2007). The majority of the subcutaneous fibrosarcomas were found in the abdominal region (both dorsal and ventral), and the rest were found on the ventral or dorsal thorax, in the axillae, and on the limbs. None were present in the interscapular region. These tumors were locally very invasive and the exact subcutaneous tissue of origin could not be determined. In order to aid human risk assessment of tesaglitazar, the current study was designed to further investigate key end points in the hypothesized mode of action for induction of fibrosarcomas by tesaglitazar, namely, time-dependence, dose-response, and reversibility of end points such as proliferation, differentiation, and inflammation. These end points were chosen together with morphological examination of adipose tissue in this study because of their known relationship to cancer development (Balkwill and Mantovani 2001; Collins, Jacks, and Pavletich 1997; Porta et al. 2009; Schwartsburd 2003).
The pharmacological effects observed in treated rats were typical for a dual PPARα/γ agonist with decreases in plasma glucose, cholesterol, and triglycerides in all groups receiving tesaglitazar at all timepoints. When tesaglitazar binds to and activates PPARγ and PPARα, there is a subsequent activation of genes that harbor peroxisome proliferator response elements (PPRE) in their gene promoters. One such PPAR-driven gene is CD36, and in the present study, the CD36 mRNA expression was dose-dependently increased following treatment with tesaglitazar at 12 and 24 weeks, confirming a continuous pharmacological effect in the adipose tissue. However, at the 2-week timepoint, only the high-dose group (10 µmol/kg) showed increased CD36 mRNA expression. The reason why the low- (1 µmol/kg) and intermediate-dose groups (3 µmol/kg) did not show increased CD36 mRNA expression at 2 weeks is unknown and was not investigated further.
Besides the classical PPARα effects (heart and liver weight increases), rats exposed to tesaglitazar developed palpable subcutaneous fatty lumps that were located in the interscapular, axillary, and/or inguinal regions and were found at the high-dose group by week 12, and also for the intermediate-dose group by week 24. It is not known if such lumps have any relevance for fibrosarcoma development. Since very little data exist in the literature about these fatty lumps, we collected tissue samples from them, when they appeared, and included them in all analyses together with white fat.
In the pathology evaluation, rats exposed to tesaglitazar showed a polymorphic appearance of adipocytes in both subcutaneous white and brown fat. In the high-dose group, at 2 weeks of treatment, about 70-80% of the animals showed a polymorphic appearance of white and brown adipose tissue. However, the polymorphic appearance in white adipose tissue decreased during the course of the study. Interestingly, in fatty lumps and brown fat, the polymorphic appearance remained even at week 24. The mechanism for development of polymorphic appearance of adipocytes is not known. However, because PPARγ agonists are known to stimulate adipogenesis, it is likely a result of the pharmacological effect, which is supported by pathology data showing an increase in the severity of polymorphic appearance by dose of tesaglitazar. Since adipocytes of white adipose tissue represent terminally differentiated cells marked by cessation of proliferation and accumulation of cells in G1 phase of the cell cycle (Morrison and Farmer 1999), BrdU staining of white and brown adipose tissue highlights the interstitial cells, which are the dividing mesenchymal stem cells (MSC) or less defined mesenchymal progenitor cells. Previous studies suggest that MSCs behave as cancer stem cells of certain sarcomas (Matushansky et al. 2007). Recently it was demonstrated that a few genetic alterations in cells, such as p21 deficiency coupled with p53 deficiency, make MSCs bypass senescence in vitro and generate mesenchymal sarcomas in vivo (Rodriguez et al. 2009).
In white and brown adipose tissue, BrdU incorporation occurred in a dose-dependent manner and increased at all tesaglitazar dose levels (1, 3, 10 µmol/mg) at the 2-week timepoint in agreement with previous findings (Hellmold et al. 2007). The proliferative effect in white fat was reduced at weeks 12 and 24 and was only observed in high-dose animals. These observations indicate that the tesaglitazar-induced mitotic stimulation persists during the full duration of the dosing period at the highest dose level that produces fibrosarcomas. This indication has an important implication for the development of tumors since continuously stimulated mitosis increases the likelihood of incorporating and fixing transforming mutations (Bielas and Heddle 2000; Collins, Jacks, and Pavletich 1997). These observations also indicate that, at least at the low-dose level, after an initial proliferative burst at 2 weeks, cells either become desensitized to the mitotic signals or, alternatively, that the pool of MSC (or mesenchymal progenitor cells) that are responsive to the mitotic signals are depleted during longer treatment periods.
Much of our understanding of what regulates adipocyte differentiation comes from the establishment of preadipocyte cell lines (3T3-L1). These fibroblasts can differentiate into adipocytes and exhibit identical morphological and biochemical properties of white adipose tissue (Russell and Ho 1976). Adipocyte differentiation is largely controlled by two families of transcription factors, the CCAAT/enhancer binding proteins (C/EBP) and PPARs (Brun et al. 1996; Cornelius, MacDougald, and Lane 1994). Current models of the molecular process of adipogenesis involve a cascade expression of C/EBPβ and C/EBPδ, followed by the expression of C/EBPα and PPARγ. Given that a similar process occurs also in vivo, a study of the expression of these genes would enable analysis of the control of mitosis in the tissue at the molecular level. Treatment with tesaglitazar would be expected to stimulate adipocyte differentiation and mitotic arrest, but the literature also suggests that terminally differentiated adipocytes can stimulate proliferation of preadipocytes (Rosen and Macdougald 2006).
In a tissue where both processes occur simultaneously, analysis of gene expression data may be complicated. According to in vitro data, the D-type cyclins undergo a subtype switch from expression of D1 to D3 when cells pass from the proliferative phase into the differentiated adipocyte phenotype (Morrison and Farmer 1999; Phelps and Xiong 1998). There were no changes in the expression levels of the D-type cyclins after 2 weeks, which could be interpreted to agree with a scenario where proliferation and differentiation are occurring simultaneously. However, at 12 weeks, a clear dose-dependent increase in cyclin D3 was observed, along with a parallel reduction in cyclin D1. To our knowledge, this is the first time that such cyclin D subtype switch has been observed in vivo. This suggests that the proliferative burst of poorly differentiated preadipocytes that occurs by 2 weeks has attenuated and that more cells have now entered mitotic arrest, both in the regular white fat but also in the treatment-related subcutaneous fatty lumps.
By 24 weeks, the expression of cyclin D1 was still significantly lower in regular white fat than in the control group, but the reduction was smaller than that observed by 12 weeks. On the other hand, in fatty lumps, cyclin D1 and D3 expression was similar to control and to the scenario observed for white fat at the 2-week timepoint. Thus, at this stage, the tissue in the fatty lumps may again be shifting toward proliferation and away from differentiation.
C/EBPβ is a transcription factor involved in the early differentiation process of adipocytes, while C/EBPα is believed to be induced concurrently with PPARγ, relatively late during differentiation (Cornelius, MacDougald, and Lane 1994; Rosen and Spiegelman 2001). The analysis of the C/EBP transcription factors suggested a similar scenario to that indicated by the PPARγ target genes and cyclin D expression. By 12 weeks dosing with tesaglitazar, white fat contained a higher proportion of differentiated cells as suggested by increased levels of PPARγ and C/EBPα mRNA. Unexpectedly, the fatty lumps had similar levels of C/EBPα mRNA as controls, suggesting a lower proportion of differentiated adipocytes. This may be explained by the fact that the adipose tissue in the lumps would be expected to be delayed in its differentiation process as the tissue appears to develop de novo and may still after 12 weeks contain a mixture of cells at various levels of differentiation. In agreement with this explanation, C/EBPα expression in the high-dose group was similar in white fat and in the fatty lumps by 24 weeks treatment.
C/EBPβ is believed to have an early role during the differentiation process and is induced in vitro prior to cyclin D1, during the clonal expansion of cells (Morrison and Farmer 1999). There was, however, little effect on C/EBPβ mRNA levels at 2 weeks and 12 weeks. Again, the reason for this may be the mixed population of cells in the tissue. On the other hand, by 24 weeks there was a strong induction of C/EBPβ at 3 and 10 µmol/kg both in white fat and in the fatty lumps, which might indicate a recruitment of mesenchymal progenitor cells from bone marrow with higher expression of early differentiation markers (Crossno et al. 2006).
At 24 weeks, there was inflammation in the form of lymphoid cell infiltration in the fatty lumps, mainly in the high-dose group, in parallel with a significant increase in TNFα in fatty lumps of intermediate- and high-dose rats. TNFα is a potent inhibitor of adipocyte differentiation and exposure of 3T3-L1 adipocytes to TNFα can actually reverse this phenotype in vitro, resulting in complete lipid depletion (Torti et al. 1985). IL1β was increased only in the high-dose group in both regular white fat and fatty lumps at 24 weeks. IL1β is a strong inducer of prostaglandin production through increasing expression of cyclooxygenase-2 (COX2) enzyme, a rate-limiting enzyme in prostaglandin synthesis. Interestingly, it has been shown that when preadipocytes differentiate to adipocytes, the expression of IL-1β disappears (Gonzales and Orlando 2008). In our data set, we observed only significant increases of IL-1β during the 24-week timepoint, indicative of potentially the additional recruitment of preadipocytes to the adipose tissue.
Fibrosis was observed at 24 weeks in brown fat and white fatty lumps at the high-dose level. Normally, fibrosis is the formation of fibrous connective tissue as a reparative or reactive process. For adipose tissue, fibrosis may occur as a response to adipocyte hypertrophy, which is the result of fat expansion through increase in lipid droplet size in existing adipocytes with resulting mechanical stress on the adipocyte membrane (Khan et al. 2009). During the development of obesity, for example, it has been shown that the number of necrotic adipocytes positively correlates with average adipocyte size in mice (Cinti et al. 2005). In the present study, no treatment-related increase of adipocyte hypertrophy could be observed. However, necrosis and inflammation were frequently seen in the brown fat at the highest dose level. It is thus possible that the fibrosis in brown fat, as well as in fatty lumps, may arise from increased turnover of adipocytes to replace those necrotic adipocytes.
Mindful of the fact that mesenchymal stem cells require only a few genetic changes to undergo transformation, the described changes in white and brown adipose tissue by tesaglitazar suggest that continuous mitotic stimulation via a direct or indirect (paracrine factors) signal from terminal differentiated adipocytes coupled with inflammatory signals are key events in the formation of fibrosarcomas. Future studies should focus on molecular changes in white fat and especially subcutaneous fatty lumps as the origin of fibrosarcoma forming cells in animals exposed to PPARγ or dual PPARα/γ agonists.
Footnotes
Acknowledgements
We wish to acknowledge Stefan Öhlen for excellent in vivo conduct of the rat study and Birgitta Dillner for excellent immunohistochemical work.
This work was financed and performed at AstraZeneca.