
Abstract
Objective
To determine the function of the chemokine (C-X-C motif) ligand 1 (CXCL1) gene in ovarian cancer cells and to investigate the relationship between CXCL1 gene mRNA expression and ovarian tumor clinical pathology.
Methods
Using bioinformatics methods to identify common differentially expressed genes associated with ovarian cancer in the GEO database. Growth curves of A2780 cells with or without CXCL1 expression were plotted by MTT assay. Cell cycles were measured by flow cytometry. Cell colony formation was enumerated in Transwell chambers. Migration and invasion in vitro were investigated using Cell Counting Kit-8 (CCK8), wound healing and Transwell, respectively. The relationship between CXCL1 gene mRNA expression and ovarian tumor clinical pathology was analyzed.
Results
CXCL1 was found to be one of the co-upregulated differentially expressed genes in the GEO database. The migration of A2780 cells expressing CXCL1 was significantly higher than that of A2780 cells without CXCL1 expression. CXCL1 mRNA expression in ovarian malignancy was significantly higher than those in benign lesions and the normal control (p < .01). In advanced ovarian cancer (Stages III-IV), CXCL1 mRNA expression was also significantly higher than that in patients with early-stage ovarian cancer (Stages I-II) (p = .005). Kaplan-Meier survival curve showed no correlation between CXCL1 mRNA expression and ovarian cancer prognosis. A Cox proportional hazard model also showed that CXCL1 expression was not an independent prognostic factor for ovarian cancer patients.
Conclusions
CXCL1 gene could promotes ovarian cancer A2780 cell proliferation and invasion in vitro, and contributed theoretical knowledge for the target selection in molecular targeted therapy. CXCL1 mRNA over-expression may be correlated with the occurrence and development of ovarian malignancy. Level of plasma CXCL1 might serve as a biomarker for prognosis in ovarian carcinoma patients.
Introduction
Ovarian cancer is the third most common malignancy of the female reproductive system. It has the highest mortality rate of all gynecological malignancies 1 and its incidence has been increasing annually. The early symptoms of ovarian cancer are subtle. Therefore, patients often miss the optimal treatment time. For this reason, an accurate and simple method for the early diagnosis of ovarian cancer is urgently required. In the preliminary study, surface-enhanced laser desorption ionization-time of flight-mass spectrometry (SELDI-TOF-MS) and an enzyme-linked immunosorbent assay (ELISA) were used to detect CXCL1 protein in the sera of patients with ovarian cancer, these techniques are used as early serological diagnostic indicators of ovarian cancer. 2 To clarify the role of CXCL1 in ovarian cancer, this study aimed to use many experimental methods to investigate the biological function and study its relationship about clinicopathological factors in ovarian malignant tumors.
Materials and methods
Genetic search
Retrieve and download the mRNA expression profile chip data associated with ovarian cancer in the United States national center for biotechnology (NCBI) GEO database. Using “ovarian cancer” as retrieval keywords. The restricted study type was “expression profiling by array”, and the restricted species was “homo sapiens”. The expression profile genes related to ovarian cancer that had been reported before December 2019 was retrieved, and the mRNA expression profile chip data which met the inclusion criteria was downloaded for analysis.
GSE6822 (https://www.ncbi.nlm.nih.gov/geo/query/acc.cgi?acc=GSE6822)
GSE7463 (https://www.ncbi.nlm.nih.gov/geo/query/acc.cgi?acc=GSE7463)
Screening of differentially expressed genes
The GEO2R tool in GEO database was used to screen differentially expressed genes. GEO2R is a newly opened data sets analysis tool based on R language program in 2012, 3 which can compare two groups samples under the same experimental conditions to screen out differentially expressed genes. In this study use p < .05 and fold >2 as a threshold, set ovarian cancer tissue as experimental group, benign or normal ovarian tissue as control group respectively, and further through Venn mapping tools (http://bioinformatics.psb.ugent.be/webtools/venn/) selected co-differentially expressed genes from the experimental group and the control group expression spectrum data.
CXCL1 primer design and synthesis
Primer v.5 (Quest Research Ltd., Auckland, NZ) was used to design primers according to the cDNA sequence of human CXCL1 in GenBank. The primer was synthesized by Guangdong Invitrogen Biotechnology Co. The primer sequences are as follows:
upstream: 5'-AGCTTTGTTTAAACATGGCCCGCGCTGCTCTC-3';
downstream: 5'-AGCTTTGTTTAAACCCCTTCTGGTCAGTTGGATTTG-3'
Construction of the CXCL1 lentiviral expression system
Full-length CXCL1 cDNA was amplified by qRT-PCR. The CXCL1 template was selected from a recombinant plasmid CXCL1-EZ-T constructed by our group. The PCR product was separated by 1% low-melting-point agarose electrophoresis and observed under an ultraviolet transilluminator. It was purified and recovered with a Biospin Gel Extraction Kit (Hangzhou Bioer Technology Co. Ltd., Hangzhou, China). The PCR product and the pWPI PmeI were digested and the pWPI was dephosphorylated by SAP and recovered. Both DNA fragments were joined with T4 ligase. The ligation product was transformed into E. coli DH-5α and transferred to Luria-Bertani (LB) medium. CXCL1-PWPI DNA was extracted and full-length CXCL1 was amplified by qRT-PCR and confirmed by sequencing and NCBI homology analysis. The recombinant plasmid CXCL1-PWPI gene primers primer sequences: the forward primer was 5'-ATGGCCCGCGCTGCTCTC-3' and the reverse primer was 5'-CCCTTCTGGTCAGTTGGATTTG-3'', these were used to amplify a 324-bp fragment. For the GAPDH gene, a forward primer 5'-GAAGGTGAAGGTCGGAGT-3' and a reverse primer 5'-GAAGATGGTGATGGGATTTC-3' were used to amplify a 225-bp fragment.
Transfection of 293T cells
The 293T cells were transfected with CXCL1-PWPI plasmid DNA and a LipofectamineTM2000 Kit (Invitrogen, Carlsbad, CA, USA). The transfected cells were observed under an inverted aberration fluorescent microscope (Zeiss Axiover 200, Carl Zeiss AG, Oberkochen, Germany) at 24 h, 48 h, and 72 h. The 293T cells were digested, counted, and placed in 24-well plates. A viral dilution series was prepared (1:1, 1:2, 1:4, 1:8, 1:16, and 1:32). The viruses were then added to the cells and mixed gently. After 48 h, the fluorescent cells were counted. The mean number of fluorescent cells was estimated from two or three fields of vision under a fluorescence microscope. The virus titer (IU/mL) was calculated as the percentage of fluorescent cells in total cell count/(5 × 1.5 × 105 × 103).
CXCL1 expression in 2780 cell line
CXCL1 gene expression in the ovarian cancer cell line was measured by qRT-PCR. Briefly, RNA was extracted with a TRIzol Reagent kit. Three groups were assigned in this experiment: (1) CXCL1-PWPI: 2780 cell line transfected with CXCL1 gene viral particles; (2) PWPI: 2780 cell line transfected with empty viral particles; (3) A2780: ovarian cancer cell. Transfection efficiency was determined by the ratio of transfected (= GFP-positive) cells to the total cell number in the sample. CXCL1 mRNA expression was measured by qRT-PCR. The primers and reaction conditions were the same as those described above. CXCL1 protein secretion was detected by double antibody sandwich ELISA. Absorbance (OD) was measured using a microplate reader at λ = 450 nm.
Determination of A2780 cell function
The cell growth curve was plotted with the MTT assay. Absorbance was measured at λ = 492 nm. Time (d) was the independent variable (x-axis) and absorbance was the dependent variable (y-axis). The cell cycle was determined by flow cytometry. The DNA content and the cell numbers and proportions in the G1-, G2-, and S phases were analyzed with a Beckman COULTER® EPICS® XLTM flow cytometer (Beckman Coulter, Inc., Brea, CA, USA). A cell body colony formation assay was also performed. Briefly, cells were digested with 0.25% trypsin to prepare a single-cell suspension. They were seeded on 24-well plates at a density of 50, 100, or 200 cells per well and incubated at 37°C in a humidified incubator under a 5% CO2 atmosphere for 5–7 days. Colony-forming cells were then counted in each well. A cluster of 15–50 cells was scored as a standard colony. Cell culture was terminated, the cells were washed with phosphate-buffered saline (PBS), fixed with methanol, and stained with Giemsa. Colonies were counted under a aperture range of microscope. The rate of colony formation was calculated as follows: (colony formation rate = number of clones/number of seeded cells × 100%)
Determination of cell migration and invasion in vitro
Cell migration and invasion assays were carried out using a Transwell chamber and migration invasion, respectively. The migration rate was determined from cell mobility at A450 and calculated as follows: relative absorbance of migrating cells = cell absorbance value on upper surface/cells absorbance value on lower surface.
Forward two Spaces
Cell invasion was determined by measuring the migration absorbances on the upper- and lower cell surfaces and calculated as follows: invasion rate (cell invasion absorbance value = A450 for upper cell surface/A450 for lower cell surface).
Clinical data
All cases originated from Guangxi Medical University Cancer Hospital. They were treated between January 2009 and January 2018. They included 80 cases of malignant tumors aged from 19 to 68 years (mean: 45 years). Pathological classification and grading were performed according to World Health Organization (WHO) standards. There were 58 cases of serous cystadenocarcinoma, 14 cases of mucinous cystadenocarcinoma, and 8 cases of endometrioid carcinoma. Surgical-clinical staging was performed according to the International Federation of Gynecology and Obstetrics (FIGO2009) standard. There were 27 Stages I-II cases and 53 Stages III-IV cases. All ovarian malignant tumor cases underwent cytoreductive surgery and platinum-based chemotherapy. 72 patients were followed up and their median survival time was 29 months, 8 cases were lost to follow-up. There were 40 patients with benign ovarian lesions (benign group) aged 18–66 years (mean age: 34.96 years), 30 cases of benign cystadenoma, 10 cases of teratoma. There were 20 patients of normal ovarian tissue from uterine fibroids aged 33–56 years (mean: 50.3 years), patients underwent hysterectomy and a partial oophorectomy, normalcy was confirmed by a pathologist. All tissue samples were obtained from surgical resections. Portions of the specimens were fixed in 10% formalin and subjected to routine pathological examination. The remaining portions of the specimens were immediately frozen in liquid nitrogen for RNA isolation.
CXCL1 mRNA expression in ovarian tissue
The CXCL1 mRNA expression in ovarian tissue was detected by qRT-PCR, as were the expressions of the target gene CXCL1 and the reference gene GAPDH. The blank control (no reaction system template) was also set. Each sample was placed into three parallel tubes. The GAPDH samples, CXCL1 samples, and blank control samples were amplified simultaneously. The completed PCR amplification process indicated the Ct value and copy number of each sample. The standard curve was plotted using the logarithm of the plasmid copy number as the abscissa and the Ct value as the ordinate. The starting copy number was read according to the Ct value and corresponded with the standard curve. Each cDNA sample was analyzed quantitatively and expressed as an SQ value. Relative expression level of the CXCL1 gene = average CXCL1 gene SQ value/average GAPDH gene SQ value.
Statistical analysis
The experimental results were analyzed by SPSS 18.0 statistical software and the data were expressed as means ± SD. The comparison of the three groups data was conducted by ANOVA or a Wilcoxon rank test. Prognosis was analyzed by a multivariate Cox proportional hazards model, a Kaplan-Meier survival curve, and a log-rank test. p < .05 was used as the criterion for statistical significance.
Results
Screening for differential genes in ovarian cancer
Microarray data set of gene expression profiles associated with ovarian cancer.

GSE6822 and GSE7463 microarray data were screened for co-differentially expressed genes
GSE6822 and GSE7463 data sets were screened by GEO2R for differentially expressed genes. A total of 205 up-regulated and 101 down-regulated differentially expressed genes were screened in GSE6822, a total of 234 up-regulated and 295 down-regulated differentially expressed genes were screened in GSE7463. The up-regulated and down-regulated genes in GSE6822 and GSE7463 chips were further screened by Venn mapping tool, and 62 up-regulated and 67 down-regulated differentially expressed genes (Figure 1). The co-differentially expressed genes as follows 62 cases: CXCL10 CRIP1 PFKP PDZK1IP1 MTHFD2 MMP7 MT1F STC1 TNFAIP2 EFNA1 CRABP2 LSR CD24 KRT8 CFB DEFB1 CAPG SPP1 CD47 KPNA2 NMU SLPI CCNE1 HIST1H2AE GRB7 PRSS8 LCN2 MUC1 CD9 CDC20 PRAME TFAP2C IDH2 ELF3 LAD1 CDKN2A TACSTD2 KIAA0101 HMGA1 CEBPG PDXK HTR3A FOLR1 HIST1H2BE S100A2 CXCL1 SORD PAX8 KRT18 HIST2H2AA3 DSC2 CXCL11 STAT1 PCCB WFDC2 SAA1 EPCAM ISG15 TEAD4 UCP2 KRT7 TNNT1 Co-differentially expressed genes. (a) up-regulated, (b) down-regulated. 62 up-regulated and 67 down-regulated differentially expressed genes between GSE6822 and GSE7463 chips.
Electrophoresis of PCR products
The recombinant CXCL1-PWPI plasmid DNA was amplified by qRT-PCR using PWPI universal primers. CXCL1-PWPI plasmid DNA was used as the template. Lane 11: DNA molecular weight marker: band from top to bottom in order indicating 2000 bp, 1000 bp, 800 bp, 500 bp, 250 bp, and 100 bp. Lanes 3, 8, 10, and 14: successful clones of recombinant CXCL1-PWPI (Figure 2). The DNA sequence homology analysis was performed using the online NCBI server (https://www.ncbi.nlm.nih.gov/gene/). It was determined that the recombinant has 100% identity with the target gene. The recombinant plasmid DNAs of CXCL1 and GAPDH were amplified by PCR. The CXCL1 target band of 324 bp was observed as predicted. The CXCL1 and GAPDH sequences were verified by DNA sequencing and BLAST alignment. PCR identification of CXCL1-PWPI recombinant. Amplified target gene is 1224 bp. Lane 11: DNA molecular weight marker; band from top to bottom in order indicating 2,000 bp, 1,000 bp, 800 bp, 500 bp, 250 bp, and 100 bp. Lanes 3, 8, 10, and 14: successful clones of recombinant CXCL1-PWPI.
Transfection of 293T cells with CXCL1-PWPI and CXCL1 mRNA expression in A2780 ovarian cancer cell
Fluorescent protein expression was observed in the cells after 24 h transfection with CXCL1-PWPI, peaked at 48 h, and decreased at 72 h. The titers for the 1×, 2×, 4×, and 8× dilutions were 3 × 10⁴, 8 × 10³, 5 × 10³, and 3 × 10³, respectively. According to the formula, the package virus titer was 2.5 × 10⁴ IU/mL (Figure 3(a)). Efficiency of lentiviral transfection in A2780 cell was calculated to be 60% (Figure 3(b)). The qRT-PCR verified the CXCL1 gene mRNA expression of CXCL1-PWPI-A2780 cells and A2780 cells and PWPI-A2780 cells (Figure 3(c)). CXCL1 secretory protein was measured with ELISA (Figure 3(d)). A colored supernatant was obtained from the CXCL1-PWPI-A2780 cells, OD450 = 0.872. In contrast, the supernatants derived from the control group cells (A2780 and PWPI-A2780) were colorless, OD450 = 0. 293T cells transfected with CXCL1-PWPI and Lentiviral transfection efficiency of A2780 cells. (a): 293T cells transfected with CXCL1-PWPI, (b): Lentiviral transfection efficiency of A2780 cells, (c): Detection of CXCL1 secretory protein, Notes:lanes 1, 2: CXCL1-PWPI-A2780 Supernatant; lanes 4, 5: PWPI-A2780 Supernatant; lanes 6, 7: A2780 Supernatant; lane 8: Blank, (d): Examination of CXCL1 mRNA expression qRT-PCR, Notes:lane 1: A2780; lane 2: PWPI-A2780; lane 3: CXCL1-PWPI-A2780; lane 4: DNA molecular weight marker. Bands from top to bottom in order indicate 600 bp, 500 bp, 400 bp, 300 bp, 200 bp, and 100 bp.
Impact of CXCL1 gene expression on the cell growth curve of A2780 cells
The doubling time of A2780 cells with the CXCL1 gene positive expression was significantly shorter (p < .05) than that of the control group without CXCL1 gene positive expression (Figure 4). Cell growth curve based on MTT assay results. The doubling time of A2780 cells with the CXCL1 gene positive expression was significantly shorter (p < .05) than that of the control group without CXCL1 gene positive expression.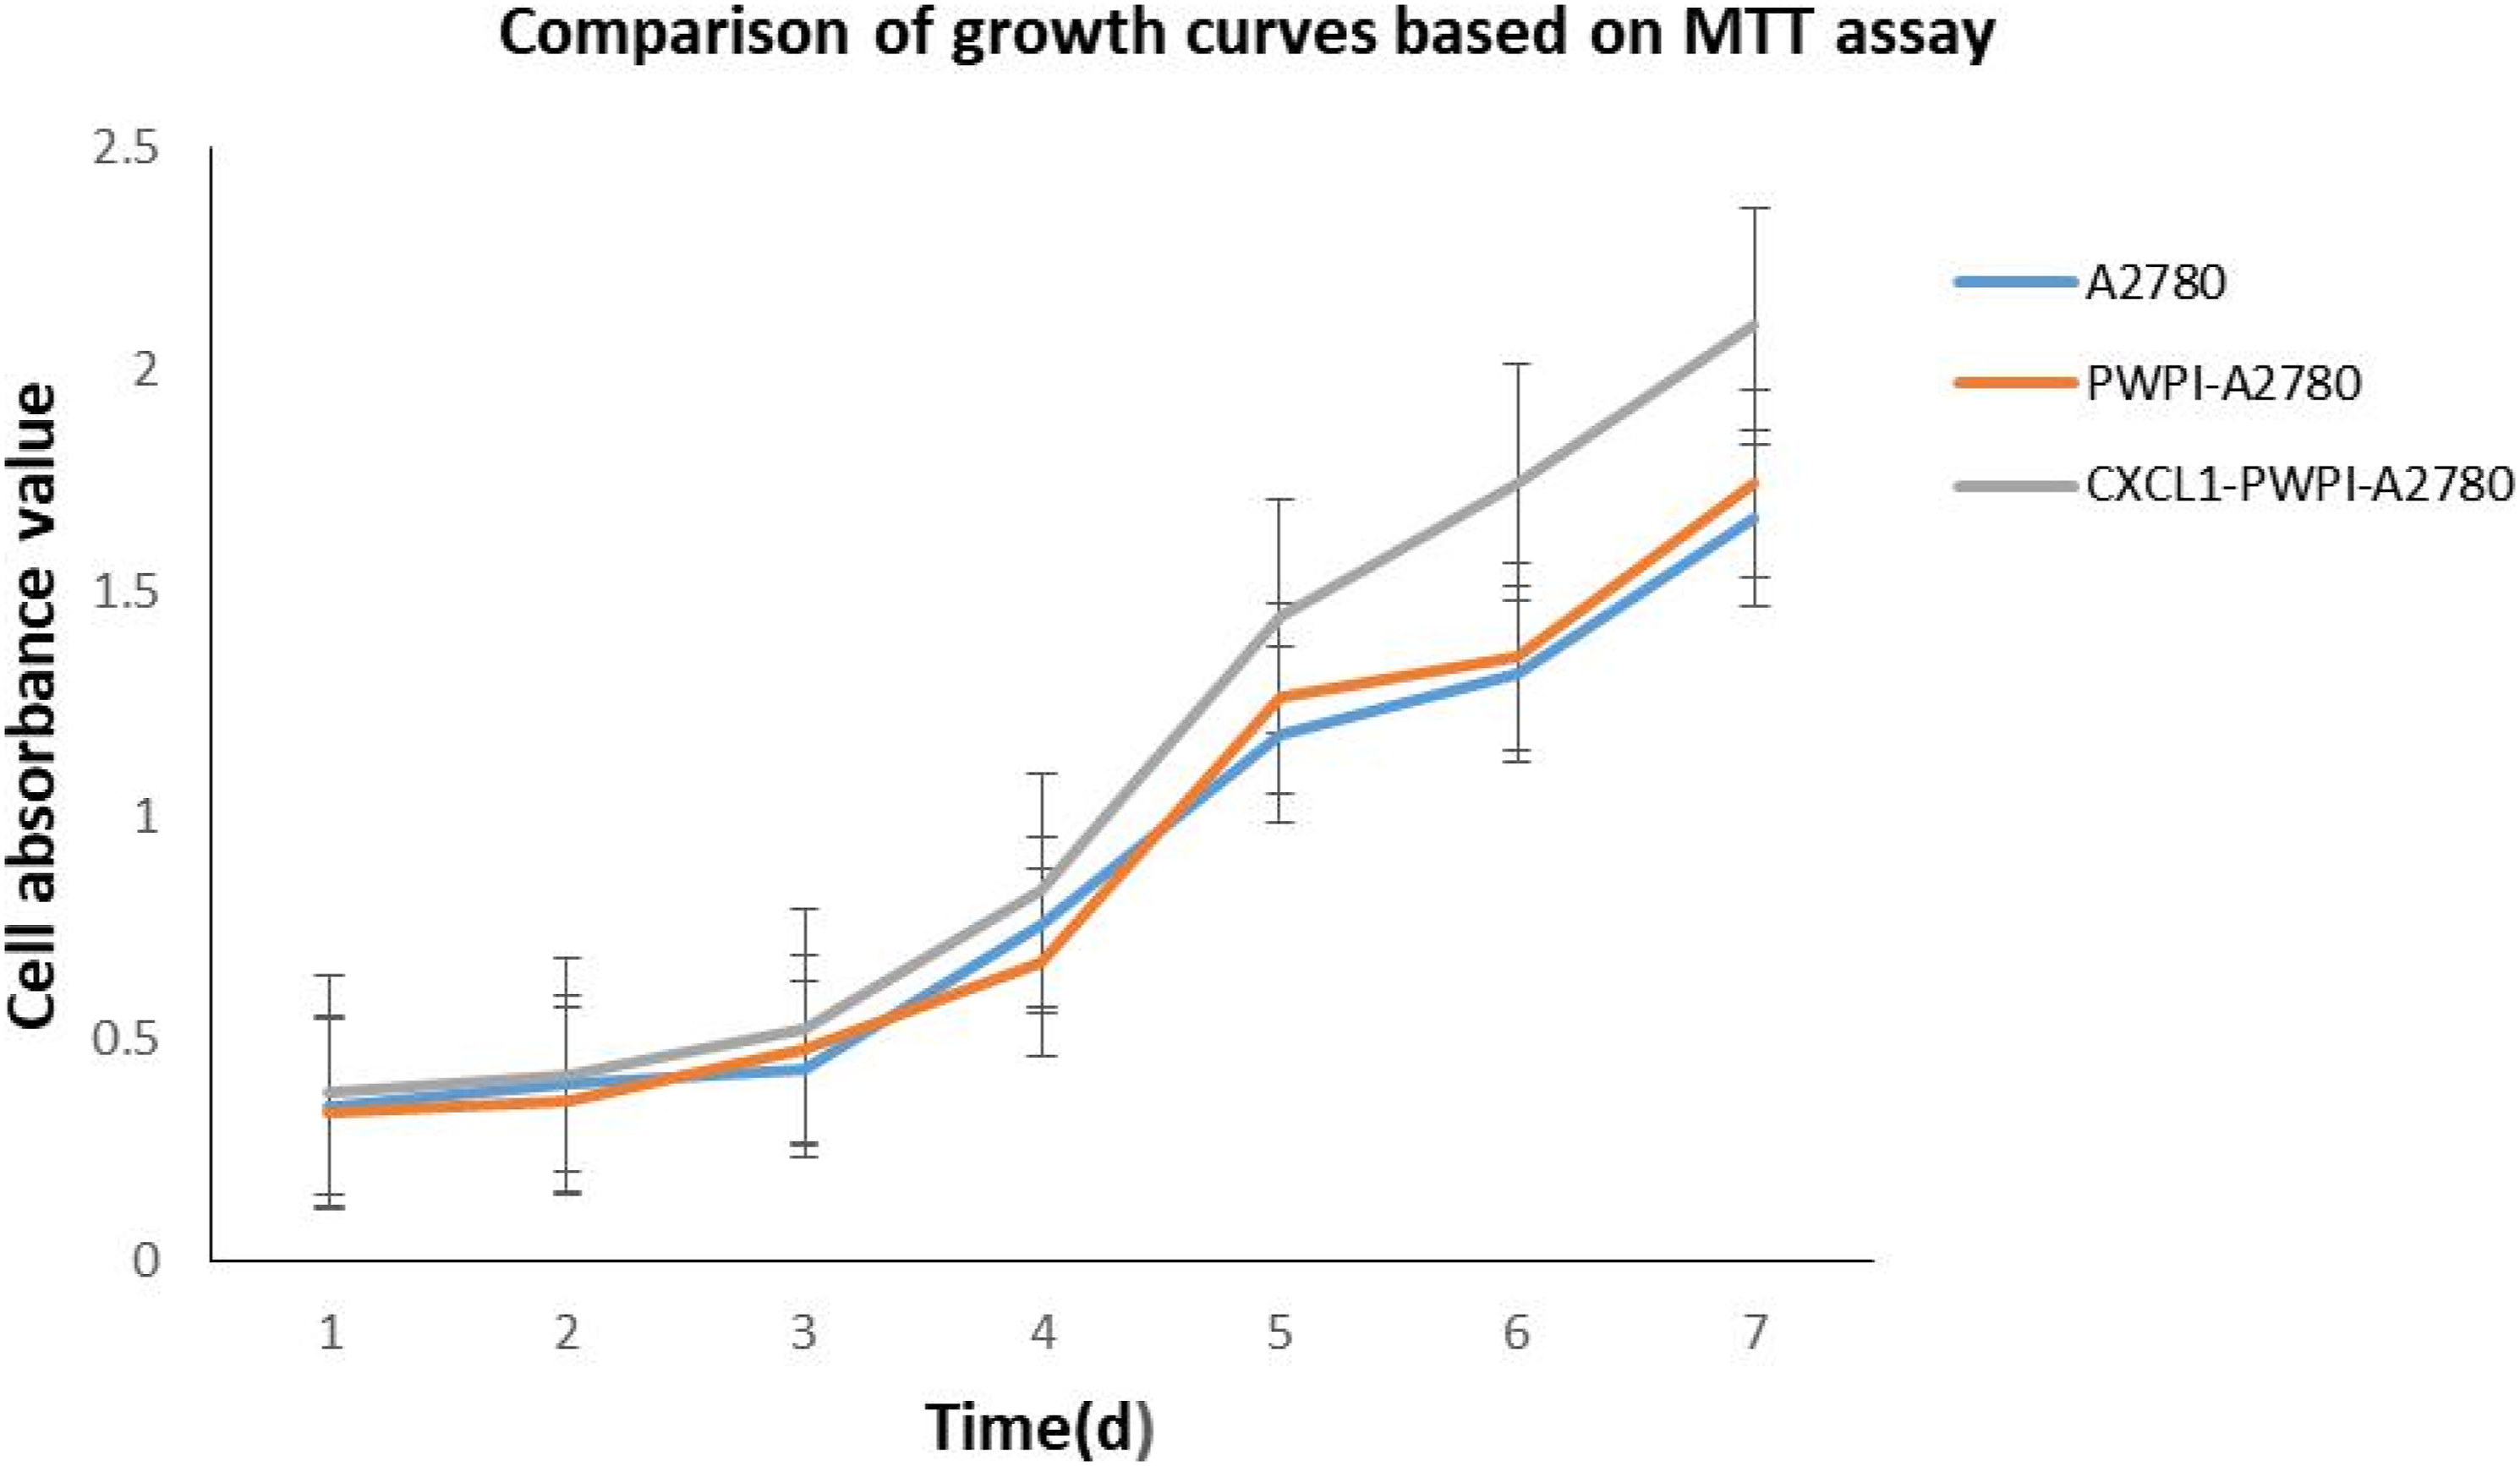
Flow cytometry cell cycle analysis
Flow cytometric analysis of cell cycle.

Colony formation assay
Colony formation assay.

aA2780 group compared with PWPI group.
bPWPI group compared with CXCL1-PWPI groups.
cA2780 group compared with CXCL1-PWPI.
Determination of cell migration and invasion capability in vitro
Determination of cell migration and invasion capability in vitro.
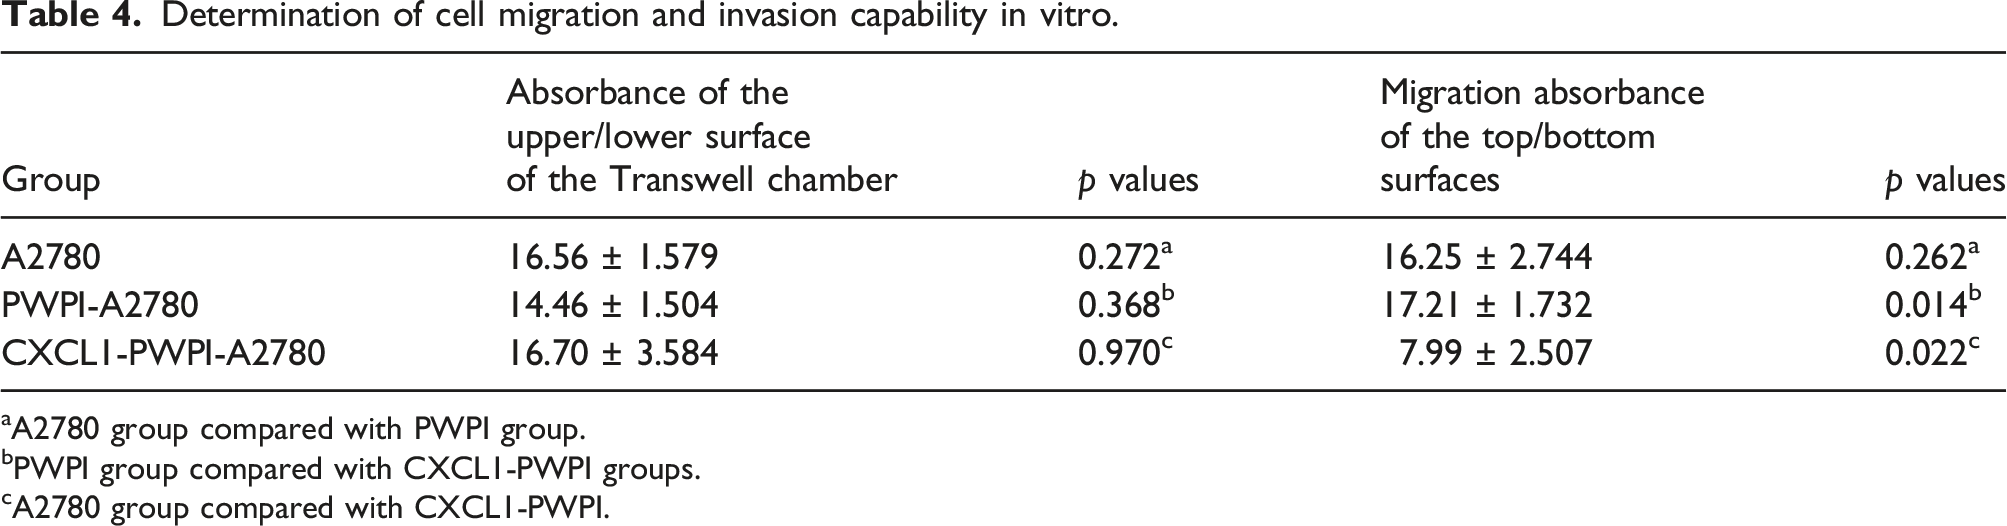
aA2780 group compared with PWPI group.
bPWPI group compared with CXCL1-PWPI groups.
cA2780 group compared with CXCL1-PWPI.
CXCL1 mRNA expression in ovarian tissue
Both the expression level and the positive rate of CXCL1 mRNA in malignant tissues were significantly higher than those in the benign tumors and the normal control. The differences were statistically significant (p = .000).
Relationship between CXCL1 mRNA expression in ovarian cancer tissues and clinical pathology
Relationship between CXCL1 mRNA expression in ovarian cancer tissues and clinical pathology.

Relationship between the CXCL1 mRNA expression in ovarian cancer tissues and clinic prognosis
The life table method was used to calculated survival rate. The 1-year, 2-years, 3-years, 4-years, and 5-years cumulative ovarian cancer patient survival rates were 60.5%, 43.4%, 11.8%, 6.6%, and 1.3%, respectively. The median ovarian cancer patient survival time was 21.18 months, with positive CXCL1 mRNA expression patients was 14.28 months, while with negative CXCL1 mRNA expression patients was 23.01 months, there was not significantly statistically difference (p = .632) (Figure 5) (Kaplan-Meier survival curves). A Cox model analysis showed that CXCL1 mRNA expression was not an independent prognostic factor of ovarian cancer patients (Table 6). Kaplan-Meier method for survival curves of ovarian cancer patients. Median survival time in ovarian cancer patient with CXCL1 mRNA-negative expression was longer than that for ovarian cancer patients with CXCL1 mRNA-positive expression, there was not significantly statistically difference (p = .632). Influence of multiple factors on ovarian cancer prognosis.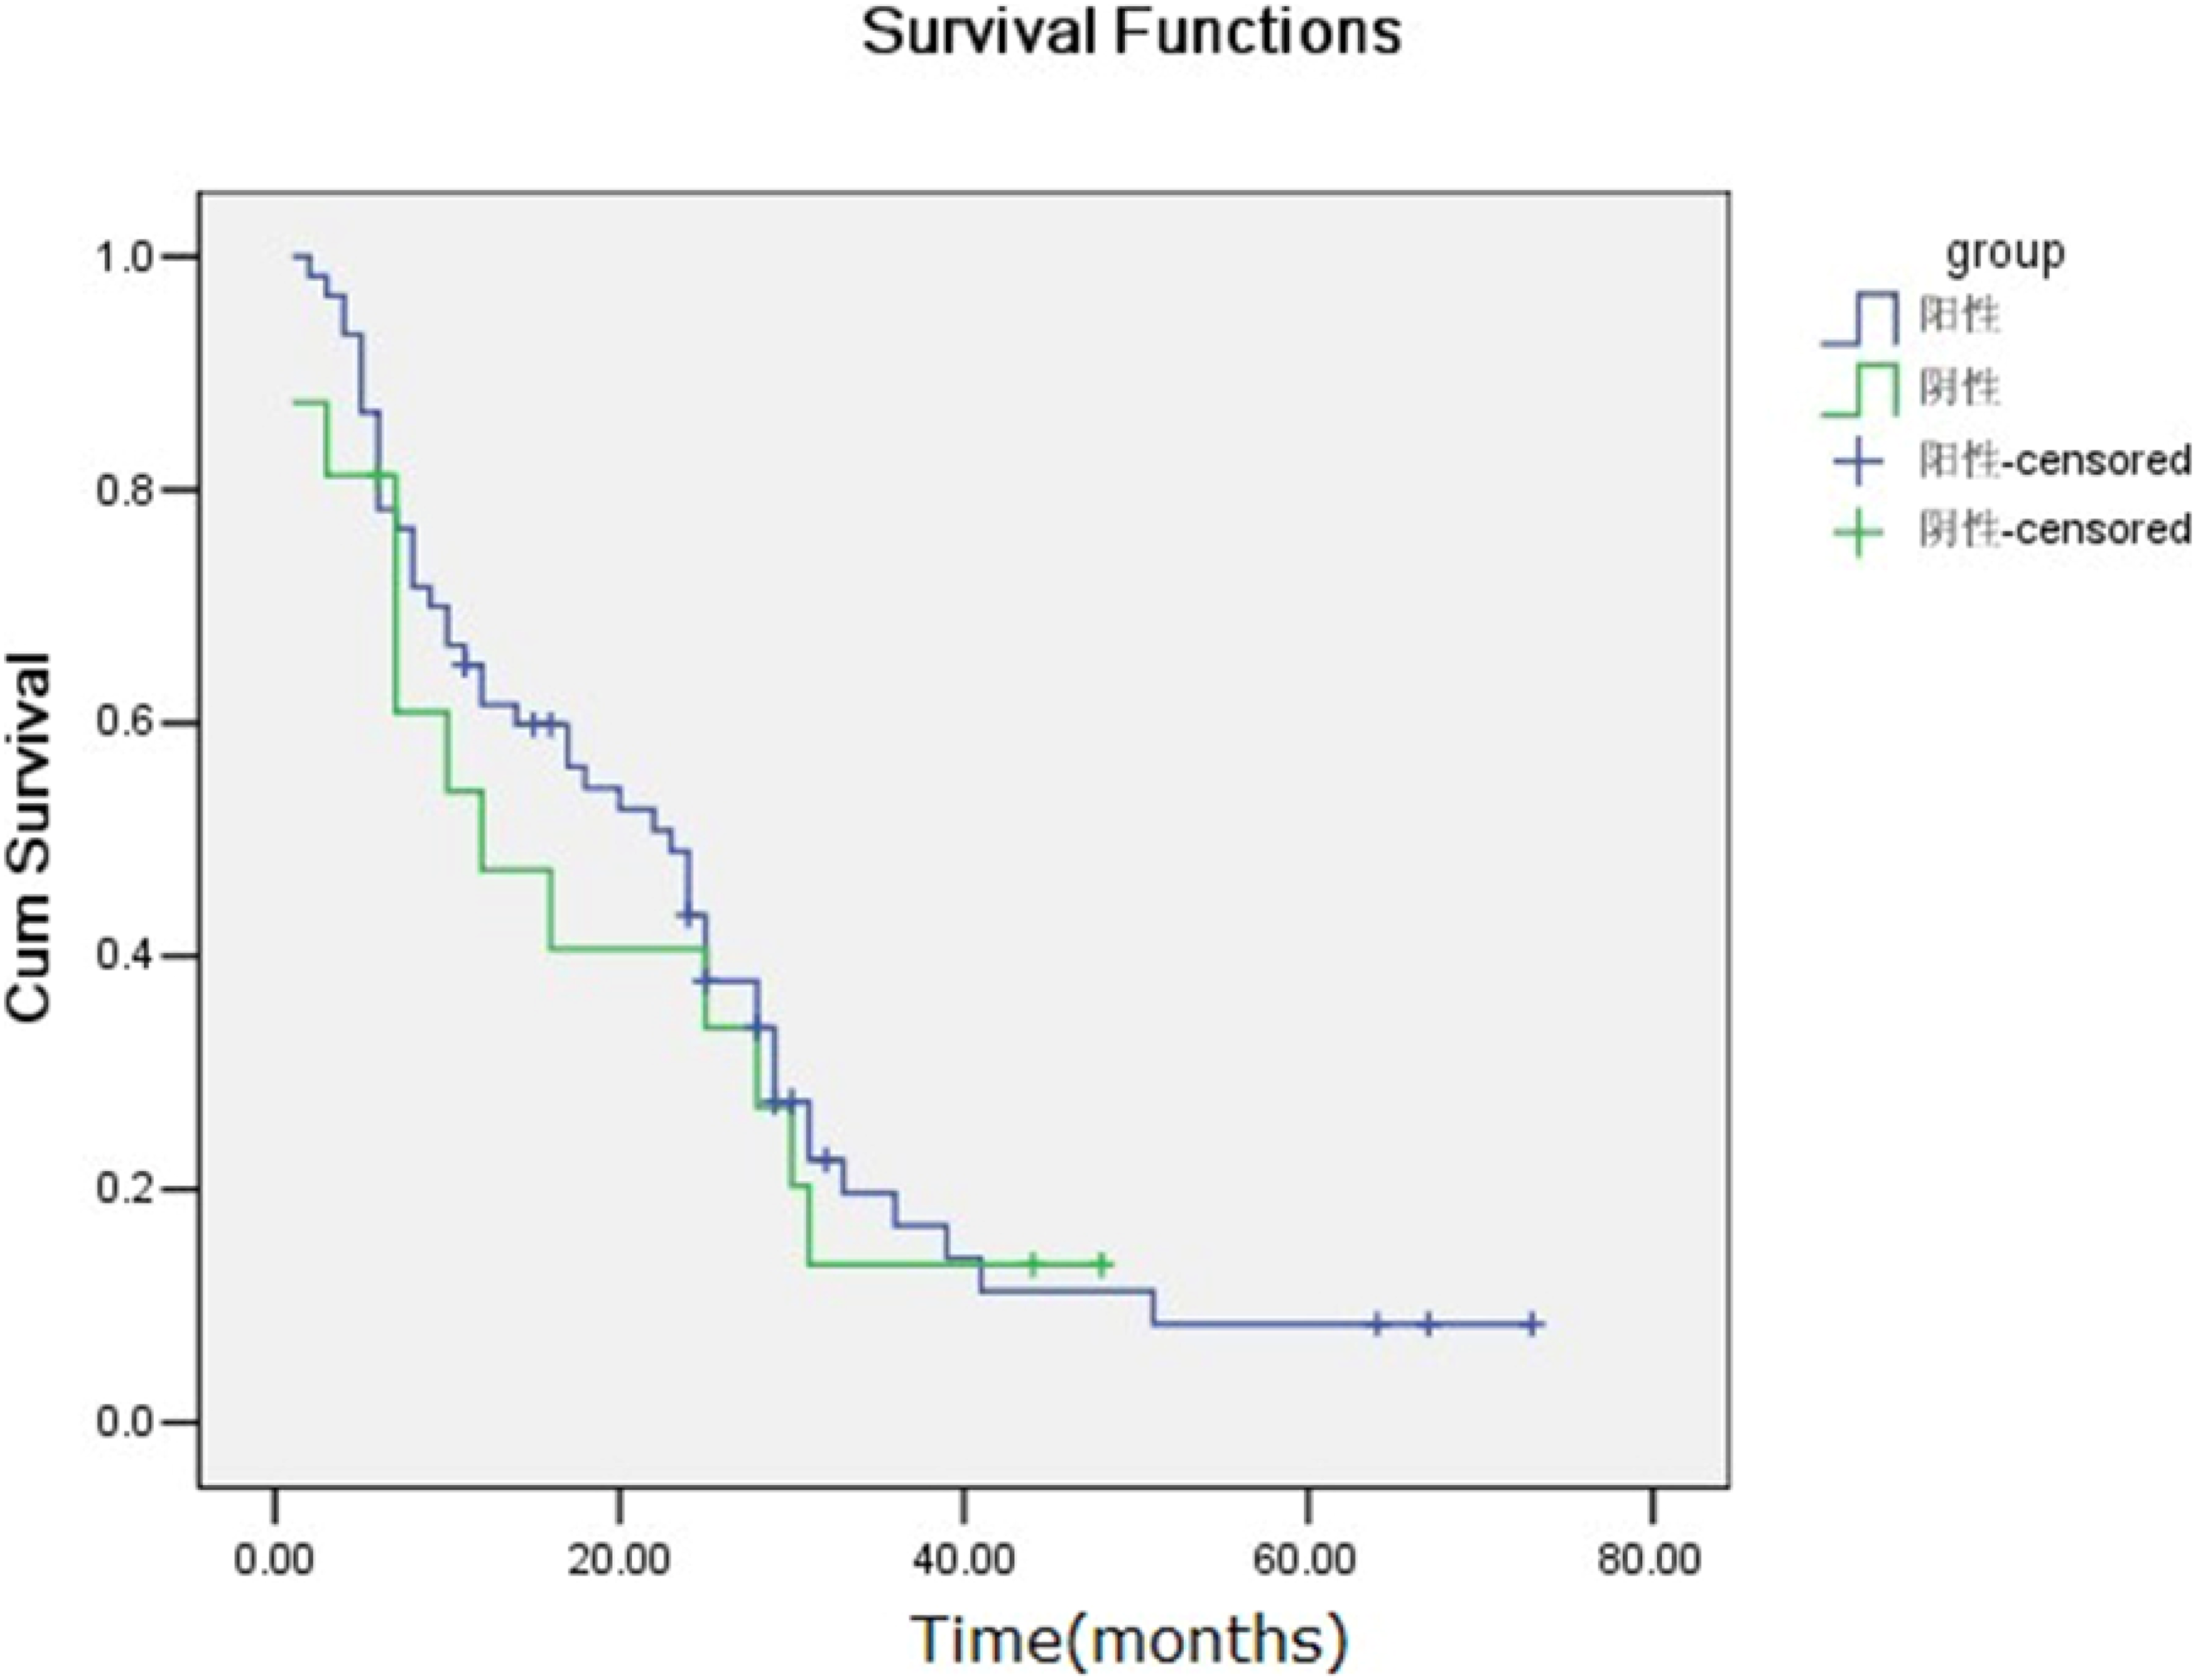

Discussion
X-C motif chemokine ligand 1 (CXCL1) is a member of the CXC chemokine subfamily and a ligand for CXCR, which was first described in the 1980s, its first described property was its autocrine stimulation of melanoma cell proliferation, hence its original name: melanoma growth-stimulatory activity (MGSA). 1 Its main function in the immune system is the chemoattraction of neutrophils, are responsible for the migration and infiltration of tissues by immune cells. We searched the common differentially expressed genes in ovarian cancer though bioinformatics of GEO database and found that CXCL1 was one of the common differentially expressed genes. Our previous 2 experiment identified relative differences in protein expression between normal controls and patients with ovarian cancer, which were screened with SELDI-TOF-MS, a Cu-IMAC column, and a WCX-2 protein chip, found that serum CXCL1 was upregulated in ovarian cancer patients but the reason was not clear. In this study, the CXCL1 mRNA positive rates and relative expression levels in ovarian cancer tissue were significantly higher than those in the benign and normal groups. In the malignant group, CXCL1 mRNA expression was positively correlated with surgical pathological stage. CXCL1 expression levels in late-stage (Stages III–IV) patients were significantly higher than those in earlier-stage (I–II) patients. Therefore, a correlation between CXCL1 mRNA overexpression and ovarian cancer development and metastasis. Yang 3 showed that CXCL1 was significantly overexpressed in colorectal cancer tissues. Furthermore, expression of CXCL1 was associated with tumor stage in colorectal cancer. The present study demonstrated that CXCL1 was upregulated in ER-negative breast cancer tissues and cell lines compared with ER-positive tissues and cell lines. 4 Bioinformatic analysis and clinical investigation finally suggested that high CXCL1 expression is significantly correlated with breast cancer lymph node metastasis, poor overall survival, and basal-like subtype.5,6 Circulating levels of CXCL1 are increased in breast cancer patients compared to healthy subjects. 7 CXCL1 expression is higher in cervical tumors relative to healthy tissue.8,9 Additionally, CXCL1 levels in the serum of cervical cancer patients are higher than in healthy subjects. 10 Wang conclude that serum CCL18 and CXCL1 are potentially useful as novel circulating tumor markers for the differential diagnosis between ovarian cancer and benign ovarian masses, 11 which was also confirmed by cell proliferation experiments in our study. Our study results indicate that CXCL1 promotes ovarian cancer cell growth and proliferation. Cell cycle measurements showed that the proportion of CXCL1-PWPI-A2780 cells with CXCL1 gene expression in the G1 phase (40.0%) was significantly lower than that in PWPI-A2780 cells (61.4%). Therefore, the CXCL1 gene promotes ovarian cancer A2780 cell growth and proliferation by advancing them from the G1 phase to the G2-and S phases. In the present study, it was confirmed that CXCL1 expression was associated with ovarian tumor progression and metastasis. Previous studies have shown that sustained CXCL1 expression may promote melanoma formation. Studies have shown that CXCL1 stimulates cell growth and proliferation and promotes angiogenesis, cell migration, and cell invasion directly by autocrine signaling. CXCL1 depends on the P53 pathway to suppress stromal fibroblasts which promotes tumor growth and is a necessary condition for the transformation of normal ovarian epithelial cells into malignant cells. 12 CXCL1 is an efficient angiogenic growth factor, it promotes tumor progress by increasing VEGF-induced vascularization. 13 Sustained CXCL1 expression could induce tissue injury and tumor angiogenesis. One way to repress CXCL1-mediated tumor growth promotion would be to use antibody to block CXCR2 which is the CXCL1 receptor on the membranes of tumor- and microvascular endothelial cells. By activating CXCR2, CXCL1 increases the proliferation of ovarian cancer cells.14,15 The molecular mechanism of CXCL1-mediated promotion of tumor growth and proliferation depends on Ras signaling pathways. RAS is a small G protein which plays an important role in cell signaling, proliferation, apoptosis, and differentiation. Ras may be activated by the upregulated expression of IL-6, IL-8, chemokines, and GRO-1. It has been shown that CXCL1-regulated expression was associated with the regulation of the expression of M-Ras-, K-Ras-, and N-Ras mRNAs and proteins. 16 CXCL1 is also important in the migration and EMT of ovarian cancer cells, 17 which is related to the increased expression of MMP2 and MMP9 by CXCL1. CXCL1 has an autocrine effect on these cells, which is associated with high basal NF-κB activation caused by the overexpression of A-kinase-interacting protein 1 (AKIP1). 18 NF-κB attaches to the CXCL1 promoter, increasing the expression of CXCL1, which is produced and secreted by cervical cancer cells and then acts on these cells. CXCL1 expression in cancer cells is also elevated by secretory factors such as epidermal growth factor (EGF), IL-17, protease-activated receptor 1 (PAR1), and TNF-α. 19 CXCL1 exerts its anti-apoptotic effects by acting on Bcl-2 family proteins. Zhang found CXCL1 could promote cancer cell proliferation in appropriate concentration by PI3K/AKT pathway. It also regulated the activation of Rho GTPases to mediate the rearrangements of cytoskeleton to promote tumour cell migration. 20 Duckworth 21 found that GAB2 overexpression in ovarian cancer cells promotes tumor growth and angiogenesis by upregulating the expression of CXCL1, CXCL2, and CXCL8. In the present study, an in vitro cell invasion experiment showed that the invade ability of overexpressing CXCL1 ovarian cancer cells was significantly enhanced. However, this experiment does not prove that CXCL1 plays a direct role in cell migration. The main function of CXCL1 is to promote VEGF expression via its effect on the tumor growth microenvironment. It also enhances angiogenesis and tumor cell metastasis rather direct increasing cell migration ability.
Conclusion
CXCL1 may directly stimulate tumor growth, invasion, and metastasis by enhancing angiogenesis. Serum CXCL1 level is elevated by cytokine-induced secretion. The present study provides a theoretical foundation for further investigations into the biological roles of CXCL1 protein in ovarian cancer cells. It also suggests that CXCL1 is a potential target for ovarian cancer treatment and a valuable biomarker for its diagnosis.
Footnotes
Author contributions
All authors made substantial contributions to conception and design, acquisition of data, or analysis and interpretation of data; took part in drafting the article or revising it critically for important intellectual content; gave final approval of the version to be published; and agree to be accountable for all aspects of the work.
Declaration of conflicting interests
The author(s) declared no potential conflicts of interest with respect to the research, authorship, and/or publication of this article.
Funding
The author(s) disclosed receipt of the following financial support for the research, authorship, and/or publication of this article: This study was supported by a grant from the China National Science Foundation (No. 30960404), the funder Li Li is the manuscript’ corresponding author. And was supported by Guangxi Natural Science Foundation (No. 2023GXNSFBA026101), the funder Zhuang Li is the manuscript’ first author. Also was supported by Guangxi Zhuang Autonomous Region Clinical Key Specialized Subject Construction Project (Gynecology) Funds (2018-39), the funder is our work department.