
Abstract
Aim
To investigate the protective effect of α-lipoic acid on sodium arsenite (NaAsO2) induced INS-1 cells injury and its mechanism.
Methods
The cell viability was measured by CCK-8 assay. The autophagosomes was observed under transmission electron microscopy. The autophagosomes in cells transfected with green fluorescent protein microtubule-associated protein light chain 3 (GFP-LC3) plasmids were observed under a laser scanning con-focal microscope. The expression of LC3-II, P62, PI3K, and mTOR proteins in INS-1 cells treated with a combination of chloroquine (CQ, autophagy inhibitor) and NaAsO2 were detected by Western blot assay. The expression of LC3-II, P62, PI3K, and mTOR proteins were detected in INS-1 cells treated with a combination of rapamycin (autophagy inducer, mTOR inhibitor) and α-LA.
Results
The cytotoxicity induced by NaAsO2 was reversed by α-LA, and the viability of NaAsO2-treated INS-1 cells increased. α-LA pretreatment decreased the autophagosome accumulation induced by NaAsO2. α-LA also reduced the fluorescence spot aggregation of GFP-LC3 in INS-1 cells exposed to NaAsO2 as observed under a laser scanning con-focal microscope. α-LA inhibited NaAsO2 induced autophagy by up-regulating PI3K and mTOR and down-regulating LC3-II and P62. CQ inhibited NaAsO2 induced autophagy by up-regulating PI3K, mTOR, P62 and down-regulating LC3-II. α-LA inhibited rapamycin-induced autophagy by up-regulating PI3K, mTOR and P62 and down-regulating LC3-II. The results showed that NaAsO2 could induce autophagy activation in INS-1 cells. The α-LA may inhibit autophagy activation by regulating the PI3K/mTOR pathway.
Conclusion
The data indicated that α-LA might inhibit the NaAsO2-induced autophagic death of INS-1 cells by regulating the PI3K/mTOR pathway.
Introduction
Chronic arsenic poisoning is a global public health concern. 1 Arsenic causes skin keratosis, pigmentation, cardiovascular disease, nervous system damage, and endocrine disorders. Recent epidemiological studies in arsenic exposure areas showed that chronic arsenic exposure is associated with a high risk of type 2 diabetes mellitus (T2DM). 2 Diabetes mellitus is a chronic disease that threatens human health. 3 Studies have shown that the incidence of diabetes is predicted to exceed 439 million by 2030. 4 The main pathogenesis of diabetes is the dysfunction of islet β cells and insulin resistance in peripheral tissues. Recent studies showed that the occurrence of diabetes is related to cell autophagy, which plays an important role in regulating insulin secretion.5,6
Autophagy is an important cellular self-defense mechanism that maintains cell homeostasis and promotes cell survival by removing damaged organelles and proteins. 7 However, autophagy activation may also lead to cell death. 8 Autophagic cell death is identified by morphological observation, the mechanism is unclear. In addition to the physiological function of autophagy, a disorder in the autophagy process plays an important pathogenic role in many diseases, especially under the condition of high cell stress and cumulative molecular and organelle damage. Moreover, arsenic exposure can induce autophagy. 9
Alpha-lipoic acid (α-LA) is an antioxidant. According to literature, α-LA can remarkably improve insulin secretion in islet β cells and protect islet β cells. 10 α-LA is used to prevent and treat diabetes, and believed to improve the insulin sensitivity of tissues. 11 Some studies also showed that α-LA could block the production of acidic autophagic vacuoles, microtubule-associated protein light chain 3-II (LC3-II), and other autophagy-related proteins during adipocyte differentiation. 12 However, few studies have focused on the inhibitive effect of α-LA on sodium arsenite (NaAsO2)-induced autophagy.
In this study, we investigated whether chronic arsenic exposure can induce autophagy and whether α-LA has an inhibitive effect on the NaAsO2 induced autophagic cell death of INS-1 cells. The results provide an experimental basis for preventing and treating arsenic-related T2DM.
Materials and methods
Cell culture and treatment
Rat insulinoma (INS-1) cells were purchased from the cell bank of the Laboratory Animal Center of Wuhan University. The cells were cultured in RMPI 1640 medium (Gibco) supplemented with 12% fetal bovine serum (Zhejiang Hangtian Technology, Co) under a humidified atmosphere with 5% CO2 at 37°C. NaAsO2 (1.3 mg Shandong West Asia Chemical Industry, Co) was dissolved in 1 mL of distilled water to prepare a 10 mM NaAsO2 stock solution. α-LA (20.6 mg; Sigma, CAS No. 1077287) was dissolved in 1 mL of dimethyl sulfoxide to prepare a 10 mMα-LA stock solution.
Cell-counting kit-8(CCK-8) assay
INS-1 cells (1 × 10⁵/mL) were seeded in 96-well plates, pretreated with 0, 50, 100, and 200 μM α-LA for 4 h, and treated with 30 μM NaAsO2 for 24 h. Then the cells were incubated with CCK-8 (Dongren Chemical Technology, Co, Shanghai) for 4 h at 37°C. The absorbance at 450 nm (A450) was read using a Bio-Rad microplate reader, and cell viability (%) was calculated using the equation: (A450 of treated sample/A450 of control) ×100%. The median lethal concentration (LC50) was obtained by using the SPSS 20.0 statistical software.
Autophagosome detection
INS-1 cells (1 × 10⁵/mL) were pretreated with 0, 50, 100, and 200 μM α-LA for 4 h and then treated with 30 μM NaAsO2 for 24 h. Afterward, the cells were digested with pancreatin, collected in a 10 mL centrifuge tube, and centrifuged for 3 min at 1000 r/min. The supernatant was adsorbed, and the cells were re-suspended with PBS (pH7.2) and further centrifugation at 1000 r/min for 3 min. Then the PBS was discarded, and 1 mL of 2.5% glutaraldehyde was added to fix the cells. The cells were placed at 4°C for 24 h, sliced, and observed by transmission electron microscopy (Hitachi, Japan).
Autophagic vesicle staining
Prepared polyethyleneimine (PEI) solutions were added to green the fluorescent protein microtubule (GFP)-LC3 dilution, mixed, and let stand for 20 min. A 1 mL of the transfection mixture of GFP-LC3 and PEI was added to each well of the cell plate and incubated for 6 h. Then, the transfection mixture was discarded, and whole medium was added and incubated for 24 h. After incubation, the cells were pretreated with 0, 50, 100, and 200 μM α-LA for 4 h and then treated with 30 μM NaAsO2 for 24 h. The treated cells were washed twice with PBS buffer, fixed with 4% paraformaldehyde for 10 min, washed twice with PBS buffer for 5 min at room temperature, and added with 100 μM diamidinophenylindole (DAPI) solution. Afterward, DAPI was discarded. The cells were washed twice with PBS, added with 100 μM anti-fluorescence quencher, sealed, and observed under a laser confocal microscope (Olympus, Japan).
Western blot detection
INS-1 cells (1 × 10⁵/mL) were pretreated with 0 and10 μM chloroquine (CQ, Sigma) 13 ; then treated with 50, 100, and 200 μM α-LA and 0.1 μM rapamycin for 4 h 14 ; and incubated with 30 μM NaAsO2 for 24 h. At the time of the designated treatments, the cells were washed twice with ice-cold PBS and completely lysed in lysis buffer according to the instruction of the protein extraction kit (Solarbio). The cell lysate was centrifuged at 12,000 × g at 4°C for 10 min, and the supernatants containing total protein were isolated. Total protein concentration was detected by the BCA method. Sodium dodecyl sulfatepolyacrylamide gel electrophoresis was performed and the proteins were transferred to a polyvinylidene membrane. The blots were blocked with 10% non-fat milk, incubated with primary antibodies against LC3B (CST), P62 (CST), phosphatidylinositol 3-kinase (PI3K, CST), and mammalian target of rapamycin (mTOR, CST), and β-actin (Santa Cruz Biotechnology); and then incubated with horseradish peroxidase-conjugated secondary antibodies at room temperature. The color was displayed by enhanced chemiluminescence. The expected band was observed using the Bio-Rad gel imaging system. The relative concentrations of LC3B, P62, mTOR, and PI3K (normalized to β-actin) were detected using the Gel-Pro Analyzer 4.0 software. The results were representative of three independent experiments.
Statistical analysis
The data were analyzed using the SPSS 20.0 software. Counting data were analyzed by single-factor ANOVA, and a comparison between the mean values of multiple groups was performed by least significant difference method. p < 0.05 was considered significant.
Results
Inhibitory effect of α-LA on the NaAsO2-induced autophagic death of INS-1 cells
The CCK-8 assay was used to measure the inhibitory effect of α-LA in cell viability after induced by NaAsO2. The results showed that the viability of INS-1 cells decreased and the inhibition rate of cell proliferation increased after induced by NaAsO2 (p < 0.05, vs. control). α-LA increased INS-1 cell viability and decreased the inhibition rate of cell proliferation, reversed the cytotoxicity induced by NaAsO2 in a concentration-dependent manner (p < 0.05, vs. NaAsO2 treat group. Figure 1). α-LA inhibited the proliferation of INS-1 cells which were pretreated with NaAsO2. The cell viability was detected by the CCK-8 assay, INS-1 cells were pretreated with 30 μM NaAsO2 for 24 hrs and then were treated with α-LA at a concentration of 200, 100, 50 μM for 4 hrs respectively. The viability of INS-1 cells decreased and the inhibition rate of cell proliferation increased after induced by NaAsO2 (
*
p < 0.05, vs. control). α-LA decreased the inhibition rate of cell proliferation in a concentration-dependent manner (#p < 0.05 vs. NaAsO2). The trace represents the means ± SD, n = 3.
Inhibitory effect of α-LA on NaAsO2-induced autophagosome accumulation in INS-1 cells
Autophagosome aggregation was observed by transmission electron microscopy. After the cells were treated with NaAsO2 for 24 h, the autophagosomes increased cumulatively compared with that of the control group. INS-1 cells were pretreated with α-LA for 4 h and then treated with NaAsO2 to evaluate the role of α-LA in the accumulation of autophagosomes induced by NaAsO2. As shown by the arrow in the figure below, α-LA pretreatment decreased the autophagosome accumulation induced by NaAsO2 (Figure 2). Inhibitory effect of α-LA on NaAsO2 induced autophagosomes accumulation in INS-1 cells. (a) Control group; (b) INS-1 cells were treated with 30 μM NaAsO2 for 24 hrs. (c) INS-1 cells were pretreated with 200 μM α-LA for 4 hrs and then treated with 30 μM NaAsO2 for 24 hrs. (d) INS-1 cells were pretreated with 100 μM α-LA for 4 hrs and then treated with 30 μM NaAsO2 for 24 hrs. (e) INS-1 cells were pretreated with 50 μM α-LA for 4 hrs and then treated with 30 μM NaAsO2 for 24 hrs. The autophagosomes were observed under the transmission electron microscopy, the arrow indicated the autophagosomes (scale bar = 1.0 μm).
Effect of α-LA on the expression of GFP-LC3 in INS-1 cells treated with NaAsO2
The autophagosomes in cells transfected with GFP-LC3 plasmid were stained green and observed under a laser scanning con-focal microscope. The number of autophagosomes increased considerably compared to the control after NaAsO2 treatment for 24 h. INS-1 cells were pretreated with α-LA and then treated with NaAsO2 to evaluate the role of α-LA in NaAsO2-induced autophagosome accumulation. α-LA pretreatment relieved autophagosome accumulation markedly compared with the cells without NaAsO2 treatment (Figure 3). Effect of α-LA on expression of GFP-LC3 in INS-1 cells treated with NaAsO2. INS-1 cells were treated with or without 30 μM NaAsO2 for 24 hrs. INS-1 cells were pretreated or not pretreated with α-LA 50,100, 200 μM for 4 hrs and then treated with 30 μM NaAsO2 for 24 hrs. The autophagosomes were stained green with plasmid GFP-LC3 and the nuclei were stained blue with DAPI (scale bar = 10 μm).
Effect of α-LA on the expression of LC3II, P62, PI3K, and mTOR proteins in INS-1 cells treated with NaAsO2
The results of the Western blot assay showed that NaAsO2 treatment increased the expression of LC3-II (Figure 4(a)) and P62 (Figure 4(b)) and decreased the expression of PI3K (Figure 4(c)) and mTOR (Figure 4(d)), whereas pretreatment with α-LA decreased the expression of LC3-II (Figure 4(a)) and P62 (Figure 4(b)) and increased the expression of PI3K (Figure 4(c)) and mTOR (Figure 4(d)). Results of α-LA on the expression of LC3II, mTOR, P62, PI3K proteins in INS-1 cells treated with NaAsO2. INS-1 cells were pretreated or not pretreated with α-LA 200, 100, 50 μM for 4 hrs and then treated with 30 μM NaAsO2 for 24 hrs. The cytoplasmic protein fraction was analyzed by Western blot. β-actin was used as an internal control. Counter densitometric analyses of LC3-II, P62, PI3K and mTOR expression in the INS-1 cells. The relative expression level of LC3-II (a), P62 (b), PI3K (c) and mTOR (d) was demonstrated as a percentage of the level of β-actin. (*p < 0.05 vs. control; #p < 0.05 vs. NaAsO2, n = 3).
Effects of CQ on the expression of LC3 II, P62, PI3K and mTOR in INS-1 cells treated with NaAsO2
CQ was used to prevent autophagosome-lysosome fusion to further study the mechanism by which NaAsO2 induces autophagy. CQ (10 μM) was used as an inhibitor of autophagosome-lysosome fusion in a previous study.
15
Therefore, in this study, the cells were pretreated with 0 or 10 μM CQ for 4 h and then treated with 30 μM NaAsO2 for 24 h. The results showed that CQ reduced LC3-II accumulation (Figure 5(a)) and increased the expression of P62 (Figure 5(b)), PI3K (Figure 5(c)), and mTOR (Figure 5(d)) compared with NaAsO2 treatment. Effects of CQ on the expression of LC3II, P62, PI3K and mTOR in INS-1 cells treated with NaAsO2. INS-1 cells were pretreated or not pretreated with CQ 10 μM for 4 hrs and then treated with 30 μM NaAsO2 for 24 hrs. The cytoplasmic protein fraction was analyzed by Western blot. β-actin was used as an internal control. Counter densitometric analyses of LC3-II, P62, PI3K and mTOR expression in the INS-1 cells. The relative expression of LC3-II (a), P62 (b), PI3K (c) and mTOR (d) was demonstrated as a percentage of the level of β-actin. (*p < 0.05 vs. control; #p < 0.05 vs. cells without treated with CQ and with the NaAsO2, n = 3).
Effect of α-LA on the expression of LC3II, P62, PI3K and mTOR proteins in INS-1 cells treated with rapamycin
Previous experimental results have shown that α-LA can inhibit NaAsO2-induced autophagy, but its mechanism needs to be further explored. Therefore, rapamycin (mTOR inhibitor) was used to further investigate whether the inhibition effect of α-LA on NaAsO2-induced autophagy is related to the mTOR pathway. The cells were pretreated with 0 or 200 μM α-LA for 4 h and then treated with 0.1 μM rapamycin for 24 h. The Western blot results showed that compared with the control, rapamycin (100 nM) increased the expression of LC3-II (Figure 6(a)) and decreased the expression of P62 (Figure 6(b)), PI3K (Figure 6(c)), and mTOR (Figure 6(d)). Treatment with rapamycin (100 nM) + α-LA (200 μM) decreased the expression of LC3-II (Figure 6(a)) and increased the expression of P62 (Figure 6(b)), PI3K (Figure 6(c)), and mTOR (Figure 6(d)). Role of α-LA on the expression of LC3II, mTOR, P62, PI3K proteins in INS-1 cells treated with rapamycin. INS-1 cells were treated with 0 μM or 0.1 μM rapamycin for 24 hrs. INS-1 cells were pretreated or not pretreated with α-LA 200 μM for 4 hrs and then treated with 0.1 μM rapamycin for 24 hrs. The cytoplasmic protein fraction was analysed by Western blot. β-actin was used as an internal control. Densitometric analyses of LC3-II (a), P62 (b), PI3K (c) and mTOR (d) expressed in INS-1 cells. The relative expression of LC3-II, P62, PI3K and mTOR was displayed as a percentage of the level of β-actin. (*p < 0.05 vs. control; #p < 0.05 vs. cells treated with the rapamycin only, n = 3).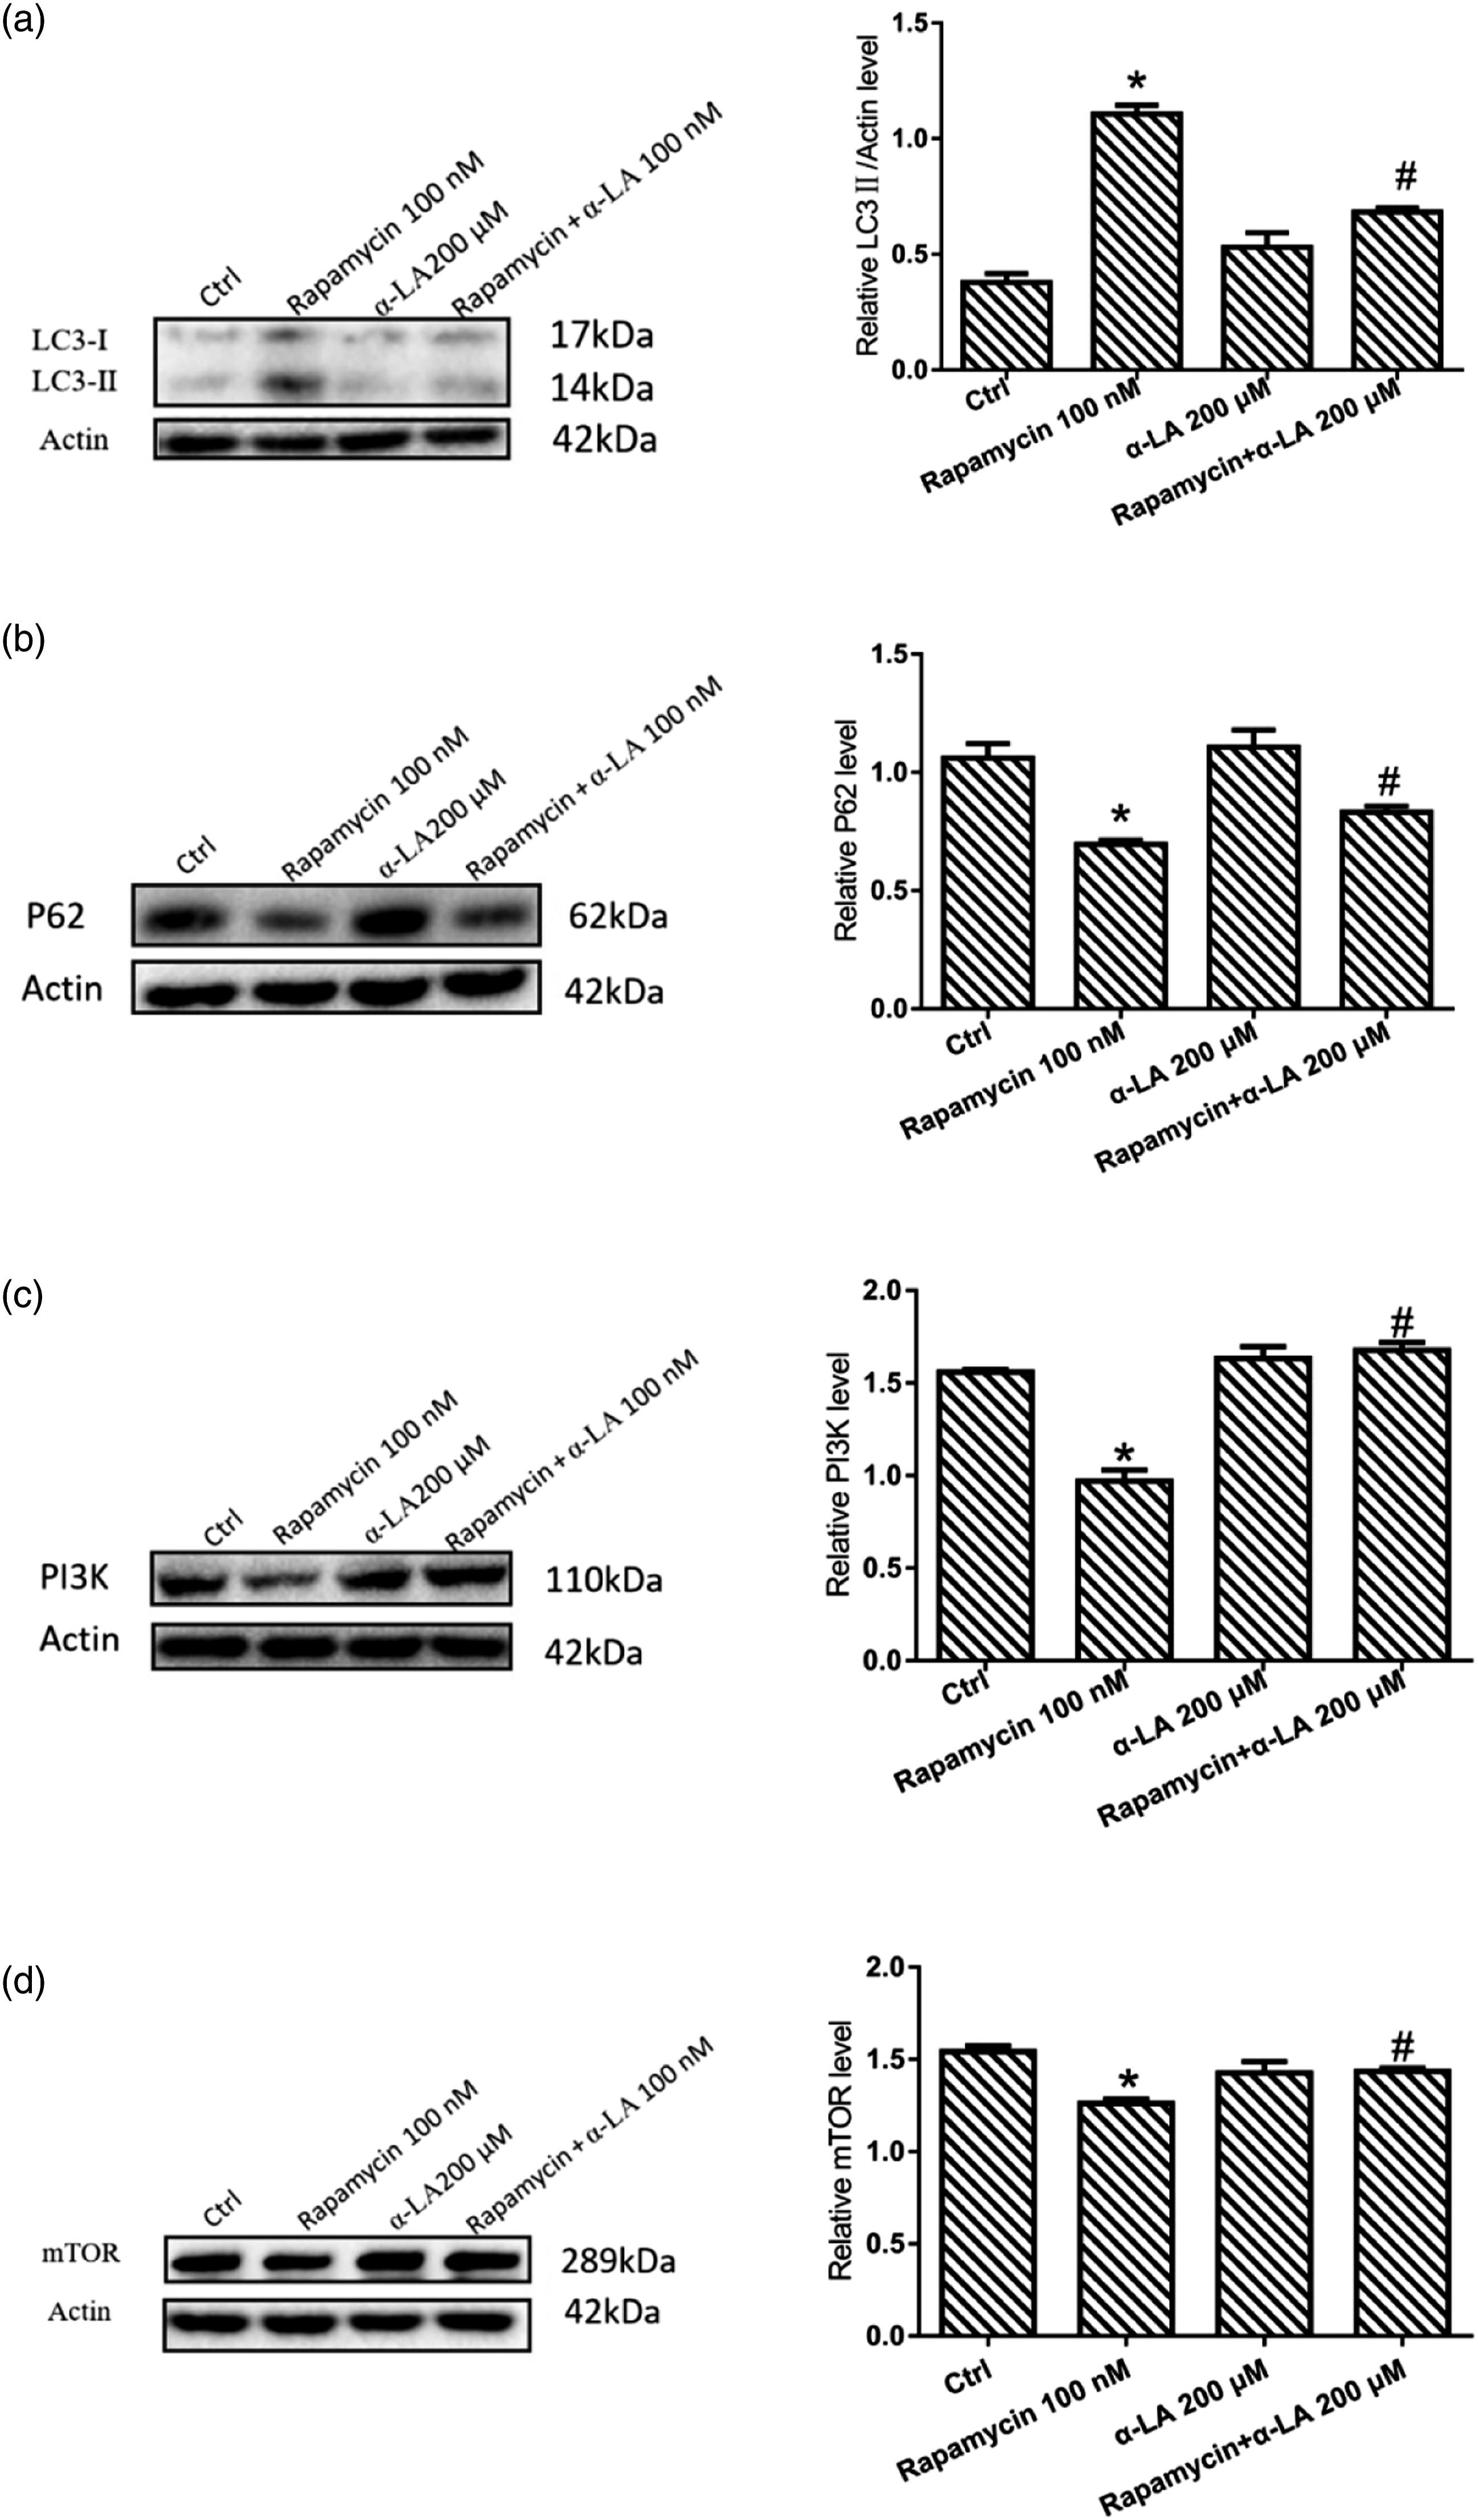
Discussion
This study aimed to investigate the role of α-LA in NaAsO2-induced autophagic cell death. The present study showed that NaAsO2 could induce autophagic death, α-LA could protect the NaAsO2 induced autophagic death of INS-1 cells, and the specific mechanism may be related to the regulation of the PI3K/mTOR signaling pathway.
Some studies have shown that arsenic exposure can induce autophagy activation, but the specific mechanism has not been fully clarified. An increasing number of epidemiological studies found an increase in the prevalence of T2DM in areas exposed to arsenic, but the relationship between arsenic exposure and T2DM is unclear. As the target organ of insulin secretion, functional changes in the pancreas play an important role in the occurrence and development of diabetes. Rat INS-1 cells are easy to feed and have similar functions as normal islet cells; therefore, they can be used in islet-related studies. INS-1 cells were used as the research object in this study to explore the relationship between arsenic exposure and T2DM.
Arsenic is a kind of pollutant widely existing in nature that has two forms (i.e., inorganic, and organic arsenic) and two valence states (i.e., trivalent, and pentavalent), which are toxic. The toxicity of inorganic arsenic is stronger than that of organic arsenic, whereas trivalent arsenic is stronger than pentavalent arsenic. NaAsO2 is commonly used in experimental studies for related research.
In this study, we performed cell viability tests and found that NaAsO2 could induce INS-1 cell death. We detected the formation of autophagosomes in INS-1 cells further exploring the mechanism of autophagic death. When cells receive autophagy induction signals, they will form autophagic vesicles in the cytoplasm. The autophagic vesicles continue to extend and finally form closed annular autophagic corpuscles with double-layered membranes. The formation of autophagic corpuscles, which is one of the morphological gold indicators for autophagy detection, was detected by transmission electron microscopy. The formation of bilayer-membraned autophagosomes and autophagic vacuoles in INS-1 cells increased after NaAsO2 treatment as observed under a transmission electron microscope. Autophagy formation is related to the microtubule, LC3. When autophagy is induced, cytoplasmic LC3-I will be enzymatically hydrolyzed to a small segment of polypeptide and transformed into LC3-II, therefore, LC3-II increased. 16 GFP-LC3 fusion protein can be used to trace autophagy formation using LC3-II aggregation. Observation using a laser scanning con-focal microscope revealed that INS-1 cells have bright green spot fluorescence aggregation after NaAsO2 treatment.
Moreover, we detected the expression of LC3-II, P62, PI3K, and mTOR proteins. LC3-II is considered the most reliable biochemical marker of autophagy. SQSTM1/P62 is a multifunctional, stress-induced, scaffold protein involved in multiple cellular processes, including autophagy clearance, regulation of inflammatory responses, and redox homeostasis, 17 and its level decreases when autophagy is activated. However, studies have shown that the increase in P62 level may be accompanied by autophagy activation under toxic stimulation and oxidative stress. 18 The formation of microtubule-associated protein (LC3) and autophagy-associated protein (LC3-II) increased during autophagy activation. LC3-II can combine with autophagic degradation substrate, P62, to form an interactive domain, and finally participate in autophagic lysosomal degradation. 19 LC3-II is also considered the most reliable biochemical marker of autophagy. Studies have shown that the NaAsO2-induced autophagy of INS-1 cell is due to activated autophagy flux rather than damaged autophagy clearance. PI3K is an important signal molecule in eukaryotes. According to Gao’s study that PI3K is related to autophagy activation. 20 In addition, mTOR protein kinase is the target of antifungal drug, rapamycin. mTOR activity depends on the regulation of the PI3K pathway. Under physiological conditions, tyrosine kinase receptor is activated by extracellular and intracellular factors, and then PI3Kis activated. Activated PI3K catalyzes substrates, PIP2 andPIP3. PIP3 cooperates with phosphoinositide-dependent kinase-1 to transmit signals to mTOR and increase m TOR activation. 21 The expression of mTOR protein in cells decreases when autophagy occurs.22,23 Overall, we found that the results of all indicators considerably changed compared with the blank control group. More importantly, after the application of autophagy specific inhibitor, CQ, the NaAsO2-induced LC3-II protein expression in INS-1 cells decreased, whereas the protein expression levels of P62, PI3K, and mTOR increased. This result suggests that NaAsO2 can induce the autophagy activation of INS-1 cells leading to autophagic cell death.
Find the right drugs for intervention is of great importance in the study of the relationship between diseases. It has been reported that α-LA is used as an adjuvant therapy for diabetes in clinical practice and can reduce the toxic effect of heavy metals on mercaptoenzymes, reduce the accumulation of heavy metals in the body, plays a certain role in autophagy. 24 Therefore, we used α-LA as an intervention drug to investigate its related effects on the NaAsO2-induced autophagic death of INS-1 cells. We also detected cell viability, autophagosome generation, and the expression of plasmid GFP-LC3 and related proteins (LC3-II, P62, PI3K, and mTOR). The results showed that α-LA had a protective effect against the autophagic death of INS-1 cells induced by NaAsO2. We applied the autophagy inducer, rapamycin, to further investigate its mechanism and found that α-LA could downregulate the expression of LC3-II protein in rapamycin-induced INS-1 cells and up-regulate the expression of P62, PI3K, and mTOR proteins.
In conclusion, this study suggests that NaAsO2-induced INS-1 autophagy death may be related to the autophagy pathway. Alpha-LA can improve NaAsO2-induced INS-1 cell death and the regulation of the PI3K/mTOR signaling pathway involved this process. Therefore, the relationship between arsenic and autophagy was explored. α-LA as an intervention drug had a certain protective effect against the autophagic death of INS-1 cells induced by NaAsO2. This effect could expand the clinical value of α-LA.
Conclusion
This study found that NaAsO2 induces the autophagic death of INS-1 cells, and α-LA can inhibit the NaAsO2-induced autophagic death of INS-1 cells through the PI3K/mTOR signaling pathway. The target organ of insulin secretion is the pancreas. Therefore, we speculated whether NaAsO2 can cause insulin secretion disorder. The result shows that the incidence of diabetes is increased in arsenic-exposed areas. This study is only a preliminary study of the autophagy pathway. The subsequent research will further clarify the relevant molecular mechanisms through in vivo experiments. In vivo and in vitro experiments will be conducted to further investigate the relationship between arsenic and diabetes. In terms of drug intervention, the role of α-LA in the treatment of NaAsO2 and diabetes will also be further studied to provide a new direction for the treatment of diabetes in arsenic-exposed areas and create more value for the clinical application of α-LA.
Footnotes
Author contributions
All authors were participated in this study. YC: Conceptualization, Formal analysis, Writing - original draft. XLY: Validation. WJT: Validation. QF: Validation. HL: Methodology, BL: Conceptualization, Data curation, Writing - review & editing, Supervision, Funding acquisition, Project administration. All authors read and verified the previous versions of the manuscript, and approved the final manuscript.
Declaration of conflicting interests
The author(s) declared no potential conflicts of interest with respect to the research, authorship, and/or publication of this article.
Funding
The author(s) disclosed receipt of the following financial support for the research, authorship, and/or publication of this article: This work was supported by the National Natural Science Foundation of China (81760575), and Science and Technology Fund Project of Health Commission of Guizhou Province, China (gzwkj2021-426).
Ethics approval and consent to participate
All experiments were approved by the Experimental Animal Ethics Committee of Guizhou Medical University for the ethical use (No. 1702227).
Availability of data and materials
The datasets used and/or analyzed during the current study are available from the corresponding author on reasonable request.