
Abstract
Objective
Propranolol is used to treat several cardiovascular diseases; however, toxic doses of propranolol cause severe myocardial depression and cardiac arrest. The aim of this study was to examine the effects of lipid emulsion (LE) on cardiotoxicity induced by toxic doses of propranolol in H9C2 rat cardiomyoblast cell line and to elucidate the underlying mechanism.
Methods
The experimental groups comprised control, propranolol alone, esmolol alone, or LE followed by propranolol or esmolol treatment, and reactive oxygen species (ROS) inhibitor N-acetyl-L-cysteine (NAC) followed by propranolol treatment. The effects of propranolol, esmolol, NAC, and LE, alone or in combination, on cell viability, apoptosis, and ROS production were examined. Additionally, we investigated the effect of LE on propranolol concentration.
Results
LE and NAC reversed the inhibition of cell viability induced by propranolol (p < .001). However, LE had no effect on the inhibition of cell viability caused by esmolol. The LE inhibited propranolol-induced expressions of cleaved caspase-3 (p < .001), caspase-9 (p < .001), and Bax (p < .01), but not caspase-8. NAC inhibited the propranolol-induced expression of cleaved caspase-3. LE inhibited propranolol-induced early apoptosis, but had no effect on late apoptosis. Additionally, LE inhibited the number of terminal deoxynucleotidyl transferase dUTP nick end labeling-positive cells generated by propranolol. It attenuated propranolol-induced ROS production. However, it had no effect on propranolol concentration.
Conclusion
LE inhibits early apoptosis caused by a toxic dose of propranolol by suppressing the intrinsic apoptotic pathway, via direct inhibition of ROS production.
Introduction
The β-blocker propranolol, which causes a reduction in cardiac contractility and heart rate, is used for the treatment of atrial fibrillation, heart failure, and coronary artery disease.1,2 Toxic doses of propranolol (toxic plasma concentration: 3 μg/mL) cause bradycardia, myocardial depression, and shock, leading to cardiac arrest.1,3,4,5 The cardiovascular depression and central nervous system-related symptoms caused by propranolol are usually treated by administering a vasopressor, atropine, benzodiazepine, calcium, sodium bicarbonate, or magnesium; use of a bronchodilator; maintenance of the airway; high-dose insulin euglycemic treatment; or gastric lavage. 1 However, in cases wherein propranolol (Log[octanol/water partition coefficient of propranolol] = 3.48) toxicity is unresponsive to the abovementioned treatments, a lipid emulsion (LE) reportedly ameliorates hemodynamic depression, in both pediatric and adult patients.6–9 In addition, it has been reported that patients with cardiovascular collapse induced by an overdose of combination drugs, including propranolol, and who are unresponsive to supportive treatments can be treated with LEs.10,11 Low doses of LE (Intralipid) prolong the survival of rats that are administered toxic levels of propranolol compared to those treated with Clinoleic. 12 Toxic doses of propranolol can induce apoptosis and cause cardiotoxicity in human ovarian cancer cells and rat cardiac mitochondria, respectively, via inducing reactive oxygen species (ROS) production.13,14 The ROS inhibitor N-acetyl-L-cysteine (NAC) attenuates bupivacaine-induced cardiotoxicity, suggesting its mediation by ROS. 15 LEs were originally developed for parenteral nutrition and are also used for the treatment of local-anesthetic induced systemic toxicity. 16 LE can attenuate apoptosis and cardiac toxicity induced by toxic doses of bupivacaine and doxorubicin via inhibiting ROS production, leading to attenuation of undesirable mitochondrial-membrane depolarization.17,18 However, the effect of LEs on cardiac myocyte toxicity induced by highly lipophilic β-blockers, such as propranolol, remains to be determined. Herein, we investigated the effects of a LE (Intralipid) on propranolol-induced cardiac toxicity in H9C2 rat cardiomyoblasts and explored the associated cellular mechanisms.
Materials and methods
Experimental subjects were divided into the following groups: control (no treatment), propranolol alone, esmolol alone, LE followed by propranolol, LE followed by esmolol, NAC followed by propranolol, or LE and NAC alone.
Drugs and chemicals
The drugs and chemicals used were of the highest purity that was commercially available. Propranolol, NAC, 4′, 6-diamidino-2-phenylindole (DAPI), 2′, 7′-dichlorofluorescin-diacetate (DCF-DA), and anti-β actin antibody were obtained from Sigma Aldrich (St Louis, MO, USA). Esmolol was purchased from Jeil Pharmaceutical Co., Ltd. (Seoul, Korea). Intralipid (20%) was obtained from Fresenius Kabi AB (Uppsala, Sweden). Anti-cleaved caspase-8 antibody was obtained from Novus Biologicals (Littleton, CO, USA). Anti-cleaved caspase-3 and anti-Bax antibodies as well as radio-immunoprecipitation assay lysis buffer were purchased from Cell Signaling Technology (Beverly, MA, USA). Anti-caspase-9 antibody was obtained from Enzo Life Sciences (Farmingdale, NY, USA). Protease and phosphatase inhibitor cocktails were obtained from Thermo Fisher Scientific (Rockfield, IL, USA). Dulbecco’s Modified Eagle’s Medium (DMEM), 10% fetal bovine serum (FBS), penicillin, streptomycin, and phosphate-buffered saline (PBS) were obtained from Gibco (Life Technologies, Grand Island, NY, USA).
Cell culture
H9C2 cardiomyoblasts were purchased from the American Type Culture Collection (Rockville, MD, USA) and cultured in high-glucose DMEM supplemented with 10% FBS, 100 units/mL penicillin, and 100 μg/mL streptomycin, as described previously. 19 The cells were maintained in a humidified incubator at 37°C with 5% CO2. The cells were cultured in serum-free media for 16 h prior to drug treatment. The serum-free medium was used to remove the effect of several minor components present in serum and thereby examine the effect of the treatments used here in isolation. 20
Cell viability assay
Cell viability was detected using a Cell Counting Kit 8 (CCK-8) (Dojindo Molecular Technologies, Kumamoto, Japan) according to the manufacturer’s instructions, as described previously. 19 Briefly, H9C2 cells were seeded (2 × 10⁴ cells/well) into 24-well plates and treated with various concentrations of propranolol (1 × 10⁻⁵, 3 × 10⁻⁵, 1 × 10⁻⁴, or 2 × 10⁻⁴ M) or esmolol (1 × 10⁻⁴, 3 × 10⁻⁴, 1 × 10⁻³, or 2 × 10⁻³ M) alone for 24 h. 5 To examine the effects of the LE (Intralipid) on the inhibition of cell viability induced by toxic concentrations of propranolol or esmolol, cells were treated with propranolol (1 × 10⁻⁴ M) or esmolol (1 × 10⁻³ M) alone for 24 h, LE (0.1 or 0.2%) for 1 h followed by propranolol (1 × 10⁻⁴ M) or esmolol (1 × 10⁻³ M) for 24 h, or LE (0.1 or 0.2%) alone for 25 h. 5 To examine the effects of the ROS scavenger NAC on the inhibition of cell viability induced by toxic concentrations of propranolol, the cells were treated with propranolol (1.5 × 10⁻⁴ M) alone for 3 h, NAC (2 × 10⁻² or 3 × 10⁻² M) for 1 h followed by propranolol (1.5 × 10⁻⁴ M) for 3 h, or NAC (2 × 10⁻² or 3 × 10⁻² M) alone for 4 h.21,22 After treatment, 500 μL DMEM containing 10% CCK-8 solution was added, and the cells were incubated for 3 h at 37°C and 5% CO2 atmosphere. The absorbance of each well was measured at 450 nm using a VersaMax® (Molecular Devices, Sunnyvale, CA, USA).
Scratch wound healing assay
A scratch wound healing assay was performed to examine the effects of LE on the inhibition of propranolol- or esmolol-induced cell migration in rat cardiomyoblasts. Briefly, H9C2 cells were seeded (1 × 10⁶ cells) in 100 mm plates and cultured at 37°C in a 5% CO2 incubator. The cells were incubated overnight in serum-starved medium. The H9C2 cells were grown to 90–100% confluency, and then scratches were made with a 200 μL pipette tip, as described previously. 23 Cells were washed with PBS, and growth media was added. Cell images were captured using a microscope (Nikon Eclipse Ti2; Nikon Co., Tokyo, Japan). Subsequently, the cells were treated with propranolol (1 × 10⁻⁴ M) or esmolol (1 × 10⁻³ M) alone for 18 h, LE (0.1%) for 1 h followed by propranolol (1 × 10⁻⁴ M) or esmolol (1 × 10⁻³ M) treatment for 18 h, and LE (0.1%) alone for 19 h. Images were captured as described above.
Western blot analysis
The expressions of cleaved caspase-3, cleaved caspase-8, cleaved caspase-9, and Bax in H9C2 cells were assessed by western blot analysis, as described previously. 19 To determine cleaved caspase-3 and caspase-9 expressions, cells were treated with propranolol (1 × 10⁻⁴ M) alone for 6 h, LE (0.1%) for 1 h followed by propranolol (1 × 10⁻⁴ M) for 6 h, or LE (0.1%) alone for 7 h. To determine Bax and cleaved caspase-8 expressions, cells were treated with propranolol (1 × 10⁻⁴ M) alone for 1 h, LE (0.1%) for 1 h followed by propranolol (1 × 10⁻⁴ M) for 1 h, or LE (0.1%) alone for 2 h. To examine the effects of the ROS inhibitor NAC on propranolol-induced expression of cleaved caspase-3, cells were treated with propranolol (1.5 × 10⁻⁴ M) alone for 3 h, NAC (2 × 10⁻² M) for 1 h followed by propranolol (1.5 × 10⁻⁴ M) for 3 h, or NAC (2 × 10⁻² M) alone for 4 h. After treatment, the cells were collected and lysed using radio-immunoprecipitation assay lysis buffer containing a protease inhibitor cocktail and phosphatase inhibitor cocktail. The lysates were centrifuged (20,000 g, 15 min, 4°C), and the supernatant containing the total protein was used to determine the protein concentration using a bicinchoninic acid protein assay reagent kit (Thermo Fisher Scientific). After boiling at 100°C for 10 min, the proteins were separated by performing sodium dodecyl sulfate-polyacrylamide gel electrophoresis, using 10–15% resolving gels. Once separated, the proteins were transferred onto polyvinylidene difluoride membranes (Millipore, Bedford, MA, USA). Following blocking with 5% skim milk in Tris-buffered saline with 0.5% Tween-20 (TBST) at room temperature (22–27°C) for 1 h, the membranes were incubated overnight at 4°C with primary antibodies (anti-cleaved caspase-3 [1:1000], anti-cleaved caspase-8 [1:1000], anti-Bax [1:1000], anti-caspase-9 [1:1000] and anti-β-actin [1:10000] antibody). After washing with TBST, the membranes were incubated with horseradish peroxidase-conjugated anti-rabbit or anti-mouse IgG diluted to 1:5000 for 1 h at room temperature. Immune complexes were visualized using a WesternbrightTM ECL western blotting detection kit (Advansta, Menlo Park, CA, USA), and images were captured using the ChemiDocTM Touch Imaging System (Bio-Rad Laboratories Inc., Hercules, CA, USA). Signal intensity was measured using ImageJ software (version 1.45 s; National Institutes of Health, Bethesda, MD, USA).
Annexin V-fluorescein isothiocyanate-propidium iodide staining
The effect of the LE on propranolol-induced early and late apoptosis in H9C2 cells was measured using a fluorescein isothiocyanate (FITC) Annexin V Apoptosis Detection Kit (Invitrogen-Life Technologies, Carlsbad, CA, USA) on a flow cytometer according to the previously described manufacturer’s protocol. 19 Briefly, cells were seeded in 6-well plates (1 × 10⁵ cells/well) and treated with propranolol (1 × 10⁻⁴ M) alone for 6 h, LE (0.1%) for 1 h followed by propranolol (1 × 10⁻⁴ M) for 6 h, or LE (0.1%) alone for 7 h. After treatment, cells were harvested, washed twice with PBS, and suspended in 1X binding buffer. The suspended cells were stained with Annexin V-FITC and propidium iodide working solution (100 μg/mL) for 15 min in dark at room temperature. Then, the cells were suspended in 1X binding buffer and immediately examined using a BD LSRFortessa X-20 flow cytometer (BD Biosciences, Franklin Lakes, NJ, USA) to detect the apoptosis rate. The results were analyzed using the BD FACSDiva software (version 6.0; BD Biosciences).
Terminal deoxynucleotidyl transferase dUTP nick end labeling assay
A terminal deoxynucleotidyl transferase dUTP nick end labeling (TUNEL) assay was performed to detect apoptosis using a TUNEL kit (Roche Applied Science, Indianapolis, IN, USA) according to the manufacturer’s protocol, as described previously. 19 Briefly, H9C2 cells were treated with propranolol (1 × 10⁻⁴ M) alone for 6 h, LE (0.1%) for 1 h followed by propranolol (1 × 10⁻⁴ M) for 6 h, or LE (0.1%) alone for 7 h. The nuclei of apoptotic and non-apoptotic cells were counterstained with DAPI. Fluorescence staining was observed using a fluorescence microscope (Olympus Optical Co. Ltd., Fluoview 500, Tokyo, Japan). The percentage of apoptotic cells was calculated as the ratio of the number of TUNEL-positive cells to the total number of DAPI-stained cells.
Measurement of intracellular reactive oxygen species
Intracellular ROS levels were measured using DCF-DA, as described previously. 17 Briefly, H9C2 cells (1 × 10⁵ cells/well) were seeded onto 6-well plates and treated with propranolol (1 × 10⁻⁴ M) alone for 1 h, LE (0.1%) for 1 h followed by propranolol (1 × 10⁻⁴ M) for 1 h, or LE (0.1%) alone for 2 h. After treatment, the cells were incubated with 5 μM DCF-DA for 30 min at 37°C in the dark. The fluorescence intensity was measured using a BD LSRFortessa X-20 flow cytometer (BD Biosciences), and fluorescent images were analyzed using the BD FACSDiva software (version 6.0; BD Biosciences).
Effect of the LE on propranolol concentration
Propranolol (1 × 10⁻⁴ M) in distilled water was emulsified with 0.1% Intralipid using a rotator for 30 min, as described previously. 19 After emulsification, the solution was centrifuged (27,237 × g, 4°C, 30 min). The concentration of propranolol released in the aqueous layer was measured by ultra-performance liquid chromatography-quadrupole time-of-flight mass spectrometry (UPLC-Q-TOF MS; Waters, Milford, MA, USA) with multiple reaction monitoring (MRM). A sample of the collected aqueous layer (1 µL) was injected into an Acquity UPLC BEH C18 column (100 mm × 2.1 mm, 1.7 μm, Waters) equilibrated with water/acetonitrile (95:5) containing 0.1% formic acid (FA). Propranolol in the sample was eluted with a linear gradient of acetonitrile (5%–100%) containing 0.1% FA at a flow rate of 0.35 mL/min for 7 min. The amount of eluted propranolol was detected by Q-TOF MS (Waters) with positive electrospray ionization with MRM. For analysis with MRM, m/z 140.13 and m/z 289.21 were used as the production and precursor ions of propranolol, respectively. The optimal conditions for MS analysis were as follows: capillary voltage of 3 kV, sampling cone voltage of 30 V, source temperature of 100°C, desolvation temperature of 400°C, and desolvation flow rate of 800 L/h. Lockspray with leucine-enkephalin ([M + H] = 556.2771 Da) was used at a frequency of 10 s to ensure reproducibility and accuracy of all analyses. All mass data were collected and analyzed using UIFI 1.8.2 (Waters).
Statistical analysis
Data are presented as the mean ± SD. The effects of propranolol, esmolol, or the LE, alone or in combination, on cell viability, cell migration, apoptotic protein expression, early and late apoptosis, TUNEL-positive cell number, and ROS production were analyzed using one-way analysis of variance followed by Bonferroni’s multiple comparison test or Kruskal–Wallis test followed by Dunn’s multiple comparison test (Prism, version 5.0; GraphPad Software, San Diego, CA, USA). The effects of the LE on propranolol concentration was analyzed using the Kruskal–Wallis test followed by Dunn’s multiple comparison test. Statistical significance was set at p < .05.
Results
Propranolol (3 × 10⁻⁵, 1 × 10⁻⁴ and 2 × 10⁻⁴ M) inhibited viability of H9C2 rat cardiomyoblasts (Figure 1(a); p < .001 versus control). In addition, esmolol (1 × 10⁻³ and 2 × 10⁻³) also inhibited cell viability (Figure 1(b); p < .001 versus control). LE (both 0.1 and 0.2%) reversed the inhibition of cell viability induced by the highly lipid-soluble β-blocker propranolol (1 × 10⁻⁴ M) (Figure 1(c); p < .001 versus propranolol alone). By contrast, it had no effect on inhibition of cell viability induced by the less lipid-soluble β-blocker esmolol (1 × 10⁻³ M) (Figure 1(d)). The ROS inhibitor NAC (2 × 10⁻², and 3 × 10⁻² M) attenuated propranolol-induced cell viability inhibition (1.5 × 10⁻⁴ M) (Figure 1(e): p < .001 versus propranolol alone). Consistent with these results, propranolol (1 × 10⁻⁴ M) and esmolol (1 × 10⁻³ M) inhibited cell migration (Figures 2(a) and (b); p < .001 versus control). The combined treatment with LE (0.1%) and propranolol (1 × 10⁻⁴ M) inhibited cell migration lesser than propranolol (1 × 10⁻⁴ M) treatment alone did (Figure 2(a); p < .01), whereas the combined treatment with LE and esmolol (1 × 10⁻³ M) had no effect on cell migration compared to that observed with esmolol (1 × 10⁻³ M) treatment alone (Figure 2(b)). A and B: Effects of propranolol (N = 3) and esmolol (N = 3) on the viability of H9C2 rat cardiomyoblasts. Data are shown as mean ± SD. N indicates the number of independent experiments. Each experiment included four replicates. ***p < .001 versus control. Control indicates no treatment. C and D: Effects of the lipid emulsion (LE) on propranolol (10−4 M, N = 3)- and esmolol (10−3 M, N = 4)-induced inhibition of H9C2 rat cardiomyoblast viability. ***p < .001 versus control. #p < .001 versus propranolol. E: Effects of N-acetyl-L-cysteine (NAC, N = 3) on propranolol (1.5 × 10⁻⁴ M)-induced inhibition of rat cardiomyoblast viability. ***p < .001 versus control. #p < .001 versus propranolol. Effects of propranolol (1 × 10⁻⁴ M; A), esmolol (1 × 10⁻³ M, B), and the lipid emulsion (LE; 0.1%), alone or in combination, on scratch-wound healing in rat cardiomyoblasts. The edge of the wound is indicated by a solid line. The edge of migrated cells is indicated by a dotted line. The images were captured immediately, 18 and 19 h after introduction of the scratch wound (scale bar: 100 μm). Cell migration, which indicates the change in wound area before and after scratching, is expressed in percentage of wound area of the control after scratch wound. Data are shown as mean ± SD from three independent experiments including eight replicates in each group. *p < .001 versus control. †p < .01 versus propranolol. Control indicates no treatment.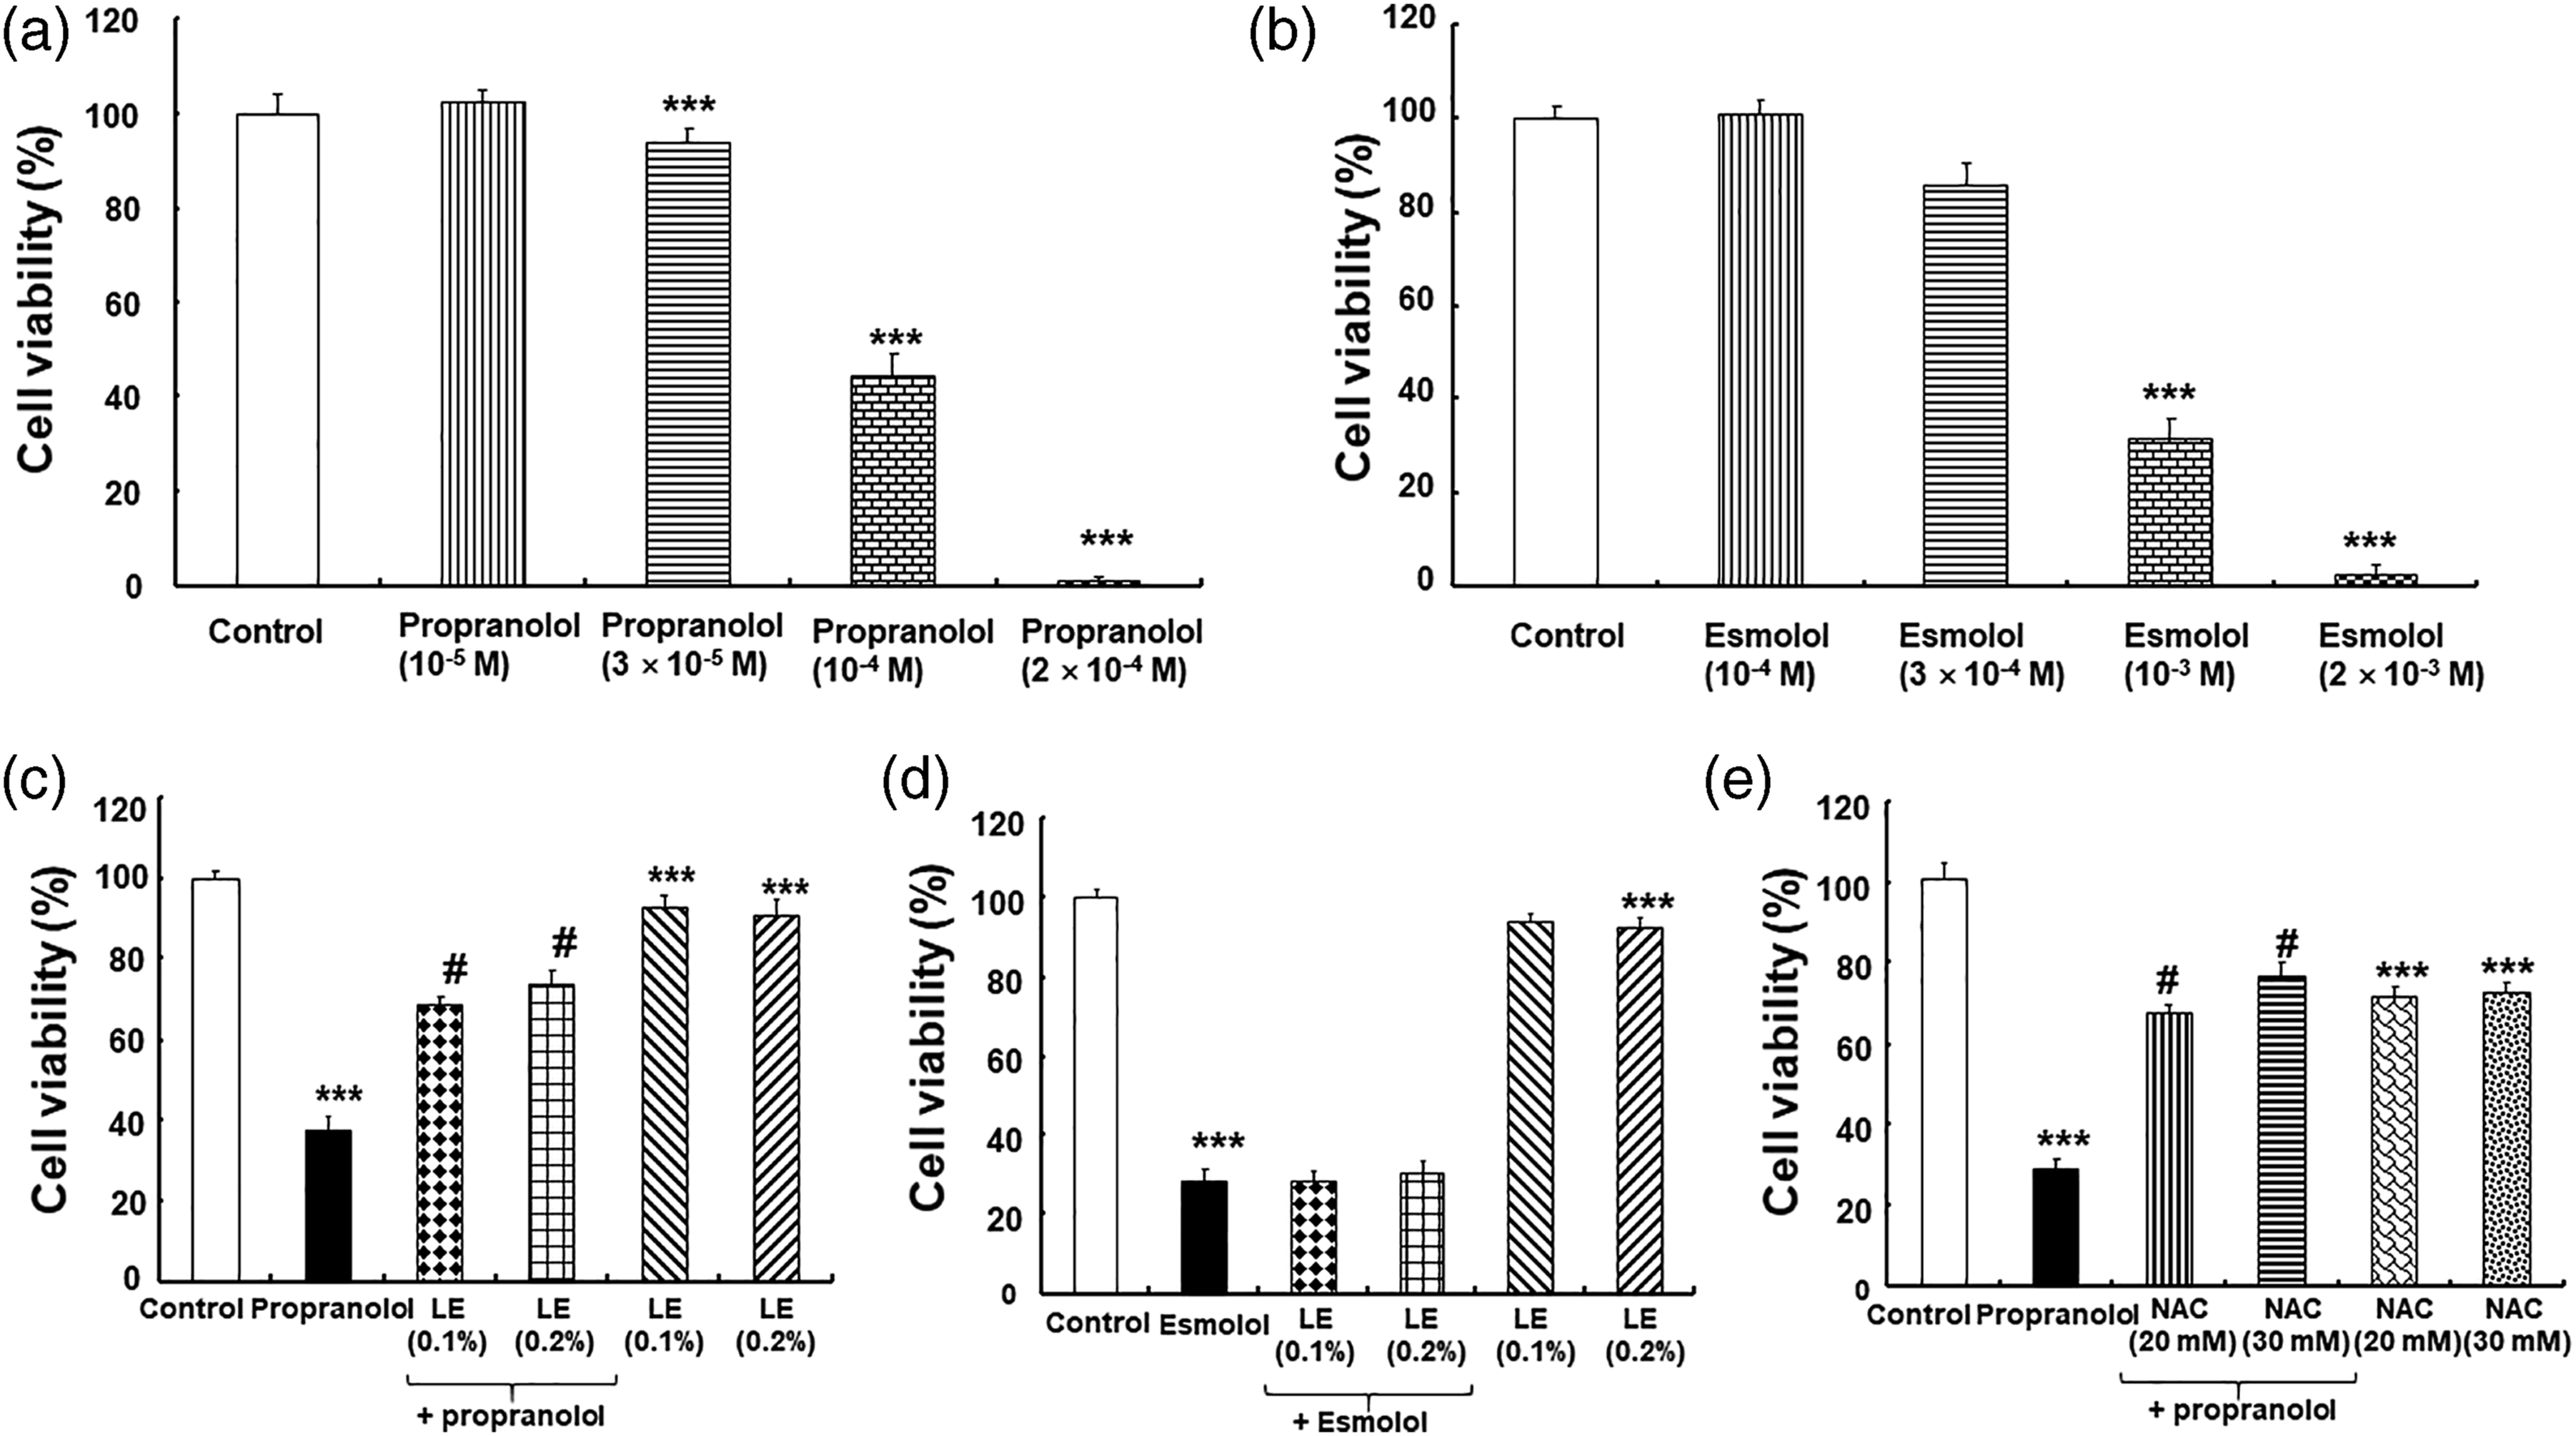

Propranolol (1 × 10⁻⁴ M) induced expression of cleaved caspase-3 (Figure 3(a); p < .001 versus control), whereas the LE (0.1%) attenuated propranolol-induced expression of cleaved caspase-3 (1 × 10⁻⁴ M) (Figure 3(a); p < .001 versus propranolol alone). Propranolol (1×10⁻⁴ M) enhanced the expression of the intrinsic pro-apoptotic protein Bax (Figure 3(b); p < .05 versus control), but it did not significantly alter the expression of cleaved caspase-8, an extrinsic pro-apoptotic protein (Figure 3(b)). Pretreatment with LE (0.1%) attenuated the elevated Bax expression induced by propranolol (1 × 10⁻⁴ M) (Figure 3(b); p < .01 versus propranolol alone). In contrast, pretreatment with LE did not significantly change the cleaved caspase-8 expression compared to that observed with propranolol treatment alone (Figure 3(b)). Propranolol (1 × 10⁻⁴ M) induced cleaved caspase-9 expression (Figure 3(c); p < .001 versus control), but LE pretreatment inhibited propranolol (1 × 10⁻⁴ M)-induced expression of cleaved caspase-9 (Figure 3(c); p < 0.001 versus propranolol alone). In addition, NAC (2 × 10⁻² M) inhibited the propranolol (1.5 × 10⁻⁴ M)-induced expression of cleaved caspase-3 (Figure 3(d); p < .001 versus propranolol alone). Propranolol (1 × 10⁻⁴ M) enhanced early and late apoptosis (Figure 4; p < .001 versus control). LE (0.1%) attenuated the early apoptosis caused by propranolol (1 × 10⁻⁴ M) (Figure 4; p < .001 versus propranolol alone), but it had no effect on late apoptosis induced by propranolol (1 × 10⁻⁴ M). Propranolol (1 × 10⁻⁴ M) increased the number of TUNEL-positive cells (Figure 5; p < .001 versus control). By contrast, LE (0.1%) decreased the number of TUNEL-positive cells generated in response to propranolol treatment (Figure 5; p < .001 versus propranolol alone). A, B, and C: Effects of propranolol (1 × 10⁻⁴ M) and the lipid emulsion (LE; 0.1%), alone or in combination, on cleaved caspase-3 (N = 5), Bax (N = 5), cleaved caspase-8 (N = 5), and cleaved caspase-9 (N = 4) expression in H9C2 rat cardiomyoblasts. Data are shown as mean ± SD. N indicates the number of independent experiments. *p < .05 and ***p < .001 versus control. †p < .01 and #p < .001 versus propranolol alone. Control indicates no treatment. D: Effects of N-acetyl-L-cysteine (NAC; 2 × 10⁻² M, N = 3) on propranolol (1.5 × 10⁻⁴ M)-induced cleaved caspase-3 expression. *p < .001 versus control. †p < .001 versus propranolol alone. Effects of propranolol (1 × 10⁻⁴ M) and the lipid emulsion (LE; 0.1%), alone or in combination, on early and late apoptosis of H9C2 rat cardiomyoblasts. Data (N = 3) are shown as mean ± SD. N indicates the number of independent experiments. ***p < .001 versus control. #p < .001 versus propranolol alone. Control indicates no treatment. FITC: fluorescein isothiocyanate. A: TUNEL staining of H9C2 rat cardiomyoblasts treated with propranolol or the lipid emulsion (LE) alone or LE followed by propranolol. The nuclei were stained with 4’, 6-diamidino-2-phenylindole (DAPI). Scale bar: 100 μm. B: Effects of propranolol (1 × 10⁻⁴ M) and LE (0.1%), alone or in combination, on TUNEL-positive H9C2 rat cardiomyoblasts. Data are shown as mean ± SD from three independent experiments including seven replicates in each group. ***p < .001 versus control. #p< .001 versus propranolol. Control indicates no treatment.


Propranolol (1 × 10⁻⁴ M) produced ROS (Figure 6; p < .001 versus control), whereas the LE (0.1%) attenuated propranolol (1 × 10⁻⁴ M)-induced ROS production (Figure 6; p < .001 versus propranolol alone). Effects of propranolol (1 × 10⁻⁴ M) and the lipid emulsion (LE; 0.1%), alone or in combination, on reactive oxygen species (ROS) levels in H9C2 rat cardiomyoblasts. Cellular ROS levels were measured by flow cytometry after staining with the fluorescent dye 2’, 7’-dichlorofluorescin-diacetate (DCF-DA). Data (N = 3) are shown as mean ± SD. N indicates the number of independent experiments. **p < .01 and ***p < .001 versus control. #p < .001 versus propranolol. Control indicates no treatment. FITC-A: Fluorescein isothiocyanate-area.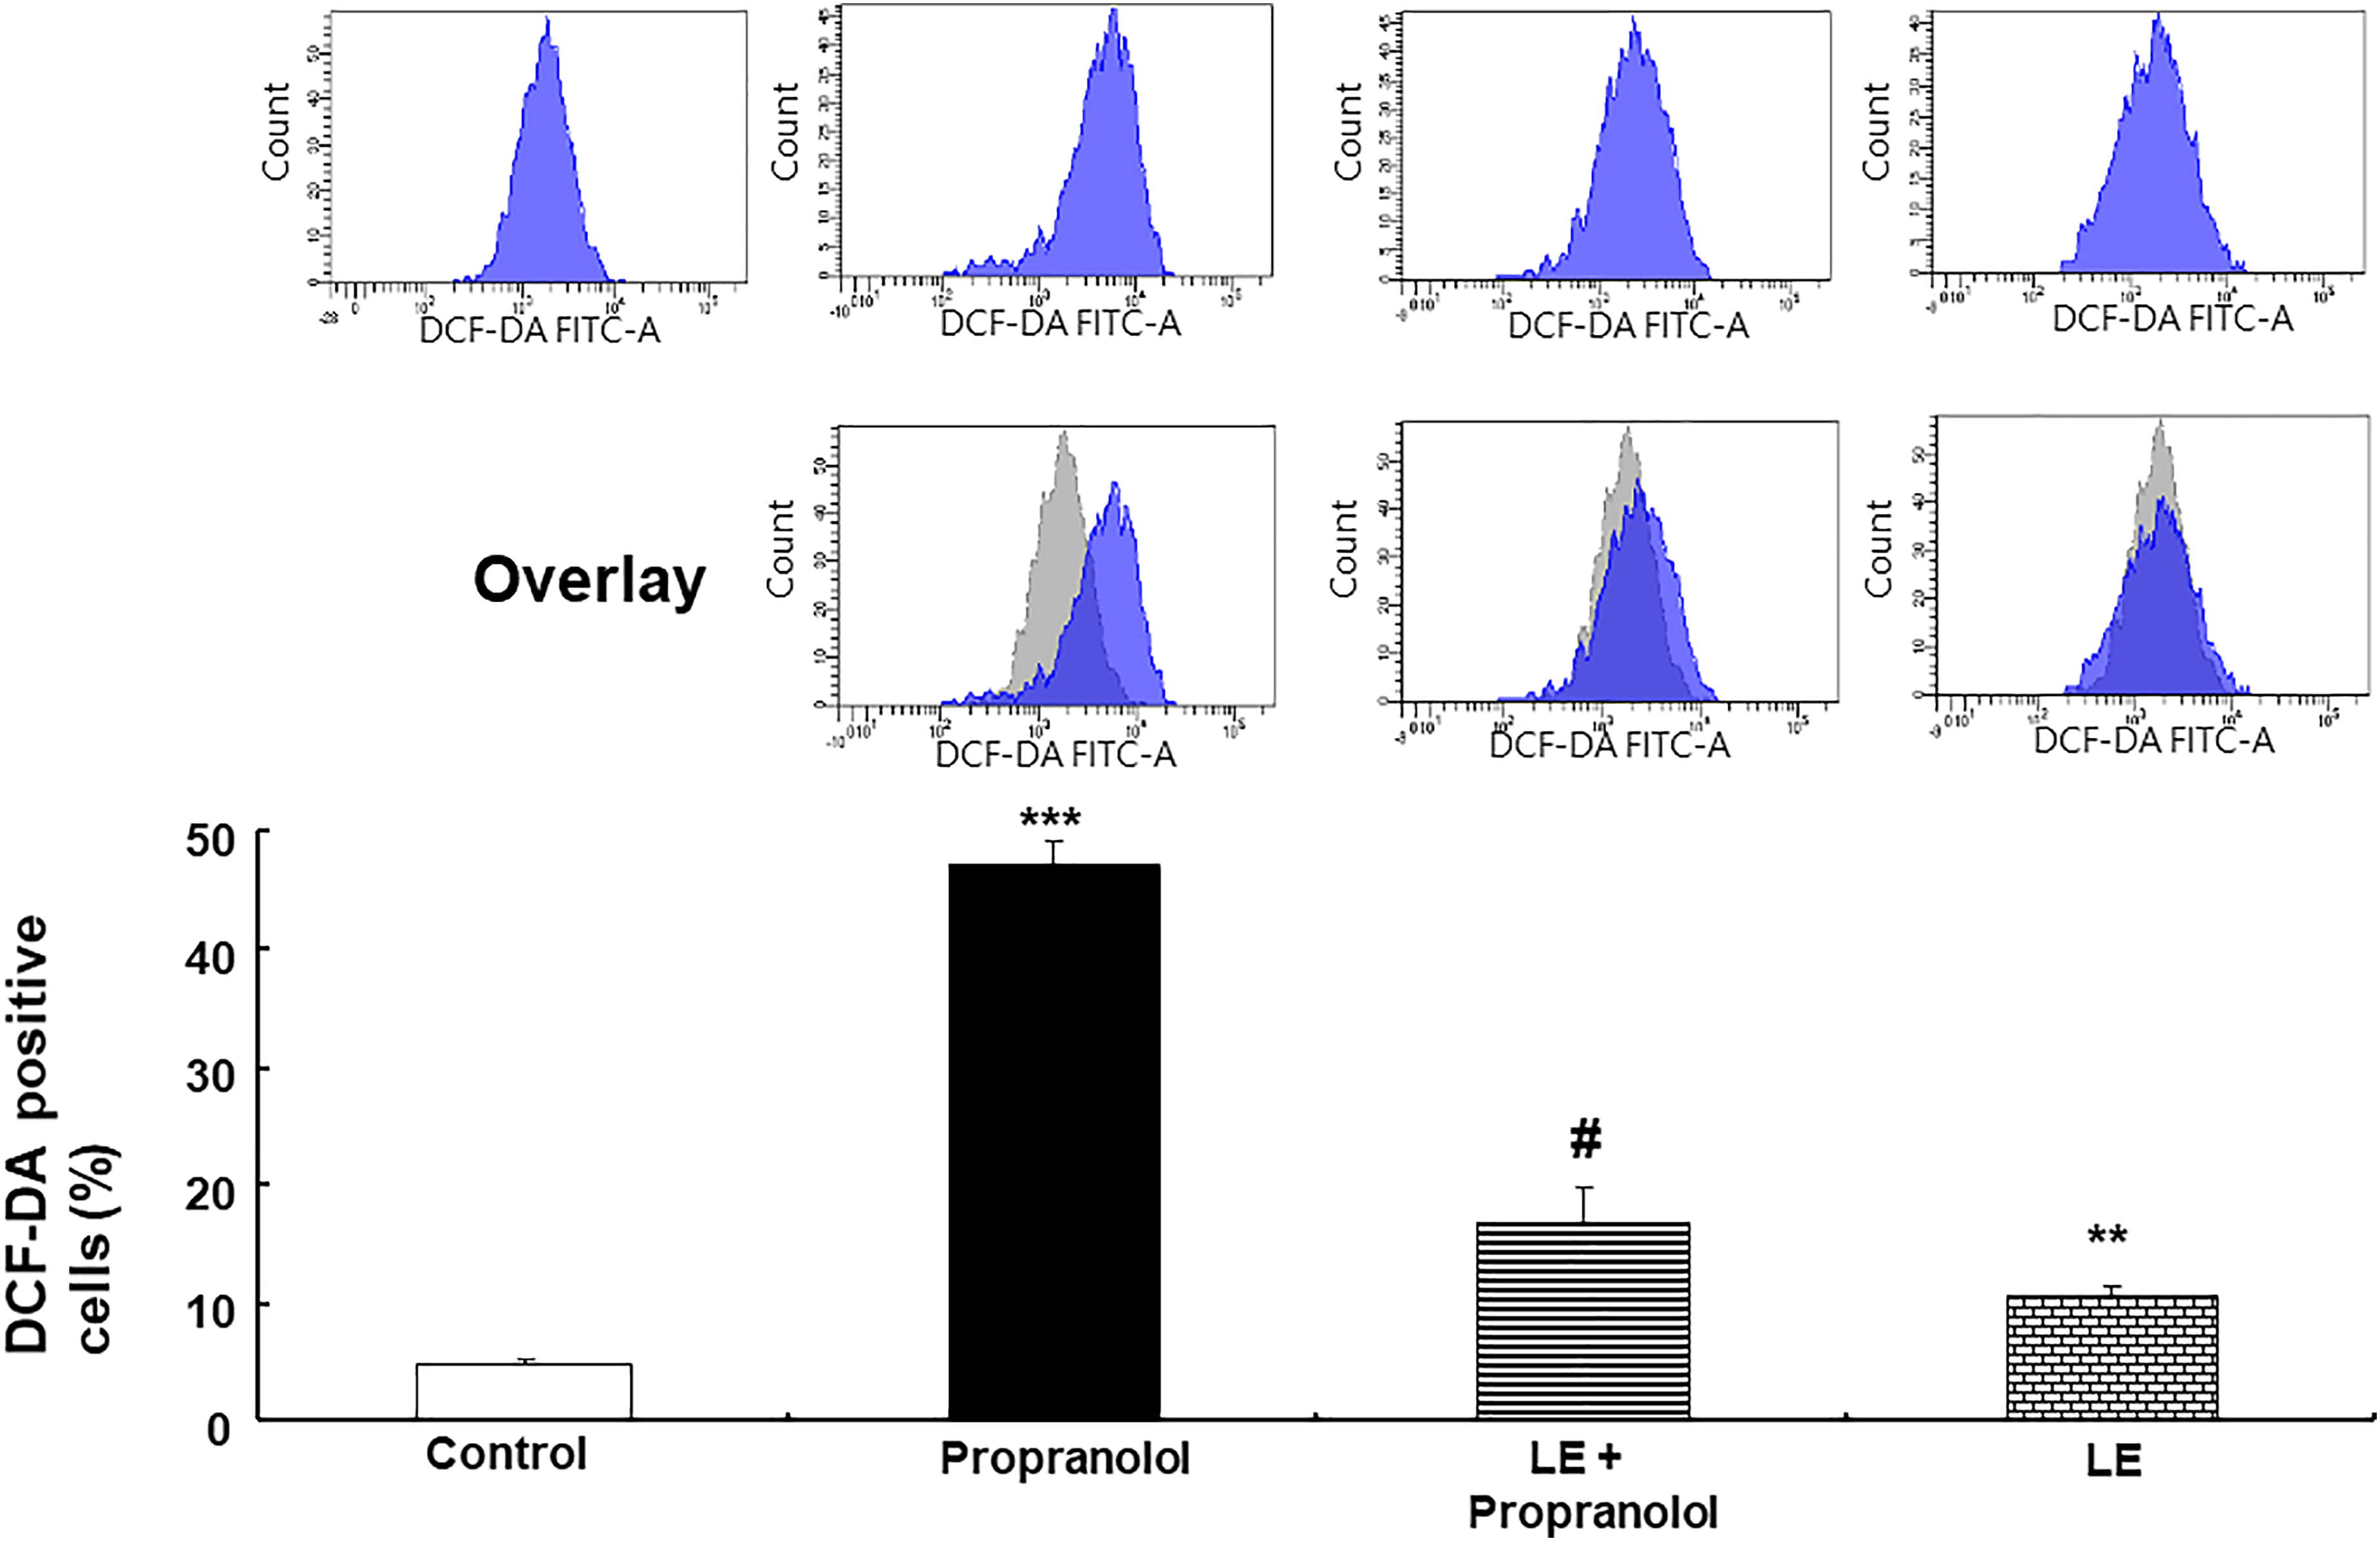
The LE (0.1%) did not significantly alter propranolol concentrations (1 × 10⁻⁴ M) (Figure 7). Effects of the lipid emulsion (LE; 0.1%) on propranolol concentration (1 × 10⁻⁴ M) in distilled water. Propranolol concentration was determined using ultraperformance liquid chromatography-quadrupole time-of-flight mass spectrometry with multiple reaction monitoring. Data are shown as mean ± SD. The experiment was repeated six times.
Discussion
The present study is the first to suggest that LEs can attenuate early apoptosis induced by toxic doses of propranolol through the intrinsic apoptotic pathway, which seems to be associated with direct inhibition of ROS production. The major findings of this study are that the LE and NAC improved cell viability, which was decreased by a toxic dose of propranolol. Additionally, the LE reversed propranolol-induced expression levels of cleaved caspase-3, Bax, and cleaved caspase-9. The LE inhibited propranolol-induced early apoptosis of TUNEL-positive cells, as well as attenuated propranolol-induced ROS production.
LEs reportedly alleviate the cardiovascular collapse induced by toxic doses of local anesthetics and several non-local anesthetic drugs.16,24 In cardiomyoblasts, LEs can attenuate the inhibition of cell viability caused by the local anesthetic bupivacaine and the calcium channel blocker amlodipine, which are highly lipophilic drugs (Log p > 2).18,19,25 LEs inhibit hypotension induced by propranolol. 26 However, they have no effect on hypotension caused by the relatively less lipid soluble β-blocker metoprolol (Log p = 2.15) compared with propranolol. 27 Similar to these previous reports, here, the LE reversed the inhibition of cell viability caused by a toxic concentration of propranolol. 5,9,26,27 Conversely, it had no effect on the changes in cell viability induced by toxic concentrations of the less lipid-soluble β-blocker esmolol (Log p = 1.7) compared with propranolol. 5,9,26,27 Based on a previous study which showed that the therapeutic plasma concentration of esmolol is approximately 10 times higher than that of propranolol, the concentration of esmolol used was 10 times that of propranolol in this study. 5 With respect to cell migration, the LE reversed propranolol-induced inhibition of cell migration, whereas it had no effect on esmolol-induced inhibition of cell migration. ROS produced in response to propranolol concentrations (5, 10, and 20 μg/mL), which are significantly higher than the toxic plasma concentration (3 μg/mL), may cause cardiac toxicity.5,14 In agreement with the results of the previous study, the ROS scavenger NAC attenuated both the inhibited cell viability and the cleaved caspase-3 expression induced by a toxic dose of propranolol (1 × 10⁻⁴ M), suggesting that ROS production by propranolol inhibits the viability of cardiomyoblasts.5,14
The apoptotic cellular signal pathway, comprising both the intrinsic and extrinsic apoptotic pathways, progresses into a common downstream signaling pathway wherein cleaved caspase-3 is involved. 28 The extrinsic and intrinsic apoptotic pathways are associated with the death receptor and mitochondrial stress, respectively. 28 The intrinsic apoptotic pathway involves cytochrome c release from mitochondria via Bax channels, and subsequent activation of caspase-9, ultimately leading to activation of caspase-3. 28 Our results are consistent with those of a previous study, which showed that toxic concentrations of propranolol (5, 10, and 20 μg/mL) enhanced caspase-3 activity in cardiac mitochondria.5,14 LEs inhibit the cleaved caspase-3 expression induced by toxic doses of bupivacaine (4 × 10⁻⁴ and 1 × 10⁻³ M) and amlodipine (1 × 10⁻⁵ M) in rat cardiomyoblasts.5,18,19,25 Similar to previous reports, LE suppressed the expression of cleaved caspase-3 induced by toxic concentrations of propranolol (1 × 10⁻⁴ M).18,19,25 LE attenuated the propranolol-induced Bax expression, but did not significantly alter propranolol-induced expression of cleaved caspase-8. In addition, LE inhibited propranolol-induced expression of cleaved caspase-9 (Figure 3(c)). Taken together, these results indicate that LE-mediated inhibition of apoptosis occurs via inhibition of the intrinsic apoptotic pathway involving cleaved caspase-9, which may be activated by cytochrome c release. Consistent with the western blot results, LE inhibited the number of TUNEL-positive cells generated in response to propranolol treatment. The LE also inhibited propranolol-induced early apoptosis. By contrast, it had no effect on late apoptosis, suggesting that LE-mediated inhibition of apoptosis occurs at the early stage.
Toxic doses of propranolol (1 × 10⁻⁴ M) cause apoptosis in human ovarian cancer cells via ROS and c-Jun N-terminal kinase. 13 Propranolol toxicity may induce cardiac toxicity by causing cardiac mitochondria dysfunction, which is compounded by elevated ROS production, inhibition of mitochondrial membrane potential, and cytochrome c release. 14 Consistent with that report, a toxic concentration (1 × 10⁻⁴ M) of propranolol produced ROS in our study.5,14 Taken together, these findings suggest that propranolol-induced ROS production contributes to apoptosis and cardiac toxicity.13,14 By contrast, LE inhibited cardiotoxicity caused by bupivacaine (1 × 10⁻³ M) and doxorubicin (1 × 10⁻⁵ M) via inhibiting ROS production, which may be associated with the mechanisms underlying the effects of LE treatment as non-specific antidotes.17,18 Consistent with previous reports, the LE reduced the extent of propranolol-induced ROS production (Figure 6).17,18 The widely accepted mechanism of action of LEs as non-specific antidotes is the indirect “lipid shuttle” (scavenging) effect, where the LE absorbs lipid-soluble drugs from vital organs (heart and brain), which is then transported to the liver, muscle, and adipose tissue, leading to enhanced redistribution. 29 It is difficult to determine whether this LE-mediated inhibition of ROS production is due to direct or indirect effects, because both types of effects overlap. An experiment was performed to examine the effect of the LE on propranolol concentration to confirm whether LE-mediated reduction in propranolol-induced ROS production was due to an indirect scavenging effect or a direct LE-mediated inhibition of ROS production. As the LE did not significantly alter the propranolol concentration (Figure 7), we surmise that the LE-mediated reduction in ROS (Figure 6) was due to direct inhibition of ROS production. Excessive ROS production induced by propranolol activates the mitochondrial intrinsic apoptotic pathway, as observed in the present study, which may lead to Bax activation via c-Jun N-terminal kinase and p53. 30 Further studies elucidating the detailed cellular signaling pathway associated with LE-mediated inhibition of ROS production and apoptosis caused by toxic doses of propranolol are needed. Even though propranolol has high lipid solubility (Log p = 3.48), the LE did not alter propranolol concentration; this may be due to the very low concentration of the LE used (0.1%). 9
The mechanisms underlying drug-induced cardiomyopathy, which causes myocardial depression, include inhibition of myocardial bioenergetics and calcium handling, apoptosis, and ROS production. 31 Thus, the LE-mediated inhibition of apoptosis and ROS production induced by toxic doses of propranolol in cardiomyoblasts may contribute to LE-induced amelioration of cardiovascular depression induced by propranolol.6–8 This study has some limitations. First, this was an in vitro study using cardiomyoblasts, and the valid extrapolation of the results to the in vivo scenario cannot be assumed. Second, we used H9C2 rat cardiomyoblasts derived from rat cardiac muscle, whereas cultured cardiomyocytes could be argued to be more relevant. Third, although experiments should be performed under the same conditions, ultra-performance liquid chromatography to measure propranolol concentration was performed in distilled water while ROS measurement was performed in cell culture media. Finally, although 1% LE is sufficient to achieve scavenging and inotropic effects for the treatment of cardiovascular collapse induced by oral administration of non-local anesthetic drugs, 0.1% LE was used in this study because rat cardiomyoblasts were directly treated with the LE. 32 Cell death and apoptosis of pancreatic cancer cells is caused by n-3 fatty acid. 33 LE alone, which contains only long-chain fatty acids, inhibited cell viability slightly (Figure 1(c)). Further studies exploring the mechanism and fatty acid components associated with LE-induced inhibition of cell viability are needed.
In conclusion, the results of the present study suggest that the LE attenuated propranolol-induced early apoptosis via inhibiting the intrinsic apoptotic signaling pathway, which may be associated with the direct suppression of propranolol-induced ROS production. In addition, LE-mediated attenuation of apoptosis may contribute to the alleviation of propranolol-induced cardiac depression.
Footnotes
Declaration of conflicting interests
The author(s) declared no potential conflicts of interest with respect to the research, authorship, and/or publication of this article.
Funding
The author(s) disclosed receipt of the following financial support for the research, authorship, and/or publication of this article: This work was supported by the National Research Foundation of Korea (NRF) grant funded by the Korea government (MSIT) (NRF-2021R1F1A1062363). This research was supported by Basic Science Research Program through the National Research Foundation of Korea (NRF) funded by the Ministry of Education (NRF-2021R1I1A3040332).