
Abstract
Introduction
The consequences of epidemiological studies have shown that people with high serum insulin levels are at higher risk for cancer and death. There is ample evidence for the hypothesis that hyperinsulinemia increases the risk of cancer. 1
Hyperinsulinemia, or an increase in insulin levels in the first few years of type 2 diabetes to overcome insulin resistance, is related to increased and abnormal reactive oxygen species (ROS) production.2,3 Many investigations also showed that inhibition of peroxisomal fatty acid oxidation, catalase deficiency, and enhancement of hydrogen peroxide causes an imbalance between ROS production and detoxification. 4 Besides, ROS is the product of many glucose oxidation pathways and protein glycation related to excessive glucose levels due to diabetes and insulin resistance. 5
The chemical structure of methoxyphenoxy-2-propanol derivative, carvedilol, is a combined β2, β1, and α1-adrenergic blocking effect used to treat chronic heart failure, left ventricular dysfunction following myocardial infarction, and hypertension. Carvedilol does not cause insulin resistance in diabetic patients and does not interfere with hyperglycemia and blood lipids control. On the other hand, the diabetic disease will not change the pharmacokinetic parameters of carvedilol. By inducing apoptosis, carvedilol inhibits cancer cells, prevents the invasion of breast cancer, and reduces cancer risk, which has been confirmed through oxidation resistance.6–10 Also, antioxidant effects have been proven for carvedilol and its metabolites. 8
One way to increase carvedilol’s solubility, a water-insoluble drug, is to convert the drug’s crystal structure to its amorphous form. However, because amorphous is unstable, the amorphization of drugs is generally gained by forming an amorphous solid dispersion with polymers in which the drug molecules are dispersed within the polymer.11,12
2′,7′-dichlorodihydrofluorescein diacetate (H2DCFDA) is a non-fluorescent lipophilic ester that traverses the plasma membrane is usually used to indicate cellular production of ROS. Oxidation of this molecule to DCF fluorochrome causes green fluorescence when aroused with blue light. The brightness of this fluorescence generally indicates the presence of ROS in cells. This method has numerous benefits over other developed methods.13,14
Nanocarriers are accessible in several classes, including nanoparticles made of metals, polymers, hydrogel, ceramic, and lipid-based carriers such as liposomes, niosomes, and nanoburrs. Niosomes are vesicles formed mostly of hydrated non-ionic surfactants; moreover, cholesterol (CHOL) or its derivatives were used in many cases.15–17
The comet assay (single-cell gel electrophoresis) is a standard and sensitive method for studying DNA damage and repair in which cells are lysed and then electrophoresis is conducted on a microscopic slide with a thin layer of agarose gel and stained with a fluorescent DNA-binding dye. The tail-to-head ratio shows the number of DNA fractures. This method has multiple basic research applications on DNA damage and repair and genotoxicity testing of new chemicals and drugs.18,19
Material and methods
Chemicals
Carvedilol was purchased from Farabi Pharmaceutical Company, Iran, and regular insulin was from Exir Co., Iran. NaCl, NaOH, EDTA, H2O2, Na2CO3, NaH2PO4, Tris, and Triton X-100 were obtained from Merck Co. (Germany). Trypsin, MTT, low melting point agarose, Na2HPO4, KCl, and ethidium bromide were from Sigma Co. (USA). Normal melting point agarose was provided by Cinnagen Co (Iran). The DMEM medium and phosphate-buffered saline (PBS) were from Bio-idea, Iran. Fetal bovine serum (FBS) and antibiotics were purchased from Biosera (France). DCFH-DA probe was from Sigma-Aldrich (USA), and HUVEC cells came from Pasture Institute (Iran).
Preparation of amorphous-carvedilol (A-CRV) solution
Co-amorphous solid dispersions of carvedilol and amino acids (proline and phenylalanine) were prepared by solvent evaporation technique using alcohol solution with an alcohol content of 33% (vol/vol) as a solvent. A total of 5 mg in molar ratios of 1:4 (1 mg of carvedilol and 4 mg of proline or phenylalanine) and 1:8 (0.56 mg of carvedilol and 4.44 mg of proline or phenylalanine) was mixed homogeneously and then dissolved in 3 mL alcohol solution. We used a freeze dryer to evaporate the solvent completely.
Preparation of carvedilol-loaded niosomes
Carvedilol-loaded niosomes were prepared using the film method. First, 210 mg of Bridge 72, 145 mg of CHOL, and 1 mg of carvedilol were dissolved in 16.75 mL of chloroform and 8.25 mL of methanol. The resulting solution was poured into a round-bottom flask and connected to a rotary evaporator for 50 min with a rotation speed of 150 rpm. The solvent was evaporated entirely, and a transparent and homogenous film was obtained. Then, 20 mL of PBS was added to the dried film and was allowed to disperse the film completely. Finally, the obtained mixture was sonicated in the sonicator bath for 15 min at 50°C to form a uniform solution.20,21
Characterizations of carvedilol-loaded niosomes
The mean particle size, particle size distribution, and zeta potential of blank and carvedilol-loaded niosomes were evaluated using zetasizer (Zeta, Maloren, and UK analyzers).
Cell culture
The cells we used for this study were human umbilical vein endothelial cells (HUVECs) which were grown as a monolayer culture in DMEM-enriched medium with 10% FBS, 1% mixture of penicillin (100 IU/mL), and streptomycin (100 μg/mL) incubated at 37°C in an atmosphere of 5% CO2–95% air mixture.
22
Cell culture medium was used for dilution of insulin and carvedilol. Non-treated cells were considered as a negative control. Cells were seeded on 12-well culture plates at 100×106 cells/well and, after overnight growth, incubated alone with increasing concentrations of insulin (10–200 nM), amorphous-CRV (1–50 µ
Cell survival assay
To determine the effect of insulin cytotoxicity and probable safety of niosomal-CRV on HUVECs cell line, we performed MTT assay with minor modifications. 25 After detaching the cells from the culture flask, 5×10⁴ cells in the suspension were counted and then incubated in a 96-well plate. Next, various insulin and niosomal-CRV concentrations were added to the predetermined wells and the plate was incubated at 37°C for 24 h. After drawing out of the medium, MTT reagent was added to each well, incubated for 3 h, and added DMSO; the absorbance was read at 570 nm using an ELISA reader. The same medium for cells was used as the blank. Negative control was cells that received nothing other than cell culture media. Due to the observed stimulant effects of insulin growth, the protective effects of carvedilol were not evaluated.
Single-cell gel electrophoresis (the comet assay)
The slides were coated with 1% normal melting agarose at least 24 h before starting the comet assay. After trypsinization and centrifugation, the cells were counted and mixed with 1% (w/v) low melting point agarose in PBS and placed on the first layer of slides. The agarose was allowed to set at 4°C for 5–10 min, and after that, the slide was immersed in alkaline lysis buffer (pH = 10.0) for 40 min and rinsed with deionized water to remove cellular proteins and membranes. Then, slides plunged for 40 min in an electrophoresis alkaline buffer (pH>13) without electric current and then electrophoresed for 40 min at 25 volts and 300 mA in the same buffer. After the electrophoresis operation, the slides were removed from the buffer and neutralized for 15 min with the Tris buffer (pH = 7.5). Finally, the slides were painted for 5 min with ethidium bromide (20 µg/ml) and then washed twice with PBS and deionized water for 10 min each time. The comets were observed at 400× magnification under a fluorescent microscope. At least 100 comets were randomly recorded for each case, and the percent of DNA in the tail, tail length, and tail moment for each comet was measured using image analysis software (comet score).26,27
Measurement of intracellular production of ROS using DCF-DA
To measure the amount of ROS after 24-h incubation of HUVEC cells with insulin (50 nM) and carvedilol (1–50 µM) separately and carvedilol plus insulin with above concentrations, respectively, we washed cells twice with PBS. Then, DCFH-DA was diluted in anhydrous DMSO to 40 mM and stored as a stock solution in 4ºC. The stock solution was diluted with PBS to 25 μM and exposed to cells for 45 min at 37°C after the drug exposure to prepare a working solution. After removing the DCFH-DA, each well was washed with PBS. The fluorescence in a computerized microplate flowmeter (Biotek, USA) was measured at 485 nm excitation and 530 nm emission. All steps should be done in dim light. A mean value for the fluorescence was calculated for at least six wells in each experiment, and to ignore the background fluorescence, we used cells without DCFH-DA. Unexposed cell was considered as a negative control. 28
Results
Carvedilol-amino acid solution in the aqueous phase
Data of CRV-amino acid solution.

CRV: carvedilol.
Characterization of niosome-CRV nanoparticle
Nanoparticles containing carvedilol were measured in terms of particle size and zeta potential. The particle size was reported as average after three repetitions. The results showed that the particle size was 384.7 ± 12.82 nm and the zeta potential was −29.2 ± 3.41 mV.
Survival assays of insulin and niosome-CRV nanoparticle on HUVEC cells
Varying insulin concentrations (10–500 nM) were incubated with the cells to determine the potential cytotoxicity of this agent by MTT assay. Exposure of cells to insulin failed to cause cell death and caused cell survival enhancement by increasing its concentration. Cell growth (p < 0.05) was observed at higher than 50 nM compared to the negative control.
After incubating HUVEC cells to various concentrations of carvedilol determined the safe and non-cytotoxic range of 0.05–5 µM of the compound.
Determination of genotoxic concentration of insulin on HUVEC cells
The effect of insulin compared with control groups on tail length (pixels), percentage of DNA in the tail, and the tail moment is represented as mean ± SEM. The sign (***) shows increase results (p < 0.001) in comparison with the control group (one-way ANOVA followed by Tukey’s post hoc test).
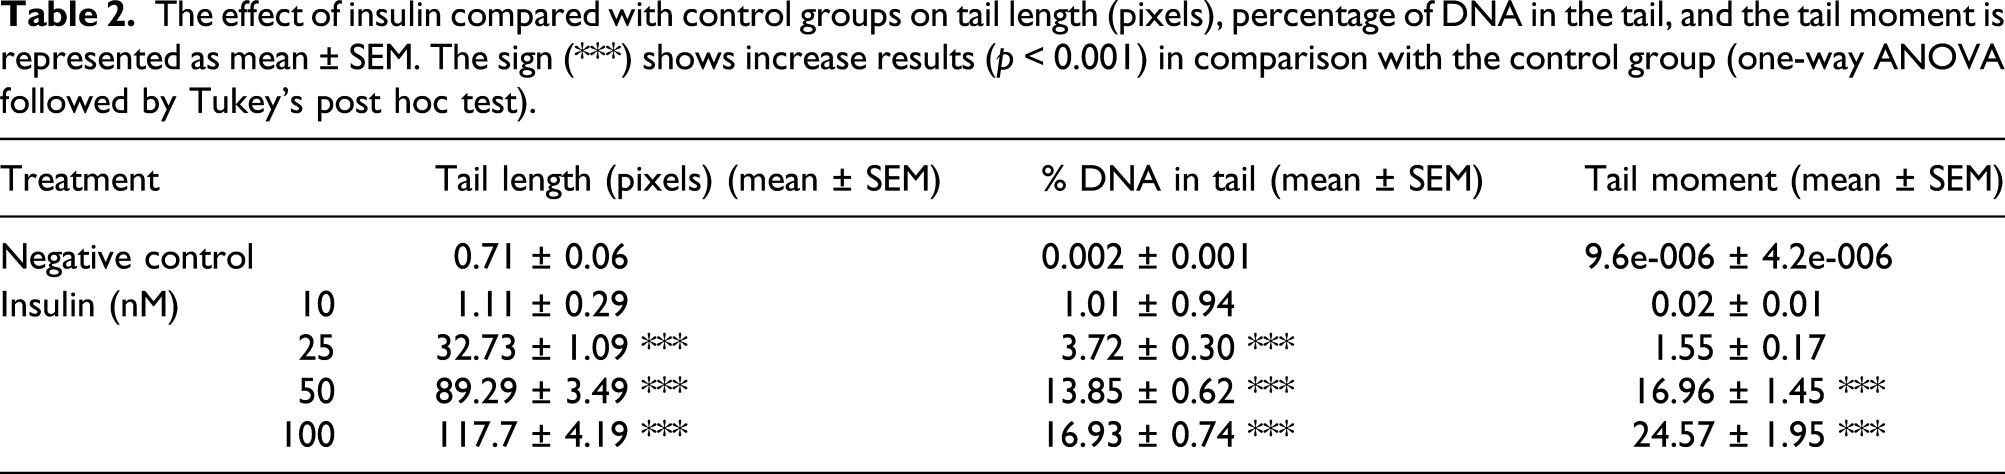

(A) Comet image of untreated HUVEC cells as a negative control. (B) Comet image of HUVEC cells treated with 100 nM of insulin as a positive effect.
Study the effect of carvedilol on HUVEC cells
The effect of CRV compared with control groups on tail length (pixels), percentage of DNA in the tail, and the tail moment is represented as mean ± SEM. Data obtained from different concentrations of carvedilol were not significantly different from the control group.

CRV: carvedilol.
Study of the effect of amorphous-CRV on the insulin-induced DNA damage
The protective effect of A-CRV was evaluated via the alkaline comet assay. Results of three DNA damage parameters induced by insulin and prevention by A-CRV are shown in Figure 2. We used 50 nM of insulin as a suitable genotoxic concentration and A-CRV in the different concentrations. Comparison of three studied factors of DNA damage in amorphous-carvedilol plus insulin-treated groups. A: Tail length, B: Percent of DNA in tail, and C: Tail moment. Each graph has been represented as mean ± SEM. The signs (###) and (***) show significantly increase and decrease results (p < 0.001) in comparison with negative and insulin groups, respectively.
Study the effect of niosome-CRV nanoparticles on the insulin-induced DNA damage
The anti-genotoxic effect of niosome-CRV nanoparticles was investigated via the alkaline comet assay. Results of three DNA damage parameters induced by insulin and prevention by niosome-CRV are shown in Figure 3. We used 50 nM of insulin as a suitable genotoxic concentration and niosome-CRV in the different concentrations. Comparison of three studied factors of DNA damage in niosome-CRV plus insulin-treated groups. A: Tail length, B: Percent of DNA in tail, and C: Tail moment. Each graph has been represented as mean ± SEM. The sign (###) shows significantly increase results (p < 0.001) in comparison with the negative group. Conversely, the signs (**) and (***) show significantly decrease results (p < 0.01 and p < 0.001) in comparison with the insulin group. CRV: carvedilol.
Comparison of the protective effect of amorphous-CRV and niosome-CRV nanoparticles on DNA damage of insulin
Comparison of the protective effect of amorphous-carvedilol (A-CRV) and niosome-CRV nanoparticles (N-CRV) against the genotoxicity caused by insulin in three parameters: Tail length (pixels), % DNA in the tail, and Tail moment, that are represented as mean ± SEM. The signs (###) and (***) show significant effective results (p < 0.001) of N-CRV in comparison with A-CRV with the same concentrations.

CRV: carvedilol.
Results of the effect of carvedilol on the ROS generation
As shown in Figure 4, there was a significant increase in ROS levels in the insulin group. HUVEC cells incubated with different carvedilol concentrations 24 h before exposure to insulin (50 nM) showed a significant reduction in intracellular ROS production. Study the effects of carvedilol on insulin-induced ROS generation. (###) shows a significant increase in ROS production compares to the negative control group. (*), (**) and (***) show significantly decreased results (p < 0.05, p < 0.01, p < 0.001) as compared to the insulin group. ROS: reactive oxygen species.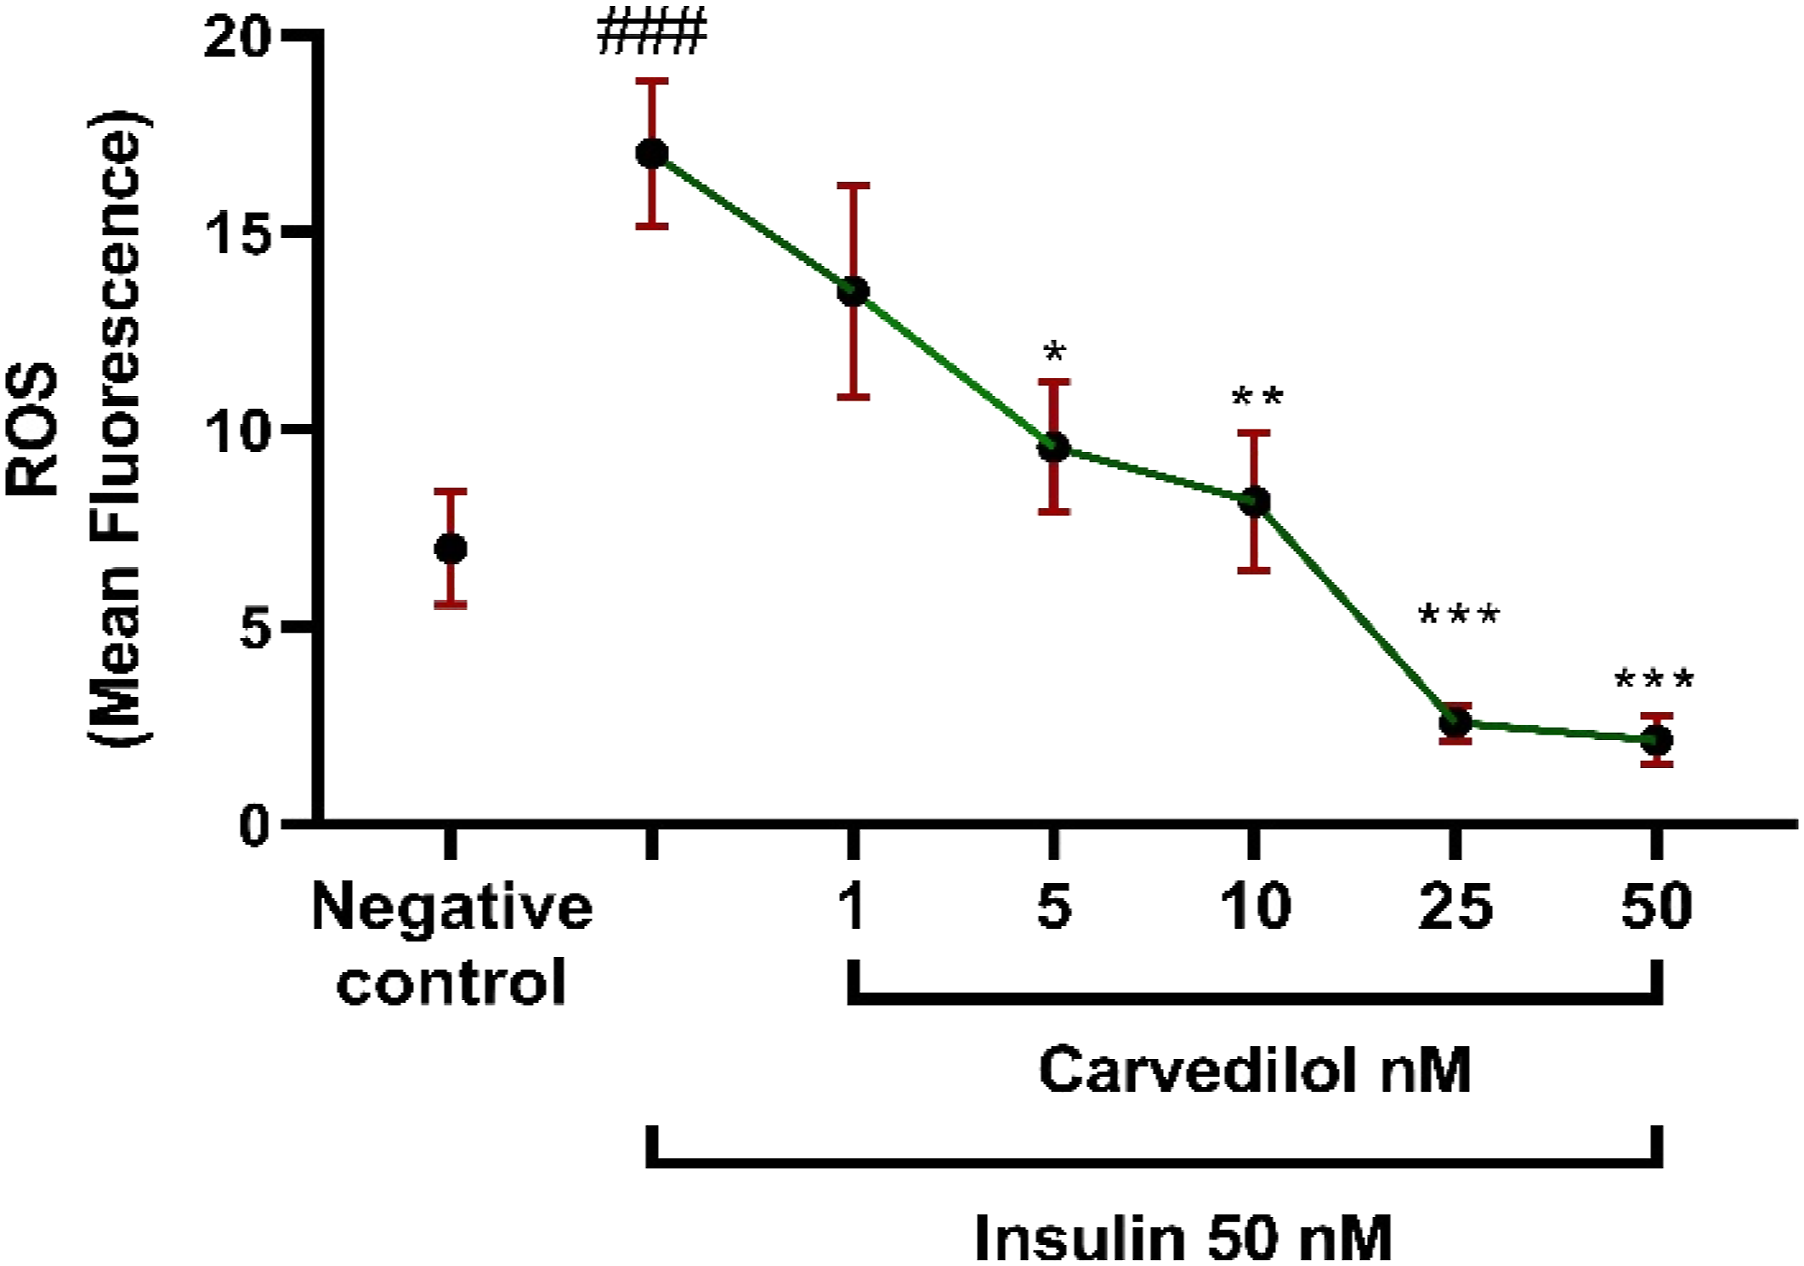
Discussion
Type 2 diabetes is associated with cardiovascular failure in 30–40% of patients. The most important reasons for this failure are coronary artery disease, arterial hypertension, and the destructive effects of diabetes on the myocardium. 29 Despite the new drugs, beta-blockers are a top priority in the medical association’s heart failure recommendations, coronary heart disease, and hypertension. Beta-blockers can reduce the cardiovascular risks of type 2 diabetes.28,30 Carvedilol is a non-selective beta-blocker that is more effective than other traditional beta-blockers in treating heart failure and curing myocardial function. It does not show the carbohydrate and lipid abnormalities observed with other beta-blockers. 31 Also, carvedilol reduces insulin resistance by sensitizing insulin receptors, inhibiting the sympathetic nervous system, which is significant in insulin resistance. 32 According to previous studies, it can be said that carvedilol can be a suitable drug in the treatment of cardiovascular diseases in diabetics.
In people with diabetes, due to high levels of glucose, fatty acids, and serum insulin, ROS production increases, which seems to cause direct damage to DNA and exacerbate insulin resistance. 33 Binding of insulin to its receptors (IR) induces the mitogen-activated protein kinase and activates protein kinase B or Akt. At high concentrations of insulin due to insulin resistance, it also activates IGF-1 with more growth stimulant activity and carcinogenic effects.34–38 It has also been specified that in people with type 2 diabetes, ROS production and oxidative stress biomarkers increase, which cause H2O2 activation.2,39 Several studies have reported that hyperinsulinemia increases oxidative stress and DNA damage, and our study is based on these previous results.2,3,5,39
The antioxidant effects of carvedilol can be mediated by harvesting and suppressing ROS production mechanisms. 8 It has been shown that carvedilol in the heart increases antioxidant enzymes and increases GSH-Px, catalase, and SOD. 40 Carvedilol is also able to inhibit lipid peroxidation, protein keratinization, and ultimately DNA damage. In addition, properties such as removing superoxide anion by carvedilol and its metabolites exert cytoprotective effects. 10 According to the above contents, we evaluated the genoprotective effects of A-CRV and N-CRV against supraphysiologic insulin levels in HUVEC cells using the comet assay method.
Our results show that a high insulin concentration significantly increases DNA fragmentation at a minimum of 10 nM, compared to untreated cells. We also confirm DNA damage of insulin in a dose-dependent profile using the comet assay. Although exposure of HUVEC cells to insulin caused genetic damage confirmed by the comet method, the MTT survival assay failed to detect any cytotoxicity for insulin up to a concentration of 500 nM. In our work, the incubation of cells to a concentration range of 1–50 μM of A-CRV indicated that it was safe in various damage parameters to the genome.
Carvedilol has little efficacy due to its low solubility in the aqueous and subsequent low bioavailability. 41 We have shown that using alternative carrier systems, the drug’s therapeutic effect can be increased, and the amount consumed can be reduced with the desired efficacy. The binding of amino acids to form a co-amorphous salt can increase the drug’s solubility. 41 Also, we stated that the delivery of carvedilol by nanoparticle loading further increases the solubility and can increase the efficiency by up to 5 times.
Our study quantified DNA damage to determine the possible protective mechanism of CRV against insulin-induced genotoxicity in the HUVEC cell line. Our results showed that insulin alone afforded a considerable increase in DNA strand breaks than the untreated cells. However, treatment of HUVEC cells with A-CRV and niosome-CRV nanoparticles 24 h before insulin administration induced a significant decrease in DNA fragmentation related to the insulin-treated group. Genoprotective effect of niosome-CRV nanoparticles was more efficient than A-CRV. Our findings show increased insulin-induced ROS production and decreased amounts due to carvedilol pretreatment by measuring ROS generation.
Conclusion
In conclusion, our results express that in HUVEC cells, A-CRV administration and niosome-CRV nanoparticles significantly reduced the amount of insulin-induced DNA damage, which was measured by comet assays.
Footnotes
Declaration of conflicting interests
The author(s) declared no potential conflicts of interest with respect to the research, authorship, and/or publication of this article.
Funding
The author(s) disclosed receipt of the following financial support for the research, authorship, and/or publication of this article: The content of this paper is from the MSC thesis (Ethics approval ID: IR.MUI.RESEARCH.REC.1398.180), which was financially supported by the Research Department of Isfahan University of Medical Sciences (Thesis no. 398269), Isfahan, I.R. Iran.