
Abstract
Objective:
To investigate the ability of docosahexaenoic acid (DHA)-loaded silver nanoparticles (AgNPs) in facilitating the incorporation of DHA in the cell membrane, improve cell membrane structure, and attenuate endothelial dysfunction in experimental diabetes.
Methods:
DHA/AgNPs were prepared using a nanoprecipitation technique. Fifty male albino rats were used in this study; 10 of them were served as the control group and 40, as the experimental groups, were injected with streptozotocin. Then, the experimental groups were subdivided into diabetic, diabetic treated with DHA, diabetic treated with AgNPs, and diabetic treated with DHA/AgNPs groups.
Results:
DHA/AgNPs have small spherical size as proved from ultraviolet–visible spectroscopy, transmission electron microscope, dynamic light scattering, and scanning electron microscope techniques. Cell membrane cholesterol and triglycerides showed a significant elevation in the diabetic group compared to the control, but treatment with DHA and DHA/AgNPs caused a significant reduction in both. Treatment with AgNPs and DHA/AgNPs caused a significant improvement in asymmetric dimethylarginine and nitric oxide levels compared to the diabetic group. Cell membrane fatty acids showed that omega-6 polyunsaturated fatty acids (PUFAs) were significantly elevated, while omega-3 PUFA were significantly reduced in the diabetic group compared to the control. There is a significant improvement in the levels of fatty acids in all groups after treatment with DHA, silver, or DHA/AgNPs.
Conclusion:
DHA/AgNPs are potent agents for the improvement of diabetic complication and endothelial dysfunction in experimental diabetes.
Introduction
Chronic hyperglycemia promotes oxidative stress that performs a great association between diabetes mellitus and its complications. One of these complications is the impaired endothelium-dependent vasodilation caused by the reduction of nitric oxide (NO) bioavailability as a result of elevation of reactive oxygen species (ROS) that attack cell components like proteins, lipids, and DNA. Comet assay is the common technique for evaluation of DNA damage using white blood cells. 1,2
Paraoxonase 1 (PON1), the ester hydrolase, is found in both serum and liver. The reduction of serum PON1 activity is existing in many diseases that are associated with cardiovascular diseases (CVD) including hypercholesterolemia, diabetes mellitus, and kidney failure. The activity of serum PON1 is decreased in diabetes even before the beginning of clinical CVD. 3 Additionally, asymmetric dimethylarginine (ADMA) is considered as a risk factor for CVD and mortality in diabetic subjects 4 ; its level is directly associated with the degree of lipid peroxidation, which is one of the most important measurements of oxidative stress in diabetes. 5
Insulin sensitivity is linked with the improvement of erythrocyte membrane fatty acids (FA) in rats, 6 rabbits, mice, 7 and also in human. 8 Many previous studies indicated a positive correlation between omega-3 FA concentration and insulin sensitivity. It was elucidated in both in vitro and in vivo studies that any change in the cell membrane phospholipids is well associated with other changes in insulin receptors’ number, the affinity of insulin to these receptors, and also glucose transporters. 8 Nonesterified fatty acids (NEFAs) can be chronically elevated and have pathological consequences in obese or diabetics patients; elevated NEFA is an independent risk factor for sudden death. 9
NEFA is considered as a new marker of type 2 diabetes and increasing omega-3 FA levels, that is, increasing of eicosapentaenoic acid (EPA) and docosahexaenoic acid (DHA) acid concentrations in blood may help in protection against diabetic complications. 10
Several studies indicated the role of flaxseed as a plant that is rich in n − 3 FAs (mainly α-linolenic acid (ALA)) in improving cell membrane structure and insulin sensitivity. 6,11 However, Simopoulos 12 reported that hypertensive and diabetics individuals are very limited in their ability to synthesize DHA and EPA from ALA.
This finding encouraged us to study the amalgamation of DHA in the cell membrane in experimental diabetes and how far this incorporation can promote the improvement of cell membrane structure and functions and hence increasing insulin sensitivity.
It is well-known that many of the researchers have the opportunity for using nanotechnology in medical fields due to its excellent efficacy and activity surface area. The highly surface metal nanoparticles (NPs) can load the medical drugs to deliver this drug to a specific organ without any side effects. Of these NPs are gold nanoparticles (AuNPs), 13 silver nanoparticles (AgNPs), 14 and zinc oxide nanoparticles (ZnONPs). 15 A lot of studies proved the antidiabetic effect of ZnONPs and AgNPs as novel agents to control diabetes mellitus in rats. 10,16 Additionally, its role as a carrier of a using drug is also documented. 14 Based on the medical application, DHA-loaded AgNPs (DHA/AgNPs) have been prepared using a benign technique, nanoprecipitation method in the presence of stabilizing and dispersing agents. The precipitation for NPs encapsulated with drug has been occurred due to the action of ethyl alcohol as the precipitating agent.
Thus, from this light, the current research aimed to prepare DHA/AgNPs using environmental technique (nanoprecipitation) in the presence of benign polymers which act as a stabilizing agent (soluble starch and Tween 80). The research was extended to investigate the ability of AgNPs in facilitating the incorporation of DHA in the cell membrane, improve cell membrane structure, and attenuate endothelial dysfunction in experimental diabetes.
Materials and methods
Materials
Chemicals
Soluble starch was obtained from yeast and starch company (Egypt). Tween 80 was kindly provided by 10th of Ramadan Company (Egypt). FA standards (high-performance liquid chromatography (HPLC) grade), ADMA (HPLC standard), streptozotocin (STZ), and DHA were purchased from Sigma Chemicals Co. (Munich, Germany). Boric acid, mercaptoethanol, and O-phthaldialdehyde (OPA) were purchased from Sigma-Aldrich Medical Company (St. Louis, Missouri, USA). Other used chemicals such as sodium acetate, tetrahydrofuran (THF), 5-sulfosalicylic acid (5-SSA), N-(1-naphthyl)ethylenediamine, ethanol, methanol, acetonitrile, 2-propanol, and N-hexane were purchased from Merck (Germany). Ultrapure water was used in this study.
Animals
Fifty male Wistar albino rats (weighting 180–200 g) were obtained from the Animal House of the National Research Centre (NRC), Giza, Egypt, and used in this study. The animals were housed in stainless steel cages (five rats in each cage) with a temperature of (22 + 2)°C, a 12-h light/12-h dark cycle and a relative humidity of 60% ± 5%. They were fed with a standard commercial diet (control diet) purchased from the Egyptian Company of Oils and Soaps; water was provided ad libitum. Rats were allowed 10 days to acclimatize to animal room conditions before the commencement of the experiment. The experimental protocol was approved by Institutional Ethics Committee of the National Research Centre, Giza, Egypt, and the experiment was performed as per guidelines of National Research Centre Ethical Committee for Medical Research “Animal Experimentation Sector” (No. 16303).
Methods
Preparation of AgNPs-encapsulated DHA
AgNPs were prepared using nanoprecipitation technique. 17,18 In this technique, 1.5 g of soluble starch was dissolved in 35 mL of deionized water containing 0.01 g of sodium hydroxide (NaOH). After complete dissolution, the temperature was raised to 60°C. After that, 0.5 g of Tween 80 in 10 mL water (H2O) containing 0.5 g of silver nitrate (0.5/10 mL H2O) was added dropwise to the solubilized starch and kept under stirring for 30 min; the formed AgNPs were used as a carrier for DHA by adding 0.5 g/5 mL H2O of DHA to the suspension solution of AgNPs and kept under magnetic stirring for another 30 min to ensure the encapsulation reaction. The resulting suspension solution of AgNPs-encapsulated DHA was subsequently precipitated by using 50 mL of ethyl alcohol and by the means of centrifugation at 14,000 r/min for 30 min. The resultant wet powder was rinsed two times with ethanol/water (70/30) v/v to remove other unreacted compound substances followed by centrifugation again. The supernatant was kept to determine the entrapment efficiency for AgNPs toward DHA. The wet powder of AgNPs loaded with and without DHA was kept in for further analysis. The freeze-dried DHA/AgNPs in the solid state can be dispersed in ultrapure water by hand agitation before use.
Characterization of DHA/AgNPs
Ultraviolet–visible spectrophotometer (UV-vis; Agilent Cary 100 UV-vis, Agilent Co., Italy) was used to monitor the wavelength of the formed AgNPs.
The entrapment amount of the ncapsulated DHA loaded AgNPs was carried out by taking 1 mL of the supernatant and then dispersed in 20 mL of deionized water and the wavelength in nm was observed at 205 using UV-vis spectrophotometer. A sample of AgNPs without DHA loading was used as the blank sample. The amount of un-entrapped DHA in the supernatant was calculated as follows

The particles shape of the formed NPs by nanoprecipitation techniques was examined using transmission electron microscopy (TEM) technique (Philips EM208, Japan) with an accelerating voltage of 120 kV. The hydrodynamic size of NPs was determined using dynamic light scattering (DLS) technique (NanoZS Malvern apparatus; Malvern, Orsay, France). The surface morphology was also examined using scanning electron microscopy (SEM; JSM-54 model; JEOL 5410, Germany).
Induction of experimental diabetes (chemically induced diabetes)
STZ was used for induction of experimental diabetes. Briefly, it dissolved in sodium citrate solution (50 mM and pH 4.5) containing sodium chloride (NaCl; 150 mM). This solution (6.0 mg/100 g body weight (bw)) was injected in rats (subcutaneously); fasting blood sugar was then estimated after 72 h for confirmation of diabetes 19 and also checked during the experiment time where all rats with blood glucose level ≥200 mg/dL were considered diabetic. In this study, all injected rats became diabetic and were used in the experiment. However, the mortality rate during the experiment was 2%.
Experimental design
After the period of acclimatization, animals were divided randomly into equal five groups as follow: Group 1 (control group): Healthy rats received distilled water. Group 2 (diabetic group): Diabetic rats received distilled water. Group 3 (treated group 1): Diabetic rats received DHA (10 mg/kg bw/day) orally. Group 4 (treated group 2): Diabetic rats received AgNPs (10 mg/kg bw/day) orally. Group 5 (treated group 3): Diabetic rats received DHA/AgNPs (10 mg/kg bw/day) orally. 16
After the experimental period (30 days), animals were weighted and kept fasting for 12 h before blood sampling and anesthetized under light ether anesthesia by inhalation; blood was withdrawn from the retro-orbital venous plexus of the eye using capillary tubes and collected in (a) tubes contain sodium fluoride for blood glucose estimation and (b) heparinized tubes for other biochemical parameters. One part from the heparinized blood was centrifuged at 2000 r/min for 10 min using cooling centrifuge (Laborzentrifugen, 2K15, Sigma, Germany). Plasma was separated and immediately frozen. Packed red blood cells (RBCs) were used for isolation and extraction of erythrocyte membrane lipids and proteins.
Estimation of biochemical parameters
Blood glucose and plasma insulin
Estimation of fasting blood sugar was conducted colorimetrically according to the method described by Trinder. 20 Insulin level was measured by ELISA method according to the manufactured method as described by Yalow and Berson. 21 Insulin resistance (HOMA-IR) was calculated from the equation described by Matthews et al. 22 as follows: Fasting plasma glucose (mmol/L) × fasting serum insulin (mU/L)/22.5. Thus, HOMA-IR is inversely proportional to insulin sensitivity.
Determination of plasma paraoxonase
In this method, the activity of arylesterase was measured by a spectrophotometer using phenylacetate (as a substrate). Thus, phenyl acetate is catalyzed by arylesterase/paraoxonase forming a phenol. The rate of this phenol formation is determined by surveillance of the increase in absorbance at 270 nm. 23,24
Determination of NO
Plasma NO was measured using Griess reagent according to the method described previously by Moshage et al. 25 ; thus, nitrite is usually used as an indicator of NO production.
Determination of ADMA by HPLC
Plasma ADMA was determined by HPLC (Agilent 1100 series, with a quaternary pump, model G131A) as described previously. 26
Sample preparation
Twenty five milligrams of 5-SSA was added to the sample (1 mL plasma), mixed well, and left in an ice-bath for 10 min; the mixture was then centrifuged at 4000 r/min using a cooling centrifuge for 10 min to remove precipitated protein, the supernatant was taken and filtered through a specific filter (hydrophilic polyvinylidene fluoride (PVDF) 0.45-μm filter); and the filtered solution (50 μL) was then mixed with 500 μL of OPA solution and left for only 3 min and then injected into HPLC.
HPLC condition
Twenty microliters of sample OPA was injected in HPLC and separation was carried out on a reversed-phase column (RF column, 150 mm and 4.6 mm). The mobile phase in this method consists of sodium acetate buffer/methanol/THF (A: 82/17/1) and (B: 22/77/1), v/v, respectively; it eluted in a flow rate 1.0 mL/min by gradient method as shown in Table 1. Column temperature was controlled at 37°C and the fluorescence detector was set at 338 and 425 nm (excitation and emission), respectively. A linear standard curve was drawn by plotting peak areas against the corresponding concentrations. The concentrations in samples were obtained from the resultant curve.
Gradient method for ADMA analysis by HPLC. 26

ADMA: asymmetric dimethylarginine; HPLC: high-performance liquid chromatography.
Determination of malondialdehyde in erythrocyte membrane
Lipid peroxidation was determined in packed RBCs by assaying of malondialdehyde (MDA) using Ruiz-Larrea’ method. 27 Thus, thiobarbituric acid reacts with thiobarbituric acid reactive substances and produces a red-colored complex, which is measured at 532 nm.
Extraction of erythrocyte membrane lipids
Lipids in the cell membrane were extracted using chloroform and methanol as described previously after modification by El-Khayat et al. 6 Total cholesterol and triglycerides (TG) in the erythrocyte membrane were estimated according to Richmond 28 and Fossati, 29 respectively, using the common colorimetric methods; additionally, erythrocyte membrane FAs were estimated by HPLC as follows.
Erythrocyte membrane FAs
Extracted FAs were estimated by HPLC, Agilent Technologies 1100 series, with a quaternary pump (G131A model).
Samples preparation
Briefly, erythrocyte membrane was homogenized in acetic acid (2%) and ethyl ether mixture (2:1) v/v, respectively; the solution was then centrifuged at 3000 r/min for 10 min and the organic phase was evaporated to dryness. After that, the extract was dissolved in acetonitrile (400 μL) and filtered through a specific filter paper (hydrophilic PVDF 0.45 μm).
HPLC condition
Estimation of FAs was conducted by RF column (250 × 4.6, particle size 5 μm) according to the method described previously. 13 The mobile phase consists of acetonitrile/water mixture (70/30) v/v, respectively, and eluted by a flow rate 1 mL/min; UV detector was set at 200 nm. Serial dilutions of standards were injected into HPLC and the peak areas were determined. A linear standard curve was constructed by plotting peak areas versus the corresponding standard concentrations. The concentrations in samples were obtained from the resultant curve.
Evaluation of DNA damage
Cell preparation
In a whole blood sample, blood was centrifuged at 4000 r/min for 30 min in Ficoll-Paque density gradient (Pharmacia LKB Biotechnology, Piscataway, New Jersey, USA); after centrifugation, leukocytes were aspirated from the buffy coat and washed twice by phosphate-buffered saline (PBS) at pH 7.4.
Cell microgels’ preparation
Comet assay was carried out according to Singh et al. 30 and Hussein et al. 2 Microgels were prepared as layers; the first one was made by applying 100 μL of agarose with normal melting point (0.7%) into microscope charged slides and coverslipped gently. The coverslip was removed after the agarose solidified at 4°C. Low-melting point agarose (0.5%) was prepared in PBS (100 mmol/L) and kept at 37°C. Mononuclear cells were mixed with agarose and then 100 μL of the mixture was applied to the first gel layer. The slides then kept for solidification at 4°C. After that, the coverslips were removed. A final layer of low-melting agarose was added followed by coverslips and left for 10 min to solidify before removing the coverslips.
Lysis of cells and DNA staining
The slides were covered with 100 mL of fresh lysis buffer (pH 10) at 4°C for 1 h. Buffer contains 2.5 mol/L NaCl, 100 mmol/L EDTA, 1% NaOH, 10 mmol/L Tris, 1% Triton X-100, and 10% dimethylsulfoxide. After draining, microgels slides were treated with DNA unwinding solution (300 mmol/L NaOH, 1 mmol/L EDTA, and pH 13) for 30 min at 4°C and put directly into a horizontal gel electrophoresis chamber that was also filled with DNA-unwinding solution. Gel was run with constant current (300 mA at 4°C) for 30 min. After electrophoresis, the microgels were neutralized with 0.4 M Tris, a base at pH 7.5 for 10 min. The slides were stained with ethidium bromide (20 μL from a concentration of 10 μg/mL).
Visualization and analysis of comet slides
The slides were examined at 400× magnification using a fluorescence microscope (model DM 2500; Leica Microsystems CMS GmbH, Wetzlar, Germany), equipped with an excitation filter of 549 nm and a barrier filter of 590 nm. A damaged cell is visualized as each cell had the comet, with a brightly fluorescent head and a tail to one side formed appearance. Samples were analyzed by counting the damaged cell out of 100 cells per slide to calculate the percentage of damage.
Statistical analysis
Results were expressed as mean ± standard error. Data were analyzed by one-way analysis of variance (SPSS version 16), p < 0.05.
Results
It is clearly seen that from UV-vis (Figure 1), the obtained AgNPs have surface plasmon resonance band at 400 nm confirming that the production of well-stabilized AgNPs. In addition, the well-stabilized AgNPs prove that soluble starch has the ability to reduce silver ions and convert it to the stabilized AgNPs in the presence of Tween 80 as dispersing agent. After encapsulating AgNPs with DHA, it is necessary to determine the entrapment efficacy of DHA and also to determine the weight loss of DHA.
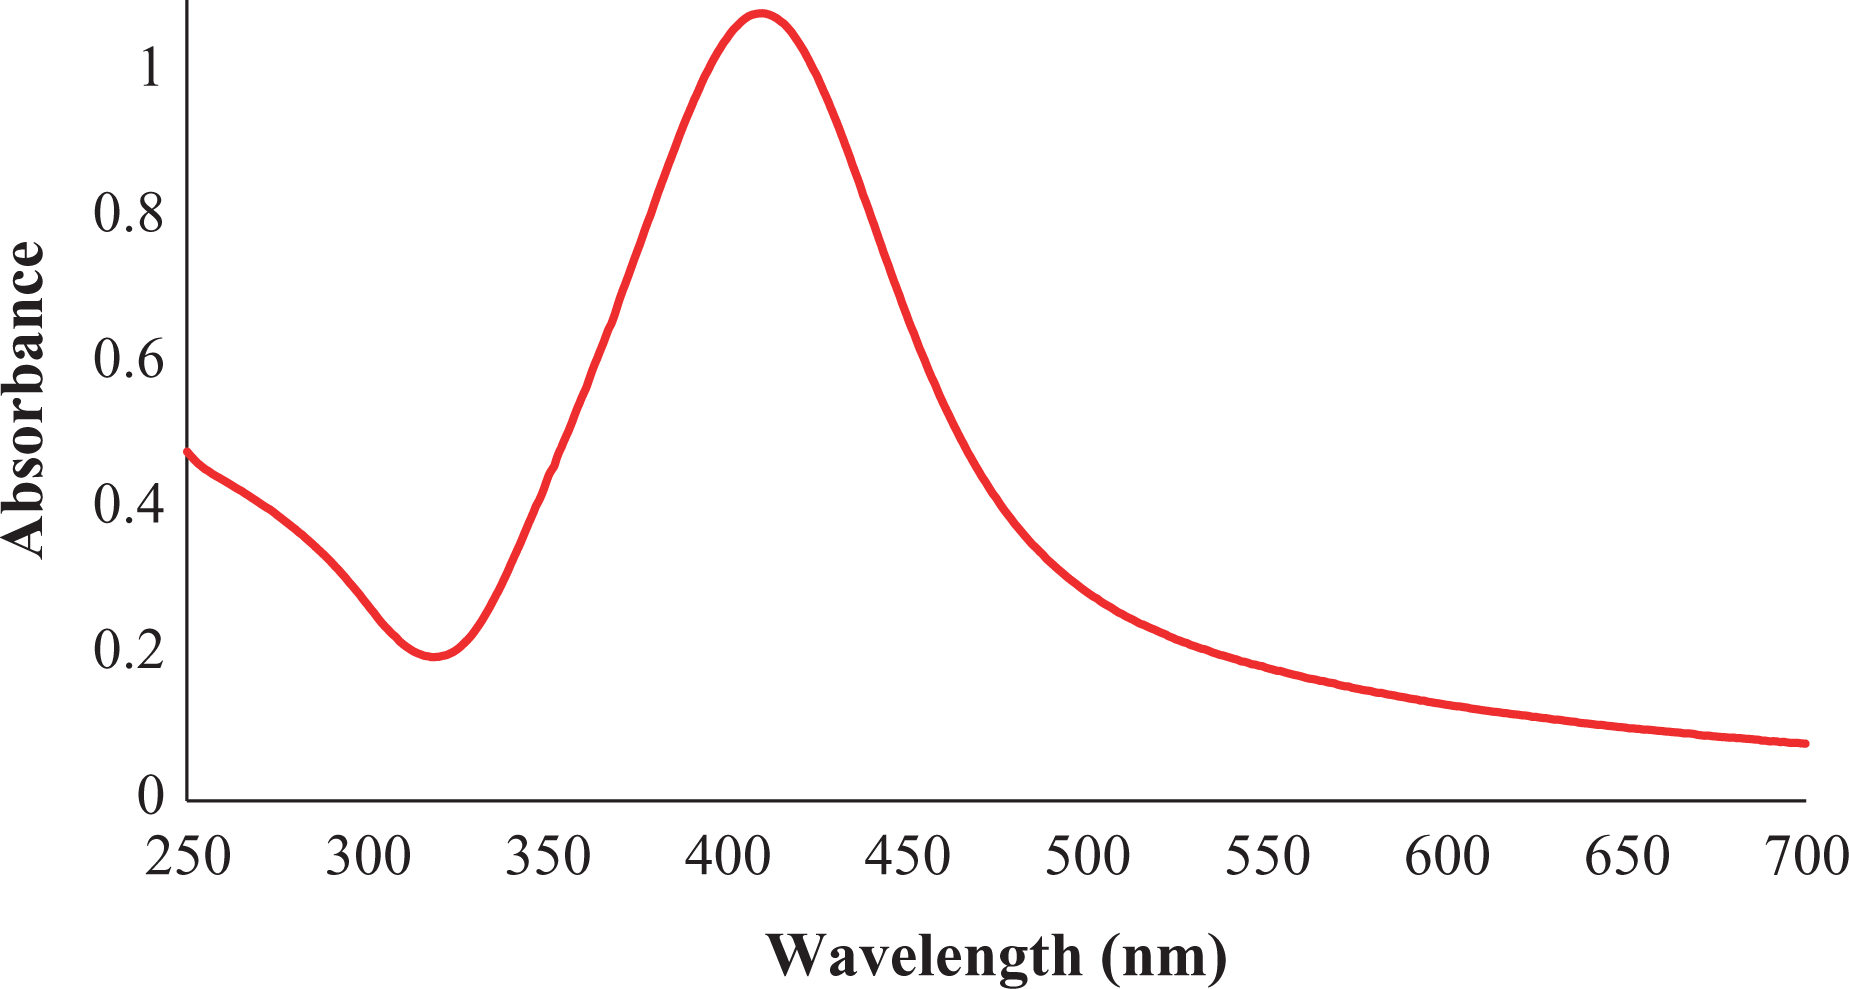
UV-vis of the formed AgNPs using nanoprecipitation technique. UV-vis: ultraviolet–visible spectroscopy; AgNPs: silver nanoparticle; DHA: docosahexaenoic acid.
The inclusion efficiency of coconut oil in the prepared formulations was determined and recorded. It is seen that the inclusion efficiency records 97.67%. The high entrapment efficiency values indicate relatively high affinity of DHA for AgNPs. In addition, the loss percent of DHA may be attributed to the adsorption of less amount of DHA on the surface of AgNPs nanoparticulate system which is easily leached during washing and centrifugation.
For further confirmation, the successful preparation of AgNPs with and without DHA, TEM, DLS, and SEM tools was used to investigate the shape, average size, and the surface structure of the obtained nanocomposite.
Figure 2(a), (b) and (c) illustrates the particle shape of the fabricated AgNPs at different magnification and different scales (500 nm, 200 nm, and 100 nm), respectively. It is observed that the formed AgNPs have spherical shape with good dispersion in a size less than 30 nm. Additionally, Figure 2(d) investigates the selected area diffraction of the resulted AgNPs, which confirm the crystallinity of AgNPs.

TEM of (a) to (d) AgNPs and (e) and (f) DHA-loaded AgNPs. AgNPs: silver nanoparticle; DHA: docosahexaenoic acid.
On the other hand, the particle shape of DHA/AgNPs as shown in Figure 2(e) and (f) is significantly different with significant agglomeration. The TEM image is taken at high and low magnification to clarify the particle shape of DHA/AgNPs. The aggregation may be attributed to that soluble starch has no strong effect in stabilization of the formed DHA/AgNPs. However, the formed nanocomposites are still in the small size as shown in Figure 2(e) and (f). The hydrodynamic average size is investigated using DLS as presented in Figure 3. It is observed that the average particle size of AgNPs is about 18 nm. While after loading with DHA, it is increased marginally to 24 nm. The obtained data from DLS are in agreement with that of TEM images.

Particle size analyzer of AgNPs and DHA-loaded AgNPs. AgNPs: silver nanoparticle; DHA: docosahexaenoic acid.
Figure 4 displays the morphological structure of AgNPs and DHA/AgNPs. It is clearly seen that the surface morphology of AgNPs (Figure 4(a)) has two faces due to the presence of AgNPs and soluble starch. On the other side, the resultant DHA/AgNPs (Figure 4(b)) have more of three phases due to the presence of AgNPs, soluble starch, and DHA. It is also observed that the formed NPs of AgNPs and DHA/AgNPs have spherical small size.
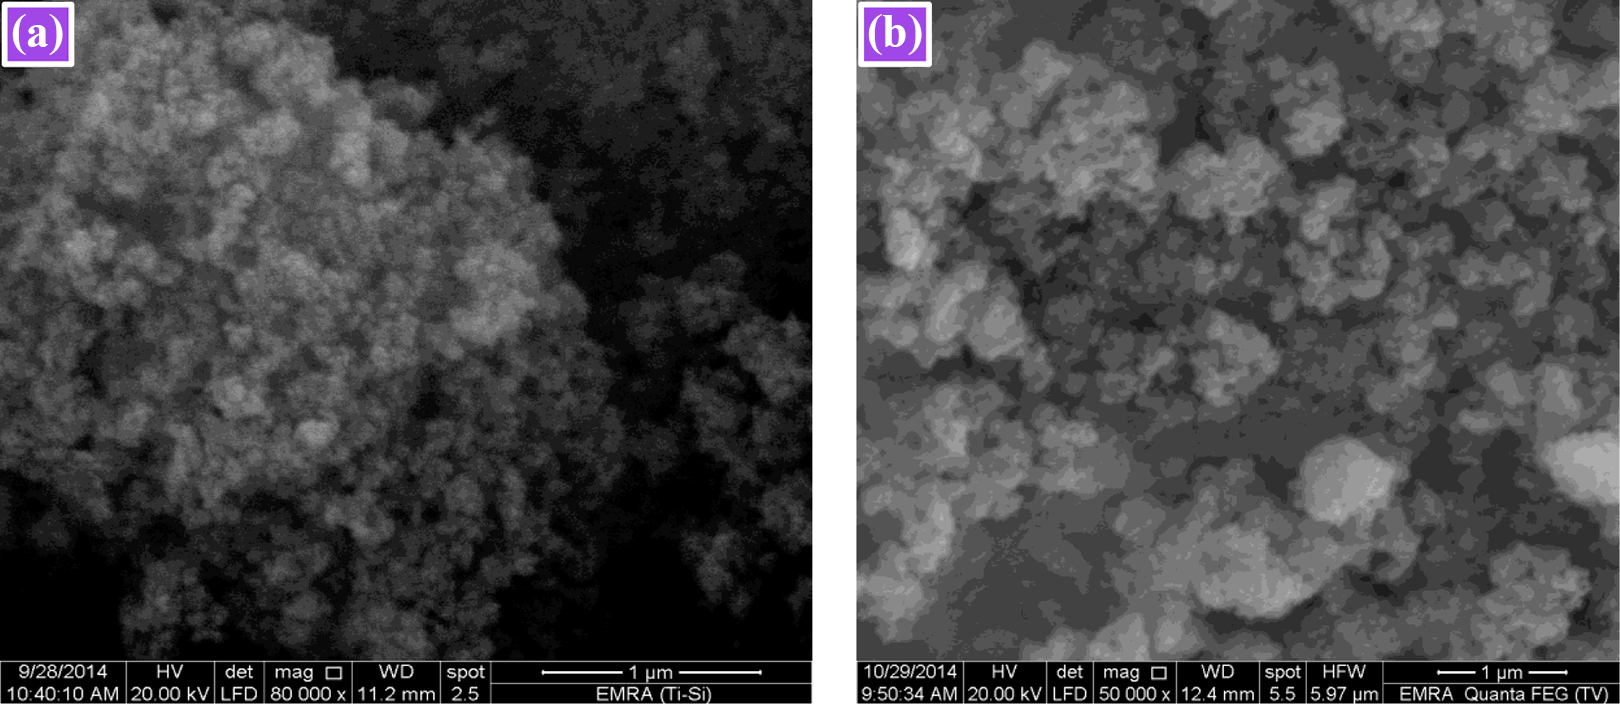
SEM of (a) AgNPs and (b) DHA-loaded AgNPs. SEM: scanning electron microscope; AgNPs: silver nanoparticle; DHA: docosahexaenoic acid.
In this study, body weight of diabetic rats was insignificantly decreased compared to control, whereas it returned back in treated groups to become more or less near the control group. Our results showed a reduction of fasting blood sugar along with an increase in insulin level and a reduction in insulin resistance in all treated groups compared to the diabetic group. Additionally, no significant difference was found between the DHA- and AgNPs-treated groups; however, a significant difference was observed between the DHA/AgNPs-treated group and the group treated with DHA alone (Table 2).
Mean levels of blood glucose, plasma insulin, insulin resistance, and body weight in the different studied groups.a

AgNPs: silver nanoparticle; DHA: docosahexaenoic acid; FBS: fasting blood sugar; SE: standard error.
aAll values are expressed as mean ± SE.
bp < 0.05: significant difference compared to the control group.
cp < 0.05: significant difference compared to the diabetic group.
dp < 0.05: significant difference compared to the DHA-treated group.
Concerning the lipid profile, the current results showed that cell membrane cholesterol and TG were significantly elevated in the diabetic group compared to control, but treatment with DHA, AgNPs, or DHA/AgNPs caused a significant reduction in both compared to the diabetic group (Table 3).
Cell membrane cholesterol and triglycerides in the different studied groups.a
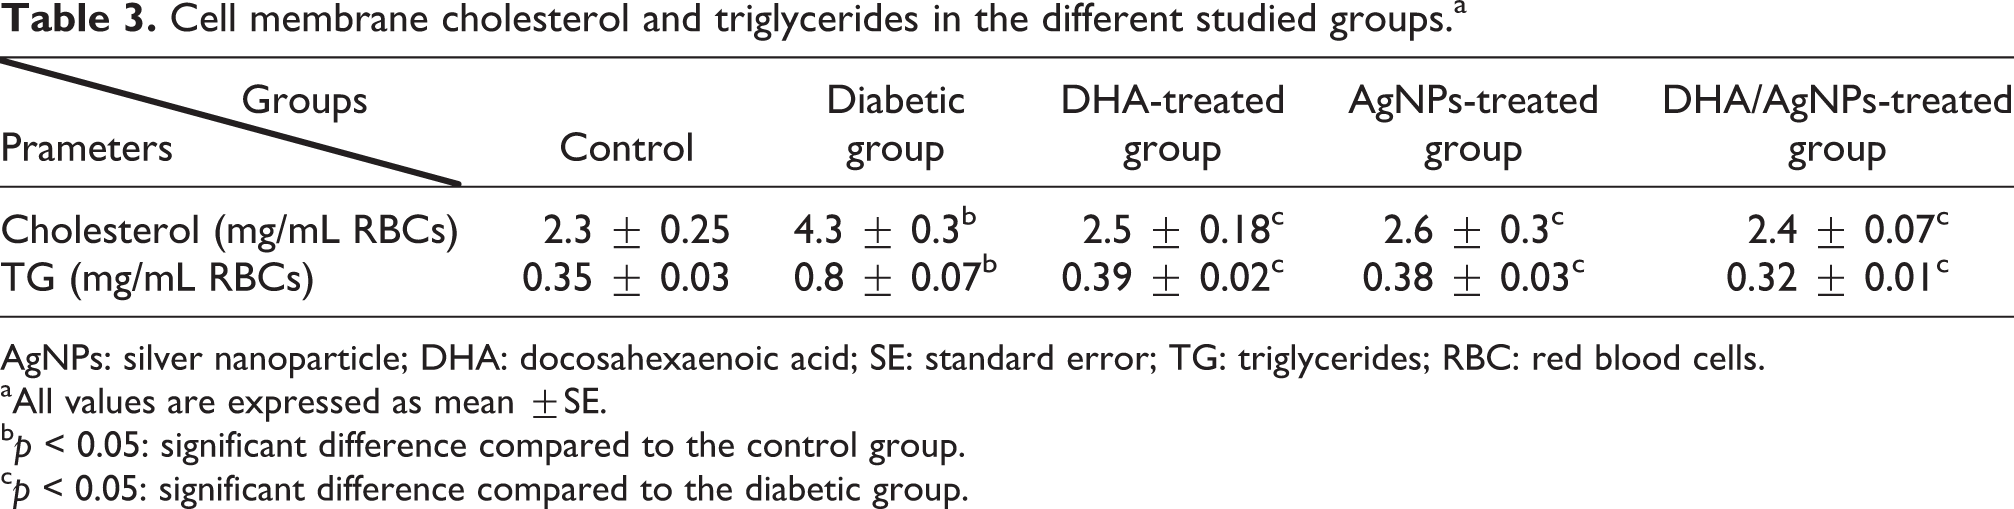
AgNPs: silver nanoparticle; DHA: docosahexaenoic acid; SE: standard error; TG: triglycerides; RBC: red blood cells.
aAll values are expressed as mean ±SE.
bp < 0.05: significant difference compared to the control group.
cp < 0.05: significant difference compared to the diabetic group.
In this study, DNA damage and MDA were significantly elevated, while the antioxidant enzyme (POX1) was significantly decreased in the diabetic group compared to the control group; however, treatment with DHA, AgNPs, or DHA/AgNPs significantly reduced these values compared to the diabetic group but still significantly higher than control. Additionally, DNA damage percentage was significantly decreased (22.5%) in the DHA/AgNPs-treated group compared to the DHA group (51.5%; Figure 5), whereas POX1 was significantly increased (Table 4).

DNA damage percent in different studied groups: (a) percent of DNA damage in the control group; (b) percent of DNA damage in the diabetic group; (c) percent of DNA damage in the DHA-treated group; (d) percent of DNA damage in the AgNPs-treated group; and (e) percent of DNA damage in the DHA-loaded AgNPs-treated group. AgNPs: silver nanoparticle; DHA: docosahexaenoic acid.
Oxidant and antioxidant parameters in the different studied groups.a

AgNPs: silver nanoparticle; DHA: docosahexaenoic acid; POX1: paraoxonase; SE: standard error; MDA: malondialdehyde; RBC: red blood cells.
aAll values are expressed as mean ±SE.
bp < 0.05: significant difference compared to the control group.
cp < 0.05: significant difference compared to the diabetic group.
dp < 0.05: significant difference compared to the DHA-treated group.
Studying the endothelial function showed that ADMA levels were significantly elevated and NO levels were significantly decreased in the diabetic group compared to control. Whereas a significant improvement in ADMA and NO levels was appeared in treated groups compared to the diabetic group (Table 5).
ADMA and NO levels in the different studied groups.a

ADMA: asymmetric dimethylarginine; NO: nitric oxide; AgNPs: silver nanoparticle; DHA: docosahexaenoic acid; SE: standard error.
aAll values are expressed as mean ± SE.
bp < 0.05: significant difference compared to the control group.
cp < 0.05: significant difference compared to the diabetic group.
dp < 0.05: significant difference compared to the DHA-treated group.
An important finding in this study is the elevation of arachidonic acid (AA), linoleic acid (LA), and oleic acid and a reduction of ALA and DHA in the diabetic group compared to control. However, a significant improvement was observed in FA profile in all treated groups (Table 6).
Cell membrane fatty acids in the different studied groups.a

ALA: α-linolenic acid; AA: arachidonic acid; LA: linoleic acid; OA: oleic acid; AgNPs: silver nanoparticle; DHA: docosahexaenoic acid; SE: standard error; MDA: malondialdehyde; RBC: red blood cells.
aAll values are expressed as mean ± SE.
bp < 0.05: significant difference compared to the control group.
cp < 0.05: significant difference compared to the diabetic group.
dp < 0.05: significant difference compared to the DHA-treated group.
A positive finding in this study is the significant increase in NO level along with a significant reduction in ADMA level in the DHA/AgNPs group compared to the DHA group (Table 5).
Discussion
Metals were known to play important roles in glucose metabolism and it was found that their deficiency is associated with diabetic complications; silver is one of these important metals that is involved in many metabolic processes; however, few studies investigated the role of silver or AgNPs on glucose levels, 14 that is why this study aimed to provide more understanding to the effect of AgNPs in enhancing DHA to attenuate diabetic complications mainly endothelial dysfunction in the context of incorporation of FAs in the cell membrane.
In this study, we aimed to use the nanoprecipitation technique for preparation of AgNPs encapsulated with DHA as a model drug. We also aimed to use an environmentally surfactant agent (Tween 80) to disperse the resultant nanocomposite against agglomeration beside the re-ductability and stability effect of soluble starch.
In this study, fasting blood sugar and insulin resistance were decreased along with elevation of insulin level in all treated groups compared to the diabetic group. Additionally, no significant difference was found between the DHA- and AgNPs-treated groups; however, a significant difference was observed between the DHA/AgNPs-treated group and the group treated with DHA alone. Shanker et al. 31 supported our findings by stating that nanomaterials are used as antidiabetic agents for their exclusive properties such as more surface area, small size, enhanced solubility, and biocompatibility. Also, Hussein et al. 24 explained that the small size of the NPs allows them to be carried through the cell membrane by transport mechanism and may be responsible for the potential biological effects compared to the crude drug.
In addition, the results of lipid profile in this study were in agreement with Shaheen et al. 14 who reported that both AgNPs and AuNPs bring effective reduction in the lipid profile and potential antioxidant property in controlling the oxidative stress–mediated lipid peroxidation and generation of ROS.
Opris et al. 32 supported our results by stating that NPs present a great potential for further usage as adjuvant therapy in diabetes due to the increase in antioxidant defense. In the current study, the reduction of MDA levels in treated groups may be due to the activity of these NPs to increase the antioxidants activities. 16 One of the antioxidant enzymes utilized in oxidative stress is PON1 which is associated with high-density lipoprotein (HDL). PON1 activity is reduced in diabetic patients as was observed in this study, while treatment with DHA, Ag, or DHA/AgNPs caused a significant elevation in PON1 levels but still significantly lower than the control group; however, treatment with DHA/AgNPs showed the most efficient effect (Table 4).
PON1 was extensively studied in diabetes and metabolic syndrome (Mets); these studies indicated that the activity of PON1 is decreased in both diabetes and Mets compared to controls, due to increased prooxidative status leading to inhibition of PON1 by its substrates, that is, lipid peroxides. 33
Studying the percentage of DNA damage showed that the damage in the diabetic group was significantly elevated compared to control, while supplementation of DHA, AgNPs, or DHA/AgNPs significantly reduced this damage compared to the diabetic group whereas it still significantly higher than control. No significant difference was observed between the DHA- and AgNPs-treated groups, whereas this percent was significantly decreased in the DHA/AgNPs group compared to the DHA group (Table 4 and Figure 5) indicating the powerful effect of NPs in enhancing the role of DHA as antioxidant agent.
Endothelial dysfunction is one of the important diabetic complications. Several studies indicated that ADMA has been used as an important marker for occurrence of endothelial dysfunction. There is a proof that elevation of ADMA level may be a cause or a result of rising insulin resistance. Surprisingly, several investigations indicated that insulin resistance plays an indicative role in propagation and proliferation of diabetic complications and retinopathy. However, different studies indicated that increased ADMA level is an important factor in diabetic complications and retinopathy; these evidences reflect a phenomenon of the association of diabetic complication with both ADMA elevation and insulin resistance 24 as appeared in the current study.
FA contents in the cell membrane were studied, and our results were coincided with El-Khayat et al. 6 who indicated a significant increase in cell membrane AA concentrations in diabetic rats compared to controls; they suggested that the increased AA levels could be due to elevated desaturase activity on LA leading to increased formation of prostaglandins and other lipoxygenase products.
Additionally, supplementation of DHA in this study increased insulin level and insulin sensitivity in both DHA and DHA/AgNPs groups. Thus, omega-3 FA administration increased insulin sensitivity via incorporation of DHA in the cell membrane and enhancing insulin receptors to bind more insulin molecules through increasing phosphatidyl inositol-3-kinase (PI3K) and glucose transporter 4 (GLUT4) levels in addition to increasing insulin secretion from β cells; insulin was shown to have vasodilatory effects, as well as anti-inflammatory and antioxidant properties. The insulin signaling cascade mediates insulin action in insulin responsive tissues and has been shown to stimulate NO generation in vascular smooth muscle and skeletal muscle. In addition to increase in NO production, it decreases ADMA levels inducing vasodilatation; the resultant increase in blood flow enhances glucose uptake. Thus, NO stimulates glucose transport by increasing GLUT4 levels at the cell surface; as a result, insulin resistance improved 34 as was found in our study.
The elevation of NO level along with a reduction of ADMA level in the DHA/AgNP group (Table 5) was clearly observed indicating the improvement of DHA by AgNPs, and appeared how far these NPs are able to facilitate the role of DHA in attenuation of endothelial dysfunction and ameliorating insulin resistance.
Conclusion
Nanoprecipitation technique was used to prepare DHA/AgNPs in the presence of soluble starch and Tween 80 as stabilizing and dispersing agents. The data obtained indicated that the as-synthesized DHA/AgNPs have a size around 24 nm. DHA/AgNPs is a potent agent for the improvement of endothelial dysfunction, insulin resistance, lipid profile, DNA damage, and FAs in STZ-induced diabetic rats. It has also the ability to improve the antioxidant power and hence protect the body cells from the oxidative stress generated in diabetes mellitus. Indeed, AgNPs enhances DHA particles in incorporation in the cell membrane and facilitates its role in protection against diabetic complications.
Footnotes
Acknowledgement
The authors are grateful to the National Research Centre, Giza, Egypt, for funding this work (internal project no: 11010130).
Declaration of conflicting interests
The author(s) declared no potential conflicts of interest with respect to the research, authorship, and/or publication of this article.
Funding
The author(s) received no financial support for the research, authorship, and/or publication of this article.