
Abstract
Sickle cell disease (SCD) treatment and management remain a challenging puzzle especially among developing Nations. Chrysin’s sickling-suppressive properties in human sickle (SS) erythrocytes in addition to its effect on AA-genotype erythrocytes were evaluated. Sickling was induced (76%) with 2% sodium metabisulphite at 3 h. Chrysin prevented (81.19%) the sickling and reversed same (84.63%) with strong IC50s (0.0257 µM and 0.00275 µM, respectively). The levels of oxygenated haemoglobin in the two groups (before and after induction approaches) were similar but significantly (P < 0.05) higher than that of SS erythrocytes (the ‘induced’ control), with chrysin-treated AA-genotype showing no effects relative to the untreated. The level of deoxygenated haemoglobin in the ‘induced’ control group was significantly (P < 0.05) higher than those of the chrysin-treated SS erythrocytes. Normal and chrysin-untreated erythrocytes (AA-untreated) were significantly more resistant to osmotic fragility than the SS-untreated. However, treatment with chrysin significantly reduced the osmotic fragility of the cells relative to the untreated cells. Furthermore, chrysin treatment significantly lowers the high level of 2,3-diphosphoglycerate (2,3-DPG) observed in the sickle erythrocytes, with no effects on AA-genotype erythrocytes. Based on functional chemistry, chrysin treatment alters the functional groups in favour of its antisickling effects judging from the observed bends and shifts. From metabolomics analysis, it was observed that chrysin treatment favors fatty acid alkyl monoesters (FAMEs) production with concomitant shutting down-effects on selenocompound metabolism. Thus, sickling-suppressive effects of chrysin could potentially be associated with modulation of oxygenated and deoxygenated haemoglobin via alteration of human sickle erythrocyte’s functional chemistry and metabolic pathways implicated in SCD crisis.
Introduction
Sickle cell disease (SCD) is the most common genetic disorder of haemoglobin in sub-Saharan Africa.1–3 Over 300,000 babies are born with the disease annually and it is predicted that the number will increase to 400,000 by 2050. 4 It is still a major public health challenge in Africa and some parts of Asia. 5 A point mutation on the sixth codon of the beta-globin gene positioned on the short arm of human chromosome 11 produces a defective beta-globin chain, which under low oxygen tension polymerizes into long strands that ultimately lead to characteristically deformed (sickle) red cell. The red cells thus become sticky, adhere to endothelium and occlude micro-vasculatures. 6 This might lead to infarction and necrosis of tissues and organs. The impediment of narrow blood vessels by the distorted erythrocytes increases adhesion molecules and reduces nitric acid production, leading to reduction in blood flow which results in tissue hypoxia, leading to awful painful chapters. 6 In addition, sickle red cells have a much-shortened lifespan due to the defective haemoglobin, making chronic haemolytic anaemia a persistent feature of the condition.
The compound 2,3-bisphosphoglycerate (BPG) is well known for stabilizing the conformation of haemoglobin (Hb) subunits, increasing net oxygen delivery by enhancing oxygen off-loading to body tissues. 7 BPG is produced by bisphosphoglycerate mutase (BPGM). The required substrate, 1,3-bisphosphoglyerate, is an intermediate of the glycolysis pathway in which the substrate is acted upon by BPGM to produce BPG. Both low pH and high concentration of 2,3-BPG promote sickle Hb polymerization and the effects are synergetic as low pH enhances the binding affinity of 2,3-BPG to Hb and the bound BPG encourages the accumulation of acidic metabolites by sickling and vaso-occlusion. 8 However, anti-sickling agents such as drugs, phytochemicals and ions inhibit the pathophysiological mechanisms leading to sickling in the vasculature. Most orthodox drugs developed so far for sickle cell management and treatment largely target on symptomatic pain relief and crisis amelioration. The drugs are not readily available and are usually expensive to acquire especially in developing nations. Therefore, understanding the pathophysiology of SCD could be promising in unveiling therapeutic strategies of this genetic disease.
Chrysin (5,7-dihydroxyflavone) is a hydroxylated flavone chiefly found in honey, propolis and quite a few species of plants such as Pelargonium crispum, Passiflora incarnata, Oroxylum indicum; it is also available in spices like parsley, rosemary, celery, olives etc. 9 Chrysin belongs to the flavone class of the 15-carbon skeleton polyphenolic compounds called flavonoids. These substances are relatively non-toxic compounds with therapeutic potentials and have gained major attention in the field of medicine. 10 Chrysin has been designated as having health-promoting and anticancer properties. It has shown its activity in several biological assessments, suggesting that it may probably be bioactive against many diseases. It blocks many cancer-related pathways thereby promoting apoptosis and mediating cell death by autophagy. Through interaction with some signaling pathways, chrysin demonstrates appreciable preventive and reversal potentials to a number of diseases, 11 which support its possession of hydroxyl groups. Our research group previously demonstrated the potential of chrysin to suppress erythrocyte sickling using in silico and in vitro approaches. 5 However, the mechanism of this antisickling effects is yet to be elucidated. The present study aims at investigating this potential and unveiling the mechanism of action of this compound not only in preventing the sickling of erythrocytes but also in reversing the anomaly during crisis.
Materials and methods
Collection of blood samples
The blood samples used in this study were collected with the consent of the participants at the Ahmadu Bello University Teaching Hospital, Zaria, Nigeria. A written informed consent was read and signed by all the individuals participating in the study. All the research procedures have received the approval of the scientific and health research ethics committee of Ahmadu Bello University Teaching Hospital Zaria, Nigeria (ABUTH/HREC/UG/6). The blood samples collected in EDTA bottles were immediately subjected to haemoglobin (Hb) electrophoresis for confirmation of genotype at the haematology Department of Ahmadu Bello University Teaching Hospital Zaria, Nigeria. They were later prepared by centrifugation at 5000 rpm for 10 min and washed three times in normal saline (Sigma Aldrich St. Louis, Missouri, USA) and stored at −22°C for further analysis.
In vitro induction of sickling
The RBCs were suspended in the normal saline and used for the analysis according to a previously described method. 12 Briefly, 100 µL of the blood cell suspensions was mixed with 100 µL of 2% sodium metabisulphite solution and incubated at 37°C. Sickling induction was monitored microscopically at different time points (3, 4, 5, 6 and 9 h) using 10% Giemsa stain. The number of sickle cells was counted at each time point and the percentage of sickle cells was calculated using the formula:

Evaluation of anti-sickling property of chrysin
Chrysin anti-sickling activity was investigated as described previously. 12 Briefly, half a milliliter (0.5 mL) of the washed erythrocytes was mixed with 0.5 mL of freshly prepared 2% sodium metabisulphite in a clean test tube. The mixture was incubated in a water bath at 37°C for 30 min. A drop of the mixture was placed on a microscope slide and viewed under a light microscope. Equal volumes of normal saline and the test compound (chrysin) were added to the blood-metabisulphite mixtures in separate test tubes, respectively, and incubated at 37°C for another 30 min. Aliquots were taken from each of these test tubes at 30 min intervals, for up to 2 h to confirm induction of sickling as described in the subsequent section.
Smear preparation and counting of sickle and non-sickle cells
The method described by Egunyomi et al. 13 was adopted for smear preparation and counting of sickle and non-sickle cells. Briefly, each sample was smeared on microscope slide, fixed with 95% methanol, dried and stained with 10% Giemsa stain. It was then examined under an oil immersion microscope and the RBCs were viewed and counted from four different fields across the slide at ×100 magnification. Both sickle and non-sickle red blood cells were quantified, and the percentage of the non-sickle cells was determined using the following formula:

Based on the range of chrysin concentrations used vis-à-vis the antisickling effects observed, the IC50 values were calculated for the ‘before’ and ‘after’ induction assays and were found to be 0.00275 µM and 0.0257 µM, respectively. These were further considered in our subsequent assays as the optimal concentrations of chrysin with efficacy.
Oxygenated and deoxygenated haemoglobin assays
A previous method 14 was used for the determination of the concentration of oxygenated haemoglobin in the Chrysin-treated Erythrocytes. To a whole blood whose haemoglobin concentration was predetermined, 0.04% ammonium hydroxide and chrysin (using the IC50 concentrations) were added in equal proportions and the optical densities of the diluted solutions read with a green filter at 576 nm.
For deoxygenated haemoglobin, we used a previously reported method. 15 A volume of 0.02 ml of EDTA blood was added to 5 ml of Drabkin’s reagent. The tube containing the solution was sealed using a stopper and inverted several times, then allowed to stand at room temperature for 15 min to ensure the completion of the reaction. Absorbance of the solution was measured against a reagent blank (washed erythrocytes suspended in normal saline) using a spectrophotometer at 540 nm. Concentration of Hb was obtained from Hb chart (g/dL).
Osmotic fragility test
The osmotic fragility of the erythrocytes was determined according to the method described previously. 16 The various IC50 concentrations of chrysin were respectively added to 4 ml of buffered saline (pH 7.4), respectively, followed by the addition of 0.05 ml of isolated HbSS erythrocytes, in 10 ml capacity reaction vessels. The mixture was incubated at room temperature for 30 min and then centrifuged at 2000 rpm for 15 min. The supernatant was collected and read at 540 nm against a blank (0.85% buffered saline). The experiment was setup in duplicates and the sample containing 0.0 μM of chrysin was used as control.
The absorbance of the content of each test tube was multiplied by a factor of 100. The range of values represented the percentage of erythrocyte lysis at each saline concentration (9.0–3.0 g/l Nacl), respectively. The corresponding concentration of saline (g/l) that yielded 50% lysis of red blood cells was recorded as the mean corpuscular fragility (MCF) index. The MCF values were interpolated from the cumulative erythrocyte osmotic fragility curves obtained by plotting the percentage of lysis against saline concentrations.
2,3-disphosphoglycerate assay
The 2,3-DPG assay was done using Human 2,3-Diphosphoglycerate ELISA Kit (Shanghai Coon Koon Biotech Co., Ltd) following the manufacturer’s protocol. Briefly, 50 µl of the standard solution from the kit was placed in a well of the Microelisa Stripplate. Also, 10 µl of the sample was placed in another well, to which 40 µl of sample diluent was added. Then, 100 µl of HRP-conjugate reagent was added to each of the standard and test sample wells and then covered with seal plate membranes. The well contents were gently shaken and mixed and incubated for 60 min at 37°C. The washing solution was diluted 20× with distilled water for later use. The sealing film was gently removed; the liquid drained and the well dried up. Each well was then filled with the washing solution, put aside for 1 min after which the liquid was drained again. This was repeated for five 5 times. For color development, 50 µl chromogen solution A was added to each well, followed by 50 µl chromogen solution B. The contents were shaken gently to mix up and incubated for 15 min at 37°C away from light. Then, 50 µl of stop solution was added to each of the wells to stop the reaction (indicated by immediate color change from blue to yellow). A blank well was prepared similarly but without addition of the standard solution or the sample. A spectrophotometer was zeroed using the blank and the used to measure the absorbance (OD) of the content of each well at 450 nm wavelength. The OD measurement was carried out within 15 min of addition of the stop solution. The experiment was conducted in triplicate.
Fourier-transform infrared (FTIR) spectroscopy analysis
Equal volumes of the test samples (at the IC50 concentrations) and sickle erythrocytes were incubated for 24 h at 37°C, as described in a previous study. 17 The samples were then dried under pressure and sandwiched between potassium bromide (KBr) cells. They were then scanned on FTIR spectrophotometer at room temperature (25–28°C) at 300–4500 cm−1 spectral range. The peak heights were used in determining the functional groups present in the sample by comparison to the IR spectroscopy correlation table.
Gas chromatography-mass spectrometry (GC-MS) analysis
The treated sample was subjected to gas chromatography-mass spectrometry (GC-MS) analysis to identify the various secondary metabolites present. Shimadzu GC-MS QP2010 ULTRA (Labstock Nigeria ltd) with column: Optima 5MS (5% diphenyl and 95% dimetylpolysiloxane); length: 30 m; thickness: 0.25 mm; ID: 0.25 mm; column flow: 1.34 mL/min; gas: helium was used for GC-MS analysis. Flow rate was set at 1.34 mL/min, and temperature of column maintained at 60°C for 2 min and then raised to 200°C (15oC/min) followed by 9 min at 280°C (5°C/min). The National Institute of Standards and Technology mass spectral programme 2011 was used for mass spectral survey. The concentrations of the identified compounds were calculated using area normalization over flame ionization detector response method.
Liquid chromatography-mass spectrometry (LC-MS) analysis
The samples were analyzed using liquid chromatography tandem mass spectrophotometry (LC-MS) as previously reported 18 with little modifications. Briefly, the samples were reconstituted in Methanol and filtered through polytetrafluoroethylene (PTFE) membrane filter with 0.45 µm size. After filtration, the filtrate (10.0 μl) was injected into the LC system and allowed to separate on Sunfire C18 5.0 µm 4.6 mm × 150 mm column. The run was carried out at a flow rate of 1.0 mL/min, Sample and Column temperature at 25°C. The mobile phase consists of 0.1% formic acid in water (solvent A) and 0.1% formic acid in acetonitrile (solvent B).
The ratio of A/B 95:5 was maintained for further 1 min, then A/B 5:95 for 13 min to 15 min, then A/B 95:5 to 17 min, 19 min and finally 20 min. the PDA detector was set at 210–400 nm with resolution of 1.2 nm and sampling rate at 10 points/s. The mass spectra were acquired with a scan range from m/z 100–1250 after ensuring the following settings: ESI source in positive and negative ion modes; capillary voltage 0.8 kv (positive) and 0.8 kv (negative); probe temperature 600°C; flow rate 10 mL/min; nebulizer gas, 45 psi. MS set in automatic mode applying fragmentation voltage of 125 V. The data was processed with Empower 3. The compounds were identified on the basis of the following information, elution order, and retention time (tR), fragmentation pattern, and Base m/z. The metabolites were identified by direct comparison of the mass spectra data with those from the Human Metabolome Database. 19
Metabolic pathway analysis
The relevant metabolic pathways were identified by subjecting the identified metabolites to pathway analysis using the MetaboAnalyst 4.0. 20 The hypergeometric test and relative-betweenness centrality were utilized for over representation and pathway topology analyses, respectively of the metabolites. The Kyoto Encyclopedia of Genes and Genomes (KEGG) pathway library for Rattus norvegicus (rat) was selected for metabolite mapping.
Data analysis
Where appropriate, data were analyzed using one-way Analysis of Variance (ANOVA) at p < 0.05 followed by post-hoc t-test at p < 0.01 (where necessary). Data were presented as mean ± SD (standard deviation). Venn diagrams were constructed from the Bioinformatics & Evolutionary Genomics site (http://bioinformatics.psb.ugent.be/webtools/Venn/).
Results
2% sodium metabisulphite optimally induces erythrocytes sickling at 3 h post incubation period
To establish the optimal incubation period for sickling induction by 2% sodium metabisulphite (SMS), equal volumes (0.5 ml) of SS erythrocytes (not in crisis) and 2% SMS were mixed and incubated at 37°C for 3, 4, 5, 6 and 9 h. After these periods, smears of the mixtures were prepared, fixed, stained using 10% Giemsa stain and observed under a light microscope. Our results demonstrate an optimal sickling at 3 h incubation period (76% sickling) with 2675:866 severity ratio (Table 1 and Supplementary Figure S2). Incubation periods of 4, 5, 6 and 9 h all have percentage sickling of 75% at the ratios of 776:161, 776:187, 595:174 and 757:178, respectively. Although the sickling differences among the various incubation periods were not significantly different, the 3 h post incubation period was adopted for subsequent experiments where necessary.
Incubation period for optimal sickling induction by 2% sodium metabisulphite.

Chrysin exerts anti-sickling effect on human erythrocytes
To understand the preventive and reversal effects of chrysin on erythrocyte sickling, we treated the cells with this compound at varying concentrations before and after sickling induction, respectively. In Table 2, the cells were pretreated with chrysin before induction of sickling (SS-before) using 2% SMS. Strikingly, the number of sickle cells after the induction period decreases with increasing concentration of chrysin (Table 2, Supplementary Figure S3(A)). The most sickling-preventive effect of chrysin was recorded at 1 mM concentration where only about 19% of the cells were sickle, unlike the nonchrysin-treated group (0.0 µM chrysin) that presented about 68% sickle erythrocytes. On the other hand, the erythrocytes were treated with chrysin after induction of sickling (SS-after) using the 2% SMS. Similarly, the number of sickle erythrocytes here decreases with increasing chrysin concentration (Table 3, Supplementary Figure S3(B)). Interestingly, the most erythrocyte sickling-reversing effect was also observed at 1 mM chrysin concentration where only about 15% of the cells remained sickle at 30 min post chrysin treatment. At this point, about 62% of the cells in the control group were sickle. The 1 mM chrysin concentration generally had the least non-sickle to sickle erythrocyte ratio (Supplementary Table S1). We further determined the half maximum inhibitory concentration (IC50) of the compound and found it to be 0.0257 µM and 0.00275 µM for SS-after and SS-before, respectively. This value was considered in the subsequent experiments where appropriate. Taken together, these results demonstrate the preventive and reversal effects of chrysin on erythrocyte sickling.
Effect of chrysin treatment before induction of sickling in human erythrocytes.

Effect of chrysin treatment after induction of sickling in human erythrocytes.

Chrysin ameliorates erythrocytes sickling by restoring haemoglobin function
Considering the fact that oxygenated form of haemoglobin predominates in a normal (non-sickle) erythrocyte, we decided to quantify the levels of oxygenated and deoxygenated haemoglobins in the chrysin-treated erythrocytes so as to gain an insight into the anti-sickling mechanism of the compound. We first investigated the level of oxygenated haemoglobin in SS-genotyped erythrocytes that were treated with chrysin before and after sickling induction, respectively. Our data show that the levels of oxygenated haemoglobin in the two groups were similar but significantly higher than that of SS erythrocytes that were sickling-induced but not chrysin-treated (the ‘induced’ control) (Figure 1(A)). The similar haemoglobin levels in the two treatment groups were, however, lower than those of chrysin-treated and untreated AA-genotyped erythrocytes. The two AA groups have significantly similar haemoglobin levels, suggesting that chrysin treatment does not exert any negative consequential effect on the erythrocytes function and integrity.

Effect of chrysin treatment on the levels of oxygenated and deoxygenated haemoglobin after induction of sickling. (A) Concentrations of oxygenated haemoglobin in the various samples. (B) Concentrations of deoxygenated haemoglobin in the various samples. Each value in the figure is a mean ± SD of three independent experiments. Different letters on top of the bars indicate significant difference at p < 0.05.
We similarly assayed for deoxygenated haemoglobin levels and found no significant difference in chrysin treatment before and after sickling induction (Figure 1(B)). The level of deoxygenated haemoglobin in the ‘induced’ control group was significantly higher than those of the chrysin-treated SS groups, which suggests that chrysin treatment restores the loss-of-function of sickle erythrocytes. Supplementary Figure S1 summarizes these results for clear comparison. Put together, our data suggest that chrysin confers anti-sickling property through restoration of haemoglobin function.
Chrysin lowers the osmotic fragility of sickle erythrocytes
Secondary metabolites from some pathogenic bacteria or fungi cause haemolysis of the red blood cells (RBCs). 21 This prompted us to investigate whether chrysin causes haemolytic damage to the sickle/normal RBCs. This was achieved by inducing sickling using the 2% SMS followed by chrysin treatment (or the other way round) and then osmotic fragility test as described in the Materials and Methods section. The results indicate that the normal and chrysin-untreated erythrocytes (AA-untreated) were significantly more resistant to osmotic fragility than the SS-untreated (induced) ones (Figure 2). However, treatment of the SS erythrocytes with chrysin significantly reduced the osmotic fragility of the cells as compared to the untreated group, although the haemolysis levels were still higher than those of the AA erythrocytes. As usual, there is no significant difference in the percentage fragility between the samples treated before and those treated after sickling induction (SS-before and SS-after respectively). Likewise, the treated and untreated normal erythrocytes (the AA erythrocytes) did not present any significant difference. Based on these results, we conclude that chrysin treatment improves the membrane stability of sickle erythrocytes.
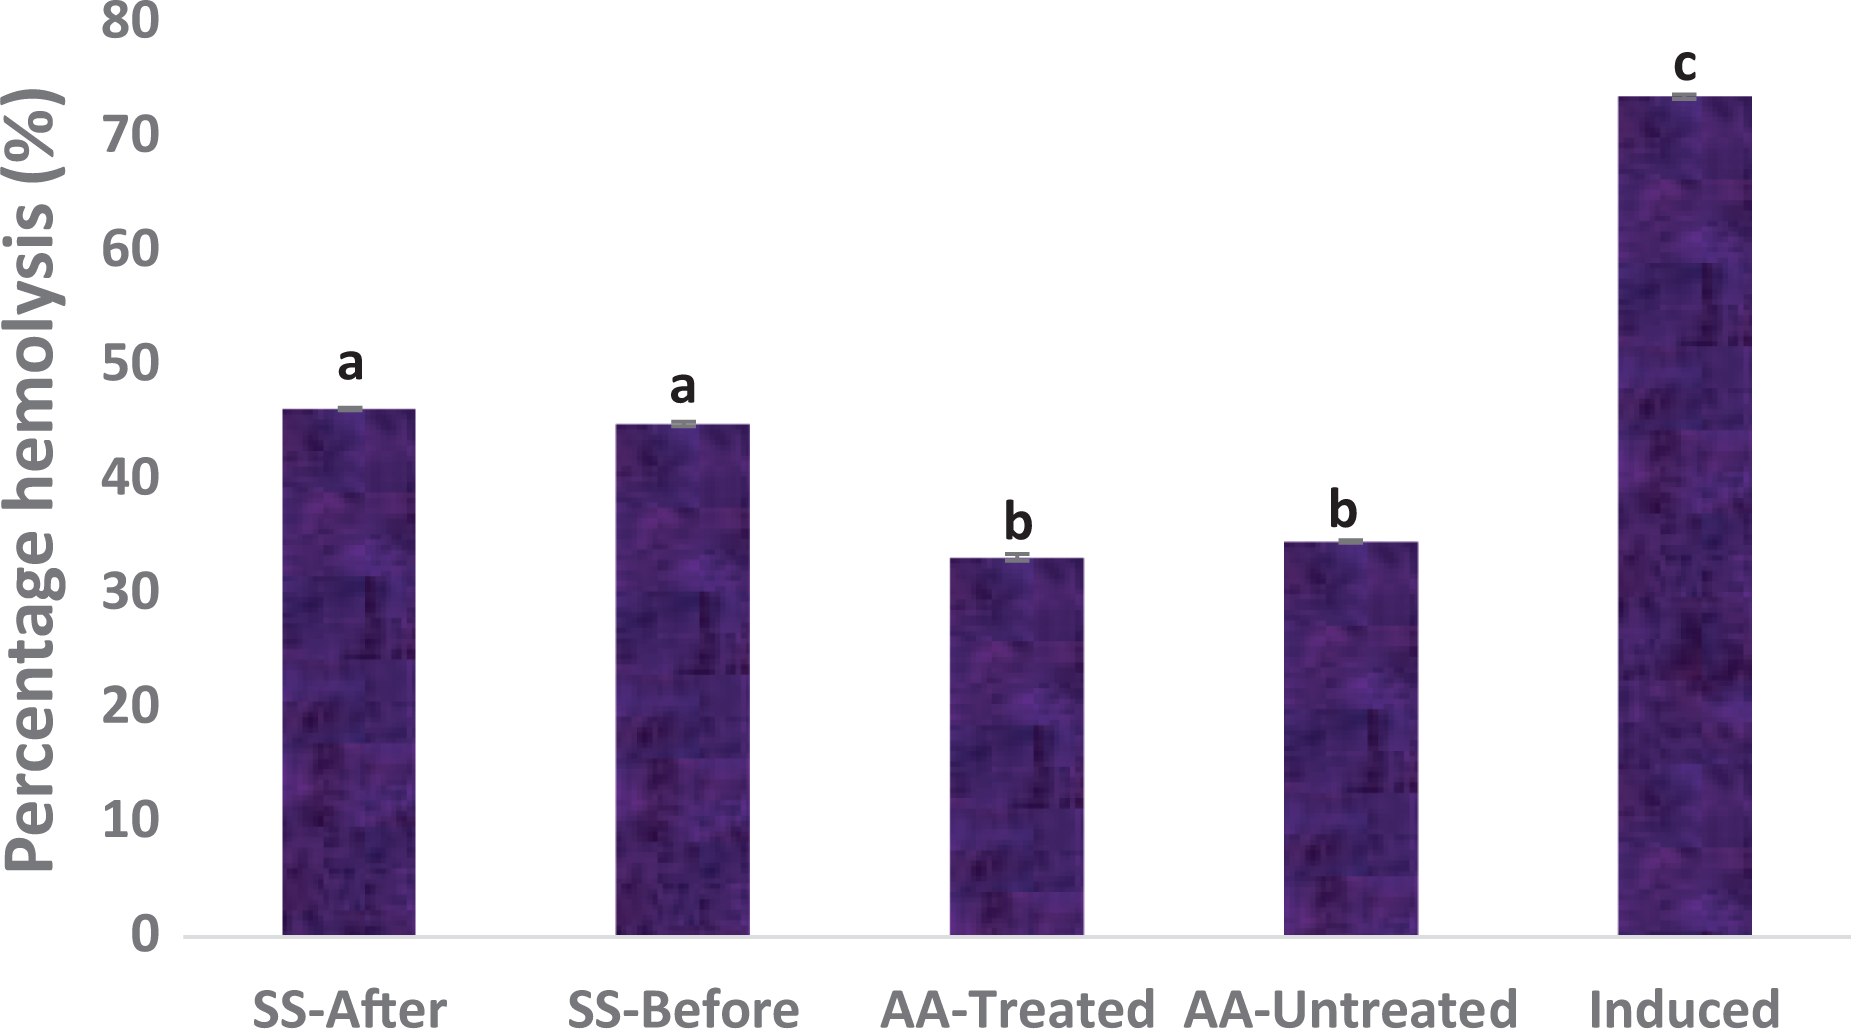
Effect of chrysin treatment on erythrocytes haemolysis after induction of sickling. Values = mean ± SD; n = 3. Different alphabets above the bars indicate significant difference at p < 0.05.
The level of 2,3-diphosphoglycerate in sickle erythrocytes decreases after chrysin treatment
Increase in the concentration of 2,3-diphosphoglycerate (2,3-DPG) of an erythrocyte decreases the oxygen affinity of the haemoglobin and vice versa. 22 For this reason, sickle erythrocytes tend to have higher concentration of 2,3-DPG than the normal ones. We therefore decided to check whether chrysin treatment could alter the level of 2,3-DPG in the sickle erythrocytes. We found that chrysin treatment significantly lowers the high level of 2,3-DPG observed in the sickle erythrocytes irrespective of whether the chrysin is applied before or after induction of sickling (Figure 3), indicating an improvement in oxygen affinity of the haemoglobin. This is consistent with our previous data that showed that chrysin restores haemoglobin function in sickle erythrocytes (Figure 1). Chrysin treatment did not affect the concentration of 2,3-DPG in the normal erythrocytes.
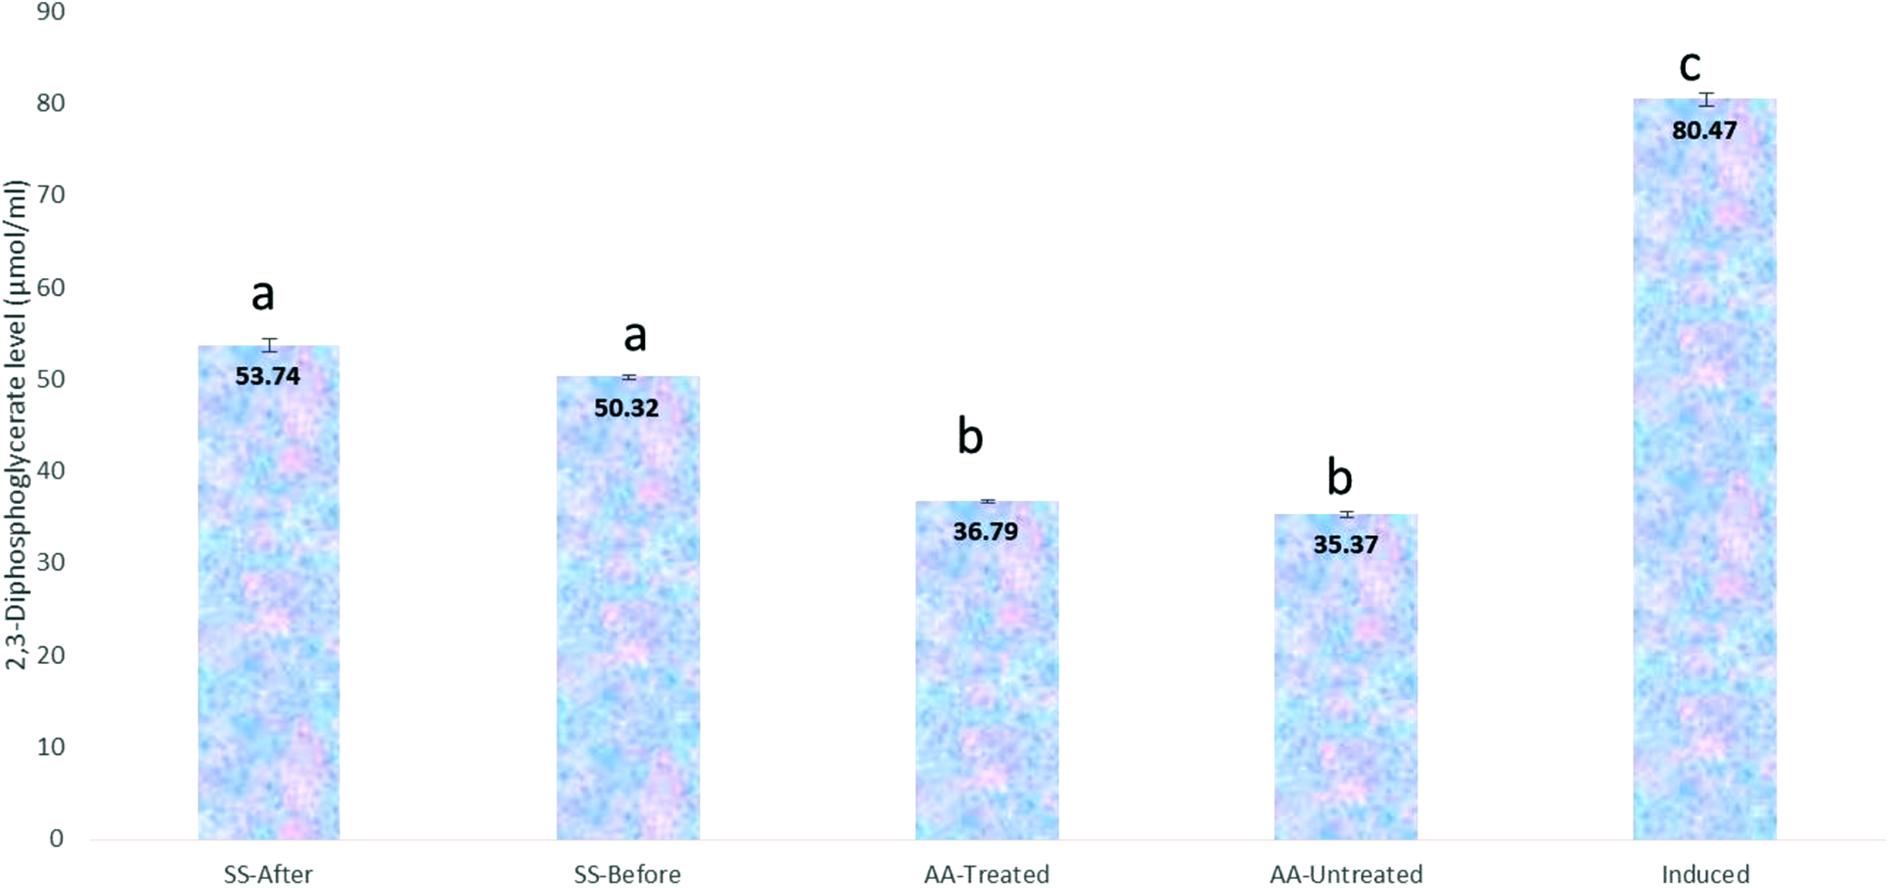
Effect of chrysin treatment on the level of 2,3-diphosphoglycerate after induction of sickling using 2% SMS. Values = mean ± SD; n = 3. Different alphabets above the bars indicate significant difference at p < 0.05.
FTIR and GC-MS reveal alterations in the functional chemistry of erythrocytes after chrysin treatment
To further gain a clue into the molecular mechanism of chrysin function in ameliorating erythrocyte sickling, we set to dissect whether chrysin alters some functional groups on the sickle erythrocytes in the course of restoring their lost functions. The samples were first subjected to Fourier-Transform Infrared Spectroscopy (FTIR) to investigate some possible changes in the hydrophobic macromolecules within the cells. Table 4 presents the FTIR results of the various treatments. The 9th, 13th and 15th rows show functional group changes due to chrysin treatment. The ninth row shows that chrysin treatment supplies hydroxyl group to an alkane molecule, thereby improving its solubility in water. The 13th row shows the ability of chrysin to introduce carbon-carbon double bond (C=C) into a polysaccharide in the cells which suggest that chrysin acts as an oxidizing agent here by withdrawing electrons from this compound. Interestingly, chrysin removes C=C bond from a given lipid as seen from the 15th row, most likely by supplying electron pair into this position to convert the double bond to a single one. These results suggest that chrysin could function as a redox compound to prevent/ameliorate erythrocytes sickling.
FTIR results showing alterations in the functional chemistry of erythrocytes in the various samples.

Chrysin creates noticeable alterations in the functional chemistry of some groups in a redox manner. + shows the presence of a given functional group; − indicates the absence of a given functional group.
Chrysin treatment favors fatty acid alkyl monoesters (FAMEs) production
Considering the above FTIR results, we tried to identify some metabolites that may have been altered following chrysin treatment. The various test samples were therefore subjected to GC-MS to identify these compounds present. The metabolites identified in the various samples are presented in Table 5. Six of these compounds were found to be common in both SS-before and SS-after treatments (Supplementary Figure S4, Table 5). Interestingly, all of these compounds are fatty acid alkyl monoesters (FAMEs) except 4H-1-Benzopyran-4-one which is a flavone (note that chrysin is also a flavone, and that n-Hexadecanoic acid is also present in the induced sample). Of all the chrysin-treated samples, only SS-before and SS-after contains FAMEs; AA-treated contains only methyl tetradecanoate as a FAME, which is also present in AA-untreated. This suggests that chrysin recruits FAMEs to exert its anti-sickling function.
Details of the various metabolites detected by GC-MS in the different experimental groups.
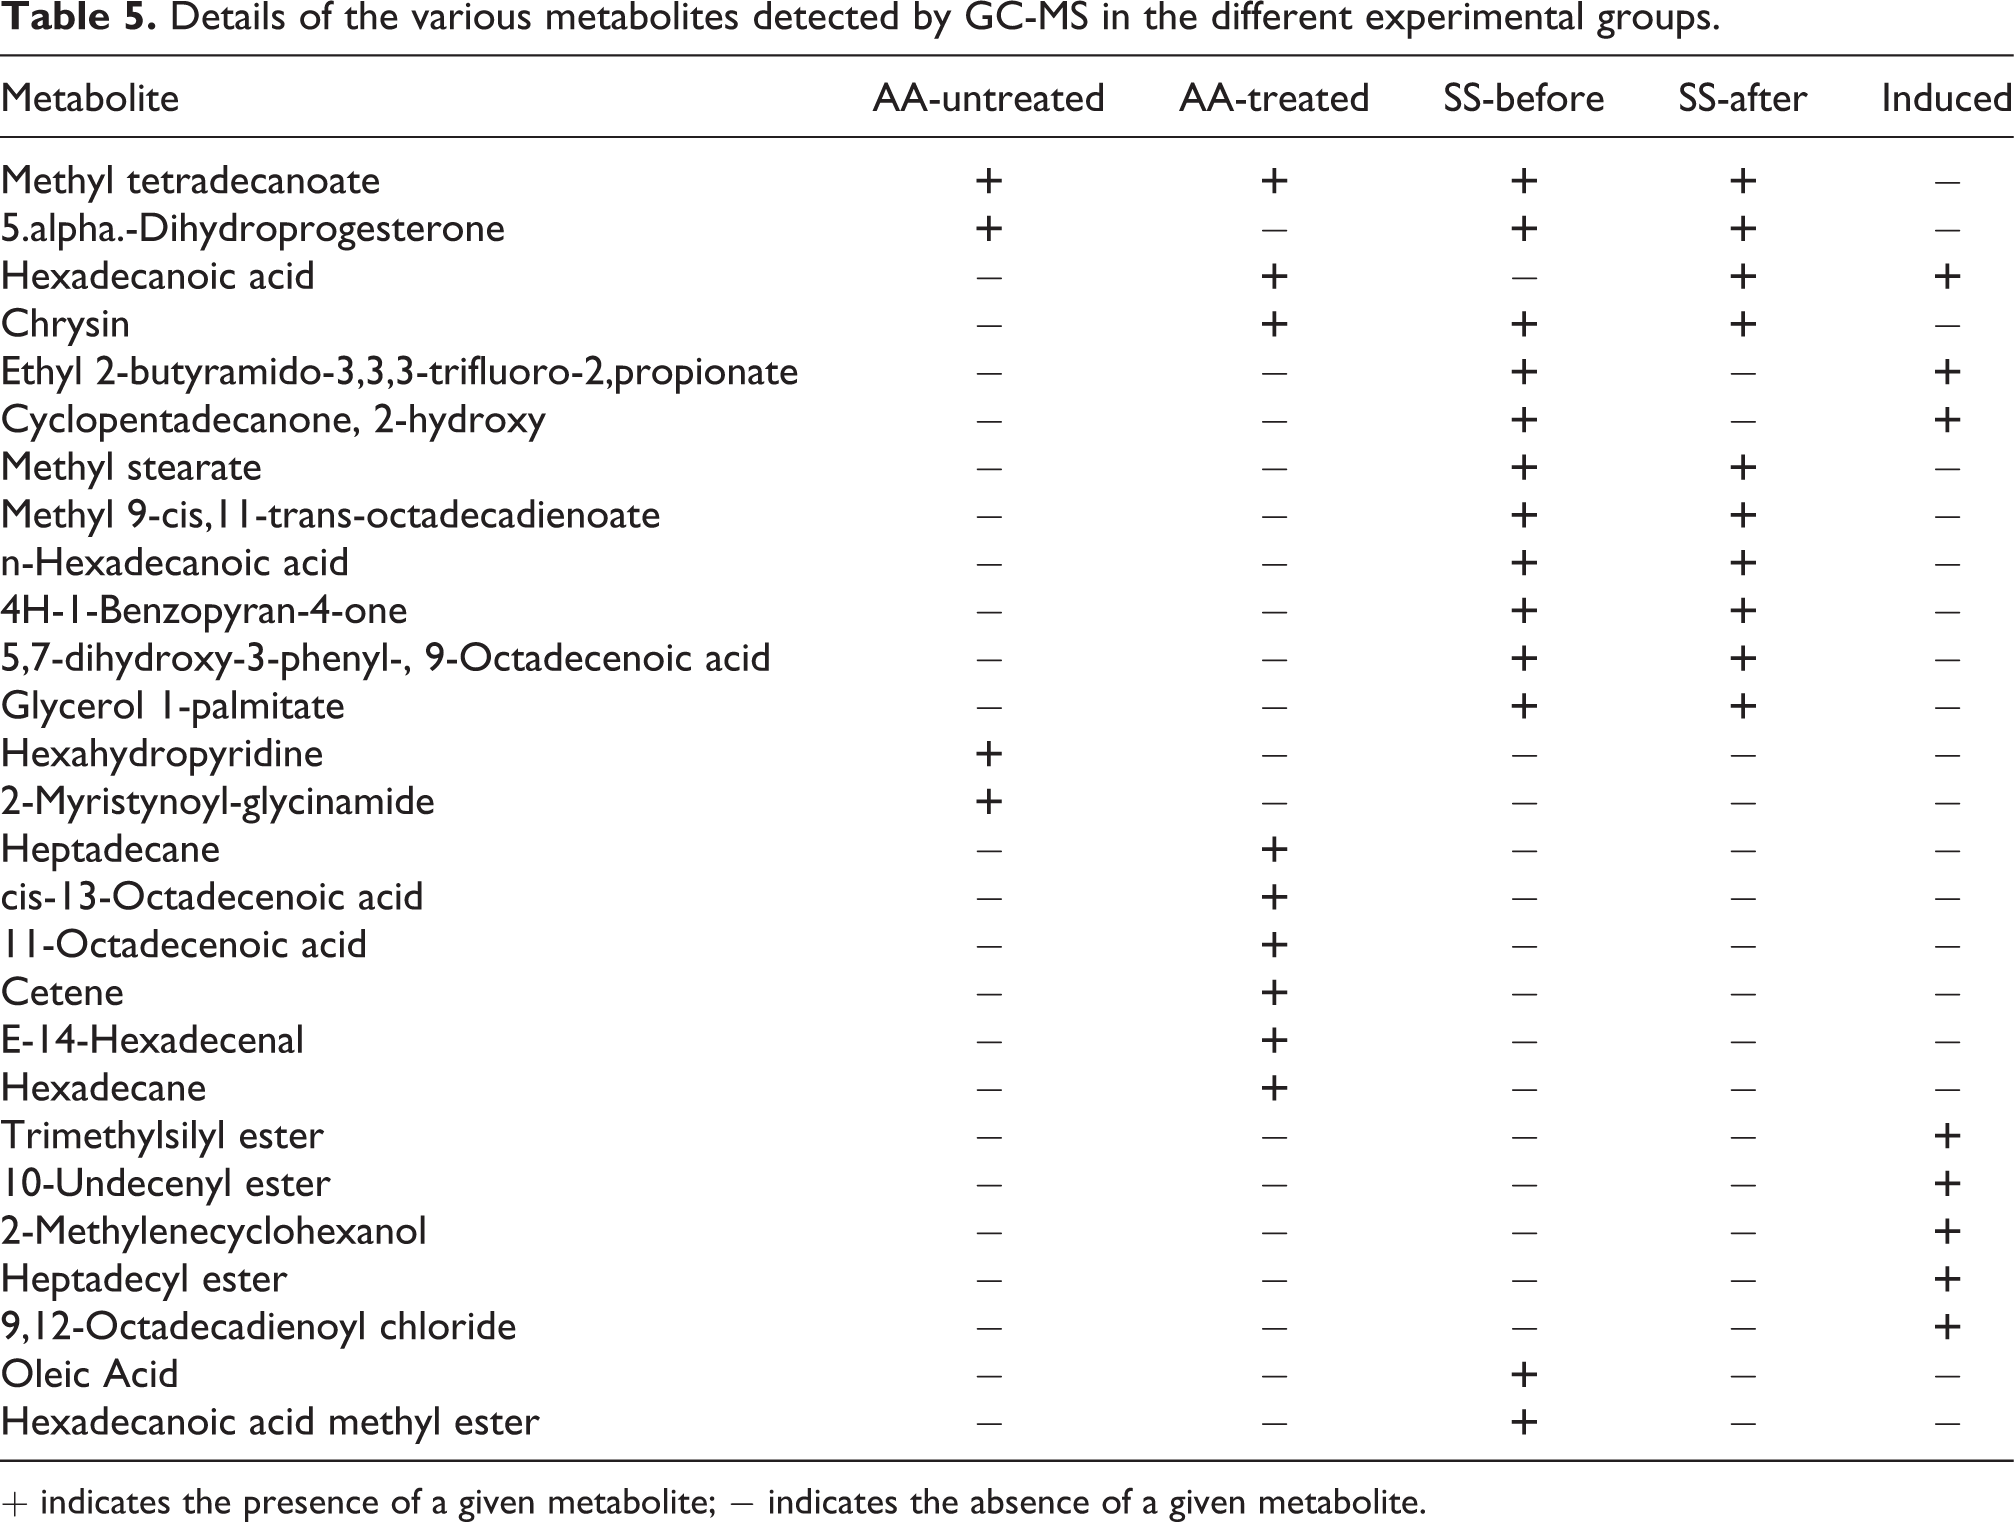
+ indicates the presence of a given metabolite; − indicates the absence of a given metabolite.
Chrysin shuts down selenocompound metabolism to improve erythrocytes integrity and function
To unveil the various compounds whose metabolisms are affected by chrysin treatment, we subjected the samples to Liquid Chromatography-Mass Spectrometry (LC-MS) analysis. Table 6 presents the various compounds identified in each of the samples analyzed. A number of metabolites have been identified in the different samples. From the results, it is notably observed that chrysin activates the biosynthesis of oxalosuccinate (an intermediate of the Krebs cycle) in sickle erythrocytes. Considering the fact that few reactions of oxalosuccinate produce NAD (a redox cofactor) which plays important roles in redox reactions and the lifespan of a cell 23 and that isoforms of TCA cycle enzymes could be found in mature erythrocytes, 24 we suggest that chrysin activates these enzymes to provide adequate energy and improve the lifespan of the sickle cells. Interestingly, we also found that the syntheses of L-cystine (an oxidized dimer of cysteine) and selenomethionine (selenomethionine and selenocysteine are cytotoxic at certain concentrations) were shut down in all the chrysin-treated samples (Table 6).
The metabolites identified by LC-MS in the experimental samples.

+ indicates the presence of a given metabolite; − indicates the absence of a given metabolite. The red box indicates the absence of L-cystine and selenomethionine in the chrysin-treated groups only.
To support the above role of chrysin in preventing selenocompound-mediated cytotoxicity, we analyzed the various pathways that are impacted in the erythrocytes due to chrysin treatment. We found out that many different pathways are impacted following chrysin treatment before/after sickling induction. Consistent with the results above, the pathway for selenocompound metabolism has zero impact in all the chrysin-treated samples (AA-treated, SS-before and SS-after) while it has an impact score of more than 0.15 in the chrysin-untreated samples (AA-untreated and Induced) (Figure 4). Taken together, these results demonstrate that chrysin blocks selenomethionine-mediated cytotoxicity to improve the RBC integrity and function.

Pathway analysis of the various erythrocyte samples in the presence/absence of chrysin treatment after LC-MS analysis.
Chrysin employs different mechanisms to prevent and reverse erythrocyte sickling
Pathway enrichment and topology analyses were performed to analyze and compare the metabolomics profiles from the various samples. The enriched pathways and their respective impact scores from the AA- and SS-genotype erythrocytes metabolomics data are shown in Figure 5. When AA-untreated metabolomics data were analyzed, a steroid hormone biosynthesis pathway was found to be significantly enriched with an impact score of 0.02 (Figure 5). In the case of AA-treated and induced (SS-untreated) samples, three enriched pathways were identified from each of the two treatments (Figure 5). Of these pathways, only fatty acid biosynthesis pathway is significantly activated (with an impact score of 0.01 each). Four pathways were identified from SS-after samples where only linoleic acid metabolism and fatty acid biosynthesis pathways were activated with impact scores of 1.00 and 0.01, respectively. Similarly, for the samples treated with chrysin before induction (SS-before), four enriched pathways were also recorded of which steroid hormone and fatty acid biosynthesis pathways were active with impact scores of 0.02 and 0.01, respectively. Fatty acid biosynthesis pathway is activated in almost all the samples including the controls. Strikingly, steroid hormone biosynthesis and linoleic acid metabolism pathways were activated in SS-before and SS-after treatments, respectively (Figure 5). Treatment of the SS erythrocytes with chrysin before induction of sickling activated the same pathway as in AA-untreated control, suggesting the efficacy of chrysin in restoring the defects of the SS erythrocytes. On the other hand, linoleic acid metabolism pathway is activated when the SS erythrocytes were treated with chrysin after induction of sickling. Collectively, these findings reveal that chrysin uses different mechanisms to prevent and reverse erythrocytes sickling, via activation of steroid hormone biosynthesis and linoleic acid metabolism pathways, respectively.

Pathway analysis reflecting the different anti-sickling mechanisms of chrysin in the experimental samples GC-MS analysis.
Discussion
The management of sickle cell anaemia in recent years has experienced remarkable progress in the area of drug invention. Drugs acting on numerous pathways of the pathophysiology of sickling such hydroxyurea, Crizanlizumab, L-Glutamine and voxelotor have been introduced but are either yet to be widely available, unaffordable or have limited acceptability, especially in our setting. Other candidate agents are still being developed, chrysin being one of them. 25 Chrysin, a 5, 7-dihydroxyflavone, was reported in honey and propolis, Passiflora caerulea, P. incarnata, O. indicum in addition to most fruits and vegetables. 26 We have evidently reported the antioxidant, anticlastogenic and DNA-protective properties of chrysin from our laboratory. 27 Chrysin has also been reported with optimal bioavailability favouring its anti-inflammatory and protein stability effects that could be advantageous to SCD-associated oxidative stress, inflammation and decreased HbS stability. 28 We have equally reported the sickling-suppressive effects without deciphering the potential mechanism behind the said effects.
We have in the present study investigated the preventive and reversal potentials of the bioactive flavone, chrysin, on erythrocyte sickling, and went further to unveil its mechanism of action. Our data reveal that 84.63% of the SS erythrocytes pretreated with chrysin retained their normal morphology after induction of sickling (Table 3) and 81.19% of sickle SS erythrocytes were reversed to their normal biconcave shapes when subjected to chrysin treatment (Table 2), demonstrating the potentials of chrysin in preventing and reversing erythrocytes sickling, respectively. Sickling in SCD patients is characterized by continuous polymerization of erythrocytes which is the resultant effect of oxidative stress due to inadequate oxygen supply. 29 Flavonoids are well-known of their antioxidant properties 30 ; as such, chrysin likely relieved these blood cells of the devastating oxidative stress resulting in the stability of their membranes. This is similar to the cancer chemopreventive effect of quercetin (another member of the flavonoid family) which confers pro-apoptotic effect in tumor cells, as well as the effects of rutin and quercetin previously reported. 31
Our findings show that the levels of oxygenated haemoglobin in the two groups were similar but significantly higher than that of SS erythrocytes that were sickling-induced but not chrysin-treated (the ‘induced’ control) (Figure 1(A)). The similar haemoglobin levels in the two treatment groups were, however, lower than those of the chrysin-treated and chrysin-untreated AA-genotyped erythrocytes (AA-Treated and AA-Untreated, respectively). The two AA groups have significantly similar haemoglobin levels, suggesting that chrysin treatment does not exert any negative consequential effect on the erythrocytes function and integrity (Figure 1(A) and (B)). However, the level of deoxygenated haemoglobin in the ‘induced’ control group was significantly higher than those of the chrysin-treated SS groups, which suggests that chrysin treatment restores the loss-of-function of the sickle erythrocytes. Put together, our data suggest that chrysin confers antisickling property through restoration of haemoglobin function. This agrees with a previous study 32 indicating that the percentage of MetHb was significantly decreased (P < 0.05) after administration of curcuminoids for 12 months, while there were no changes in Hb levels. This variation in the concentration of oxygenated and deoxygenated Hb may be credited to differences in reagents and experimental timings. Interestingly, increased oxygenated Hb concentration and improved anaemia may be caused not only by vitamins E and C treatment but also by vitamin A supplementation, since according to previous studies, vitamin A supplementation increases haemoglobin concentrations in children with poor vitamin A status.33,34
Our osmotic fragility results relate that chrysin possesses the potential to sustain the integrity of the erythrocyte membrane under sickle condition (Figure 2). These results indicate that the normal and chrysin-untreated erythrocytes (AA-untreated) were significantly more resistant to osmotic fragility than the SS-untreated (induced) ones (Figure 2). However, treatment of the SS erythrocytes with chrysin significantly reduced the osmotic fragility of the cells as compared to the untreated ones, although the haemolysis levels were still higher than those of the AA erythrocytes. As usual, there is no significant difference in the percentage fragility between the samples treated before and those treated after sickling induction. Likewise, the treated and untreated normal erythrocytes (the AA erythrocytes) did not present any significant difference (Figure 2). Based on these results, we conclude that chrysin treatment improves the membrane stability of sickle human erythrocytes. Although the exact mechanism of this function was not demonstrated in this study, our findings are contrary to some previous studies35,36 that used compounds other than chrysin, most likely due to polymerization, which subsequently leads to irreversible sickling of these cells as well as oxidative damage which compromises cell integrity and cause haemolysis. 37
In our attempt to check whether chrysin treatment could alter the level of 2,3-DPG in the sickle erythrocytes, we discovered that chrysin treatment significantly lowers the high level of 2,3-DPG produced due to sickling, irrespective of whether the chrysin is applied before or after induction of sickling. For SS-Before, SS-After, AA-Untreated, AA-Treated and Induced groups, the concentrations were observed to be 53.74 ± 0.75, 50.32 ± 0.24, 36.79 ± 0.16, 35.37 ± 0.32 and 80.47 ± 0.71, respectively (Figure 3), indicating an improvement in the oxygen affinity of haemoglobin due to chrysin treatment. This agrees with our earlier results suggesting that chrysin restores haemoglobin function in sickle erythrocytes (Figure 1). Therefore, we infer that chrysin treatment does not affect the concentration of 2,3-DPG in the normal erythrocytes. Contrariwise, a previous study reported increased concentrations of 2,3-DPG in the RBCs of insulin-dependent diabetes mellitus (IDDM) patients with elevated HbA1c, 38 although this could be attributed to the fact that these patients had no hypoxic stress as observed in the samples used for the present study. A previous study reported similar data for patients without ketoacidosis. 39 These disagreements could be related to nerve tissue degeneration observed in diabetic and SCD patients.
To further gain a clue into the molecular mechanism of chrysin function in ameliorating erythrocyte sickling, we investigated the possibility of chrysin altering some functional groups on the sickle erythrocytes during the course of restoring their lost functions (Tables 4 and 5). The samples were first subjected to fourier-transform infrared spectroscopy (FTIR) to investigate some possible changes in the hydrophobic macromolecules within the cells. The FTIR analysis revealed polar charged amines as the primary functional groups (Table 4). These polar charged functional groups may be responsible for the abnormal adherence of sickle erythrocytes to vascular endothelial cells, thus eliciting painful vaso-occlusive event. 40 The formation of hydrophobic functional groups (Table 4) following treatment with the chrysin depicts a change in the polar surface charges of the sickle erythrocytes. Thus, this implies a potential of chrysin to suppress the occurrence of the vaso-occlusive episode by attenuating abnormal adherence of sickle erythrocytes to vascular endothelial cells. 41 On the other hand, our GC-MS analysis of both the treated and untreated erythrocytes revealed the presence of some major constituents of most essential oils such as cis-13-Octadecenoic acid, Methyl tetradecanoate, cetene, hexadecane, E-14-Hexadecenal, Heptadecane, Cyclopentadecanone, 2-hydroxy, 10-undecenyl ester, 2-Methylenecyclohexanol, heptadecyl ester, 9,12-Octadecadienoyl chloride, trimethylsilyl ester and Ethyl 2-butyramido-3,3,3-trifluoro-2, propionate. Some of these identified constituents have been shown previously to possess reasonable levels of antioxidant properties.42,43 When AA-untreated metabolomics data were analyzed, a pathway was identified to be significantly enriched with relatively large impact score greater than 0.016 (Supplementary Figure S5). The pathway was found to be a steroid hormone biosynthesis activation pathway. More so, the LC-MS results indicate changes induced in the erythrocytes upon treatment with chrysin (Table 5). These findings agree with similar studies on other flavonoids like rutin and quercetin that exhibited strong affinities to deoxy-haemoglobin and 2,3-bisphophoglycerate mutase. 5 By implication, this suggests the tendency of chrysin to allosterically bind to haemoglobin with good binding affinity that may potentially alter the oxygen affinity of haemoglobin due to the inhibitory potential of chrysin to 2,3-bisphophoglycerate mutase activity (Supplementary Figure S6). Interestingly, for the first time, we have been able to demonstrate in this study that chrysin indeed possesses sickling-suppressive property corroborating other findings on the antisickling activities of some flavonoids. 5 The observed antisickling activities were found to be associated with a favourable modulation of osmotic fragility, redox homeostasis and functional chemistry of erythrocytes as clearly seen from our repetitive experiments. This is in addition to the observed decrease in the number of sickle erythrocytes upon treatment with chrysin in vitro, which was a similar observation based on other studies with rutin and quercetin. 5 To this end, the observed alterations of the functional chemistry may potentially be related to membrane stabilizing effects of chrysin in an induced versus treated erythrocytes by virtue of the fact that erythrocytes, like other cells, are composed of lipids, proteins and carbohydrates peripherally, integral and/or intracellularly. 5
Conclusion
The results of the resent study establish the potentials of the flavone compound chrysin in preventing and reversing erythrocytes sickling in addition to unveiling the underlying mechanism of the sickling-suppressive effects of the compound. Chrysin balances the difference in the levels of oxygenated and deoxygenated haemoglobin between sickle and unsickle erythrocytes via alteration of some functional groups on the sickle erythrocytes, thereby positively modulating some metabolic pathways implicated in SCD crisis. The compound therefore displays the ability to restore the functions of abnormal haemoglobins by lowering the osmotic fragility, reducing the level of 2,3-diphosphoglycerate, stimulating fatty acid alkyl monoesters production coupled with inactivation of selenocompound metabolism in human sickle erythrocytes. Comparatively, we found that chrysin does not exert any significant effects on normal human erythrocytes (AA-genotype). However, further studies are required to validate the biochemical contribution of chrysin using in vivo models.
Supplemental Material
Supplemental Material, sj-pdf-1-het-10.1177_09603271211025599 - Antisickling effect of chrysin is associated with modulation of oxygenated and deoxygenated haemoglobin via alteration of functional chemistry and metabolic pathways of human sickle erythrocytes
Supplemental Material, sj-pdf-1-het-10.1177_09603271211025599 for Antisickling effect of chrysin is associated with modulation of oxygenated and deoxygenated haemoglobin via alteration of functional chemistry and metabolic pathways of human sickle erythrocytes by HC Nwankwo, AA Idowu, A Muhammad, AD Waziri, YS Abubakar, M Bashir and OL Erukainure in Human & Experimental Toxicology
Supplemental Material
Supplemental Material, sj-pdf-2-het-10.1177_09603271211025599 - Antisickling effect of chrysin is associated with modulation of oxygenated and deoxygenated haemoglobin via alteration of functional chemistry and metabolic pathways of human sickle erythrocytes
Supplemental Material, sj-pdf-2-het-10.1177_09603271211025599 for Antisickling effect of chrysin is associated with modulation of oxygenated and deoxygenated haemoglobin via alteration of functional chemistry and metabolic pathways of human sickle erythrocytes by HC Nwankwo, AA Idowu, A Muhammad, AD Waziri, YS Abubakar, M Bashir and OL Erukainure in Human & Experimental Toxicology
Footnotes
Acknowledgements
We wish to acknowledge the supports of Biochemistry Department, Ahmadu Bello University Zaria and Haematology Department Ahmadu Bello University Teaching Hospital Zaria towards successful completion of this research project.
Authors’ contributions
Conception: A.M., A.A.I. and A.D.W.; Design: H.C.N., A.M., A.A.I. and A.D.W.; Execution: H.C.N., Y.S.A., O.L.E. and B.M.; Interpretation: H.C.N., A.M., A.A.I., A.D.W., Y.S.A. and O.L.E.; Writing and Proof reading: H.C.N., A.M., A.A.I., A.D.W., Y.S.A., O.L.E. and B.M.
Declaration of conflicting interests
The author(s) declared no potential conflicts of interest with respect to the research, authorship, and/or publication of this article.
Funding
The author(s) received no financial support for the research, authorship, and/or publication of this article.
Supplemental Material
Supplemental material for this article is available online.
References
Supplementary Material
Please find the following supplemental material available below.
For Open Access articles published under a Creative Commons License, all supplemental material carries the same license as the article it is associated with.
For non-Open Access articles published, all supplemental material carries a non-exclusive license, and permission requests for re-use of supplemental material or any part of supplemental material shall be sent directly to the copyright owner as specified in the copyright notice associated with the article.