
Abstract
Disorders of the endoplasmic reticulum (ER) lead to cellular damage but can cause cell death if ER dysfunction is prolonged. We aimed to examine liver/kidney functions, neutral sphingomyelinase (N-SMase) activity, sphingolipid levels, cytosolic phospholipase A2 (cPLA2) and cyclooxygenase-2 (COX-2) protein expression in rats under ER stress. ER stress was induced by tunicamycin (TM) and the ER stress inhibitor taurodeoxycholic acid (TUDCA) was injected before induction of ER stress. ER stress was confirmed by increased tissue levels of GRP78. Hematological and biochemical profiles were measured by autoanalyzers while hepatic and renal injury was evaluated via microscopy and histopathological scoring. Tissue levels of C16-C24 sphingomyelins (SM), C16-C24 ceramides (CERs) and sphingosine-1-phosphate (S1P) were determined by LC-MS/MS. Tissue cPLA2 and COX-2 were measured by western blot and activity assays. Tunicamycin treatment caused kidney and liver function test abnormalities, increased hematocrit and hemoglobin levels but decreased white blood cell counts. Histopathological findings showed hepatic necroinflammation and renal tubular damage in rats treated with TM. TUDCA administration attenuated WBC abnormalities and TM- induced hepatic/renal functional impairment in ER stress, as evident by significantly restored serum ALT, AST, creatinine, and total bilirubin levels. A significant increase was observed in N-SMase activity, tissue levels of C16-C24 CERs, cPLA2 and COX-2 expression in liver and kidney tissue under ER stress. TUDCA administration decreased tissue CER levels, cPLA2 and COX-2 expression as well as prostaglandin E2 (PGE2) formation. These results signify that ER stress causes hepatic and renal toxicity as well as CER-induced PGE2 formation in liver and kidney.
Introduction
The ER plays a vital role in protein synthesis, cellular trafficking, lipid metabolism and in maintaining calcium homeostasis. Pathological injuries obliterate ER homeostasis and lead to ER stress, which activates the unfolded protein response (UPR). 1 The UPR consists of intracellular signaling pathways and functions to support cell survival. However, extended UPR causes cellular damage and apoptosis.
It is becoming progressively more evident that ER stress leads to pathological conditions well beyond those directly implicated in protein folding, by mechanisms that fall outside UPR signaling. 1 These pathways change from one tissue type to another, meaning that ER stress signaling affects each tissue in a unique way. The liver is an extremely secretory tissue and regulates peripheral metabolism. Thus, it is a good model for understanding how ER stress is connected with physiological processes that take place outside the ER, and how ER stress plays a role in many systemic diseases that involve liver dysfunction. ER stress is reported to contribute to liver diseases such as nonalcoholic/alcoholic fatty liver and hepatic fibrosis. 2 The role of ER stress in these liver diseases differs according to the cause and progression of the disease. The complexity of how ER stress impacts on hepatocyte injury, and the role of ER stress in hepatic steatosis and fibrosis needs to be further clarified.
Recent studies have also shown that ER stress is implicated in the initiation of numerous kidney diseases such as renal fibrosis, diabetic nephropathy, inflammation-induced kidney injury, renal ischemia-reperfusion and proteinuria. 3 Chemical chaperones, such as taurodeoxycholic acid (TUDCA), alleviate the symptoms, signifying that ER stress-induced injury of kidney cells plays a major role in the above-mentioned kidney diseases. 3
The buildup of lipids and their intermediate metabolites under ER stress initiates metabolic malfunction, termed lipotoxicity, in peripheral organs such as liver and kidney. 4 Sphingolipids are a class of metabolically distinct lipids that play structural and signaling functions in these organs. Sphingolipid metabolism is deregulated during various hepatic and renal diseases that involve ER stress such as fatty liver disease 5 and chronic kidney diseases. 6 ER stress inhibits liver fatty acid oxidation and leads to both liver and kidney steatosis. 7 Studies have also demonstrated that sphingosine kinase-2 is transcriptionally up-regulated by acute ER stress. 8
Sphingolipid intermediates, such as ceramide, can be toxic when they accumulate in cellular membranes. They change membrane structure and organization and they also act as potent signaling molecules. 9 Two major pathways are involved in CER generation, the de novo pathway and the sphingomyelinase pathway. The mechanisms of activation of these two pathways in liver and kidney ER stress and the pathological processes impacted by the resulting CER overproduction are unknown. We combined sphingomyelinase assay and lipidomics to understand the basis of ER stress-dependent sphingolipid accumulation in liver and kidney. Hematological and biochemical profiles were also measured by autoanalyzer while hepatic and renal injury was evaluated via microscopy and histopathological scoring. The link between ER stress induced lipotoxocity and inflammation was also assessed by determining cPLA2, COX-2 protein expressions and PGE2 formation.
Materials and methods
Animals
All experimental protocols conducted on male rats were performed in accordance with the standards established by the Institutional Animal Care and Use Committee at Akdeniz University. Male Wistar rats, aged 4 months, weighing 350–450 g were housed in stainless steel cages and given food and water ad libitum. Animals were maintained at 12 h light-dark cycles and a constant temperature of 23 ± 1 °C at all times. Rats were randomly divided into control (n = 10), TUDCA treated (n = 10), TM treated (n = 10) and TM + TUDCA treated (n = 10) groups. ER stress was induced by intraperitoneal (i.p.) injection of 1 µg/g body weight TM (Cayman Chemical, Ann Arbor, MI, USA) as previously described. 10 Tunicamycin was prepared in dimethyl sulfoxide (DMSO; Calbiochem, EMD Bioscience Inc. La Jolla, CA, USA) at a concentration of 50 mM. The ER stress inhibitor TUDCA (EMD Millipore Corp. Billerica, MA USA) was dissolved in saline and injected i.p. at a dose of 250 mg/kg body weight 30 minutes before induction of ER stress, as previously described. 10 Control group animals received an equal volume of i.p. DMSO and saline. Male rats were anesthetized intraperitoneally with a mixture of ketamine and 2 % xylazine hydrochloride (0.02 mg/kg) before blood and tissues were collected. Euthanasia was performed via exsanguination, blood samples were collected before liver and kidney dissections. Liver and kidney tissues were harvested 24 h post-TM treatment as previously described. 11
Induction of ER stress
Glucose-regulated protein 78 (GRP78) was measured in liver and kidney tissue samples by an enzyme immunoassay test kit (Abcam, Cat No: ab210604 Cambridge, MA) according to manufacturer’s instructions. Liver and kidney tissues were weighed and homogenized in 1X wash buffer supplied with the test kit containing 0.1 mM phenylmethylsulfonyl fluoride (Sigma- Aldrich, Steinheim, Germany), 1 µg/ml leupeptin (Sigma-Aldrich, Steinheim, Germany) and 1 µg/ml aprotinin (Sigma-Aldrich, Steinheim, Germany). Homogenates were centrifuged at 21,000 g for 10 min at 4°C and supernatants were stored at -80°C until analyzed. A standard curve of absorbance values of known rat GRP78 standards was plotted against standard concentrations (ng/ml) using the GraphPad Prism Software program for windows version 5.03 (GraphPad Software Inc). GRP78 amount in the samples were calculated from their corresponding absorbance values via the standard curve and expressed as ng/mg tissue protein. Tissue protein concentrations were measured at 595 nm by a modified Bradford assay using Coomassie Plus reagent with bovine serum albumin as a standard (Pierce, Thermo Fisher Scientific, Roskilde, Denmark).
Laboratory evaluation of hematology and serum biochemistry
For biochemical analyses, 2 mL blood samples were collected into tubes without an anticoagulant and centrifuged at 3000 rpm for 10 minutes at room temperature to obtain serum. Aspartate aminotransferase (AST), alanine aminotransferase (ALT), albumin (ALB), total bilirubin (TBIL), creatinine (CRE) and serum urea nitrogen were assayed using Fujifilm kits and analyzed on Fujifilm DRI-CHEM NX500 (FUJIFILM Co., Tokyo, Japan). For hematology analyses, 0.5 mL of blood samples were placed into tubes containing EDTA (Greiner Bio-One GmbH, Kremsmünster, Austria) and white blood cell (WBC), differential leukocyte count, red blood cell (RBC), hemoglobin (HGB), hematocrit (HCT), mean corpuscular volume (MCV), mean corpuscular hemoglobin (MCH), mean corpuscular hemoglobin concentration (MCHC), red cell distribution width (RDW), platelets (PLT), mean platelet volume (MPV), platelet distribution width (PDW), plateletcrit (PCT) were measured with Mindray BC-2800 Auto Hematology Analyzer (Shenzhen, P.R. China).
Liver and kidney histopathological evaluation
Livers and kidneys were fixed in 10% neutral buffered formalin solutions for 24 h. Standard histopathological techniques were used for tissue processing and preparation of paraffin blocks. Sections of 5 µm were obtained with a standard microtome and mounted on slides. Standard laboratory protocols were carried out for Hematoxylin-eosin (H&E) staining. All stained tissue sections were visualized via light microscopy (Olympus IX81, Tokyo, Japan). The sections were examined by two pathologists without knowledge of the experimental groups. Necroinflammation in liver sections were evaluated by using the Ishak-modified hepatic activity index (HAI) as previously. 10 Total necroinflammation scores were calculated as the sum of the 4 categories: interface hepatitis (0–4), portal inflammation (0–4), confluent necrosis (0–6) and lytic necrosis. Renal tubular injury score was calculated for each tissue specimen as previously. 12 Tubular injury was defined as tubular dilation, tubular atrophy, vacuolization, the degeneration and sloughing of tubular epithelial cells, or thickening of the tubular basement membrane. Only cortical tubules were used in the scoring system, where 0 = no tubular injury; 1 = < 10% of tubules injured; 2 = 10%–25% of tubules injured; 3 = 26%–50% of tubules injured; 4 = 51%–75% of tubules injured; and 5 = > 75% of tubules injured.
Measurement of neutral sphingomyelinase activity
Neutral-SMase activity was measured in liver and kidney tissue via a sphingomyelinase assay kit (Biovision, Catalog # K599-100, Milpitas, CA) according to manufacturer’s instructions. Liver and kidney tissue were homogenized in PBS buffer containing 0.1 mM phenylmethylsulfonyl fluoride (Sigma- Aldrich, Steinheim, Germany), 1 µg/ml leupeptin (Sigma-Aldrich, Steinheim, Germany) and 1 µg/ml aprotinin (Sigma-Aldrich, Steinheim, Germany). Homogenates were centrifuged at 21,000 g for 20 min at 4°C and supernatants were stored at -80°C until analyzed. A standard curve of absorbance values of known amounts of choline standards was generated. 1 unit of sphingomyelinase activity was defined as the amount of enzyme that caused the formation of 1 µmol of choline per minute at 37°C. Sphingomyelinase activity in the samples (nmol/min/ml) was calculated from their corresponding absorbance values via the standard curve and expressed as mU/mg tissue protein.
Measurement of sphingomyelins and ceramides
Liver and kidney samples were weighed and homogenized in ice cold 50 mmol/L sodium phosphate buffer at pH 7.4. Homogenates were centrifuged (10,000 g for 15 min at 4 °C) and supernatants were stored at −80°C until lipid extraction. Lipid extraction from liver and kidney tissue was done as previously described. 13 Sphingomyelins and CERs were measured in tissue extract by an optimized multiple reaction monitoring (MRM) method using ultrafast-liquid chromatography (UFLC) coupled with MS/MS as previously described. 14,15
Measurement of ceramide-1-phosphate levels
Ceramide-1-phosphate levels were measured in liver and kidney tissue via a rat C1P ELISA kit (MyBioSource, Catalog # MBS2601513, CA, USA) according to manufacturer’s instructions. Liver and kidney tissue were homogenized in PBS buffer and centrifuged at 3000 rpm for 10 min at 4°C. Supernatants were stored at -80°C until analyzed. A standard curve of absorbance values of known C1P standards was plotted as a function of C1P standard concentrations using the GraphPad Prism Software program for windows version 5.03. (GraphPad Software Inc.). The amount of C1P (ng/ml) in the samples were calculated from their corresponding absorbance values via the standard curve and expressed as ng/mg tissue protein.
Western blot analysis
Liver and kidney tissue were homogenized in PBS buffer containing 0.1 mM phenylmethylsulfonyl fluoride (Sigma- Aldrich, Steinheim, Germany), 1 µg/ml leupeptin (Sigma-Aldrich, Steinheim, Germany) and 1 µg/ml aprotinin (Sigma-Aldrich, Steinheim, Germany). Homogenates were centrifuged at 21,000 g for 20 min at 4°C and supernatants were stored at −80°C until analyzed. Proteins were denatured at 100°C in sample buffer (# 161-0737, BioRad Laboratories Inc. USA) and seperated on 12 % mini-protean TGX precast electrophoresis gels (BioRad Laboratories Inc. USA). Resolved proteins were transferrred to nitrocellulose membranes and incubated with rabbit polyclonal primary antibodies to the proteins of interest. Primary antibody incubations were for 1 hour at room temperature with either rabbit polyclonal anti-cPLA2 antibody (1:500, #ab58375 Abcam, Cambridge, MA, USA); Rabbit polyclonal to COX2 antibody (1:500 #ab52237 Abcam, Cambridge, MA, USA); and actin (1:1000, #AANO1, Cytoskeleton Inc. Denver, CO, USA). Horseradish peroxidase–conjugated goat anti-rabbit IgG (1:10,000 dilution; Zymed Laboratories, San Francisco, CA) was used as a secondary antibody, and immunoreactive proteins were visualized by chemiluminescence via ECL reagent (Amersham Pharmacia Biotech, Buckinghamshire, UK). All Western blots were quantified by densitometric analysis using NIH ImageJ 1.44p software.
Measurement of cytosolic phospholipase A2
Activity of cPLA2 was measured via a PLA2 assay kit (Abcam, Cat No: ab133090, Cambridge, MA, USA) according to manufacturer’s instructions. Liver and kidney tissue were homogenized in ice-cold 50 mmol/L sodium phosphate buffer (pH 7.4) containing 1 mM EDTA. Homogenates were centrifuged (10,000 g for 15 min at 4°C) and supernatants were stored at −80°C. Before performing the assay, low molecular weight contaminants were removed from the samples using an ultrafiltration unit via centrifugation through a 10-kDa molecular mass cut-off filter (Amicon, Millipore Corporation, Bedford, MA, USA) for 30 minutes at 25°C. Samples were reconstituted with 50 mmol/L sodium phosphate buffer (pH 7.4) containing 1 mM EDTA. Arachidonoyl thio-PC synthetic substrate was used to detect PLA2 activity. Hydrolysis of the arachidonoyl thioester bond releases a free thiol which was detected by 5,5’-dithiobis-(2-nitrobenzoic acid (DTNB). One unit of enzyme activity was defined as the amount of enzyme that hydrolyzes 1 μmol of arachidonoyl thio-PC per minute at 25°C.
Measurement of cyclooxygenase activity
Cyclooxygenase activity was measured using a fluorescent activity assay kit (Cayman Chemical Cat No: 700200, Cat Ann Arbor, MI, USA) according to manufacturer’s instructions. Liver and kidney tissue were homogenized in 0.1 M ice-cold Tris-HCl buffer (pH 7.5) containing 0.1 mM phenylmethylsulfonyl fluoride (Sigma- Aldrich, Steinheim, Germany), 1 µg/ml leupeptin (Sigma-Aldrich, Steinheim, Germany) and 1 µg/ml aprotinin (Sigma-Aldrich, Steinheim, Germany).Tissue homogenates were centrifuged at 10,000 g for 15 minutes at 4°C and supernatants were kept at −80°C until assayed. The COX activity assay kit measures enzyme activity fluoremetrically by monitoring the appearance of resorufin at an excitation and emission wavelenght of 530 and 585 nm, respectively. One unit of enzyme activity was defined as the amount of enzyme that caused the formation of 1 nmol of fluorophore per minute at 22°C.
Measurement of prostaglandin E2
Quantitative determination of PGE2 in liver and kidney tissue was done by an enzyme immunoassay test kit (Cayman Chemical, Cat No: 514010 Ann Arbor, MI, USA) according to manufacturer’s instruction. Liver and kidney tissue were homogenized in 0.1 M phosphate buffer, pH 7.4, containing 1 mM EDTA and 10 µM indomethacin. Tissue homogenates were centrifuged at 8,000 g for 10 minutes at 4°C and supernatants were kept at -80°C until assayed. A standard curve of absorbance values of known PGE2 standards was plotted as a function of the logarithm of PGE2 standard concentrations (pg/ml) using the GraphPad Prism Software program for windows version 5.03. (GraphPad Software Inc). PGE2 concentrations in the samples were calculated from their corresponding absorbance values via the standard curve and expressed as pg/mg tissue protein.
Protein measurements
Protein concentrations were measured at 595 nm by a modified Bradford assay using Coomassie Plus reagent with bovine serum albumin as a standard (Pierce Chemical Company, Rockford, IL).
Statistical analysis
Statistical analysis was performed using SigmaStat statistical software version 3.5 (Sigma, St. Louis, MO, USA). Statistical analysis for each measurement is described in figure and table legends. To compare the groups via the SigmaStat statistical sofware, we first performed a normality test. A test that passed indicated that the data matched the pattern expected if the data was drawn from a population with a normal distribution. If the sample data were not normally distributed, the normality test failed. In such case the software performed a nonparametric test. The experimental groups were compared by either One Way ANOVA (analysis of variance) or by Kruskal-Wallis One Way ANOVA on Ranks. When there was a statistically significant difference, we used multiple comparison procedures also known as pos-hoc tests to determine exactly which groups were different.
Results
Induction of ER stress and histopathological evaluation
The presence of ER stress in liver and kidney tissue was confirmed by increased intracellular levels of GRP78 (Figure 1A). Treatment with the ER stress inhibitor TUDCA significantly decreased the expression of GRP78 in both liver and kidney compared to TM groups. Figure 1B and 1C shows H&E stained liver and kidney sections, respectively. Hepatic photomicrographs of representative rat from each group are shown in Figure 1B. Necroinflammation scores of liver injury are given in Table 1. Tunicamycin treatment resulted in significant portal inflammation in rat livers. Male rats treated with TM +TUDCA showed a decrease in hepatic necroinflammation score and no significant difference was found among control, TUDCA and TM + TUDCA groups. Figure 1C shows kidney sections from representative male rats from the four different groups. Histopathological scoring based on H&E staining is depicted in Figure 1D. Tunicamycin treatment significantly caused tubular injury, defined as vacuolization, tubular atrophy, tubular dilation, the deterioration and sloughing of tubular epithelial cells or thickening of the tubular basement membrane. Male rats treated with TM +TUDCA showed improved tubular morphology compared to male rats treated with only TM and no significant difference was found among control, TUDCA and TM + TUDCA groups.

Modified hepatic activity index: necroinflammation scores.

Data are reported as
**, p < 0.05 vs. control. Statistical analysis was performed by Kruskal-Wallis One Way Analysis of Variance on Ranks with all pairwise multiple comparison procedures by Tukey test.
*, p < 0.001 vs. control. Statistical analysis was performed by One Way Analysis of Variance with all pairwise multiple comparison procedures by Tukey test.
#, p < 0.027 vs. TUDCA. Statistical analysis was performed by One Way Analysis of Variance with all pairwise multiple comparison procedures by Tukey test.
Laboratory values in experimental groups
A summary of serum biochemistry results is given in Table 2. Tunicamycin treatment associated irregularities included significant hypoalbuminemia as well as significant increase in TBIL, ALT and AST compared to control and TUDCA treated groups. The increase in TBIL, ALT and AST were not as high in TM + TUDCA treated male rats and no significant difference was observed when compared to control and TUDCA groups. These data are indicative for necroinflammation induced-TM liver injury which was lessened by TUDCA treatment. Serum CRE were also significantly increased in TM treated group compared to control, TUDCA and TM+TUDCA groups, which may be related to kidney injury. An increase in BUN levels could as be observed in TM treated groups which was significantly greater compared to control and TUDCA groups. Blood urea nitrogen was alleviated in TM+TUDCA treated male rats.
Laboratory values in experimental groups.

Values are mean ± SD. TUDCA, tauroursodeoxycholic acid treated; TM, tunicamycin treated; ALT, alanine aminotransferase; AST, aspartate aminotransferase; ALB, albumin; TBIL, total bilirubin; CRE, creatinine; BUN, blood urea nitrogen.
a, p < 0.05 vs. control and TUDCA. Statistical analysis was done by Kruskal-Wallis One Way Analysis of Variance on Ranks with Multiple Comparisons by Tukey Test.
b, p < 0.05 vs. control, TUDCA and TM + TUDCA. Statistical analysis was done by Kruskal-Wallis One Way Analysis of Variance on Ranks with Multiple Comparisons by Tukey Test.
Hematological parameters in experimental groups
Red blood cell, HGB and HCT levels were significantly increased in TM, TUDCA and TM +TUDCA treated groups compared to the control group. Tunicamycin significantly decreased WBC, lymphocyte and monocyte counts compared to the control group (Table 3). TUDCA administration in TM treated groups increased WBC counts and no significant difference was observed between control, TUDCA and TM+TUDCA groups. TUDCA treatment increased lymphocyte, monocyte and granulocyte levels in TM treated male rats.
Hematological parameters in experimental groups.
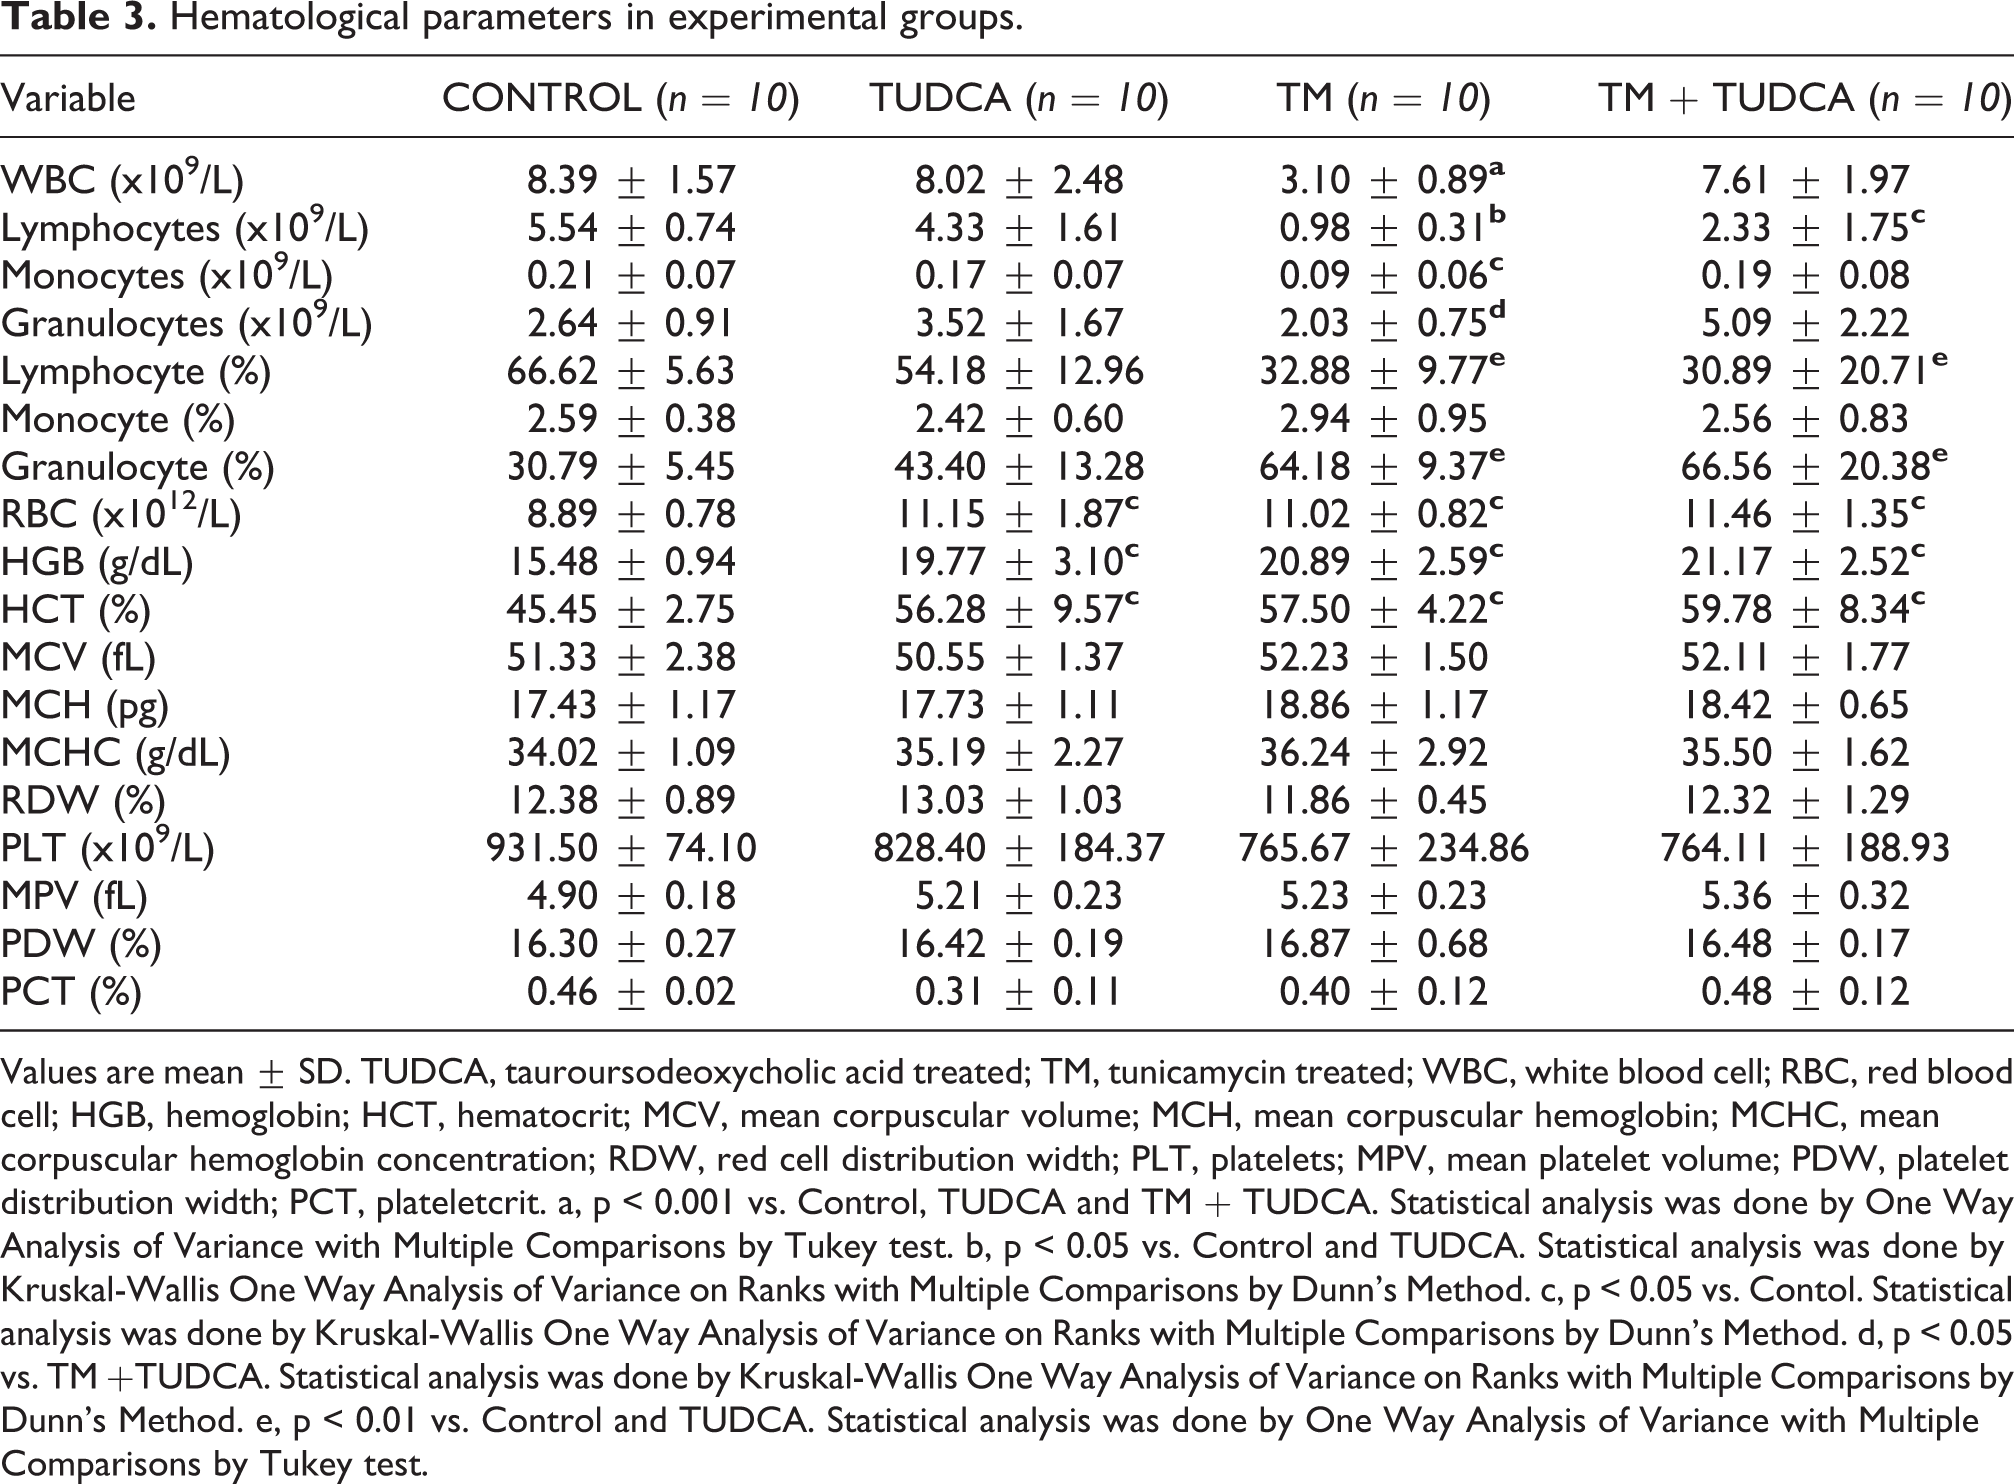
Values are mean ± SD. TUDCA, tauroursodeoxycholic acid treated; TM, tunicamycin treated; WBC, white blood cell; RBC, red blood cell; HGB, hemoglobin; HCT, hematocrit; MCV, mean corpuscular volume; MCH, mean corpuscular hemoglobin; MCHC, mean corpuscular hemoglobin concentration; RDW, red cell distribution width; PLT, platelets; MPV, mean platelet volume; PDW, platelet distribution width; PCT, plateletcrit. a, p < 0.001 vs. Control, TUDCA and TM + TUDCA. Statistical analysis was done by One Way Analysis of Variance with Multiple Comparisons by Tukey test. b, p < 0.05 vs. Control and TUDCA. Statistical analysis was done by Kruskal-Wallis One Way Analysis of Variance on Ranks with Multiple Comparisons by Dunn’s Method. c, p < 0.05 vs. Contol. Statistical analysis was done by Kruskal-Wallis One Way Analysis of Variance on Ranks with Multiple Comparisons by Dunn’s Method. d, p < 0.05 vs. TM +TUDCA. Statistical analysis was done by Kruskal-Wallis One Way Analysis of Variance on Ranks with Multiple Comparisons by Dunn’s Method. e, p < 0.01 vs. Control and TUDCA. Statistical analysis was done by One Way Analysis of Variance with Multiple Comparisons by Tukey test.
Neutral sphingomyelinase activity and sphingolipid levels in liver and kidney
Neutral sphingomyelinase activity in liver and kidney was significantly increased in both the liver and kidney of TM treated groups compared to control, TUDCA and TM + TUDCA (Table 4). TUDCA administration in TM treated groups decreased N-SMase activity and no significant difference was observed between control, TUDCA and TM + TUDCA groups. Tissue SM levels, S1P and C1P levels measured in both liver and kidney showed no significant difference among the experimental groups (Table 4). Liver and kidney levels of CERs were significantly increased in TM treated groups compared to control, TUDCA and TM + TUDCA (Table 4). TUDCA administration in TM treated groups decreased CER levels and no significant difference was observed between control, TUDCA and TM+TUDCA groups.
Neutral sphingomyelinase activity and sphingolipid levels in liver and kidney.

All values are mean ± SD. SM, sphingomyelin; S1P, sphingosine-1-phosphate; C1P, ceramide-1- phosphate; N-SMase, neutral sphingomyelinase; TUDCA, tauroursodeoxycholic acid treated; TM, tunicamycin treated. Statistical analysis was by One Way Analysis of Variance and all pairwise multiple comparison procedures were done by Tukey test.
*, p < 0.001 vs. control, TUDCA and TM + TUDCA.
Cytosolic phospholipase A2, cyclooxygenase and prostaglandin E2 levels
Tunicamycin treatment significantly increased cPLA2 activity and protein levels in liver and kidney tissues compared to control, TUDCA and TM + TUDCA groups (Figure 2A, 2B, 2C and 2E). Measured liver enzyme activity (mean ± SD) in control, TUDCA, TM and TM + TUDCA groups were 0.63 ± 0.17; 0.83 ± 0.31; 1.60 ± 0.81 and 0.78 ± 0.24 nmol/min/mg protein, respectively (Figure 2E). Measured kidney enzyme activity (mean ± SD) in control, TUDCA, TM and TM + TUDCA groups were 1.16 ± 0.15; 1,09 ± 0.30; 2.40 ± 0.23 and 1.07 ± 0.26 nmol/min/mg protein, respectively (Figure 2E). TUDCA administration in TM treated groups decreased both protein levels and activity of cPLA2 and no significant difference was observed between control, TUDCA and TM+TUDCA groups.

Representative western immunoblots for cytosolic phospholipase A2 (cPLA2), and cyclooxygenase 2 (COX-2) in
Total COX activity and COX-2 protein levels were significantly increased in liver and kidney tissues treated with TM compared to control, TUDCA and TM + TUDCA groups (Figure 2A, 2B, 2D and 2F). Measured liver enzyme activity (mean ± SD) in control, TUDCA, TM and TM + TUDCA groups were 0.43 ± 0.16; 0.32 ± 0.10; 0.76 ± 0.10 and 0.37 ± 0.15 nmol/min/mg protein, respectively (Figure 2F). Measured kidney enzyme activity (mean ± SD) in control, TUDCA, TM and TM + TUDCA groups were 0.43 ± 0.22; 0.47 ± 0.20; 1.32 ± 0.39 and 0.55 ± 0.19 nmol/min/mg protein, respectively (Figure 2F). TUDCA administration in TM treated groups decreased both protein levels and activity COX and no significant difference was observed between control, TUDCA and TM+TUDCA groups.
PGE2 levels (mean ± SD) were also significantly increased in liver and kidney tissues treated with TM compared to control, TUDCA and TM + TUDCA groups (Figure 2G). Measured liver PGE2 levels in control, TUDCA, TM and TM + TUDCA groups were 17.56 ± 2.90; 17.89 ± 2.16; 27.66 ± 5.79 and 18.44 ± 2.11 pg/mg protein, respectively. Measured kidney PGE2 levels in control, TUDCA, TM and TM + TUDCA groups were 33.55 ± 6.45; 33.87 ± 10.72; 68.26 ± 14.57 and 31.31 ± 9.63 pg/mg protein, respectively. TUDCA administration in TM treated groups decreased PGE2 levels in both the liver and kidney and no significant difference was observed between control, TUDCA and TM+TUDCA groups.
Discussion
To the best of our knowledge, this study makes the novel observation that a significant increase occurs in N-SMase activity, tissue levels of C16-C24 CERs, cPLA2 and COX-2 expression in liver and kidney tissues under ER stress.
Correct modeling of ER stress in vivo is essential for understanding the outcome and pathology of liver and kidney diseases in which ER stress has been implicated. In our study, male rats were administered TM to create acute ER stress 11 and the ER stress inhibitor TUDCA was injected in advance to suppress the resulting ER stress. 16 Tunicamycin disrupts protein glycosylation and creates ER stress. The TM dose selected in the experimental model used was based on the doses used to study ER stress in animal models. 10,17 Three major proteins have been identified in the sensing of ER stress. These include inositol-requiring protein 1 (IRE1), protein kinase R-like endoplasmic reticulum kinase (PERK) and activating transcription factor 6 (ATF6). 18 Under normal physiological conditions these sensors are bound to GRP78 present in the ER lumen. When unfolded proteins are produced, GRP-78 is sequestered away from PERK and binds to unfolded proteins, thereby challenging to maintain homeostasis in the ER. We have observed that TM increased GRP78 protein levels, the known biomarker of ER stress. Pretreatment with TUDCA significantly reduced levels of GRP78 protein in both liver and kidney tissues. TUDCA is an effective chemical chaperone used in the treatment of ER stress-related diseases. 19 It is a hydrophilic bile acid also used in the treatment of patients with cholestatic liver diseases. 20 TUDCA is reported to inhibit both the formation and binding of activated transcription factors to the GRP78 promotor limiting transcriptional activation. 19 TUDCA can avert UPR dysfunction by improving protein folding capacity via the activation of transcription factor 6 and by assisting in the folding of mutant proteins. 16
Results herein showed that TM caused hepatic injury. These results are in concert with studies showing the hepatotoxic effect of TM. 21,22 Tunicamycin causes acute hepatic damage after being injected. This effect is observed up to 72 hours after injection. In previous studies, hepatocellular damage has been observed in periportal regions and many hepatocyte deaths have been reported. Similarly, we observed portal inflammation, confluent and lytic necrosis in male rats given TM. Tunicamycin also generated liver irregularities revealed as significant hypoalbuminemia, significantly increased TBIL, ALT and AST. Mechanism of TM-induced liver injury remains to be clarified. Inflammasome activation is held responsible for the tissue damage caused by TM. 23 Tunicamycin-dependent hepatic ROS formation has also been reported. The increase in NADPH oxidase activity is held responsible for oxidant formation. 24 Our results show a partial protection of TUDCA against hepatic damage induced by TM toxicity. TUDCA decreased ALT and AST levels and normalized TBIL levels.
Thorough pathological investigation showed cortical extension, vacuolation and swelling in proximal tubules of male rats treated with TM. Histopathological grading based on H&E staining confirmed TM-induced renal damage. TUDCA therapy in TM treated male rats improved tubular injury. However, the histopathological score of kidney injury was still increased in the TM + TUDCA group. Decrease in renal function was manifested by increased BUN and CRE levels. TUDCA reversed the observed increase in both BUN and CRE levels, indicating partial restoration of kidney damage. Tunicamycin causes acute kidney injury (AKI) in rodents. 25 It was shown that the presence of ER stress markers in renal biopsies correlates with the severity of AKI. 26
Tunicamycin and/or TUDCA treatment increased RBC, HGB and HCT levels but TM treatment alone decreased WBC counts. Tunicamycin was previously reported to cause a 2,5 to 4-fold increase in erythropoietin (EPO) binding, 27 which is expected to cause an increase in RBC, HGB and HCT levels, 28 as observed. This increase in EPO binding is likely caused by decreased EPO receptor-N-glycosylation due to TM treatment. It is known that decreased N-glycosylation of EPO-receptor by TM treatment causes ligand saturation. 29 TUDCA was also previously reported to increase immature erythroid cell number 30 which may lead to increased RBC, HGB and HCT levels as observed in male rats treated with TUDCA. Decreased WBC numbers in TM treated male rats could be related to altered protein N-glycosylation. It is known that N-glycosylation plays an important role in lymphocyte differentiation and in the development of immune-mediated inflammatory diseases. 31 We suggest that the changes in the glycosylation profile my promote a decrease in WBC numbers in TM treated animals. TUDCA is known to maintain lymphocyte homeostasis by significantly reducing lymphocyte apoptosis 32 and this may be the mechanism by which it resulted in relatively stable WBC counts as observed herein.
Renal and hepatic tissue levels of C22–C24 CERs were significantly increased in TM treated male rats. Our results support previous studies that have shown a buildup of CER during ER stress. 33 To our knowledge, this is the first study to report increased CER levels in a rat model of ER stress created by TM treatment. Exogenous CER causes inhibition of sarcoplasmic/endoplasmic reticulum Ca2+- ATPase (SERCA) ensuing [Ca2+] depletion in the ER. 34 This consequence of CER is comparable to thapsigargin, a classic inducer of ER stress. 11 Thapsigargin specifically inhibits SERCA, causing Ca2+ depletion from the ER lumen and initiation of ER stress. The consequent increase of Ca2+ in the cytosol and mitochondrial matrix lead to CER-induced apoptosis. 35 TUDCA treatment caused a significant decrease in hepatic and renal tissue CER levels in male rats treated with TM. The decrease in CERs succeeding TUDCA treatment may offer a unique way by which TUDCA can ease ER stress. The finding of increased CERs in our animal model suggests that it may activate apoptotic and antiproliferative reactions observed in ER stress. 36 The function of SMase is to convert SM to CER and phosphocholine. 36 It has previously been reported that induction of ER stress in human pancreatic islets leads to induction of N-SMase activity and CER generation. 37 The increase of hepatic and renal N-SMase activity in ER stressed animals is expected to lead to increased tissue levels of CERs in our study.
We have observed that kidney and liver cPLA2 protein and activity measured in TM treated animals were significantly higher compared to control, TUDCA and TM +TUDCA groups. Phospholipase A2 consists of a group of enzymes that include secretory (sPLA2), cPLA2, and calcium independent PLA2. 38 These enzymes hydrolyze the phospholipid bond at the sn-2 position and release arachidonic acid. Ceramide is reported to activate cPLA2 by binding to the CaLB domain of the enzyme, facilitating its membrane docking and arachidonic acid release. 39 Cytosolic PLA2 plays an important role on ER stress by degrading cell membrane phospholipids and synthesis of proinflammatory lipid mediators and cytokines during ER stress. 40
Cyclooxygenase-2 protein and total COX activity was increased in both liver and kidney tissues following TM treatment. It was previously shown that CER regulates transcription of COX-2. 41 The induction of COX-2 by CER was inhibited by an inhibitor of protein kinase C (PKC). Triggering of the CER pathway also led to increases in extracellular signal-regulated kinase (ERK), c-Jun N-terminal kinase (JNK), and p38 mitogen-activated protein kinase (MAPK) activities 41 suggesting that PKC activation is essential for activation of MAPK/JNK/ERK signaling in CER-induced COX-2 expression in liver and kidney. In agreement with increased liver and kidney COX activity, we have also measured significantly increased tissue PGE2 levels following TM treatment. Arachidonic acid is a precursor of PGE2 synthesis which is produced during inflammatory responses. We have observed that pretreatment with TUDCA significantly decreased ER stress, N-SMase activity, CER levels and downstream activation of both cPLA2 and COX-2. This also led a decrease in tissue PGE2 levels.
In conclusion, we report that TM treatment resulted in liver and kidney ER stress, activated N-SMase, increased CER levels leading to cPLA2 and COX activation. We also showed that TUDCA decreased ER stress and CERs, cPLA2, COX and PGE2 levels in liver and kidney tissue of TM treated male rats. The scheme in Figure 3 summarizes these findings. In light of the presented data, it is critical to understand the intertwined signaling pathways by which increased CER leads to inflammation. Another area of future investigation is the active crosstalk between ER and other organelles, which affects the response of a cell to ER stress. Therapeutically, as presented herein, there is proof for the protective effect of TUDCA as an ER stress modulator.

Ceramide signal transduction pathway in ER stress. Increase of neutral sphingomyelinase (N-SMase) activity in ER stressed liver and kidney leads to increased tissue levels of ceramide. Ceramide activates cPLA2 which degrades cell membrane phospholipids and releases arachidonic acid. Ceramide increases COX-2 protein levels which can be triggered by protein kinase C (PKC), extracellular signal-regulated kinase (ERK), c-Jun N-terminal kinase (JNK), and p38 mitogen-activated protein kinase (MAPK) activities. Increased COX activity causes increased tissue prostaglandin E2 (PGE2) levels.
Chemical chaperones such as TUDCA may improve the capacity of protein folding and promote liver and kidney cell survival in disease conditions associated with ER stress. However, these findings need to be confirmed in other applicable models of ER stress. Evaluation based on experimental studies present a powerful tool that can fundamentally offer novel solutions to long-standing problems. However potential limitations do exist. As mentioned earlier, ceramide and N-SMase levels have been determined in liver and kidney samples obtained from a total of 24 rats, 6 rats from each experimental group. Total COX activity, cPLA2 activity and PGE2 levels were also measured in liver and kidney samples obtained from a total of 24 rats, 6 rats from each experimental group. The limited number of animals (n = 6) utilized in these experimental studies can be underappreciated. It can lead to a high level of generality and too few replications. It may also not meet expectations regarding the sample size.
Footnotes
Abbreviations
Declaration of conflicting interests
The author(s) declared no potential conflicts of interest with respect to the research, authorship, and/or publication of this article.
Funding
The author(s) disclosed receipt of the following financial support for the research, authorship, and/or publication of this article: This study was supported by a grant [No: TSA-2019-4280] from Akdeniz University Research Foundation.