
Abstract
This study aimed to investigate the potential role of co-treatment with doxorubicin (DOX) and verapamil (VRP) nanoparticles in experimentally induced hepatocellular carcinoma in mice and to investigate the possible mechanisms behind the potential favorable effect of the co-treatment. DOX and VRP were loaded into chitosan nanoparticles (CHNPs), and cytotoxicity of loaded and unloaded drugs against HepG2 cells was evaluated. Male albino mice were divided into eight groups (n = 15): (1) normal control, (2) diethylnitrosamine, (3) CHNPs, (4) free DOX, (5) CHNPs DOX, (6) free VRP, (7) CHNPs VRP, and (8) CHNPs DOX + CHNPs VRP. Either VRP or DOX loaded into CHNPs showed stronger growth inhibition of HepG2 cells than their free forms. DOX or VRP nanoparticles displayed pronounced anticancer activity in vivo through the decline of vascular endothelial growth factor and B cell lymphoma-2 contents in liver tissues, upregulation of antioxidant enzymes, and downregulation of multidrug resistance 1. Moreover, reduced cardiotoxicity was evident from decreased level of tumor necrosis factor-α and malondialdehyde in heart tissues coupled with decreased serum activity of creatine kinase-myocardial band and lactate dehydrogenase. Co-treatment with CHNPs DOX and CHNPs VRP showed superior results versus other treatments. Liver sections from the co-treatment group revealed the absence of necrosis, enhanced apoptosis, and nearly normal hepatic lobule architecture. Co-treatment with CHNPs DOX and CHNPs VRP revealed enhanced anticancer activity and decreased cardiotoxicity versus the corresponding free forms.
Keywords
Introduction
Hepatocellular carcinoma (HCC) is one of the leading causes of cancer mortality in the world. 1 Since most patients with HCC are diagnosed at an advanced stage, there is a demand for nonsurgical treatments such as chemotherapy. 2 The treatment of HCC with traditional chemotherapeutic agents such as anthracyclines, platinum-based agents, and taxanes has been limited due to poor efficacy, acquired resistance of the tumors, and systemic toxicity. 3
Doxorubicin (DOX), an anthracycline antibiotic, has significant efficacy in treating many kinds of tumors via different mechanisms. 4 However, the clinical use of DOX has been limited due to its cardiotoxicity, myelosuppression, and multidrug resistance (MDR). 5,6 Overexpression of P-glycoprotein (P-gp) is associated with DOX resistance in HCC, since P-gp can efflux DOX out of the cell and decrease its accumulation within the cancer cells. 7,8 Combination therapy offers preferable prognosis with less side effects. For example, the combination of chemotherapeutics with chemo-sensitizers (verapamil (VRP), cyclosporin A, and tariquidar) has been shown to exert beneficial therapeutic effects, overcome MDR, and reduce side effects through modulation of different signaling pathways in tumor cells. 9,10
VRP, a calcium channel blocker, treats cardiac arrhythmias through inhibition of calcium ion flux. 11 Several studies have described the role of VRP in growth inhibition of tumor cells including lung and bone cancer cells and meningioma. 12 –14 VRP can be used as an adjuvant in multidrug chemotherapy through the inhibition of P-gp and calmodulin activity in cancer cells; thereby diminishing drug resistance. 15,16 However, the use of VRP is restricted because very high doses are needed to inhibit P-gp, and this causes cardiac side effects. 17 Fortunately, these limitations can be overcome using nano-carriers. 18
Nano-sized formulations are designed to increase the accumulation of the drug at the tumor environment and to improve solubility/bioavailability, promote retention, specificity, efficacy, and safety. Nano-materials increase the synergistic effect between chemotherapy and chemo-sensitizers through slow and controlled release of the encapsulated drug. They decrease resistance to drug efflux mediated by MDR transporters due to the size-exclusion effect. 19 Therefore, nanoparticles loaded with DOX and VRP can be a useful strategy in cancer therapy. 20,21 Chitosan is a polysaccharide of biological origin and is considered as a safe and active drug delivery material due to its high biodegradability and biocompatibility. 22 Chitosan is one of the most suitable drug delivery systems owing to its excellent biodistribution, high sensitivity and specificity, and low pharmacological activity. Cationic character of chitosan and its solubility in aqueous medium at acidic pH permit the incorporation and entrapment of negatively charged molecules. 23
The purpose of this study was to compare the adjuvant effect of both DOX/VRP chitosan nanoparticles (CHNPs) with their free forms in the treatment of HCC in mice and to investigate the possible mechanisms behind the potential favorable effect of co-treatment with DOX and VRP nanoparticles.
Methods
Drugs
Chitosan (deacetylation degree 87.30%) and diethylnitrosamine (DENA) were obtained from Sigma Aldrich (St Louis, Missouri, USA). DOX hydrochloride (Adriadox® vials) was purchased from RMPL PHARMA LLP (Mumbai, Maharashtra, India). VRP hydrochloride was a gift from Abbott Pharmaceutical Company (Cairo, Egypt). Sodium tripolyphosphate was from Alpha Chem (Stony Brook, USA). Human liver cancer cell line HepG2 was obtained from Holding company for biological products and vaccines; VACSERA (Cairo, Egypt).
Preparation of drug-loaded CHNPs
DOX and VRP nanoparticles were prepared by ionic gelation method. 24,25 Briefly, 1.75 mg mL−1 chitosan solution was prepared in water. Acetic acid (1% v/v) was slowly added and the mixture was vigorously stirred to dissolve chitosan powder completely (pH = 5). DOX solution of 1 mg mL−1 was slowly added to the chitosan solution and mixed thoroughly. Under magnetic stirring, 2 mL of sodium tripolyphosphate solution (2.91 mg mL−1, pH 2) was added to 10 mL of DOX-chitosan mixture and incubated at room temperature for 5 min. DOX CHNPs were obtained by centrifugation at 16,000× g for 90 min at 4°C. The supernatant was discarded, then the pellets were washed with double distilled water and freeze-dried for 48 h. Pellets were kept at 4°C for subsequent studies. VRP CHNPs were prepared by the same procedures using 1 mg mL−1 VRP solution.
Nanoparticles characterization and drug release
Transmission electronic microscopy (TEM): Morphology and particle size measurement (hydrodynamic diameter, nm) of DOX/VRP nanoparticles were assessed with a JEM-2100Plus transmission electron microscope (JEOL, Dearborn Rd, Peabody, USA). Nanoparticle suspensions (100 µg mL−1) were spread over a carbon film-coated copper grid (200 meshes) and dried for 24 h. Dried specimens were observed with TEM at an acceleration voltage of 75 kV.
Zeta potential was measured using a Zetasizer Nano ZS90 (Malvern Instruments, Malvern, UK). The nanoparticle suspension of 1 mg mL−1 was prepared and diluted with deionized distilled water (1:2 dilution). The measurement was carried out five times at 25°C.
Entrapment efficiency (EE) was calculated. Nanoparticle suspension was centrifuged at 16,000× g for 15 min at 10°C. The absorbance values of unloaded drug in the supernatant were measured with a UV spectrophotometer (Shimadzu UV visible 1601 PC, Kyoto, Japan) at 480 nm for DOX and 280 nm for VRP. 26,27 The concentration of each free drug was calculated from preconstructed calibration curves of different concentrations of DOX and VRP solutions. EE was calculated with the formula: EE = (total drug added (mg mL−1) − free drug in supernatant (mg mL−1))/total drug (mg mL−1) ×100 7 .
Fourier-transform infrared (FTIR) spectra of free DOX, free VRP, CHNPs, CHNPs DOX, and CHNPs VRP were obtained using an FTIR spectrophotometer (Tensor 27; Bruker, Karlsruhe, Germany). One milligram of free powdered drugs or freeze-dried nanoparticles was mixed with 100 mg potassium bromide powder and pressed into a disc. The wavelength range was between 400 cm−1 and 4000 cm−1.
Dialysis method was performed to evaluate the release pattern of DOX and VRP from their nano-formulations. Five milligrams of freeze-dried CHNPs DOX and CHNPs VRP were suspended in 1-mL phosphate-buffered saline (PBS; pH = 7.4). Dialysis bags (3500 kDa cutoff) were filled with either CHNPs DOX or CHNPs VRP suspensions. Dialysis bags were dipped in 50 mL of PBS. The whole system was stirred at 37°C by a thermostatically controlled magnetic stirrer. At specified time intervals (0, 2, 4, 6, 12, 18, 22, 26, 48 h), 1 mL of the released medium was removed and diluted with deionized distilled water (1:5 dilution). The concentration of released drug (µg mL−1) was calculated with the following equation

where Pt is the percentage release at time t and P (t − 1) is the percentage release previous to (t).
Cytotoxicity in vitro
3-(4,5-Dimethylthiazol-2-yl)-2,5-diphenyltetrazolium bromide (MTT) assay was conducted to evaluate the growth inhibitory effect of CHNPs, free drugs, and their nano-formulations.
29
HepG2 cells were cultured at 1 × 10⁴ cells mL−1 in a 96-well microtiter plate containing Roswell Park Memorial Institute medium, 10% fetal bovine serum, 1%
Cytotoxic effect of free DOX, CHNPs DOX, free VRP, CHNPs VRP, and CHNPs DOX +CHNPs VRP was examined as described above with concentrations (0.5–1000 µg mL−1). Untreated cells served as the control group.
In vivo study
Experimental design
One hundred and twenty male Swiss albino mice aged 6–8 weeks and weighing 15–20 g were purchased from the National Research Center (Cairo, Egypt). Mice were housed in aluminum cages for 1 week for acclimatization and were supplied with a commercial standard pellet diet and tap water ad libitum. All guidelines for the care and use of laboratory animals (National Research Council, 2011) were followed. All experimental procedures were approved by Research Ethical Committee, Faculty of Pharmacy, Suez Canal University, Egypt (201902PHDA1).
After acclimatization, mice were randomly divided into eight groups (n = 15). The first group was the normal control group. The remaining 105 mice were intraperitoneally (i.p.) injected with 75 mg kg−1 DENA once per week for 3 weeks, then 100 mg kg−1 for another 3 weeks. Finally, they were left untreated for another 2 weeks. 31 DENA-injected mice were divided as follows: DENA group, each mouse was given 100 µL of normal saline. CHNPs group, each mouse received 100 µL of CHNPs (1.75 mg mL−1). Free DOX group, mice were given 5 mg kg−1 DOX dissolved in normal saline. 32 CHNPs DOX group, each mouse received 100 µL of CHNPs DOX (1 mg mL−1). Free VRP group, 25 mg kg−1 VRP dissolved in normal saline were given to mice. 33 CHNPs VRP group, each mouse received 100 µL of CHNPs VRP (1 mg mL−1). CHNPs DOX + CHNPs VRP group, each mouse received 100 µL of each CHNPs DOX and CHNPs VRP. Each treatment was given i.p. thrice weekly from the 9th till the 12th week.
Sample collection
Survival rate after 12 weeks was calculated with the equation: survival rate = (number of live animals in a group after 12 weeks/number of animals in the same group at the start of experiment) × 100. 34 Under light ether anesthesia, blood was collected via cardiac puncture and centrifuged at 2000× g and 4°C for 20 min (Laborzentrifugen 3-3OK; Sigma, Munich, Germany) to separate serum. Serum samples were collected for assessment of alanine aminotransferase (ALT), aspartate aminotransferase (AST), creatine kinase-myocardial band (CK-MB), and lactate dehydrogenase (LDH).
Livers were dissected and washed with ice-cold saline, dried on clean paper towels, and weighed. Liver index was calculated as liver weight (g)/final body weight (g) × 100. 35 Liver tissue samples were fixed in 10% formalin for histopathological examination and the remaining samples were immediately stored at −80°C till measurement of the biochemical parameters. Heart tissues were dislocated, washed with ice-cold saline, and frozen at −80°C.
Measurement of biochemical parameters
Anticancer activity
Serum ALT and AST were determined colorimetrically by the kinetic method as described by Huang et al. 36 The procedures were performed according to the manufacturer’s protocol (Egyptian Company for Biotechnology, Egypt).
Vascular endothelial growth factor (VEGF) and Bcl-2 were measured in liver tissue by ELISA, according to the manufacturer’s protocol (Glory Science Co., HongKong, China).
Reduced glutathione (GSH) was determined in liver tissue homogenate using a colorimetric kit (Biodiagnostic, Cairo, Egypt), according to the manufacturer’s instructions. 37 5,5′-Dithiobis (2-nitrobenzoic acid) is reduced by GSH to produce a yellow compound and its absorbance can be measured at 405 nm.
Quantitative real-time polymerase chain reaction
Expression of glutathione peroxidase (GPx), catalase (CAT), and multidrug resistance 1 (MDR1) in liver tissue was determined by the quantitative real-time polymerase chain reaction (qRT-PCR). Liver tissues were homogenized. Total cellular RNA was extracted with an RNA-spinTM total RNA extraction kit (iNtRON Biotechnology Co., Sangdaewon-Dong, Korea) under liquid nitrogen. Complementary DNA (cDNA) was synthesized using TIANScript reverse transcription kit (Tiangen Co., Beijing, China; two-step RT-PCR kit) and oligo-dT primers. Amplification and quantification of cDNA were performed with SYBR Green I PCR (iNtRON Biotechnology Co.). Primers (Table 1) were prepared according to the literature. 7,38 The 20-µL reaction was composed of 10 µL of SYBR Green I PCR, 1 µL of each primer (10 μM), 4 µL cDNA, and 4 µL nuclease-free water.
Primers used in the study.

MDR1: multidrug resistance 1; GPx: glutathione peroxidase; CAT: catalase; GAPDH: glyceraldehyde-3-phosphate dehydrogenase.
RT-PCR program consisted of a pre-denaturation at 95°C for 30 s, then 40 cycles of denaturation at 95°C for 5 s, and annealing/extension at 55°C for 10 s. Threshold cycle (Ct) values were normalized to those of glyceraldehyde-3-phosphate dehydrogenase. The 2−ΔCt method was used for determining the gene amplification, and target gene results were expressed as relative copy number.
Histopathological examination
Liver tissues were transferred from 10% formalin to ascending grades of alcohol, cleared in xylene, and then embedded in paraffin to form blocks. Liver sections (3–5 µm) were prepared and stained with hematoxylin and eosin (H&E). 39 Liver tissues were examined for neoplastic features and apoptotic cell count. Images were recorded with an Olympus microscope (Shinjuku, Japan) equipped with spot digital camera, and computer program MATLAB 9.3 software.
Cardiotoxicity assessment
Tumor necrosis factor-alpha (TNF-α) content in heart tissues was determined with ELISA according to the manufacturer’s protocol (Glory Science Co.).
Malondialdehyde (MDA) was determined in heart tissue homogenate using a colorimetric kit (Biodiagnostic), according to the manufacturer’s instructions. 40 MDA reacts with thiobarbituric acid in an acidic medium for 30 min at 95°C forming thiobarbituric acid reactive product. The pink-colored compound was determined at 534 nm.
CK-MB and LDH activities were determined according to the literature. 41,42 The kits were obtained from Egyptian Company for Biotechnology. The procedures were carried out according to the manufacturer’s protocol.
Statistical analysis
Data analysis was carried out using SPSS version 16.0, and values are presented as mean ± standard deviation. Comparison between groups was performed using one-way analysis of variance followed by Bonferroni’s post hoc multiple comparison test. p Value ≤0.05 was considered significant.
Results
Nanoparticles characterization
CHNPs VRP and CHNPs DOX have diameters less than 100 nm. The average diameter was 50 ± 10 nm for CHNPs DOX and 30 ± 5 nm for CHNPs VRP. TEM imaging showed clear borders of spherical particles (Figure 1). EE for CHNPs DOX and CHNPs VRP was 88.75% and 84.7%, respectively.
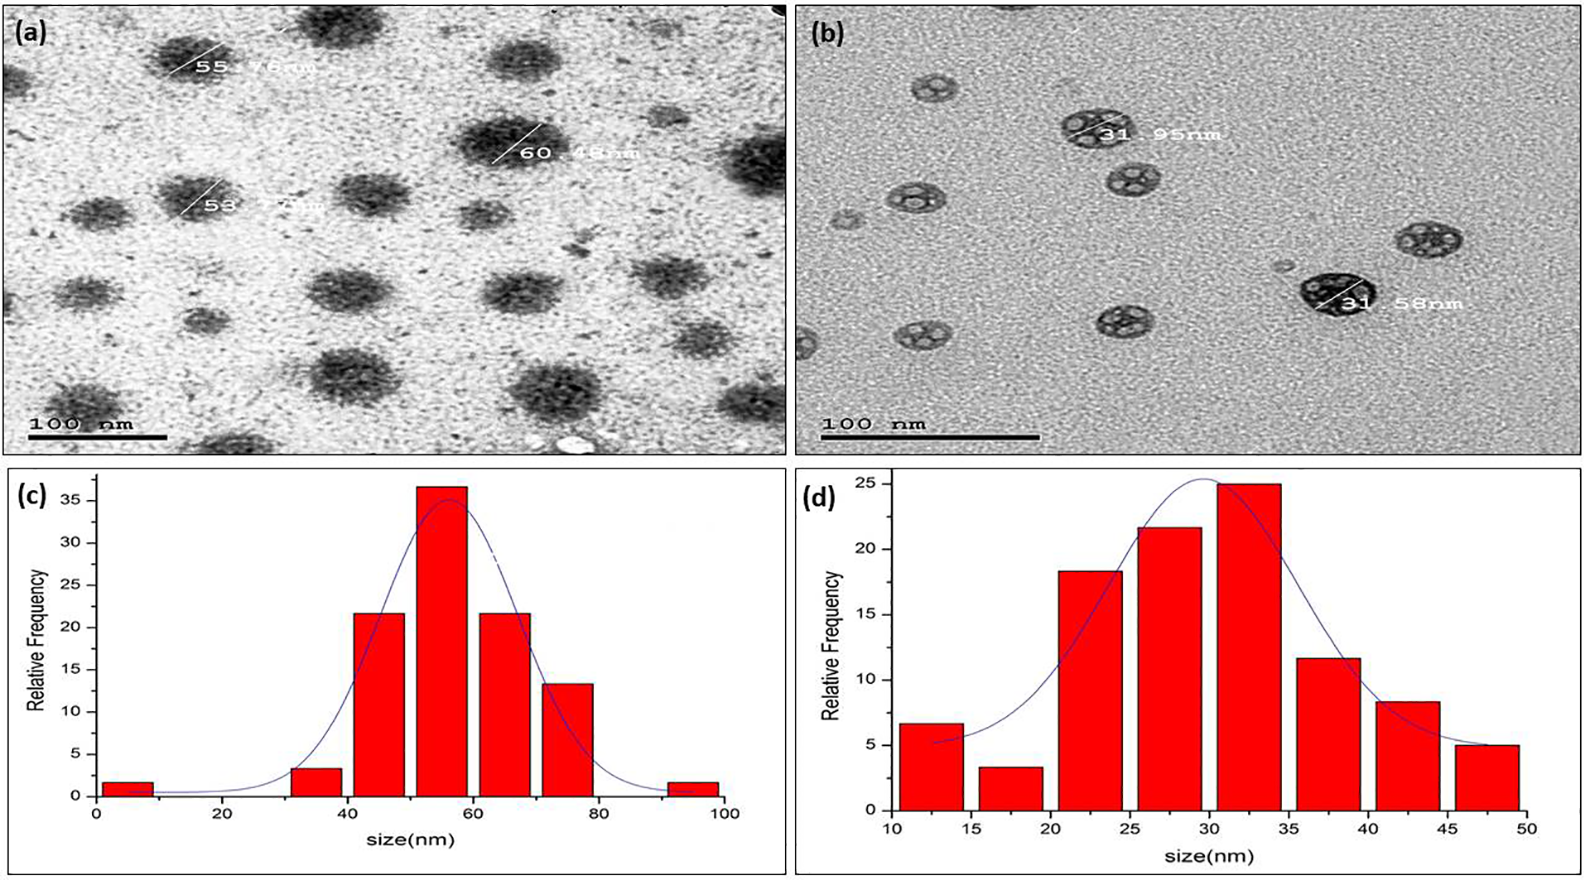
TEM micrographs and size distribution curves of ((a) and (c)) DOX nanoparticles and ((b) and (d)) VRP nanoparticles. The average diameter was 50 ± 10 nm for CHNPs DOX and 30 ± 5 nm for CHNPs VRP. TEM: transmission electronic microscopy; DOX: doxorubicin; VRP: verapamil; CHNP: chitosan nanoparticle.
CHNPs DOX has a positive zeta potential of +18.81 ± 1.5 mV; while CHNPs VRP has a zeta potential of +7.39 ± 0.93 mV.
Figure 2(a) shows the discriminative peaks for CHNPs. FTIR spectrum of free DOX has peaks at 3583–3115 cm−1 (OH), 1755 cm−1 (C=O), 1637 cm−1 (NH), 1489 cm−1 (NH), and 1270–1092 cm−1 (C–O). CHNPs DOX spectrum shows additional peak of phosphate group at 1016 cm−1, and other peaks displayed a significant chemical shift (Figure 2(b)).
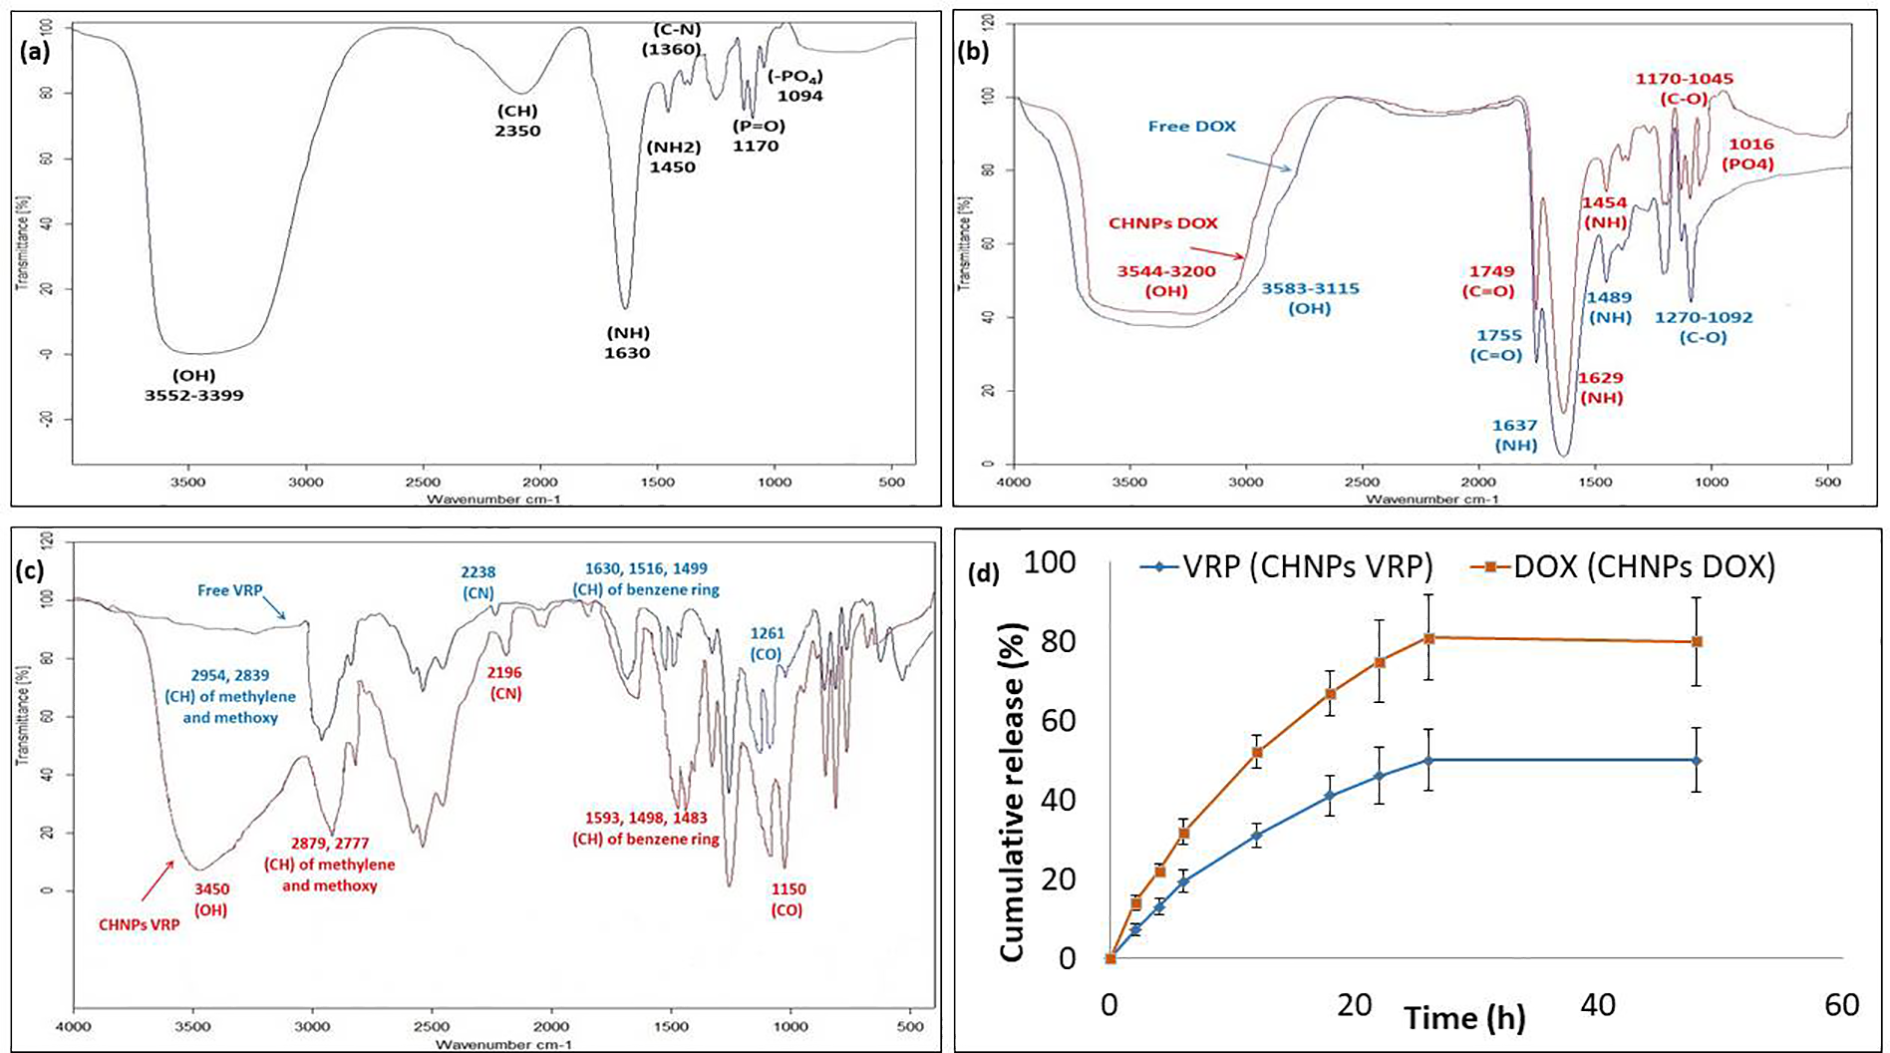
FTIR spectra and in vitro drug release: (a) FTIR spectrum of CHNPs, (b) FTIR spectra of free DOX (blue) and CHNPs DOX (red), (c) FTIR spectra of free VRP (blue) and CHNPs VRP (red), and (d) in vitro release pattern of DOX and VRP from CHNPs. Data are presented as mean ± SD (n = 5). FTIR: Fourier-transform infrared; CHNP: chitosan nanoparticle; DOX: doxorubicin; VRP: verapamil; SD: standard deviation.
FTIR spectrum of free VRP shows (CH) stretching peaks of methylene and methoxy groups at 2954 and 2839 cm−1, (C≡N) stretching at 2238 cm−1, (CH) stretching of benzene ring at 1630, 1516, 1499 cm−1, and strong (C–O) stretching vibration of aromatic ethers at 1261 cm−1. CHNPs VRP spectrum shows additional broad peak of hydroxyl group at 3450 cm−1 and a strong chemical shift of the characteristic peaks (Figure 2(c)).
A biphasic pattern of DOX and VRP release from their CHNPs was observed (Figure 2(d)). The initial phase involved rapid release of drugs within the first 6 h, where the cumulative release of DOX and VRP were 31.8% and 19.4%, respectively (p < 0.05). The final phase showed sustained slow release of drugs from CHNPs, leading to 80% cumulative release of DOX and 50% of VRP after 48 h (p < 0.05).
Cytotoxicity assay (in vitro)
The cytotoxic effect of free DOX and VRP and their nano-formulations on HepG2 cells was examined. Incubation with CHNPs had no effect on cell viability versus control cells (Figure 3(a)). The test formulations affected cell viability in a concentration-dependent manner. Incubation with either CHNPs DOX or CHNPs VRP resulted in greater decline in cell viability than their free forms (Figure 3(b)). IC50 of nano-formulated DOX and VRP was lower than that of their corresponding free forms (Table 2). Incubation of HepG2 cells with a combination of CHNPs DOX and CHNPs VRP resulted in the highest decline in cell viability and the smallest IC50 value (Figure 3(b) and Table 2).

Cytotoxicity in HepG2 cells and effect of DOX, VRP, and their nano-formulations on HCC-induced mice. (a) Cytotoxicity of CHNPs in HepG2 cells. (b) Cytotoxicity of DOX, VRP, and their nano-formulations in HepG2 cells. Data are presented as mean ± SD (n = 3). (c) Effect of DOX, VRP, and their nano-formulations on (c) survival rate and (d) liver index. Data are presented as mean ± SD (n = 10). The different alphabets within the graph indicates a: significant versus normal control, b: significant versus DENA, c: significant versus free DOX, d: significant versus CHNPs DOX, e: significant versus free VRP, and f: significant versus CHNPs VRP. DOX: doxorubicin; VRP: verapamil; HCC: hepatocellular carcinoma; CHNP: chitosan nanoparticle; DENA: diethylnitrosamine; SD: standard deviation.
IC50 of DOX, VRP, and their nano-formulations in HepG2 cells.
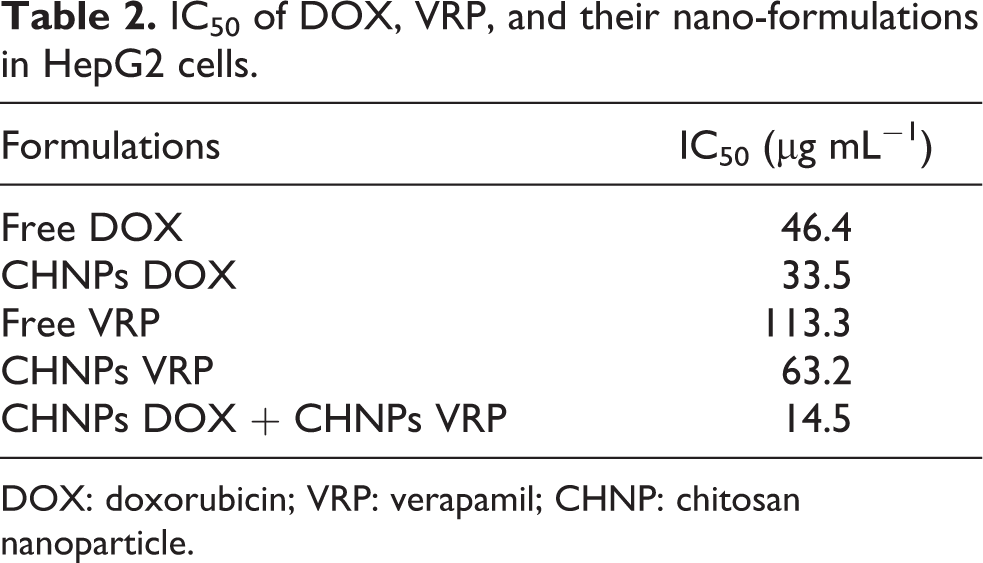
DOX: doxorubicin; VRP: verapamil; CHNP: chitosan nanoparticle.
Improved anticancer activity (in vivo)
Effect on survival rate and liver index
Survival rate of the control group was 100%, whereas that of the DENA group was 66%. The survival rate increased to 86% in the free DOX group, 93% in the CHNPs DOX group, 73% in the free VRP group, and 80% in the CHNPs VRP group. The CHNPs DOX + CHNPs VRP group had a survival rate of 100% (Figure 3(c)).
Injection of mice with DENA caused a significant increase (p < 0.01) in the liver index (2.1-fold) compared to the normal control group. There was no significant change in the liver index of the CHNPs group when compared to the DENA group. Free VRP and free DOX significantly decreased the liver index (20.2% and 28.3%, respectively) compared to the DENA group. Loading of VRP and DOX into CHNPs caused a significant reduction in the liver index (20.1% and 17.3%, respectively) compared to the free drugs. The greatest decline in the liver index was achieved by co-treatment with CHNPs DOX + CHNPs VRP to reach a value lower than that in normal control (Figure 3(d)).
Effect on ALT and AST
DENA group had increased serum ALT and AST (Figure 4(b)). CHNPs group showed a significant decrease in serum ALT and AST compared to the DENA group. Serum AST and ALT in mice receiving free DOX or free VRP were not different than the DENA group. On the other hand, nano-formulations of either DOX or VRP induced a significant decrease in ALT and AST activities versus DENA administration and their unloaded forms, whereas combining DOX and VRP nanoparticles resulted in the greatest decline (Figure 4(a) and (b)).

Effect of DOX, VRP, and their nano-formulations on HCC-induced mice. (a) ALT activity, (b) AST activity, (c) liver VEGF content, and (d) liver Bcl-2 content. Data are presented as mean ± SD (n = 10). The different alphabets within the graph indicates a: significant versus normal control, b: significant versus DENA, c: significant versus free DOX, d: significant versus CHNPs DOX, e: significant versus free VRP, and f: significant versus CHNPs VRP. DOX: doxorubicin; VRP: verapamil; HCC: hepatocellular carcinoma; ALT: alanine aminotransferase; AST: aspartate aminotransferase; VEGF: vascular endothelial growth factor; DENA: diethylnitrosamine; CHNP: chitosan nanoparticle; SD: standard deviation.
Effect on hepatic VEGF and Bcl-2 contents
VEGF level in liver tissues was significantly increased (8.2-fold, p < 0.001) by DENA administration (Figure 4(c)). CHNPs alone did not induce significant change versus the DENA group. Conversely, treatment with free DOX or free VRP resulted in a significant decrease in hepatic VEGF content (25.1% and 47%, respectively) versus the DENA group. Loading of DOX or VRP into CHNPs induced remarkable decline in hepatic VEGF content (18.9% and 29.7%, respectively) versus their free forms. Combined treatment displayed the greatest decline versus all treatment groups (Figure 4(c)).
Bcl-2 content in liver tissues was significantly increased (5-fold, p < 0.001) in the DENA group (Figure 4(d)). CHNPs alone did not change the Bcl-2 level. Free DOX and free VRP exhibited significant decline in hepatic Bcl-2 content (25.5% and 15.7%, respectively) versus the DENA group. Nano-formulations of DOX and VRP significantly lowered liver Bcl-2 content (28.2% and 23.5%, respectively) compared to their free forms. Simultaneous treatment with CHNPs DOX and CHNPs VRP induced pronounced decrease in liver Bcl-2 content (Figure 4(d)).
Effect on liver GSH content
Liver GSH content was significantly (p < 0.01) decreased in DENA versus normal control (Figure 5(a)). CHNPs induced a significant rise in liver GSH content (1.2-fold) compared to the DENA group. Free DOX and free VRP significantly lowered liver GSH content compared to the DENA group. Loading of VRP and DOX into CHNPs showed significant elevation in liver GSH content (1.6- and 1.7-fold, respectively) compared to the unloaded drugs. Furthermore, combined therapy with CHNPs DOX + CHNPsVRP significantly increased liver GSH content compared to all other treatment groups (Figure 5(a)).

Effect of DOX, VRP, and their nano-formulations on HCC-induced mice. (a) Liver GSH content, (b) GPx gene expression, (c) CAT gene expression, and (d) MDR1 gene expression. Data are presented as mean ± SD (n = 10). The different alphabets within the graph indicates a: significant versus normal control, b: significant versus DENA, c: significant versus free DOX, d: significant versus CHNPs DOX, e: significant versus free VRP, and f: significant versus CHNPs VRP. DOX: doxorubicin; VRP: verapamil; HCC: hepatocellular carcinoma; GSH: glutathione; GPx: glutathione peroxidase; CAT: catalase; MDR1: multidrug resistance 1; DENA: diethylnitrosamine; CHNP: chitosan nanoparticle; SD: standard deviation.
Effect on GPx, CAT, and MDR1 gene expression
DENA injection induced significant downregulation of GPx and CAT (↓69.2% and 62.7%, p < 0.01, respectively) compared to normal control (Figure 5(b) and (c)). Treatment with either free DOX or VRP significantly downregulated GPx and CAT versus DENA alone. On the other hand, treatment with CHNPs, CHNPs DOX, and CHNPs VRP significantly increased GPx and CAT gene expression versus DENA group (Figure 5(b) and (c)). Loading of DOX and VRP into CHNPs induced a significant (p < 0.01) upregulation of GPx and CAT compared to their free forms. Co-treatment with CHNPs DOX and CHNPs VRP induced a pronounced upregulation of GPx and CAT (Figure 5(b) and (c)).
DENA administration significantly increased MDR1 gene expression (4.5-fold, p < 0.001). CHNPs alone did not alter MDR1 gene expression versus the DENA group. MDR1 gene expression in the free DOX group was significantly upregulated (1.6-fold) compared to the DENA group. On the other hand, the loading of DOX into CHNPs induced a significant decrease in MDR1 gene expression (↓23.7%) versus the free DOX group. Moreover, free VRP and its nano-formulation significantly (p < 0.01) downregulated MDR1 versus DENA, free DOX, and CHNPs DOX groups. Co-treatment with CHNPs DOX and CHNPs VRP significantly downregulated MDR1 gene expression versus DENA, CHNPs DOX, free DOX, and VRP groups, and reached a level near normal (Figure 5(d)).
Histopathological examination
Liver sections from the normal control group revealed classical hepatic lobules. Each lobule consisted of hepatocytes radiating from the central vein. Liver sinusoids were surrounded by Kupffer cells (Figure 6(a)). On the other hand, sections from the DENA group showed bile duct hyperplasia, large nodule of giant hepatocytes (53.39 µm) with a significant decrease (p < 0.01) in apoptotic cell count by 58.8% versus normal control (Figure 6(b), (c), and (j)). Injection of CHNPs alone displayed bile duct hyperplasia and insignificant change in apoptotic cell count along with an increase in nodule size (1.9-fold) compared to the DENA group (Figure 6(d) and (j)).

Photomicrographs of liver sections from healthy and HCC-induced mice and effect of DOX, VRP, and their nano-formulations on the apoptotic cell count. (a) Normal control group showing cords of hepatocytes radiated from the CV. Kuffer cells () are associated with hepatic sinusoids ( ). (b) DENA group showing bile ducts dilatation and hyperplasia (
 ), hepatocytes with abundant acidophilic cytoplasm with increase of the N/C ratio (
 ) and coagulative necrosis of hepatocytes (N). (c) DENA group showing large nodule of giant hepatocytes (
 ), and dilatation of hepatic blood sinusoids lined with Kupffer cells (). Note the massive congestion of the hepatic vein (H). (d) CHNPs group showing nodule of giant hepatocytes with large nuclei () Note the presence of hemorrhage (H) (H&E ×400). (e) Free DOX group showing small nodule of giant hepatocytes having large vesicular nuclei (), hepatocytes with small dark pyknotic nuclei (
 ), and necrotic malignant hepatocytes (NM). (f) CHNPs DOX group showing focal apoptosis of hepatocytes at the perivenous area (CV) with pyknotic nuclei (). Intralobular lymphocytic infiltration (F) is present. (g) The free VRP group showing small hepatic nodule (), dilatation of blood sinusoids (), and hemorrhage (H). (h) CHNPs VRP group showing some cords of nearly normal hepatocytes radiating from the CV. Note: The presence of small dark pyknotic nuclei (). (i) CHNPs DOX + CHNPs VRP group nearly normal hepatic lobule architecture, having cords of hepatocytes radiating from the CV. However, apoptotic hepatocytes with pyknotic nuclei () are seen (H&E ×400). (j) Effect of DOX, VRP, and their nano-formulations on apoptotic cell count in liver sections from healthy and HCC-induced mice. Data are presented as mean ± SD (n = 10). The different alphabets within the graph indicates a: significant versus normal control, b: significant versus DENA, c: significant versus free DOX, d: significant versus CHNPs DOX, e: significant versus free VRP, and f: significant versus CHNPs VRP. HCC: hepatocellular carcinoma; DOX: doxorubicin; VRP: verapamil; CV: central vein; DENA: diethylnitrosamine; N/C: nuclear–cytoplasmic; CHNP: chitosan nanoparticle; H&E: hematoxylin and eosin; SD: standard deviation.
Treatment of mice with free DOX reduced the pathological changes, nodule size decreased by 33.4%, and increased apoptotic cell count increased 4-fold compared to the DENA group (Table 3, Figure 6(e) and (j)). Liver sections from mice treated with CHNPs DOX showed the absence of hepatic nodule and a significant increase in apoptotic cell count (1.25-fold) versus free DOX (Figure 6(f) and (j)).
Effect of DOX, VRP, and their nano-formulations on maximum nodule size (diameter, µm) in HCC-induced mice.a
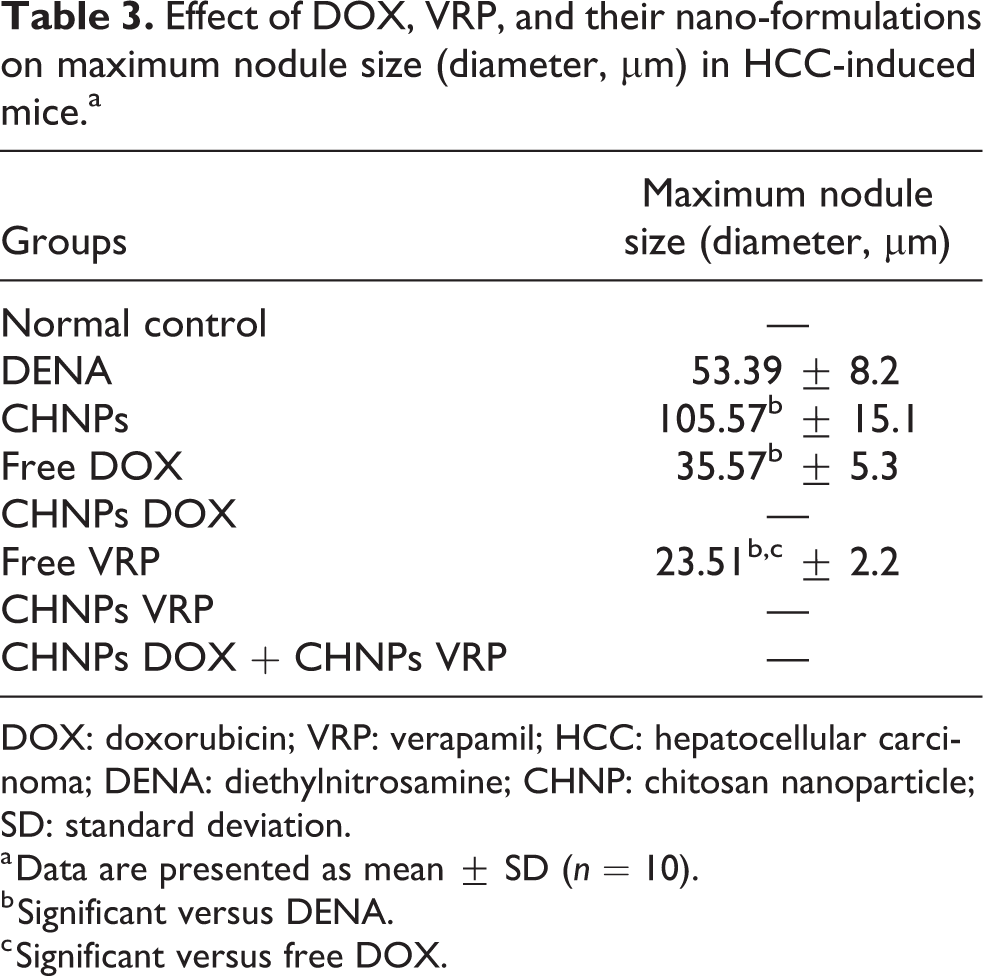
DOX: doxorubicin; VRP: verapamil; HCC: hepatocellular carcinoma; DENA: diethylnitrosamine; CHNP: chitosan nanoparticle; SD: standard deviation.
a Data are presented as mean ± SD (n = 10).
b Significant versus DENA.
c Significant versus free DOX.
VRP treatment significantly (p < 0.01) decreased the nodule size by 55.9% and increased apoptotic cell count (2.3-fold) compared to the DENA group (Table 3, Figure 6(g) and (j)). Treatment of mice with CHNPs VRP showed some cords of nearly normal hepatocytes radiating from the center and significantly increased apoptotic cell count (1.5-fold) versus free VRP (Figure 6(h) and (j)). The combination group CHNPs DOX + CHNPs VRP showed nearly normal hepatic lobule architecture and an increase in apoptotic cell count (1.9- and 2.6-fold) versus CHNPs DOX and CHNPs VRP, respectively (Figure 6(i) and (j)).
Minimized cardiotoxicity
Effect on cardiac TNF-α content
DENA injection induced significant elevation (p < 0.01) in TNF-α content (4.7-fold) versus normal control (Figure 7(a)). Plain CHNPs had no effect on TNF-α content versus DENA. Free DOX treatment significantly increased TNF-α content in heart tissues (1.3-fold) versus DENA. Conversely, CHNPs DOX induced a significant decrease in TNF-α content by 27.8% compared to free DOX. Treatment with either free VRP or CHNPs VRP significantly decreased cardiac TNF-α content (26.1% and 49.5%, respectively) versus DENA. Moreover, nano-formulation of VRP significantly decreased cardiac TNF-α content by 31.7% versus free VRP. Combined treatment with CHNPs DOX and CHNPs VRP induced the greatest decline versus all treatment groups (Figure 7(a)).

Effect of DOX, VRP, and their nano-formulations on HCC-induced mice. (a) Cardiac TNF-α content, (b) cardiac MDA content, (c) LDH activity, and (d) CK-MB activity. Data are presented as mean ± SD (n = 10). The different alphabets within the graph indicates a: significant versus normal control, b: significant versus DENA, c: significant versus free DOX, d: significant versus CHNPs DOX, e: significant versus free VRP, and f: significant versus CHNPs VRP. DOX: doxorubicin; VRP: verapamil; HCC: hepatocellular carcinoma; TNF-α: tumor necrosis factor-alpha; MDA: malondialdehyde; LDH: lactate dehydrogenase; CK-MB: creatine kinase-myocardial band; DENA: diethylnitrosamine; CHNP: chitosan nanoparticle; SD: standard deviation.
Effect on cardiac MDA content
DENA injection induced significant elevation in cardiac MDA content (1.7-fold) versus normal control (Figure 7(b)). CHNPs significantly decreased cardiac MDA content by 17.2% versus DENA. Treatment with free forms of DOX and VRP resulted in a significant increase in cardiac MDA content (1.5- and 1.3-fold, respectively) versus the DENA group. CHNPs DOX- or CHNPs VRP-treated mice showed a significant decrease (p < 0.01) in cardiac MDA content (47.3% and 44%, respectively) compared to free DOX or VRP. Co-treatment with CHNPs DOX + CHNPs VRP significantly lowered cardiac MDA content versus CHNPs DOX and CHNPs VRP by 22.8% and 18.7%, respectively (Figure 7(b)).
Effect on cardiac markers
LDH and CK-MB activities were significantly elevated in the DENA group compared to the normal control group (Figure 7(c) and (d)). There was no significant change in the CHNPs group versus DENA. Treatment of HCC-induced mice with either unloaded DOX or VRP showed a significant elevation (p < 0.01) in LDH and CK-MB activities versus DENA. DOX loading into CHNPs exhibited significant reduction in the activities of LDH and CK-MB by 32.3% and 27.4%, respectively versus unloaded DOX. VRP loading into CHNPs resulted in a significant decrease in the activities of LDH and CK-MB by 32.4% and 33.6%, respectively versus unloaded VRP. Combined treatment with CHNPs DOX + CHNPs VRP significantly (p < 0.01) lowered the LDH and CK-MB activities versus unloaded DOX and VRP (Figure 7(c) and (d)).
Discussion
This study examined the impact of combined treatment with nano-formulation of DOX and VRP on enhancing cytotoxicity and reducing cardiotoxicity of DOX in HCC in mice. The biocompatible and biodegradable CHNPs were used to develop a delivery system for DOX and/or VRP. Physicochemical characteristics of nanoparticles have great influence on their cellular uptake and internalization. 43 CHNPs loaded with either DOX or VRP had favorable characteristics, including high encapsulation efficacy, no aggregation of spherical particles, sustained drug release over 2 days, uniform particle size less than 100 nm, and positive zeta potential. Positively charged particles easily bind the negatively charged cell membrane via electrostatic interactions. 44
Similarities between FTIR spectra of free DOX and CHNPs DOX and presence of phosphate peak indicate loading of DOX into CHNPs as previously reported by Unsoy et al. 45 FTIR spectrum of free VRP can be confirmed by the literature. 46,47 The presence of broad peak of hydroxyl group and the significant chemical shift of VRP characteristic peaks in the FTIR spectrum of CHNPs VRP confirm the loading of VRP into CHNPs. This chemical shift could be from the ionic interaction between drug, chitosan polymer, and the cross linker (tripolyphosphate).
Incubation with CHNPs alone did not inhibit the growth of HepG2 cells, indicating that chitosan does not have any cytotoxic effect. This is in agreement with previous studies. 31,48,49 Other studies reported that the cytotoxicity profile of chitosan is dependent on several factors such as concentration, exposure time, cell type, acetylation degree, and extent of solidification. 50,51 Incubation of HepG2 cells with DOX or VRP significantly decreased viability. VRP induced G0/G1 cell arrest and decreased gene expression of epidermal growth factor receptors in colon and lung cancer cells. 52,53 Loading of DOX or VRP into CHNPs improved their anti-proliferative effect on HepG2 cells; most likely through the enhanced accumulation into hepatocytes and improved cellular uptake. Additionally, incubation of HepG2 cells with CHNPs DOX and CHNPs VRP simultaneously resulted in the smallest IC50 value (14.5 µg mL−1) and the highest cytotoxic effect.
Injection of mice with DENA caused loss of hepatic architecture, neoplastic changes, and remarkable decrease in apoptotic cell count. The lowest survival rate and the highest liver index percentages were recorded in the DENA group. This could be the result of oxidative stress, hepatic VEGF and Bcl-2 elevation, and MDR1 overexpression. DENA-induced oxidative stress was evidenced by the depletion of liver GSH and downregulation of GPx and CAT. These results are in accordance with the literatures 54 –56 which reported that the tumorigenic effect of DENA is due to its anti-apoptotic effect, mediated through Bcl-2 and Bcl-xl mRNA and protein upregulation, coupled with oxidative stress induction. This damages essential macromolecules such as DNA, lipids, DNA repair systems, and enzymes.
Both in vitro and in vivo results from this study support the favorable adjuvant effect of DOX and VRP loaded into CHNPs. Treatment with either CHNPs DOX or CHNPs VRP caused the greatest increase in apoptotic cell count and a decrease in Bcl-2 content than treatment with their free forms. The apoptotic effect of DOX was mediated through the activation of adenosine monophosphate protein kinase pathway and p53-level elevation in tumor tissues. 57 VRP demonstrated pro-apoptotic activity and suppressed tumor progression of chemotherapy-resistant pancreatic cancer side population cells. 11 In addition, treatment with nano-formulations caused improvement of hepatic nodules in liver tissues, improvement of survival rate, and further decrease in liver index compared to treatment with free forms. Combined treatment with CHNPs DOX and CHNPs VRP revealed 100% survival rate, the largest increase in apoptotic cell count, and decrease in hepatic Bcl-2 content and liver index.
GSH, a critical antioxidant, prevents oxidative stress and retains redox homeostasis. 58 GPx and CAT are antioxidant enzymes which eliminate free radicals and reduce hydrogen peroxide to water and oxygen. 59 Liver GSH content, GPx, and CAT gene expression were decreased upon treatment with either VRP or DOX. Wang et al. 60 reported that VRP decreased GSH levels in gall bladder cancer cells and triggered apoptosis through elevation of intracellular ROS levels and stimulation of GSH efflux by multidrug resistance-related protein 1.
DENA-induced oxidative stress was antagonized by treatment with either CHNPs DOX or CHNPs VRP. This can be due to the antioxidant properties of chitosan polymer, which was evidenced by GSH elevation and GPx and CAT upregulation. A previous investigation reported antioxidant properties of chitosan, which were significantly enhanced by chemical modification with coumarins. 61 Alternatively, nano-sized formulations can alter enzyme levels and activities, perhaps through modulation of subcellular drug distribution by specific endocytic and trafficking pathways. 62
VEGF mediates angiogenesis and metastasis in different cancer types. 63 The angiogenic and metastatic effect of VEGF is mediated through activation of vascular endothelial cells, increasing availability of oxygen and nutrients, enhancement of vascular permeability, and stimulation of endothelial cell migration. 64 Results from this study showed a decrease in hepatic VEGF by treatment with either unloaded DOX or VRP. Previous in vivo and in vitro studies have reported the downregulation of VEGF by DOX. 65,66 Other investigations have shown that free VRP decreased VEGF production in primary cultures of keloid fibroblasts and rat air pouch inflammation model. 67,68
Nanotechnology is an emerging strategy for targeting tumor angiogenesis. Our results showed that loading DOX and VRP in CHNPs potentiated the improvement in hepatic VEGF in mice with HCC. The leaky vasculature of tumors and improved permeation and retention of nanoparticles enable them to intrinsically localize into tumor vessels resulting in high payloads, long half-life, sustained release of therapeutic drugs, and subsequently shutdown of tumor vascularization and angiogenesis. 69,70
The current study suggests that P-gp is a sign of MDR in HCC because MDR1 overexpression was increased in the DENA group compared to normal control. This corresponds to previous studies by Zhao et al. 7 and Ceballos et al., 71 who revealed that ATP-binding cassette transporters are associated with MDR in HCC and colorectal carcinoma. Treatment with free DOX induced acquired resistance in DENA-induced HCC in mice as demonstrated by the upregulation of MDR1 and elevation of serum ALT and AST activities. On the contrary, we found that the P-gp inhibitor; VRP, downregulated MDR1 by 43.7% versus DENA group, 66% versus free DOX group, and 55.5% versus CHNPs DOX.
Nano-formulations of DOX exhibited improved growth inhibitory effect which was evident through a decrease in ALT and AST activities as well as MDR1 downregulation. These findings were in agreement with the literature, 72 which reported that DOX nanoparticles accumulate in cancer cells via endocytosis and efficiently escape the P-gp through P-gp bypassing effect. VRP-loaded nanoparticles induced a greater MDR1 downregulation through its P-gp inhibitory effect and P-gp bypassing effect of nanoparticles. These results were in agreement with the literature, 73 which reported that accumulations of the drug in the target tissues could be raised by nanoparticles of P-gp inhibitor. In this study, combined treatment with DOX and VRP nanoparticles could restore DOX sensitivity in HCC through significant MDR1 downregulation.
Oxidative stress and apoptosis of cardiomyocytes are the main mechanisms for DOX-induced cardiotoxicity. 74 In addition, pro-inflammatory mediators including interleukins and TNF-α are involved in cardiac hypertrophy and DOX-induced cardiotoxicity, through activation of p38 mitogen-activated protein kinase/nuclear factor kappa B (MAPK/NF-κB) pathway. 75 In the present work, DENA and free DOX groups had the worse cardiac indicators as evidenced by elevation in cardiac MDA and TNF-α coupled with a great rise in serum activities of LDH and CK-MB.
High doses of VRP are toxic to cardiac tissue. 76 Although VRP induced a great rise in cardiac MDA and activities of LDH and CK-MB, it decreased the TNF-α level in heart tissues. Wang et al. 77 revealed that VRP inactivated the NF-κB pathway and decreased the production and function of TNF-α. However, the loading of DOX and VRP into CHNPs reduced this cardiotoxicity due to the advantages of nanoparticles over traditional chemotherapy, which include increased accumulation in tumor and decreased distribution in normal tissues; thereby avoiding side effects. 78 Furthermore, the combined treatment with CHNPs DOX + CHNPs VRP was associated with further minimized cardiotoxicity versus all treatment groups.
Conclusion
Combined treatment with CHNPs DOX and CHNPs VRP displayed enhanced anticancer activity and reduced cardiotoxicity in HCC-induced mice. P-gp bypassing effect, MDR1 downregulation, oxidative stress abrasion, VEGF, and Bcl-2 depletion mediated the enhanced DOX anticancer activity. Therefore, CHNPs DOX + CHNPs VRP is a promising drug delivery strategy with improved efficacy and safety.
Footnotes
Acknowledgment
All authors thank Scientific Research Center and Measurements, Tanta University, Egypt, for help in preparing nano-formulations.
Declaration of conflicting interests
The author(s) declared no potential conflicts of interest with respect to the research, authorship, and/or publication of this article.
Funding
The author(s) received no financial support for the research, authorship, and/or publication of this article.