
Abstract
Excitotoxicity is the presence of excessive glutamate, which is normally taken up by glutamate transporters on astrocytes. Glutamate transporter 1 (GLT-1) is the major transporter on glia cells clearing more than 90% of the glutamate. Sirtuin 4 (SIRT4) is a mitochondrial sirtuin which is expressed in the brain. Previously, it was shown that loss of SIRT4 leads to a more severe reaction to kainic acid, an excitotoxic agent, and also decreased GLT-1 expression in the brain. In this study, we aimed to investigate whether overexpression of SIRT4 is protective against excitotoxicity in glia cells. We overexpressed SIRT4 in A172 glioma cell line and treated with kainic acid in order to induce excitotoxicity. We observed that SIRT4 overexpression increased the cell viability after kainic acid treatment. In addition, reduced glutamate was detected in glutamate assay with overexpression of SIRT4 after kainic acid treatment since SIRT4 decreased cell death by preventing excitotoxicity. Our results show that overexpression of SIRT4 increased the protein levels of GLT-1 and glutamate dehydrogenase (GDH) after kainic acid (KA) treatment so that excess glutamate can be absorbed. However, overexpression of SIRT4 decreased glutamine synthetase (GS) levels. These results demonstrate that, by inhibiting GS, SIRT4 prevents glutamine formation, which will be converted to glutamate in neurons. SIRT4 prevents excitotoxicity via upregulating glutamate metabolism. Finally, our results may show that SIRT4 might prevent excitotoxicity and related cell death via reducing GS expression and upregulating GLT-1 and GDH levels. Therefore, it is important to develop therapeutics against excitotoxicity through SIRT4-related pathways in the cell.
Introduction
Glutamate is one of the major neurotransmitters in the central nervous system helping to regulate learning, memory, motor function, and synaptic plasticity. Glutamate is an excitatory amino acid stored in presynaptic vesicles. After the depolarization of the cell membrane and the increase of calcium concentration inside the cell, glutamate is released from the vesicles to the extracellular space. Secreted glutamate induces the glutamate receptors on postsynaptic neurons. Under normal conditions, glutamate is absorbed by the glutamate transporters residing on glial and neuronal cells. Excitotoxicity is caused by the accumulation of excess glutamate in the extracellular space. Excess glutamate is absorbed by the glutamate transporters, majorly by glutamate transporter 1 (GLT-1) expressed on astrocytes. 1 GLT-1 is internalized from the cell surface when there is no excess glutamate in the extracellular space and degraded in the cell via ubiquitination. 2 –4 Its surface expression probably increases when there is excitotoxicity. After being absorbed by the astrocytes, glutamate is either metabolized by glutamate dehydrogenase (GDH) and enters the tricarboxylic acid cycle (TCA) cycle or it is converted to glutamine by glutamine synthetase (GS). 5,6 Dysfunctional glutamate transport and cycle will lead to major diseases. Neuronal death caused by excitotoxicity occurs via apoptosis or necrosis. 7 Excessive Ca+2 and Na+ ions enter into cells via ion channels as a result of over-induction of glutamate receptors. Ca+2 will be released from mitochondria leading to necrosis. Endoplasmic reticulum stress might occur as a result of the Ca+2 influx.
Excitotoxicity is one of the major pathways related to brain diseases including neurodegeneration, stroke, epilepsy, trauma, and brain tumors. 8,9 Therefore, preventing excitotoxic effects will help to slow down these diseases. Primary brain tumor cells are mainly derived from glia and called glioma. The growth of glioma is prevented by the cranium and therefore gliomas grow by destroying the peritumoral normal brain tissue via an excitotoxic mechanism achieved by secreting excessive glutamate which will destroy neurons. This release of glutamate may be responsible for the partial seizures observed in glioblastoma patients. 10 Glioma cell lines are known to secrete excitotoxic levels of glutamate. 10,11
Kainic acid, which is a status epilepticus model in cells 12 and animals, 13 is an α-amino-3-hydroxy-5-methyl-4-isoxazolepropionic acid (AMPA)/kainate receptor agonist causing excitotoxicity. It causes seizure and elevated glutamate levels in synapse, resulting in neuronal death. Kainic acid is a glutamate analog which is 30 times more potent neurotoxin than glutamate. 13,14 It is a model of excitotoxicity exerting its effects on kainate receptors which belong to the group of ionotropic glutamate receptors. After the induction of these receptors via kainic acid, there is an increase in calcium concentration inside the cell leading to many excitotoxic effects which result in cell death. 13,14
Glia cells are known to express kainate receptors,
15
–17
and glioma cells were shown to actively express ionotropic glutamate receptors, including AMPA, kainate, and N-methyl-
Sirtuins are enzymes that posttranslationally modify proteins by deacetylation, ADP-ribosylation, and expressed in nucleus, mitochondria, or cytoplasm. 36 Sirtuins were shown to be related to metabolism, brain disease, and cancer. Sirtuin 4 (SIRT4) is a mitochondrial sirtuin which is expressed in the brain and ADP-ribosylates GDH. 37 In a previous study, it was shown that the absence of SIRT4 decreased the cell surface expression of GLT-1 and the glutamate uptake in brain. 38 In a following study, the SIRT4-interacting proteins were identified as HSC 71, calreticulin, 78-kDa glucose-regulated protein, and annexin A5 ve peroxiredoxin 1 using mass spectrometry. 39 Overexpression of SIRT4 represses GDH activity and as a result limits the metabolism of glutamate and glutamine to generate ATP. 40 Furthermore, a knockout mouse was generated by removing exons 1–3 of the SIRT4 gene. This mouse model exhibited approximately twofold increase in GDH activity in liver lysates confirming the role of SIRT4 in regulating GDH in vivo. 40
SIRT4 was demonstrated to be a glial protein in previous studies. 38,41 The tumor-suppressor function of SIRT4 was shown in mouse embriyonic fibroblasts (MEF) cells and mice. 42 The level of SIRT4 gene expression was shown to be lower in gastric cancer cells. 43 SIRT4 was shown to prevent growth in neuroblastoma tumor tissues, 44 and SIRT6 was demonstrated to prevent growth in glioma cell lines. 45 Recently, a general molecular pathway comprising C-terminal binding protein (CtBP)-SIRT4-GDH coordinating the metabolism of glucose and glutamine in cancer cells was proposed where this coordination was found to be related to CtBP repression activity on SIRT4 expression under high level of glucose but not low glucose level. 46
In this study, we wondered whether the overexpression of SIRT4 might prevent excitotoxicity. Here, we overexpressed SIRT4 in A172 glioma cell lines and then treated with kainic acid in order to induce excitotoxicity. We observed for the first time that SIRT4 overexpression increased the cell viability after kainic acid treatment. Our results may show that SIRT4 prevents excitotoxicity via modulating glutamate metabolism. Since sirtuins can be regulated by small molecules, this mechanism will be very important in developing drugs against excitotoxicity-related diseases in the future.
Materials and method
Cell culture
A172 is a human glioblastoma cell line obtained from ATCC (Virginia, USA). A172 cell line was chosen since it expresses GLT-1 at moderate levels and also is easy to transfect. The A172 cells were maintained in Dulbecco's modified Eagle medium (DMEM) with 10% Fetal Bovine Serum (FBS), 100 μg/ml penicillin/streptomycin, 2-mM
Kainic acid treatment
Kainic acid was dissolved in H2O. Control represents vehicle-treated cells. A172 cells were treated with 10-, 50-, 200-, 500-, and 1000-μM kainic acid for 24 h.
MTT cell viability assay
3-(4,5-Dimethylthiazol-2-yl)-2,5-diphenyltetrazolium bromide (MTT) cell viability assay (Biotum) is a standard test to determine the number of living cells. MTT is a tetrazolium salt metabolized by living cells and converted to purple formazan crystal. The crystals are dissolved in DMSO, and the absorbance is measured at 570 nm. The assay was performed according to the manufacturer’s guidelines in the protocol.
Transfection
A172 cells were transfected with lipofectamine transfection reagent (Thermo Fisher Scientific, Waltham, MA, USA) according to the manufacturer’s protocol using SIRT4 plasmid (OriGene, Rockville, MD, USA).
Glutamate assay
Glutamate-Glo assay (Promega, Madison, WI, USA) is a bioluminescent assay for selective and sensitive detection of glutamate in a biological sample. The assay couples glutamate oxidation and NADH production with a bioluminescent NADH detection system and does not measure glutamic acid in the structure of peptides or proteins. The assay was performed according to the manufacturer’s guidelines in the protocol to measure the secreted glutamate in the cell culture medium, and the measurement was conducted using a luminometer.
Western blotting
The total protein was isolated from the whole cell extracts before and after kainic acid treatment using radioimmunoprecipitation assay (RIPA) lysis buffer according to the manufacturer’s guidelines (VWR International, Solon, OH, USA). Protease and phosphatase inhibitors (MedChem Express-100×, New Jersey, USA) were added to the buffer. Cell extracts were loaded onto 4–15% gradient sodium dodecyl sulfate-polyacrylamide gel electrophoresis (SDS-PAGE) gels (BioRad, Hercules, CA, USA) after incubating with 5× SDS-PAGE sample loading buffer (NZYTech, Lisboa, Portugal) at 95°C for 5 min. Proteins were immunoblotted with anti-GLT-1 (Elabscience), anti-GS (Elabscience, Bethesda, MD, USA), anti-GDH (Elabscience), and anti-SIRT4 (Bioassay Technology Laboratory, Shanghai, China) antibodies at 1:1000 concentration and with anti-tubulin (Elabscience) and anti-glyceraldehyde 3-phosphate dehydrogenase (GAPDH) (Cell Signaling, Danvers, MA, USA) antibodies at 1:5000 concentration. The membranes were then probed with horseradish peroxidase-conjugated secondary antibodies (Elabscience) and developed with enhanced chemiluminescence Western blotting substrate (Thermo Scientific). Blots were exposed to HyBlot autoradiography film or visualized with detection system. The protein bands were quantified using the densitometry analysis in ImageJ software (NIH, Washington, DC, USA).
Statistics
All the statistical analyses were performed using statistical software (GraphPad Software, Inc., San Diego, California, USA). Namely, “unpaired, one-tail, equal variance, and two-sample t-test” was performed using Prism 5 software. Additionally, two-way analysis of variance (ANOVA) test with column analysis was used for the graphs of glutamate assay. For MTT, one-way ANOVA with a Dunnett’s post hoc test was applied. A value of p < 0.05 was accepted as significant. Error bars in figures represent standard error of the mean.
Results
Kainic acid treatment leads to a reduced cell viability in glioma cells
To establish an excitotoxicity model with kainic acid, we treated A172 glioma cells with kainic acid and analyzed cell viability using MTT assay (Figure 1). We treated A172 cells with 10-, 50-, 200-, 500-, and 1000-μM kainic acid for 24 h and observed a significant decrease in cell viability starting with 200-μM concentration (Figure 1). These results showed that kainic acid-induced excitotoxicity leads to the lowest cell viability at 1000-μM concentration after 24-h treatment when compared to control. Therefore, we used 1000-μM kainic acid concentration in the following experiments.

The effect of kainic acid on cell viability. Cell viability was measured using an MTT assay. The absorbance at 570 nm indicating the cell viability is expressed as relative arbitrary units. One-way ANOVA with Dunnett’s post hoc test was carried out. The values significantly different from the relative controls are indicated with α, β, and ε indicating 95% CI of difference 0.01692 to 0.1557 for control versus 200 μM (α), 0.03899 to 0.1777 for control versus 500 μM (β), and 0.05399 to 0.1927 for control versus 1000 μM (ε). C shows control cells. Error bars in figures represent standard error of the mean. MTT: 3-(4,5-dimethylthiazol-2-yl)-2,5-diphenyltetrazolium bromide; ANOVA: analysis of variance; CI: confidence interval.
Overexpression of SIRT4 increased cell viability after kainic acid treatment
We first overexpressed SIRT4 via transfection with lipofectamine using SIRT4 plasmid and observed a significant increase in SIRT4 protein levels (Figure 2(a)). We then treated SIRT4-transfected and control cells with 1000-μM kainic acid for 24 h (Figure 2(b)). We observed that kainic acid treatment leads to a significant decrease in cell viability. However, overexpression of SIRT4 reduced the kainic acid-induced decrease in cell viability. SIRT4 might have increased the cell viability after kainic acid treatment via preventing excitotoxicity. Overexpression of SIRT4 alone did not affect cell viability (Figure 2(b)).
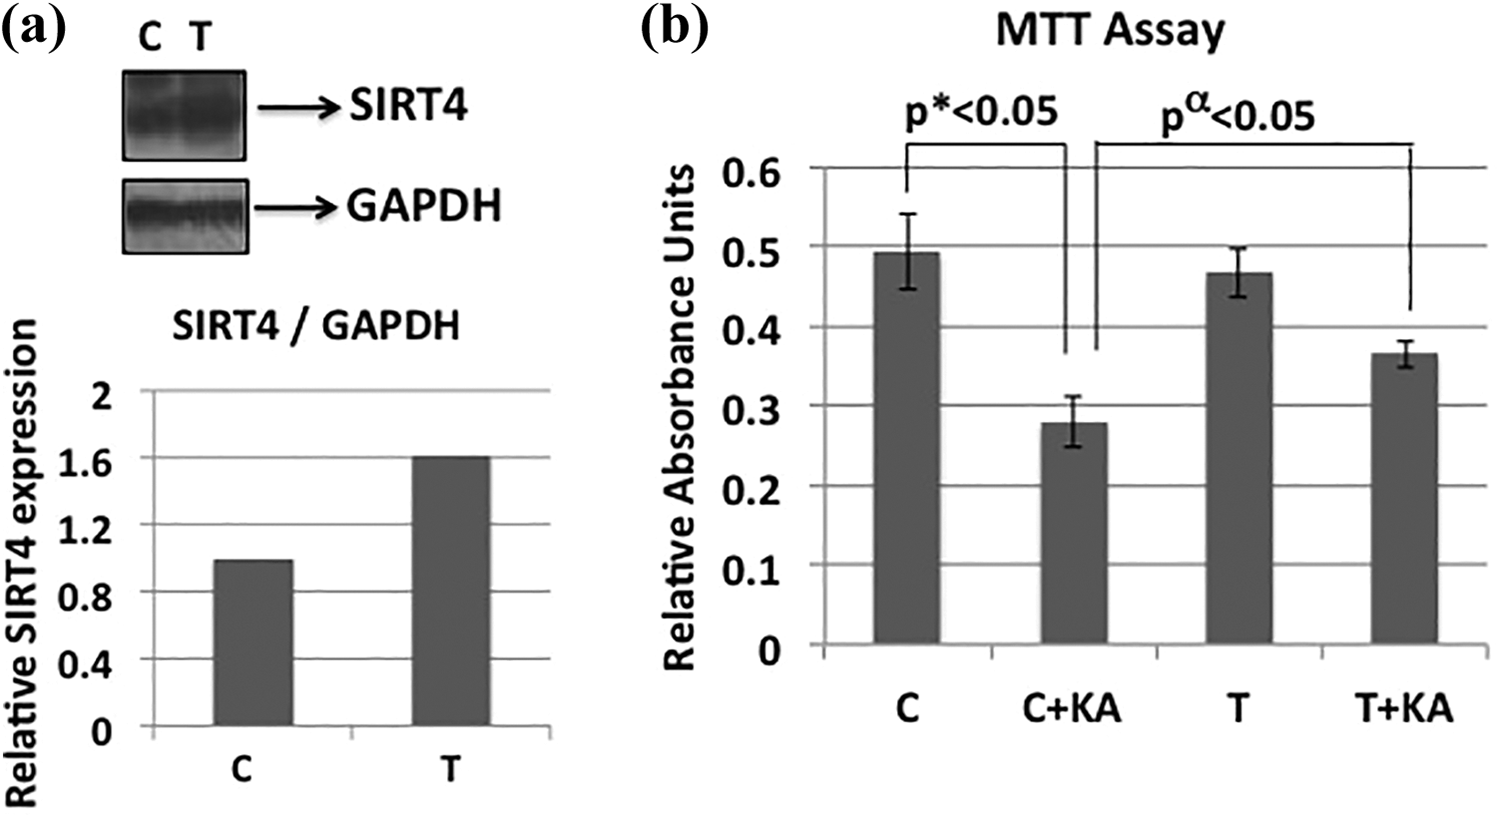
SIRT4 overexpression in glioma cells increased cell viability. (a) SIRT4 is overexpressed in glioma cells via transfection. Western blot shows the increase in SIRT4 protein levels. GAPDH is used as a loading control. Relative protein levels were quantified using Image J program (NIH) and shown below the gel. (b) MTT assay showing the cell viability after SIRT4 transfection and kainic acid treatment (1000 μM for 24 h). Unpaired, one-tail, equal variance, and two-sample t-test was carried out. C versus T (p = 0.3328). The values significantly different from the relative controls are indicated with ∗, α showing p < 0.05. C versus C+KA (p* = 0.0047); C+KA versus T+KA (p α = 0.0260). Error bars in figures represent standard error of the mean. SIRT4: sirtuin 4; MTT: 3-(4,5-dimethylthiazol-2-yl)-2,5-diphenyltetrazolium bromide; C: control glioma cells; T: SIRT4-transfected glioma cells; C+KA: kainic acid-treated control cells; T+KA: kainic acid-treated and SIRT4-transfected cells.
Overexpression of SIRT4 decreased excitotoxic effects after kainic acid treatment
We performed glutamate assay to measure the excess glutamate released in control and SIRT4-overexpressed A172 cells (Figure 3(a)). We treated control A172 cells and SIRT4-overexpressed A172 cells with 1000-μM kainic acid, collected the cell culture media at certain time points such as 0, 12, 24, and 48 h, and measured the released glutamate with the glutamate assay (Figure 3(a)). At 0-h time point, kainic acid was added. This means kainic acid treatment went on for 48 h, and at 0-, 12-, 24-, and 48-h time points, secreted glutamate in the medium was measured with the assay.

The measurement of secreted glutamate levels via glutamate assay in glioma cells. (a) The excess glutamate levels were measured from the cell media of control cells (C), SIRT4-transfected cells (T), kainic acid-treated control cells (C+KA), and kainic acid-treated and SIRT4-transfected cells (T+KA). 0 h is the time point when kainic acid treatment is started. The measurements are taken at 0, 12, 24, and 48 h. The secreted glutamate is displayed as relative luminescence units. Two-way ANOVA with group analysis was carried out. The values significantly different from the relative controls are indicated with ∗, α showing p < 0.05. C versus C+KA (p* = 0.0314), C+KA versus T+KA (p α = 0.0185), C versus C+T (p = 0.832), T versus T+KA = 0.9691. Error bars in figures represent standard error of the mean. (b) The graph in (a) is shown after changing the axis. By this way, the groups are shown according to the time points for an easier comparison of groups. SIRT4: sirtuin 4; ANOVA: analysis of variance.
Four groups were employed in this assay: control cells (C), SIRT4-transfected cells (T), kainic acid-treated control cells (C+KA), and kainic acid-treated and SIRT4-transfected cells (T+KA). When treated with kainic acid, the glutamate released at all time points including 12, 24, and 48 h was significantly decreased compared to the control cells (C vs. C+KA, Figure 3(a)). Since kainic acid treatment leads to cell death and the existing cell number is reduced, the released glutamate was decreased after kainic acid treatment in control cells at every time point such as 12, 24, and 48 h (C vs. C+KA, Figure 3(a)). SIRT4 overexpression alone did not have an effect on glutamate release without kainic acid treatment (C vs. T not significant according to group analysis with two-way ANOVA, Figure 3(a)). However, when we compared kainic acid-treated control cells with kainic acid-treated and SIRT4-transfected cells (C+KA vs. T+KA, Figure 3(a)), we observed that the released glutamate at 12- and 24-h time points was increased with SIRT4 overexpression indicating the increase in cell number and viability. On the other hand, the glutamate levels were similar at 48-h time point (C+KA vs. T+KA, Figure 3(a)). Statistically, group analysis with two-way ANOVA showed a significant increase in glutamate assay with kainic acid-treated and SIRT4-transfected cells compared to kainic acid-treated control cells (C+ KA vs. T+KA, Figure 3(a)). However, group analysis with two-way ANOVA did not show a significant difference between SIRT4-transfected and SIRT4-transfected and kainic acid-treated cells. Glutamate release is higher at 24-h time point in SIRT4-transfected and kainic acid-treated cells indicating a higher cell viability. However, this release was lower at 48-h time point (C+ KA vs. T+KA, Figure 3(a)).
When we analyzed the same graph while grouping according to the time points, we can easily see that there is no significant difference between the glutamate released by control cells or transfected cells without kainic acid treatment at all time points (Figure 3(b)). However, at 24-h time point, kainic acid-treated and SIRT4-transfected cells release more glutamate than kainic acid-treated cells. This difference is no longer present at 48-h time point (Figure 3(b)).
These results show that SIRT4 overexpression may prevent excitotoxic cell death caused by kainic acid treatment. We were then interested to analyze the expression levels of key players of glutamate pathway such as GLT-1, GS, and GDH.
We think that since 0-h time point was the point when kainic acid was added, the decrease of glutamate at all time points in kainic acid-treated cells compared to controls is the reason for cell death. Since there is a fewer number of cells, less glutamate is secreted.
GLT-1, GDH, and GS protein levels are changed with SIRT4 overexpression and kainic acid treatment
We analyzed the protein levels of GDH, GS, and GLT-1 in four different experiment groups: control cells (C), kainic acid-treated cells (C+KA), SIRT4-transfected cells (T), and SIRT4-transfected and kainic acid-treated cells (T+KA) with two independent experiments. We observed that SIRT4-transfection alone increased the GLT-1 levels (Figure 4(a) and (b)). In addition, kainic acid treatment alone increased GLT-1 and GDH levels. Finally, GLT-1 and GDH levels were also increased in the presence of kainic acid treatment and SIRT4 transfection together (Figure 4(a) and (b)). This might be due to the fact that the excitotoxicity caused by the kainic acid leads to an automatic increase in the level of these enzymes which help to absorb excess glutamate. In addition to that, SIRT4 also increases the protein expression of these enzymes which lead to the reduction of excitotoxicity.

The protein expression levels of GLT-1, GDH, and GS in glioma cells. (a) The Western blots of two independent experiments showing the protein levels of GLT-1, GDH, and GS in control cells (C), SIRT4-transfected cells (T), kainic acid-treated control cells (C+KA), and kainic acid-treated and SIRT4-transfected cells (T+KA). Tubulin is used as a loading control. (b) Relative GLT-1, GS, and GDH protein levels were quantified using Image J program (NIH), and the average of two independent experiments was used to make the graphs. Error bars in figures represent standard error of the mean. GLT-1: glutamate transporter 1; GDH: glutamate dehydrogenase; GS: glutamine synthetase; SIRT4: sirtuin 4.
Interestingly, GS levels were decreased after SIRT4 transfection alone (Figure 4(a) and (b), C vs. T). GS did not increase after kainic acid treatment as GDH and GLT-1 did (Figure 4(a) and (b), C vs. C+KA); when SIRT4-transfected cells were treated with kainic acid, GS levels were increased moderately compared to SIRT4-transfected cells (Figure 4(a) and (b), T vs. T+KA). This clearly indicates that SIRT4 might decrease GS expression. Additionally, when excitotoxicity is induced by kainic acid, GS levels also slightly decrease after SIRT4 transfection (Figure 4(a) and (b), C+KA vs. T+KA).
This result in Figure 4 shows that after excitotoxicity is induced by kainic acid treatment, the levels of the elements of glutamate metabolism such as GLT-1 and GDH were automatically increased as a response to take up and metabolize glutamate. Additionally, overexpression of SIRT4 also increased GLT-1 levels. However, GS did not increase after kainic acid treatment as a response. SIRT4 might be indirectly controlling glutamate formation by decreasing GS levels, since synthesized glutamine by GS is converted to glutamate in neurons. This cycle has to be slowed down until the excess glutamate is cleared (Figure 5).
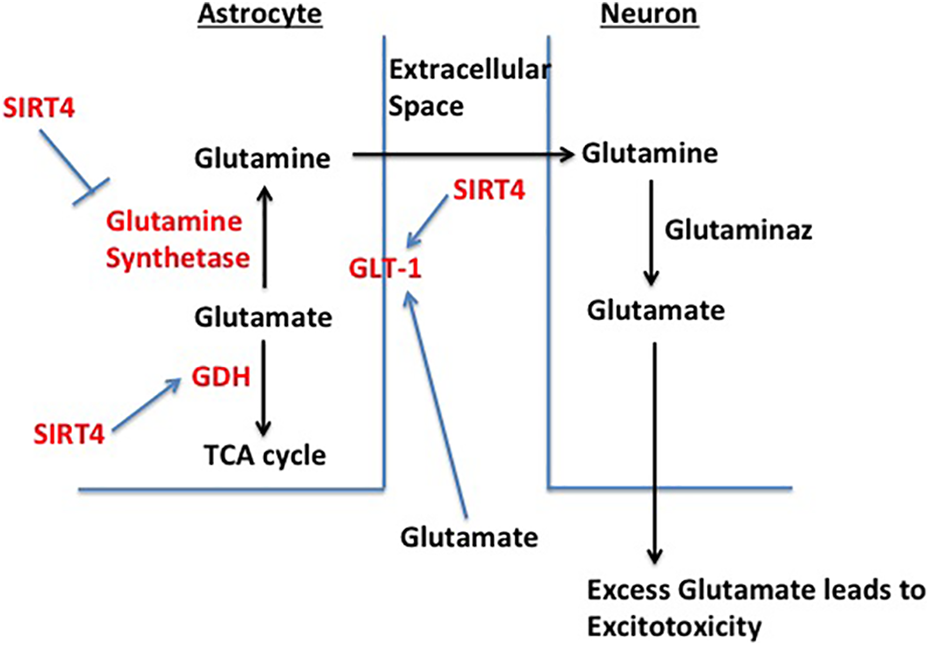
A model describing the effect of SIRT4 on glutamate metabolism. When there is an increase in extracellular glutamate as a result of an excitotoxic insult, the expression levels of GLT-1 and GDH automatically increase to metabolize the glutamate. Excess glutamate is absorbed by GLT-1 and metabolized by GDH and GS. SIRT4 upregulates GLT-1 and GDH expression levels helping to reduce the excitotoxicity. In addition, SIRT4 inhibits GS to indirectly prevent further glutamate formation. Therefore, SIRT4 might prevent excitotoxicity via upregulating glutamate metabolism. SIRT4: sirtuin 4; GLT-1: glutamate transporter 1; GDH: glutamate dehydrogenase; GS: glutamine synthetase.
Discussion
In this study, we overexpressed SIRT4 in A172 glioma cell line and then treated the cells with 1000-μM kainic acid, a major excitotoxin, for 24 h (Figures 1 and 2). We observed that overexpression of SIRT4 increased the cell viability in A172 glioma cells after kainic acid treatment (Figure 2). In a previous study, it was shown that kainic acid-treated SIRT4 knockout mice displayed lower surface expression of GLT-1 than kainic acid-treated wild type mice. 38 Therefore, kainic acid-treated SIRT4 knockout mice displayed increased seizures and decreased glutamate uptake after kainic acid administration. Since our study investigates the effect of the overexpression of SIRT4, we expected the opposite phenotype where SIRT4 protects against excitotoxicity and its related effects.
We measured the secreted glutamate levels at 0, 12, 24, and 48 h. Kainic acid treatment led to cell death, and therefore, the number of living cells was reduced. For this reason, the glutamate released decreases significantly after kainic acid treatment in control cells at every time point, including 12, 24, and 48 h (Figure 3(a), C vs. C+KA). SIRT4 overexpression alone did not have an effect on glutamate release (Figure 3(a), C vs. T) indicating that SIRT4 is a stress-response and survival gene. Therefore, SIRT4 mostly exerts its effects when there is a stress condition.
On the other hand, when we compared kainic acid-treated control cells with kainic acid-treated and SIRT4-transfected cells, we observed that the released glutamate at 12- and 24-h time points was elevated with SIRT4 overexpression showing an increase in living cells (Figure 3(a), C+KA vs. T+KA). However, the glutamate levels were similar at 48-h time point. The reason for this could be the fact that after 48-h exposure to kainic acid, the overexpression of SIRT4 and its downstream effects might not be adequate to rescue the cells from excitotoxicity (Figure 3). Measuring the glutamate at earlier time points might help to catch the cells before death and to be able to measure the glutamate release before the cell viability decreases. Another possibility would be to use a lower kainic acid concentration where the cell death might be delayed, and it would be possible to measure the accumulated glutamate before the cell viability decreases.
We think that SIRT4 might be indirectly controlling glutamate formation by decreasing GS levels, since synthesized glutamine by GS is converted to glutamate in neurons (Figure 5). SIRT4 also controls and prevents excitotoxic conditions by upregulating GLT-1 and GDH levels which metabolize and therefore reduce glutamate levels. When there is excess glutamate already being released, this cycle has to be slowed down until the excess glutamate is cleared (Figure 5). Additionally, when there is excess glutamate, more glutamate will be absorbed and pumped into TCA cycle via GDH or to glutamine via GS. However, GS is the only way to control the production of glutamine, which is converted to glutamate via glutaminase in neurons. For this reason, by decreasing GS levels, SIRT4 indirectly reduces the possibility to generate more glutamate when there is already excess glutamate (Figure 5).
In our study, we measured the expression of enzymes via Western blotting. By overexpressing SIRT4, we observed differences in the expression of GLT-1, GS, and GDH proteins and also differences in cell viability and glutamate assay. Therefore, we think that SIRT4 overexpression might have showed an effect due to the regulation of the expression of GLT-1, GS, and GDH. This result does not rule out the fact that SIRT4 does have an effect on the activities of these enzymes. If we had not observed an effect on the expression of these proteins, then we would have measured the activities. Since we observed the change in the expressions, we did not need to measure the activity. GLT-1 is a transporter, therefore, its activity is measured with the glutamate uptake, which we had performed in our previous study. 38 GDH activity can be measured with an enzyme assay. However, after we observed a phenotype with SIRT4 overexpression in cell viability, glutamate levels, and the expressions of GS, GDH, and GLT-1, we did not measure the activities. However, this will not rule out the fact that SIRT4 does affect the activities of GDH, GS, and GLT-1.
SIRT4 was shown to have tumor-suppressive roles by numerous studies, 42 –44 and SIRT6 was demonstrated to prevent growth in glioma cell lines. 45 One of these studies showed that SIRT4 has tumor-suppressive activity and regulates the cellular metabolic response to DNA damage by inhibiting mitochondrial glutamine metabolism. 42 SIRT4 contributes to this stress response induced by genotoxic stress via repressing glutamine entry into TCA cycle. SIRT4 was found to inhibit glutaminase enzyme that converts glutamine to glutamate, which is metabolized to α-ketaglutarate by GDH. SIRT4’s response to genotoxic stress was to inhibit glutaminase. In our study, as a result of an excitotoxic stress caused by kainic acid, SIRT4 was found to repress GS. If SIRT4 would inhibit glutaminase as a result of excitotoxic stress, this would have fit to our model since inhibiting glutaminase would decrease the glutamate produced therefore reducing the glutamate secreted and accumulated (Figure 5).
Since sirtuins are stress response enzymes supporting survival, SIRT4 levels might have increased after an excitotoxic insult to the tissue. We actually showed in our previous study that SIRT4 protein levels are elevated after kainic acid exposure in the hippocampal tissue of mouse brain. 38 Therefore, we think that, in this study, the reason that GLT-1 and GDH levels increase after kainic acid treatment in glioma cells might be the internal increase of SIRT4 levels.
A previous study showed that GDH is an oncogenic factor in vitro and in vivo and inhibiting GDH by SIRT4 overexpression is a tumor-suppressive effect. Therefore, overexpression of SIRT4 attenuated cancer cell proliferation and tumor growth in vitro and in vivo. These findings shed a light that GDH is a new potential target for treatment of human glioma. 47
In the future research for excitotoxicity-related diseases such as neurodegeneration, stroke, epilepsy, or brain tumors, 48 investigations for therapeutics should definitely include glutamate metabolism and SIRT4. Sirtuins are enzymes that can be manipulated by small molecules. 49 Therefore, it will be interesting to develop therapeutics against excitotoxicity through SIRT4-related pathways in the cell.
Footnotes
Declaration of conflicting interests
The author(s) declared no potential conflicts of interest with respect to the research, authorship, and/or publication of this article.
Funding
The author(s) disclosed receipt of the following financial support for the research, authorship, and/or publication of this article: This study was funded by Turkish Scientific and Research Council (TUBITAK) (3001 Project number: 118S780).