
Abstract
The objective was to describe the prevalence of derangement of the partial pressure of arterial carbon dioxide (PaCO2) and to determine the association between PaCO2 and adverse cardiovascular events (ACVEs) in carbon monoxide (CO)-poisoned patients. Additionally, we evaluated whether the derangement of PaCO2 was simply secondary to metabolic changes. This retrospective study included 194 self-breathing patients after CO poisoning with an indication for hyperbaric oxygen therapy and available arterial blood gas analysis at presentation and 6 h later. The incidence rate of hypocapnia at presentation after acute CO poisoning was 67.5%, and the mean PaCO2 during the first 6 h was 33 (31–36.7) mmHg. The most common acid–base imbalance in 131 patients with hypocapnia was primary respiratory alkalosis. The incidence rate of ACVEs during hospitalization was 50.5%. A significant linear trend in the incidence of ACVEs was observed across the total range of PaCO2 variables. In multivariate regression analysis, mean PaCO2 was independently associated with ACVEs (odds ratio 0.051; 95% confidence interval 0.004–0.632). PaCO2 derangements were common after acute CO poisoning and were not explainable as a mere secondary response to metabolic changes. The mean PaCO2 during the first 6 h was associated with ACVEs. Given the high incidence of ACVEs and PaCO2 derangement and the observed association between the mean PaCO2 and ACVEs, this study suggests that (1) PaCO2 should be monitored in the acute stage to predict and/or prevent ACVEs and (2) further investigation is needed to validate this result and explore the early manipulation of PaCO2 as a treatment strategy.
Introduction
Cardiovascular complications, encompassing cardiomyopathy, myocardial infarction, myocardial stunning, left ventricular dysfunction, arrhythmias, heart failure, and cardiogenic shock up to cardiac arrest are common in moderate to severe carbon monoxide (CO) poisoning. 1 The incidence of myocardial injury ranged from 37% to 59.5% in moderate to severe CO poisoning treated with hyperbaric oxygen (HBO). 2,3 Low ejection fraction and abnormal left ventricular function were confirmed in 33% of CO poisoning. 4 Because sustained myocardial injury after CO poisoning is associated with increased short-term and long-term mortality and neurologic sequelae, the importance of preventive measures and early recognition is appreciated. 2,3
It is well-known that the partial pressure of arterial carbon dioxide (PaCO2) can have a profound influence on coronary blood flow and myocardial contractile function in both physiologic and pathophysiologic situations. Hypercapnia increased myocardial blood flow by the direct coronary vasodilating effect. 5 It also causes vasoconstriction in the pulmonary circulation, which can result in afterload stress and reduced right ventricular performance in postcoronary artery bypass graft patients. 5 Hypocapnia has the opposite effects of hypercapnia, that is, coronary vasoconstriction and a decrease in coronary blood flow. In ischemic cardiomyocytes, hypocapnic reperfusion significantly increased cell death and reactive oxygen species. 6
In CO poisoning, PaCO2 can be altered by stimulation of the peripheral chemoreceptors due to hypoxia-induced carboxyhemoglobin formation, by stimulation of nociceptors and pulmonary receptors due to pulmonary edema or pneumonia, by central respiratory center-induced neurologic damage, or by a compensatory response to metabolic changes. In a study, the initial level of PaCO2 was found to be lower than 35 mmHg in all of the enrolled 83 CO-poisoned patients (65 patients with the need for HBO therapy and 18 patients without the need for HBO therapy after acute CO poisoning). 7 In animal studies, the minute volume and respiratory rate increased until the blood level of COHb was somewhere between 50% and 60%, and both then fell rapidly toward apnea. 8 The mean value of PaCO2 remained at lower than 35 mmHg within the 40–80% range of COHb after acute CO poisoning. 8 Hypocapnia was observed in rats after exposure to 2700 ppm CO in the air for 1 h. 9
To date, little has been devoted to the influence that PaCO2 may have on the cardiovascular outcomes of CO-poisoned patients, despite an appreciation of the impact of PaCO2 on the cardiovascular system and the prevalence of derangement of PaCO2 and cardiovascular complications after CO poisoning in previous data.
The objective of this study was to describe the prevalence of PaCO2 derangement and its change over time after acute CO poisoning and to determine the association between PaCO2 and adverse cardiovascular events (ACVEs) among CO-poisoned patients.
Additionally, we investigated whether the derangement of PaCO2 simply reflects the severity of metabolic acid–base imbalance in CO poisoning and attempted to determine the most influential causative factor for PaCO2 derangement other than acid–base imbalance.
Methods
Study design and setting
This study is a retrospective, observational study performed via chart review at a single academic tertiary care center with an annual emergency department (ED) census of 40,000 patients. The study design was approved by the Institutional Review Board of Chonnam National University Hospital.
Participant selection
The inclusion criteria for this study were as follows: patients 18 years or older who presented to our ED with CO poisoning within 24 h between January 2015 and February 2018 and who had an indication for HBO therapy at ED presentation. Additionally, patients did not require mechanical ventilation (MV) support during hospitalization and had to have an available result of arterial blood gas analysis (ABGA) at presentation and at first 6 h after presentation. Because MV support could influence PaCO2, which was the focus of this study, only patients who spontaneously breathed were selected. Because the mean lag time to troponin I elevation to diagnostic cutoff value of myocardial injury after ED presentation was 5.9 h in CO-poisoned patients without evident myocardial injury at presentation 10 and ACVEs tended to develop within a few hours after acute CO poisoning, 11 the first 6 h was selected as a time point to calculate the mean value of PaCO2.
Two trained physicians who were blinded to the patient outcomes determined whether the patients met the definition of CO poisoning, the indications for HBO therapy for CO poisoning, the available reports of ABGAs, and the presence of any exclusion criteria. CO poisoning was defined as a history of exposure to CO and an initial COHb level exceeding 5% (10% in smokers) at our ED or the primary hospital. The indications for HBO for nonpregnant patients were defined as the presence of any neurological deficit, including loss of consciousness and seizure, and a COHb level greater than 25% regardless of symptoms. The exclusion criteria were pregnancy, a history of coronary artery disease, a history of chronic lung disease, death upon arrival or at the scene, mixed poisoning with other drugs, discharge against the doctor’s orders, transfer before the final outcome was determined, and treatment using a protocol that did not adhere to our hospital’s guidelines for CO poisoning (Figure 1).

Study flow diagram. Indication for HBO therapy (*) was defined as having any neurological deficits, including loss of consciousness and seizure, and a COHb level above 25% regardless of symptoms. HBO: hyperbaric oxygen.
Our hospital’s HBO therapy consists of 100% oxygen with increasing absolute pressures (from 1.0 ATA to 2.8 ATA) for 20 min, 2.8 ATA for 40 min, and decreasing absolute pressures (from 2.8 ATA to 1.0 ATA) for 20 min. If the indication for HBO therapy does not resolve after one HBO session, an additional session is provided. The maximum number of HBO sessions within 24 h after presentation is three. When a patient with indications for HBO requires MV or a vasopressor infusion due to refractory hypotension, the patient is treated with MV at a fraction of inspired oxygen level of 1.0 instead of HBO.
Data collection
The following data were directly collected from electronic medical records (EMR): age; sex; laboratory results including ABGA, COHb, white blood cell (WBC) count, C-reactive protein (CRP), creatinine (Cr), creatine kinase (CK), and troponin I; and hospital duration. Because serum troponin I levels were measured with an analytical range of 0.015–40 ng/ml in our institution, a troponin I level > 0.015 ng/ml was accepted as detectable. The following information was collected by reviewing patient medical records: comorbidities, source of CO, duration of CO exposure, intentionality of CO exposure, time interval from the last CO exposure to arrival at our ED, Glasgow Coma Scale (GCS) score and vital signs at presentation, corrected QT (QTc) interval at presentation, the result of chest X-ray at presentation, time interval between arrival at ED and examination of brain diffusion-weighted imaging (DWI), brain DWI results at presentation, time interval between arrival at the ED and initiation of the first HBO session, the number of HBO session within first 24 h after presentation, and data for the clinical course (the fluid administered during the first 6 h of admission, the development of complications during hospitalization, in-hospital mortality, and the duration of hospitalization). Chest X-ray and DWI were interpreted by radiologists who were blinded to this study. The prolongation of QTc was defined as an interval ≥ 470 ms regardless of sex. 12 The investigated complications included cardiac injury, hypotension (systolic blood pressure (BP) < 90 mmHg during the first 6 h of admission), ventricular dysrhythmia (ventricular tachycardia, fibrillation, or torsade des pointes), acute kidney injury (increase in Cr ≥ 0.3 mg/dl within 48 h or ≥ 50% within 7 days), rhabdomyolysis (CK level higher than five times the normal range (>875 U/l), in-hospital cardiac arrest, and discharged with altered mentality (GCS score ≤ 14). The cardiac injury was defined as troponin I > 0.04 ng/ml during hospitalization. The 99th percentile of the normal reference population was designated as the cutoff value of troponin I to define cardiac injury. 10 In the case of hypotension, the need for intravenous vasopressor infusion to maintain BP (the definition of shock) was assessed.
ABGA and variables
Arterial blood was collected by a heparin flushed syringe and sent to the hospital clinical laboratory immediately for analysis. RAPIDLab 1265 (Siemens, Munich, Germany) was used for ABGA. Oxygen treatment for acute CO poisoning was complicated due to symptomatic CO2 retention in patients without a history of formally diagnosed lung disease. 13 Therefore, to ensure that respiratory acidosis due to undiagnosed lung disease does not develop during oxygen therapy, in particular, in patients with a smoking history, ABGA is examined at presentation and during treatment until complement of oxygen (normobaric or HBO) therapy.
The ABGA was retrieved at presentation and at first 6 h from EMR after presentation. If ABGA was not available during the first 6 h, ABGA was used 6 ± 2 h after presentation. If there were other available ABGAs within the first 6 h, these ABGAs were also collected. Mean PaCO2 during the first 6 h after presentation was calculated. Hypocapnia, normocapnia, and hypercapnia were defined as PaCO2 < 35, 35 ≤ PaCO2 < 45, and PaCO2 ≥ 45 mm Hg, respectively. Only one patient had a hypercapnia at presentation (PaCO2 = 47 mmHg), and this patient was excluded from this study.
To investigate whether the derangement of PaCO2 was only a secondary response to metabolic acid–base imbalance, the acid–base status of ABGA at presentation was evaluated by a stepwise approach following rules. 14,15 Step 1: pH was classified as acidemic (<7.4) or alkalemic (>7.4). Step 2: If arterial pH and PaCO2 moved in opposite directions, the disorder was a respiratory disorder with a compensatory metabolic response. If arterial pH and PaCO2 moved in the same direction, the result was a metabolic disorder with a compensatory respiratory response. Step 3: compensation was evaluated by the rule of compensation. For formulation of the compensatory response of metabolic acidosis, expected PaCO2 = [1.5 × HCO3 −] + 8 ± 2; for metabolic alkalosis, expected PaCO2 = [0.7 × HCO3 −] + 21 ± 2. For respiratory acidosis, expected bicarbonate = 24 + 1× [PaCO2 − 40] / 10; for respiratory alkalosis, expected bicarbonate = 24 + 1× [PaCO2 − 40] / 10. A disagreement between the observed PaCO2 or bicarbonate with the expected value implied a mixed disorder.
Primary outcomes
The primary outcome was ACVEs during hospitalization. An ACVE was defined by at least one of the following criteria: cardiac injury, shock, ventricular dysrhythmia, or in-hospital cardiac arrest. 16
Data analysis
Patients were classified into two groups based on the development of ACVEs during hospitalization: the ACVE group and the non-ACVE group. Descriptive statistics used proportions, means and standard deviations, and medians and interquartile ranges. For continuous variables, Student’s t test or the Mann–Whitney test was used for comparisons between two groups, according to the normality of the data, which was tested using the Shapiro–Wilk test. A paired t test was used to determine significant changes in the PaCO2 over 6 h. For categorical variables, the χ2 test was used.
To identify influential causative factors of PaCO2 derangement, the correlations of PaCO2 with oxygenation-related parameters (COHb, PaO2, and arterial oxygen content), central nervous system (CNS)-related parameters (initial GCS and DWI results), and a pulmonary-related parameter (initial chest X-ray finding) were evaluated using the Pearson correlation coefficient or χ2 test.
To examine whether an association between selected PaCO2 and outcome existed, the development of ACVEs was graphed across ranges of selected PaCO2 (25 < PaCO2, 25 ≤ PaCO2 < 30, 30 ≤ PaCO2 < 35, 35 ≤ PaCO2 <45 mmHg). This graph was inspected to assess whether significant linear trends in the incidence of ACVEs existed using the χ2 test for linear trend.
For the analysis of each of the PaCO2 variables, a multivariate logistic regression model using the entering technique was applied to significant factors obtained in the univariate analysis and PaCO2 variables (PaCO2 at presentation and mean PaCO2 during the first 6 h after presentation). The influential factors affecting PaCO2 that showed a significant correlation with PaCO2 were also entered into the regression model regardless of their significance in univariate analysis to exclude their confounding effect on the outcome. To render the clinical application of the model easy, the PaCO2 variables were entered into the regression model as a type of ordinal variables using optimal cutoff values obtained by receiver operating characteristic curve analysis and the Youden index. Before modeling, if two or more univariate variables retained in the multivariate analysis were highly correlated in the linear regression analysis, one variable was removed to avoid collinearity. Estimated odds ratios and 95% confidence intervals were calculated for all significant variables.
A p value < 0.05 was considered statistically significant. All statistical analyses were performed using SPSS 21.0 (SPSS, Chicago, Illinois, USA).
Results
The baseline characteristics of 194 patients according to the development of ACVEs during hospitalization after acute CO poisoning are given in Table 1. The mean age of patients was 44 years, and ACVEs occurred in 50.5% of patients. Hypocapnia (PaCO2 < 35 mmHg) at presentation was observed in 67.5% of the spontaneously self-breathing patients after acute CO poisoning, and the range of the mean PaCO2 during the first 6 h was 18.3–43.1 mmHg.
Baseline characteristics and clinical courses of 194 patients stratified according to the development of ACVEs.

ACVE: adverse cardiovascular event; CO: carbon monoxide; ED: emergency department; BP: blood pressure; GCS: Glasgow Coma Scale; PaCO2: partial pressure of arterial carbon dioxide; WBC: white blood cell; CRP: C-reactive protein; Cr: creatinine; QTc: corrected QT; DWI: diffusion-weighted imaging; HBO: hyperbaric oxygen; AKI: acute kidney injury.
a Time interval between arrival at ED and initiation of the first HBO.
At presentation, the ACVE group was older and had longer durations of CO exposure and the interval from the end of exposure to the arrival at our ED than the non-ACVE group. The ACVE group also had lower levels of arterial pH and HCO3 −; higher levels of WBCs, CRP, and Cr; and a higher frequency of detectable troponin I, prolonged QTc interval on electrocardiogram, and abnormal DWI than the non-ACVE group. The ACVE had longer hospital stays than the non-ACVE group.
The ACVE group had a significantly lower PaCO2 at presentation and mean PaCO2 during the first 6 h than the non-ACVE group.
In both the ACVE group and the non-ACVE group, those with PaCO2 in the range of hypocapnia at presentation experienced significant increases of 3 (0–5.9) (p < 0.001) and 3.2 (1.9–7.1) mmHg (p < 0.001) over the course of the 6 h after presentation, respectively. However, despite completing at least one session of HBO and normalizing the COHb level in all of the 131 patients with hypocapnia at presentation and despite the persistence of altered consciousness in only 10% of the patients after 6 h, the PaCO2 in 79 (60.3%) of the total 131 patients remained in the range of hypocapnia at 6 h after presentation (Figure 2). However, PaCO2 which was in the range of normocapnia at presentation in the two groups did not significantly change.

The change in PaCO2 over the 6 h after presentation stratified according to the development of ACVEs. (a) PaCO2 less than 35 mmHg at presentation significantly increased from 32 (29.3–32.6) mmHg to 35.2 (31.7–36.5) mmHg, p < 0.001) after 6 h. However, hypocapnia in 25 (44.6%) of the patients did not resolve within 6 h. The change in the PaCO2 in the range of normocapnia was not significant over time (37.9 (36.7–40.3) mmHg at presentation versus 38.4 (35.6–41.2) mmHg 6 h later, p = 0.617). (b) PaCO2 within the range of hypocapnia significantly increased from 30.6 (27–33.1) mmHg to 32.7 (29.5–35.4) mmHg (p < 0.001). However, hypocapnia in 54 (72%) patients did not resolve within 6 h. The change in the PaCO2 within the range of normocapnia was not significant over time (37.7 (36.4–40.8) mmHg at presentation versus 36 (34.4–41) mmHg 6 h later, p = 0.159). PaCO2: partial pressure of arterial carbon dioxide; ACVE: adverse cardiovascular event.
With regard to the influential causative factors affecting PaCO2, PaCO2 at presentation was not correlated with parameters related to oxygenation or initial GCS (Table 2). There was no difference in PaCO2 at presentation according to DWI results (33.1 (30.3–36.9) mmHg in normal DWI versus 31.1 (28.6–34.7) mmHg in abnormal DWI, p = 0.411) or chest X-ray findings (32.9 (29.4–36.4) mmHg in normal chest X-ray versus 33.1 (29.9–36.7) mmHg in abnormal chest X-ray, p = 0.852). To determine whether hypocapnia at presentation is simply a secondary response to metabolic acidosis, the acid–base status of ABGA was evaluated. The most common acid–base imbalance in 131 patients with hypocapnia was respiratory alkalosis (58%; Figure 3).
The correlation between PaCO2 at presentation and presumptive influential causative factors.
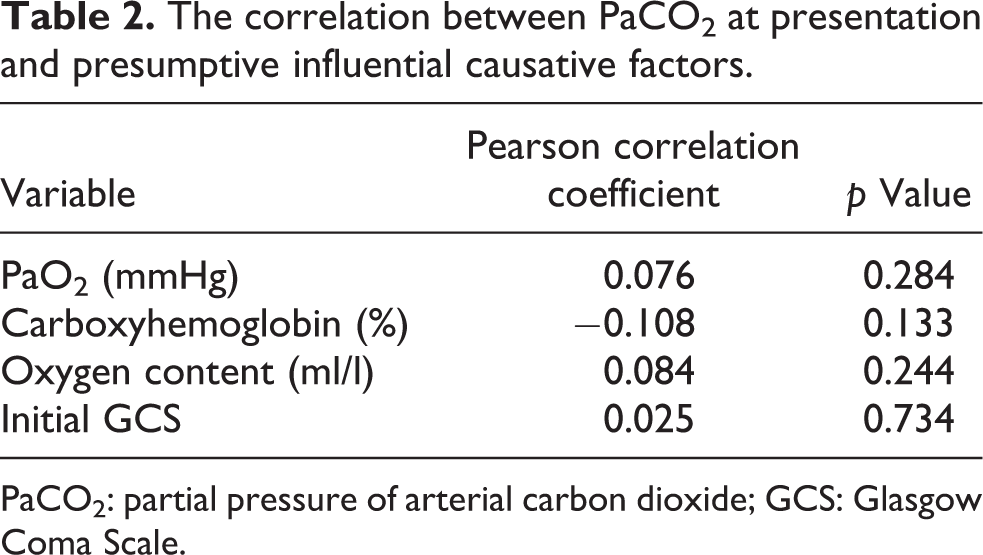
PaCO2: partial pressure of arterial carbon dioxide; GCS: Glasgow Coma Scale.

Acid–base status in 131 patients with hypocapnia at presentation.
Figure 4 displays the incidence of ACVEs across ranges of mean PaCO2 and PaCO2 at presentation stratified by 5 mmHg. There was a significant linear trend of incidence of ACVEs (χ2 for linear trend p value < 0.05). The optimal cutoff values for PaCO2 at presentation and the mean PaCO2 for the first 6 h were determined using ROC curve analysis and the Youden index to be 31.3 mmHg (with 53.6% of sensitivity and 74% of specificity) and 32.4 mmHg (with 56.8% of sensitivity and 75% of specificity), respectively.
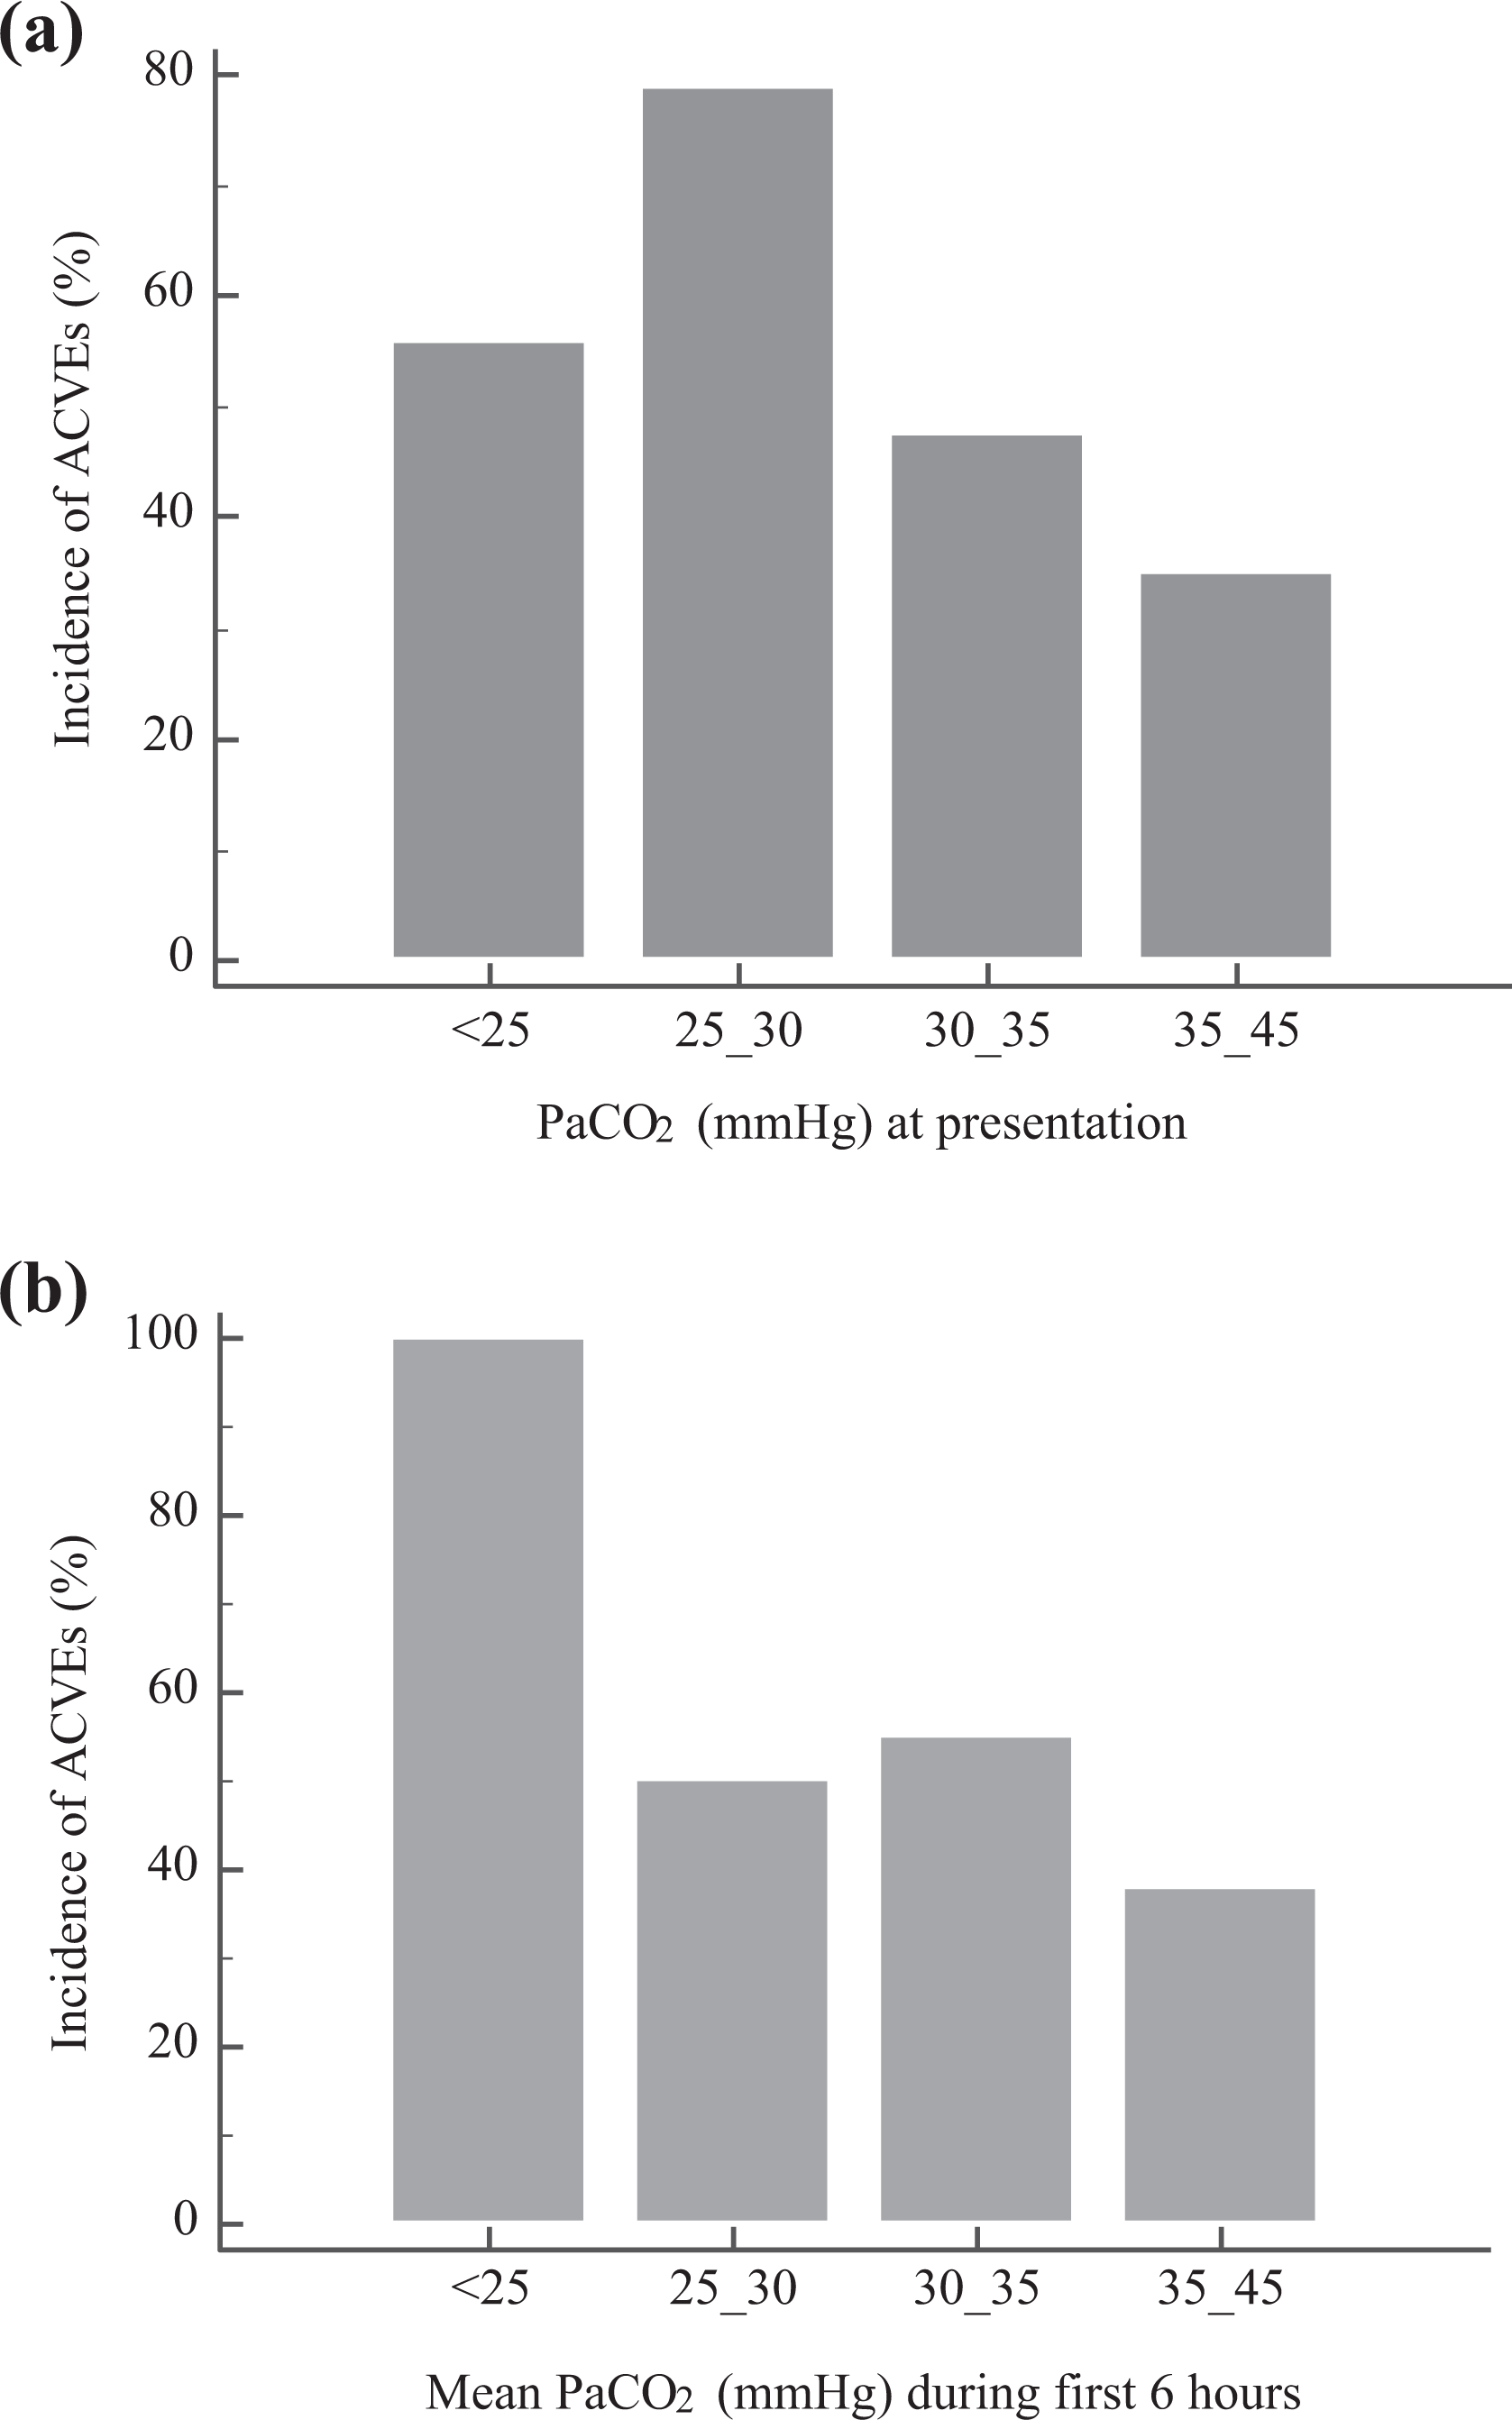
Incidence of ACVEs according to PaCO2 at presentation and mean PaCO2 during the first 6 h. (a). There was a significant linear trend of incidence (χ2 for linear trend, p = 0.001) across the range of PaCO2 at presentation. The incidences were 34.9% in the group with mean PaCO2 < 25 mmHg, 47.5% in the group with 25 mmHg ≤ PaCO2 <30 mmHg, 78.8% in the group with 30 mmHg ≤ PaCO2 < 35 mmHg, and 55.6% in the group with PaCO2 of 35–45 mmHg (Pearson’s χ2, p = 0.001). (b) Across the range of mean PaCO2 during the first 6 h, the incidence of ACVEs was 100% in the group with a mean PaCO2 < 25 mmHg, 50% in the group with 25 mmHg ≤ PaCO2 <30 mmHg, 55% in the group with 30 mmHg ≤ PaCO2 < 35 mmHg, and 39% in the group with PaCO2 of 35–45 mmHg (Pearson’s χ2, p = 0.032, χ2 for linear trend, p = 0.004). PaCO2: partial pressure of arterial carbon dioxide; ACVE: adverse cardiovascular event.
To investigate the association between the derangement of PaCO2 variables and ACVEs, multivariate regression analysis was performed (Table 3). A mean PaCO2 >32.4 mmHg adjusted for age; duration of CO exposure; the interval from last exposure to arrival at our ED; initial GCS; the levels of WBC, arterial HCO3 −, and Cr; detectable troponin I; and prolonged QTc interval was independently associated with ACVEs.
Multivariate regression analysis for the predictor of ACVEs after acute CO poisoning.

ACVE: adverse cardiovascular event; CO: carbon monoxide; OR: odds ratio; CI: confidence interval; Cr: creatinine; WBC: white blood cell; QTc: corrected QT; ED: emergency department; PaCO2: partial pressure of arterial carbon dioxide.
Discussion
We found that mean PaCO2 during the first 6 h after presentation was independently associated with ACVEs during hospitalization in self-breathing patients after acute CO poisoning. In addition, the hypocapnia at presentation was not uncommon, occurring in 67.5% of patients, and not simply a secondary response due to metabolic acid–base imbalance in acute CO poisoning. To our knowledge, this is the first study to show the impact of hypocapnia on clinical cardiovascular events in acute CO poisoning.
Similar to our findings, a previous study found that PaCO2 was significantly higher in patients who were admitted to the ward after CO poisoning than in patients who were admitted to the intensive care unit (ICU). In addition, among patients who needed ICU admission after CO poisoning, univariate analysis showed that PaCO2 was significantly higher in patients who survived than in those who did not survive. 17
In contrast to ours, Hajsadeghi et al. reported that initial PaCO2 did not differ according to the initial ECG abnormalities in CO poisoning. 18 However, nonischemic changes of ECG, such as sinus tachycardia and QT or PR interval prolongation, which do not match the definition of ACVEs in this study, were also regarded as ECG abnormalities in their study.
The association between hypocapnia and ACVEs may be explained by the fact that hypocapnia constricts the coronary vessels and can impair the unloading of oxygen by hemoglobin. Case et al. demonstrated that extreme hyperventilation (PaCO2 approximately 10 mm Hg) can cause severe coronary vasoconstriction with a decrease in coronary sinus PO2, which is associated with insufficient myocardial oxygenation and could lead to impaired cardiac function in anesthetized dogs. 19
This study merely showed an association between the mean PaCO2 and ACVEs and did not infer causation; therefore, the authors could not determine whether the control of PaCO2 improved the patient outcome. However, the linear trend between the range of the mean PaCO2 and the incidence of ACVEs observed in this study is consistent with the deleterious effect of hypocapnia on the cardiovascular system and might suggest causality. Furthermore, normocarbic hyperventilation did not alter arterial or pulmonary BPs, arterial pH, or cardiac output in mechanically ventilated CO-poisoned animals. 20 Because a previous study suggested that maintaining normocapnia may contribute to reducing adverse outcomes in CO poisoning and because avoidance of hypocapnia has already been accepted as a therapeutic target in other disease entities, we cautiously suggest that PaCO2 should be monitored in the acute state, and hypocapnia should be avoided, especially in the patient in whom myocardial oxygen supply is already compromised by coronary insufficiency or hypoxemia after acute CO poisoning. The high incidence rates of ACVEs (50.5%) and hypocapnia (67.5%), and the presence of persistent hypocapnia despite the administration of HBO therapy, which was the mainstay of the treatment of CO poisoning in this study, support our suggestion. Unfortunately, in self-breathing CO-poisoned patients, therapeutic options are limited. A self-inflated bag circuit to provide constant O2 flow and administer CO2 in direct proportion to increases in ventilation can be considered. 21 This device is inexpensive and may be safely applied to all victims.
In line with previous clinical data, the incidence of PaCO2 derangement in this study was 67.5%. 7 While significant clinical data exist regarding metabolic acidosis after CO poisoning (such as the association with mortality or the need for HBO therapy), 22,23 the effect of PaCO2 has not yet been studied in CO poisoning. Pleiotropic effects of CO on cellular mitochondrial respiration, inflammation, and free radical generation as well as decreased oxygen delivery have been suggested as the patho-mechanisms of cardiovascular dysfunction. 1 When placed in the context of the higher frequency of hypocapnia at presentation in ACVE group and continued hypocapnia after HBO therapy at 6 h, which may be the therapeutic window for myocardial injury after ED presentation with CO poisoning, 10 our findings suggest the need for studies concerning the contributing role of hypocapnia as a patho-mechanism of cardiovascular dysfunction beyond the prognostic impact on cardiovascular dysfunction.
Hypocapnia may be explained by hyperventilation due to hypoxia-induced COHb, pulmonary pathologic changes (such as edema or pneumonia), or compensatory responses to metabolic changes in CO poisoning. It is also possible that brain injury after CO poisoning directly induces hyperventilation, similar to the phenomenon of central neurogenic hyperventilation. Normally, there is extensive cortical inhibitory input into the brainstem respiratory centers. 24 Brain injury-induced CO poisoning may induce hyperventilation by disrupting this cortical inhibition. Respiratory alkalosis was more commonly observed than metabolic acidosis in the hypocapnia group. Similar to our study, a previous work found that alkalosis was more common in patients with COHb > 20% than acidosis (16.6% of alkalosis vs. 4.4% of acidosis), although the authors did not reveal respiratory or metabolic components. 25 These results suggested that hypocapnia is not mostly attributable to compensation for metabolic acidosis. In constant with ours, initial COHb was not correlated with PaCO2 after stratification by gender and age. 18 Along with COHb, the parameters related to oxygenation (oxygen content and PaO2) at presentation, the CNS (initial GCS and abnormal DWI), and the pulmonary system (abnormal initial chest X-ray) were not related to PaCO2 at presentation. Furthermore, after normalizing the COHb level and GCS, hypocapnia did not resolve after 6 h. It is likely that individual factors (underlying cardiopulmonary status, etc.) and poisoning factors (different concentrations of CO and ventilation system of exposure site) should be considered together as influential causative factors for the derangement of PaCO2.
Unlike our expectation, the hypercapnia developed in only one patient excluded in this study. The low incidence of hypercapnia may be explained by offsetting the CO2 retention later by the earlier decrease in PaCO2 after acute CO poisoning. In dogs exposed to CO, PaCO2 was 34 mmHg in the apnea state with 70% COHb. 8
This study had several limitations. First, as this investigation was an observational cohort study, we can only describe associations and cannot make causal inferences. However, the linear trend between the range of PaCO2 variables and the incidence of ACVEs observed in this study might suggest causality. However, this study can provide guidance for future studies, which should investigate the causality between PaCO2 derangement and the outcome and the therapeutic potential of PaCO2 monitoring and control in situations in which ACVE frequently develop despite HBO therapy after CO poisoning. Second, because of the retrospective study design, the exact duration of hypocapnia and detailed changes in PaCO2 during the first 6 h were not considered. Further prospective studies to overcome these limitations should be performed to validate our results. Third, clinical studies regarding CO poisoning exhibit heterogeneity in the different treatment protocols used, different sources of CO, and different severities of CO poisoning. Additionally, the definition of outcome may differ across studies. These factors impede the generalizability of this study. The results obtained in this study should thus be interpreted cautiously based on the various abovementioned factors.
Conclusion
The derangements in PaCO2 were common in self-breathing patients after acute CO poisoning and were simply not attributable to the secondary response of metabolic change. Mean PaCO2 during the first 6 h after CO poisoning is associated with ACVEs during hospitalization. Given the high incidence of ACVEs and PaCO2 derangement observed in CO-poisoned patients, and our observed association between PaCO2 and ACVEs within this study cautiously suggests that (1) PaCO2 should be monitored at acute stage to predict and/or prevent ACVEs and/or (2) further study is needed to determine the possibility of therapeutic measures of avoiding derangement of PaCO2.
Footnotes
Declaration of conflicting interests
The author(s) declared no potential conflicts of interest with respect to the research, authorship, and/or publication of this article.
Funding
The author(s) disclosed receipt of the following financial support for the research, authorship, and/or publication of this article: This study was financially supported by a grant (CR 18031-1) of Chonnam National University Hospital Biomedical Research Institute.