
Abstract
Tenofovir disoproxil fumarate (TDF) is currently the only nucleotide analogue reverse-transcriptase inhibitor that is approved by the Food and Drug administration (FDA), USA, for the treatment of human immunodeficiency virus (HIV) infection. In recent days, renal toxicity is becoming common i HIV patients treated with TDF. However, the mechanism of tenofovir nephrotoxicity is not clear. We hypothesized that mitochondrial pathway of apoptosis, poly [ADP-ribose] polymerase (PARP) overactivation and neutrophil infiltration may contribute to tenofovir-induced renal damage. Renal damage was induced in adult male Wistar rats by the oral administration of 600 mg/kg body weight daily for five consecutive weeks. Kidneys were removed and used for histological and biochemical analyses. Apoptosis was detected by terminal deoxynucleotidyl transferase biotin–deoxyuridine triphosphate nick end-labelling (TUNEL) assay and caspase 3 activity and protein expression; mitochondrial pathway of apoptosis by cyt c release; and PARP activation by immunofluorescence, immunohistochemistry and Western blot techniques. Myeloperoxidase (MPO) activity was measured as a marker of neutrophil infiltration. TDF administration resulted in increased number of TUNEL-positive cells, activation of caspase 3 and release of cyt c from mitochondria into the cytosol in the kidneys. There was increased nuclear localization of PARP as well as increase in its protein level in the TDF-treated rat kidneys. In addition, renal MPO activity was increased ninefold as compared to controls. The results of the present study show that mitochondrial apoptotic pathway, PARP overactivation and neutrophil infiltration contribute to tenofovir-induced renal damage in rats.
Introduction
Tenofovir disoproxil fumarate (TDF) is an oral prodrug of tenofovir, a reverse-transcriptase inhibitor of human immunodeficiency virus type 1 (HIV-1). It is currently the only nucleotide analogue reverse-transcriptase inhibitor (NRTI) that is approved by the Food and Drug administration (FDA), USA, for the treatment of HIV infection. 1 The 300-mg/day oral TDF regimen is preferred to other antiretrovirals such as adenofir and cidofir because of its convenience, efficacy, safety and tolerability. 2 However, in recent days, renal toxicity is becoming common in HIV patients treated with TDF. Numerous case reports and case series have described severe cases of renal tubular toxicity associated with TDF exposure. 3,4 It is estimated that renal tubular dysfunction develops in nearly 15% of patients treated with tenofovir for 2–9 years. 5 The main site of TDF toxicity is the proximal tubule, and in severe cases, patients can develop Fanconi syndrome (which is characterized by phosphaturia, glycosuria, bicarbonate wasting, tubular proteinuria and aminoaciduria) or acute kidney injury. 6 Several case reports, observational studies and animal models support the view that tenofovir is a proximal tubular toxin. Current evidence suggests that mitochondria are the subcellular target organelles of tenofovir. Several human and animal studies have shown damage to specifically renal proximal tubular mitochondria. 7,8 The mechanism of TDF nephrotoxicity is not completely understood.
Recently, we have demonstrated that chronic administration of TDF to rats results in increased reactive oxygen species (ROS) and reactive nitrogen species (RNS) production, depletion of cellular antioxidants and increased mitochondrial damage in the kidneys. 9 –11 However, to the best of our knowledge, the consequences of these processes have not been studied yet.
The excessive formation of reactive species cause lipid peroxidation of cell membranes, protein and enzyme oxidation, and some irreversible DNA changes, leading to cell death in the form of necrosis or apoptosis. 12 The ROS and RNS have been suggested to be important mediators of the mitochondria-mediated apoptosis, 13 activation of poly [ADP-ribose] polymerase (PARP) 14 and neutrophils. 15
Apoptosis is an energy-dependent controlled type of cell death, characterized by the stepwise activation of a set of proteolytic enzymes called caspases, which are cysteine proteases that cleave a critical set of cellular proteins to initiate the apoptotic signals. In mammalian cells, a major caspase activation pathway is the cytochrome c (cyt c)-initiated pathway. In this pathway, various apoptotic stimuli cause cyt c release from mitochondria to induce a series of biochemical reactions, resulting in activating caspase to cause subsequent cell death. 16
ROS play an important role in mediating apoptosis by inducing the activation of caspases. The activation of caspase 3 is the key and irreversible point in the development of apoptosis. The mitochondrial-dependent pathway is triggered by cyt c release from the mitochondria that promotes the activation of procaspase 9 through Apaf-1 and deoxyadenosine triphosphate. Activated caspase 9 then cleaves and activates the downstream pro-caspase 3. 17
PARP-1 is a nuclear zinc-finger DNA-binding protein with a molecular weight of 113 kDa that specifically detects DNA strand breaks or nicks produced by different genotoxic agents in mammalian cells. 18 While moderate PARP activity protects cellular genome integrity, excessive PARP activation can lead to cell death from adenosine triphosphate (ATP) depletion. 18 Oxidative and nitrative stress and/or peroxynitrite-induced DNA damage is a potent trigger of PARP-1 activation, which in turn also involved in the activation of various pro-inflammatory transcription factors including nuclear factor κB (NF-κB). 14
Myeloperoxidase (MPO) is an enzyme, mainly released by activated neutrophils (but also macrophages) that possesses the powerful pro-oxidative and pro-inflammatory properties. This enzyme activity is a measure of inflammatory cells infiltration. 19
The present study was designed to investigate, using the rat model of TDF nephrotoxicity, the effect of chronic TDF administration on the following: a. Apoptotic cell death
To determine the extent of apoptosis, two different techniques were used: (1) kidneys were investigated by terminal deoxynucleotidyl transferase biotin–deoxyuridine triphosphate (dUTP) nick end-labelling (TUNEL) histology to localize DNA fragmentation; (2) caspase 3 protein expression and activity were determined. b. Mitochondrial pathway of apoptosis
Cyt c release from mitochondria into the cytosol was determined. c. PARP activation and neutrophil infiltration
PARP activation was determined by immunohistochemistry (IHC), Western blot, and immunofluorescence, and neutrophil infiltration was assessed by the measurement of MPO activity
Materials and methods
Materials
TDF, 4-(2-hydroxyethyl) piperazine (2-ethanesulfonicacid) (HEPES), hydrogen peroxide, sucrose, bovine serum albumin (BSA), sodium dodecyl sulphate (SDS), mannitol and ethylene glycol-bis (β-aminoethyl ether)-N,N,N′,N′-tetraacetic acid (EGTA) were purchased from Sigma (St Louis, Missouri, USA). The primary mouse monoclonal caspase 3, cyt c, and PARP-1 antibodies and A/G Plus-agarose protein were obtained from Santa Cruz (Mumbai, Maharashtra, India). Secondary antibodies (anti-rabbit and anti-mouse immunoglobulin G conjugated with horseradish peroxidase (HRP)) were obtained from Pierce Biotechnology (Rockford, California, USA. Protease inhibitor cocktail was obtained from Sigma-Aldrich. Polyvinylidenedifluoride (PVDF) membrane (pore size 0.45 μm) was obtained from Millipore (Bengaluru, Karnataka, India). The Super Sensitive Polymer/HRP/DAB kit was obtained from BioGenex (Chennai, Tamil Nadu, India). ECL Dualvue Western blotting markers were purchased from Amersham (UK). West Dura chemiluminescent substrate for developing Western blots was purchased from Thermo Scientific (Waltham, California, USA. Transferase biotin-dUTP nick end-labelling (TUNEL) assay cell death kit was obtained from Roche Diagnostics (Germany). All other chemicals used were of analytical grade.
Animals and treatments
Adult male Wistar rats (180–225 g) were used for the studies. The animals were cared for in accordance with the Guide for the Care and Use of Laboratory Animals (1996, published by National Academy Press, 2101 Constitution Ave. NW, Washington, DC 20055, USA). The experiments done were approved by the Institutional Animal Ethics Committee (IAEC), Christian Medical College, Vellore, Tamil Nadu, India, and were in accordance with the guidelines of the Committee for the Purpose of Control and Supervision of Experimentation on Animals (CPCSEA), Government of India. They were housed in standard rat cages (421 × 290 × 190 mm3). All animals were exposed to 12-h light/12-h dark cycles and allowed access ad libitum to water and standard rat chow. Rat model of TDF nephrotoxicity that was standardized recently in our laboratory was used. 20
Standardization of rat model of TDF nephrotoxicity
A brief description of the standardization studies carried out, the results obtained, and the rationale for choosing the dose of TDF and the duration of treatment for the present study is as follows.
The daily dose of TDF in humans is 300 mg/60 kg. 2 Therefore, to remain clinically relevant, we administered TDF daily by gavage to adult male Wistar rats at doses that resembled human therapy on an mg/kg/day basis, that is, 5 mg/kg; 250 g rat = 1.25 mg/day) for 5 weeks. Based on a number of NRTI treatment protocols used by other workers, maximum treatment duration of 5 weeks was used in this study, as the duration of treatment for 5 weeks is suggested to model chronic human treatment. 21 No damage to the kidneys was evident both by light microscopy and by electron microscopy. Next, we tried 300 mg/kg body weight/day for 4 weeks as described by Biesecker et al. 22 Minimal renal proximal tubular epithelial karyomegaly was observed, but we could not find any mitochondrial abnormalities. Tenofovir has been shown to cause bone toxicity in animal models, when given at 6–12 times higher dose than recommended for humans. 23 Therefore, we next tried 600 mg/kg body weight/day (corresponds to 12× human dose) for 5 weeks. We administered 600 mg TDF/kg body weight/day in two divided doses by gavage for 5 weeks to adult male Wistar rats. TDF treatment for 5 weeks showed severe morphological abnormalities in proximal tubule mitochondria such as variations in size and shape (giant mitochondria), disruption of cristae, mitochondrial swelling, and presence of amorphous deposits in the mitochondrial matrix, Fanconi syndrome and proximal tubular damage as seen in human kidney biopsies from TDF-treated HIV patients. Therefore, we decided to use the model for our study.
Experimental design
The rats were randomly assigned to two groups and were treated as follows: Group I (control): The rats in this group (n = 6) received sterile water only by gavage for 35 days. Group II: The rats (n = 6) in this group received 600 mg/kg body weight TDF in sterile water as two divided doses by gavage for 35 days.
Animals were euthanized on the 36th day, after urine collection and withdrawal of blood by cardiac puncture, under light halothane anaesthesia.
Tissue procurement
Both kidneys were removed, washed with ice-cold phosphate-buffered saline (PBS) and used for light microscopy, IHC and biochemical analysis. One part of the kidney was snap-frozen using liquid nitrogen at −70°C until use.
Assessment of proximal tubular function
Urine samples were centrifuged in aliquots to remove suspended material, and the supernatants were used. Serum was used for the estimation of phosphate, potassium, uric acid, glucose, urea, and creatinine. Urine was used for the estimation of bicarbonate, phosphate, potassium, and uric acid by standard methods.
Morphological examination of the kidney (light microscopy)
Kidney tissue was fixed in 10% buffered formaldehyde and embedded in paraffin. After fixation of kidney tissues in 10% buffered formalin for 24 h at room temperature, the slices were embedded in paraffin and then sectioned. Four-micrometre thick paraffin sections were stained with haematoxylin and eosin for light microscopic examination using the conventional protocol. A minimum of eight fields for each kidney section were examined and assigned for severity of changes by an observer blinded to the treatments of the animals. Tubular injury was graded on a semi-quantitative scale as described by Ramesh and Reeves. 24 Tubular injury was defined as tubular epithelial necrosis, cast formation, tubular dilatation, and the loss of the brush border. Tubular injury was scored by grading the percentage of affected tubules under 10 randomly selected, nonoverlapping fields (magnification, 200×) as follows: 0, 0%; 1, <10%; 2, 11–25%; 3, 26–45%; 4, 46–75%; and 5, 76–100%. To score injured tubules, whole tubule numbers per field were considered as the standard under a magnification of 200×. The grading percentage was calculated in each field as follows

TUNEL assay for the detection of apoptosis
Transferase biotin-dUTP nick end-labelling assay was done by an in situ cell death kit conjugated with TMR red (Roche Diagnostics) according to the manufacturer’s instructions. TUNEL method identifies apoptotic cells in situ using terminal deoxynucleotidyl transferase (TdT) to transfer biotin-dUTP to the free 3′-OH of cleaved DNA. The biotin-labelled cleavage sites were then visualized by reaction with fluorescein-conjugated avidin (avidin-FITC).
The TUNEL assay was performed on paraffin
Immunohistochemistry
IHC was done as described by Cuzzocrea et al. 25 The kidney was fixed in 10% formalin, and 4-μm thick sections were obtained from paraffin-embedded tissues. After deparaffinization, the sections were permeabilized with 0.1% Triton X-100 in Tris-buffered saline for 15 min. Endogenous peroxidases were quenched by 3% hydrogen peroxide. After the buffer wash, the universal protein blocking agent was applied over the sections. Then, the respective primary antibody was applied over the sections and incubated overnight. The bound primary antibody was detected by the addition of secondary antibody conjugated with HRP polymer and 3,3′-diaminobenzidine substrate. Later, the slides were counterstained with Harris haematoxylin and mounted. Primary antibody dilution: caspase 3 (1: 250) and PARP-1 (1:100).
IHC scoring method
The whole section was scanned at low power to gauge the general level of intensity throughout. The strength of staining was based on colour and texture features. A strength score should be in the range of 0–3. 26 The average intensity, corresponding to the presence of negative, weak, intermediate and strong staining, was given a score from 0 to 3, respectively.
Immunofluorescence of PARP
Immunostaining for PARP was performed on paraffin-embedded kidney tissues. The slides were deparaffinized, rehydrated and thoroughly washed. Antigen retrieval was carried out using trypsin at 37°C for 20 min; 3% BSA was used for protein blocking. The section was rinsed twice in PBS-T (PBS containing 0.1% Tween-20) prior to incubation with primary antibody. The primary monoclonal PARP antibody (1:200) was used to incubate for 2 h at 4°C. The sections were rinsed three times in PBS-T, followed by a 45-min incubation at room temperature in the dark with Green Alexa Fluor 488-labelled anti-rabbit secondary antibody and then rinsed 4× for 5 min in PBS-T. Antibody was diluted in PBS containing 3% BSA. Nuclear counterstaining with 4′,6′-diamidino-2-phenylindole (DAPI) was performed after the removal of excess secondary antibody. Slides were mounted in 90% glycerol in PBS, cover slipped and stored in the dark at 4°C. Immunofluorescence images were obtained for linear range of detection to avoid signal saturation using a Leica confocal microscope (Bangalore, India).
Western blot procedure
Proteins separated by electrophoresis were electroblotted onto PVDF membranes at 90 V for 3 h. A commercially available protein molecular weight marker was also electrophoresed on the polyacrylamide gel and electroblotted onto the PVDF membrane along with the samples. The membranes were incubated with blocking buffer for 2 h at room temperature, followed by incubation with primary antibodies for 16 h at 4°C. The primary antibodies were used at the following dilutions: anti-caspase 3 (1:1000), anti-cyt c (1:1000) and anti-PARP (1:1000). The membrane was washed three times for 10 min each, using Tris-buffered saline (TBS) with 0.02% Tween-20 at pH 7.4. Incubation with antibodies against the primary antibody and beta-actin was followed by incubation with peroxidase-labelled antibodies (1:1000). A commercially available S protein-HRP 133 (1 in 2500) conjugate (required for visualization of the molecular weight markers) was also incubated along with secondary antibody. The secondary antibody and the S protein were tagged with a peroxidase that acted on a chemiluminescent substrate. The bands obtained were visualized using ECL West Dura substrate, and their intensity was quantitated using a chemiluminescent imaging system (FluorChem TM SP, Alpha Innotech, San Jose, California, USA). The membrane was then treated with stripping buffer for 30 min at 55°C to remove the primary and secondary antibodies. It was then washed thrice in ultrapure water for 10 min each time. Final washes were done twice with the wash buffer for 15 min each time. The membrane was then incubated with antibody against beta-actin (dilution of 1:5000) overnight at 4°C. The membrane was then washed three times for 10 min each and incubated in goat anti-mouse secondary antibody (dilution 1 in 5000 in blocking buffer). The bands were visualized and quantified.
Detection of cytochrome c release by Western blot
The fresh kidney tissue was homogenized using a mitochondrial isolation buffer (70 mM sucrose, 220 mM Mannitol, 1 mM EGTA and 5 mM Tris, pH 7.4). The homogenate was centrifuged at 4000 × g for 10 min at 4°C. The supernatant was collected and was then centrifuged at 12,000 × g for 20 min. The resultant supernatant was used as the cytosolic fraction, while the pellet obtained was used as the mitochondrial fraction. 27 Cytosolic and mitochondrial samples, corresponding to 100-μg protein each, were denatured and separated by SDS polyacrylamide gel electrophoresis (SDS-PAGE), using 10% gels and transferred to PVDF membrane. The membranes were blocked with 5% BSA in TBS and 0.1% Tween-20 for 2 h. Thereafter, the membranes were incubated with monoclonal antibodies to cyt c (1:1000 dilution) (Cell Signaling Technology, San Jose, California, USA). A detection system using a chemiluminescent substrate (Thermo Fisher Scientific Inc., Waltham, Massachusetts, USA) was used to visualize the protein bands. The bands were documented using an Alpha Ease FC gel documentation system (Alpha Innotech Corporation, California, USA.) and normalized to those for beta-actin, which was used as a loading control.
Caspase 3 activity and MPO activity determination
Preparation of kidney homogenate
The kidney tissue obtained was washed in ice-cold saline, decapsulated and minced into small pieces using a pair of sharp scissors and immediately homogenized (10% w/v) in the homogenization buffer containing 0.05 M HEPES and 125 mM potassium chloride pH 7.4 using a Potter–Elvehjem homogenizer at 5000 xg for 3 min (10–15 strokes). The homogenates were centrifuged at 7500 xg for 10 min. The supernatant was used for the measurement of caspase 3 activity and MPO activity.
Caspase 3 activity determination
The activity of caspase 3 was determined using a commercial kit (Abcam, Cambridge, UK) according to the manufacturer’s instruction. This assay is based on the detection of cleavage of substrate DEVED-AFC (AFC: 7-amino 4-trifluoromethyl coumarin). DEVD-AFC emits blue light (λmax = 400 nm); upon cleavage of the substrate by CPP32 or related caspases, free AFC emits a yellow–green fluorescence (λmax = 505 nm), which can be quantified using a fluorescence microplate reader.
MPO activity determination
To quantify the extent of renal neutrophil accumulation, renal MPO content was determined. MPO activity was measured with O-dianisidine-H2O2 assay. The rate of decomposition of H2O2 by MPO was determined by measuring the rate of colour development at 460 nm. 28 Protein was estimated in the supernatants using BSA as a standard. 29
Statistical analysis
Data were analysed using the Statistical Package for the Social Sciences (SPSS) software package, version 16. All parameters were studied in a minimum of six animals for statistical validity. The data represent the mean value ± standard deviation and analysed by Mann–Whitney test. A value of p < 0.05 was taken to indicate statistical significance.
Results
TDF administration resulted in moderate–to-severe damage to the tubules
The results of light microscopic studies is shown in Figure 1.The kidneys of control rats showed normal morphology. In the cortex, normal glomerular and tubular components were seen and in the medulla normal renal tubular elements were seen (Figure 1(a) and (b)). TDF-induced renal damage involved mainly the renal tubules. The proximal convoluted tubules were dilated, distorted and their lining epithelium was destroyed. Some glomeruli were shrunken and were atrophied (Figure 1(c)). Necrosis of cortex involving tubules was also observed (Figure 1(d)). In the medulla, there was destruction of the lining epithelium of the loop of Henle (HL) and the collecting duct. Oedema of tubules, epithelial vacuolization, diffuse epithelial cell shrinkage, epithelial desquamation and mild necrotic changes were also observed (Figure 1(e)). Histological scoring of light microscopy in the kidney of control and TDF-treated rats are as follows: control cortex and medulla,0; TDF cortex,4+; TDF medulla 3+.

(a and b) Representative light micrographs of the kidney of control rat. (a) cortex and (b) medulla, showing normal architecture, (H & E) magnification ×100. (c to e) Representative light micrographs of the kidney of the TDF-treated rat. (c) Cortex showing distorted proximal convoluted tubules and destruction of their lining epithelium (green arrow), destruction of the epithelial cells of distal convoluted tubules (blue arrow), dilation of proximal convoluted tubules (red arrow) and shrunken glomeruli (black arrow). (d) Cortex showing necrosis of proximal convoluted tubule (blue arrow) and neutrophil infiltration (yellow arrow). (e) Medulla showing destruction of the lining epithelium of the loops of Henle (black arrow) and the collecting duct (red arrow), (H & E) magnification ×100. H & E: haematoxylin and eosin; TDF: tenofovir disoproxil fumarate.
TDF administration resulted in proximal tubular dysfunction
Proximal tubular function was impaired in TDF-treated rats, as evidenced by increased urinary phosphate, potassium and bicarbonate excretion and a considerable reduction in serum phosphate and potassium (Table 1).
Effect of TDF treatment on proximal tubular function tests.a

TDF: tenofovir disoproxil fumarate.
a Values are represented as mean ± SD, number of rats (n = 6) in control and TDF.
bp < 0.05 versus control.
cp < 0.01 versus control.
TUNEL assay revealed increased number of apoptotic nuclei in the kidneys of TDF-treated rats
Kidneys of control rats showed few apoptotic cells in both glomeruli and tubuli. Kidneys from the rats with TDF treatment showed an increase in the number of TUNEL-positive nuclei in both tubular cells and glomerular cells, indicating extensive apoptosis in both cell types (Figure 2).

Representative images of TUNEL staining in control and TDF-treated rat kidneys. Apoptosis was evaluated by TUNEL staining. Nuclei were counter-stained with PI. Thus, red indicates PI-stained nuclei, TUNEL-positive nuclei stain green and when red and green nuclei overlap they appear yellow. Arrows indicate TUNEL-positive cells. Scale bars = 60 μm. (a and c) TUNEL staining in control cortex (a) and medulla (c) showing very few TUNEL-positive cells. (b and d) TUNEL staining in TDF cortex (a) and medulla (c) showing many TUNEL-positive cells both in the tubules and glomeruli. White arrow indicates TUNEL-positive cells. PI: propidium iodide; TUNEL: terminal deoxynucleotidyl transferase biotin–deoxyuridine triphosphate nick end-labelling; TDF: tenofovir disoproxil fumarate.
TDF treatment resulted in increased immunostaining for caspase 3, increased caspase-3 protein expression by Western blot and increased caspase-3 activity in the kidneys
No detectable caspase 3 immunostaining was observed in both cortical and medullar structures of kidney taken from the control rats (Figure 3). In the renal cortex of TDF-treated animals, diffuse and strong caspase 3 staining was seen in the proximal and distal tubules. The staining was mainly distributed in the basal part of the tubular cells where numerous mitochondria are distributed. The HL and vasa recta in outer medulla from TDF-treated rat showed marked increase in the expression of caspase 3. IHC scores: control cortex and medulla, 0; TDF cortex and medulla, 2+.
Representative immunohistomicrographs of caspase 3 in the kidneys of control rats and TDF-treated rats. Scale bars = 20μm. (a and b) Control rats showing negligible staining for caspase 3 in the cortex and medulla. (c and d) TDF-treated rats show intense staining for caspase 3 in all the regions of cortex and medulla. In the cortex, the glomeruli and tubule cells showed moderate to intense staining. In the medulla, the CT and HL show increased intensity of the stain. CT: collecting tubules; HL: loop of Henle; TDF: tenofovir disoproxil fumarate; PCT: proximal convoluted tubule; DCT: distal convoluted tubule.
Western blot analysis revealed a significant increase in caspase 3 protein levels in the kidneys of TDF-treated rats as compared to control (Figure 4).The activity of caspase 3 was increased significantly in response to TDF treatment (Figure 5).

(a) Representative Western blots for caspase 3 protein levels (30 kDa) bands in the control and TDF-treated rats, (n = 5 in each group), as assessed using a 10% polyacrylamide gel, loading 100-μg protein per lane. β-actin was used as the loading control. (b) Relative concentration of caspase 3 in renal homogenates as analysed by densitometric quantification of bands of Western blots in control and TDF-treated rats (n = 5 in each group), obtained by image analysis of Western blots with the concentration of the controls set at one. Data represent mean ± SD; *p < 0.01: compared with the corresponding control values. TDF: tenofovir disoproxil fumarate.

Caspase 3 activity in the kidneys of control rats and TDF-treated rats, (n = 6) in each group. Data represent mean ± SD; * p < 0.05: compared with control values. TDF: tenofovir disoproxil fumarate.
TDF administration resulted in cytosolic release of cyt c from the mitochondria to cytosol
Immunoblot analysis of cyt c showed a significant decrease in the mitochondrial fractions and an increase in the cytosolic fraction (though not statistically significant) in the TDF-treated rat kidneys, suggesting the release of cytochrome ‘c’ from mitochondria to the cytosol (Figure 6).

(a) Upper panel: This is a representative blot of cytochrome c with (15 kDa) bands in mitochondrial fraction of control and TDF-treated rats (n = 5 in each group), as assessed using a 10% polyacrylamide gel, loading 100-μg protein per lane. β-actin was used as the loading control. Lower panel: Relative concentration of cytochrome c in mitochondrial fractions of renal homogenates as analysed by densitometric quantification of bands of Western blots in control and TDF-treated rats (n = 5 in each group), obtained by image analysis of Western blots with the concentration of the controls set at one. Data represent mean ± SD. *p < 0.05: compared with control. (b) Upper panel: This is a representative blot of cytochrome c with (15 kDa) bands in cytosolic fraction of control and TDF-treated rats (n = 5 in each group), as assessed using a 10% polyacrylamide gel, loading 100-μg protein per lane. β-actin was used as the loading control. Lower panel: Relative concentration of cytochrome c in cytosolic fractions of renal homogenates as analysed by densitometric quantification of bands of Western blots in control and TDF-treated rats (n = 5 in each group), obtained by image analysis of Western blots with the concentration of the controls set at one. Data represent mean ± SD.
TDF treatment resulted in increased nuclear translocation of PARP and increased protein expression
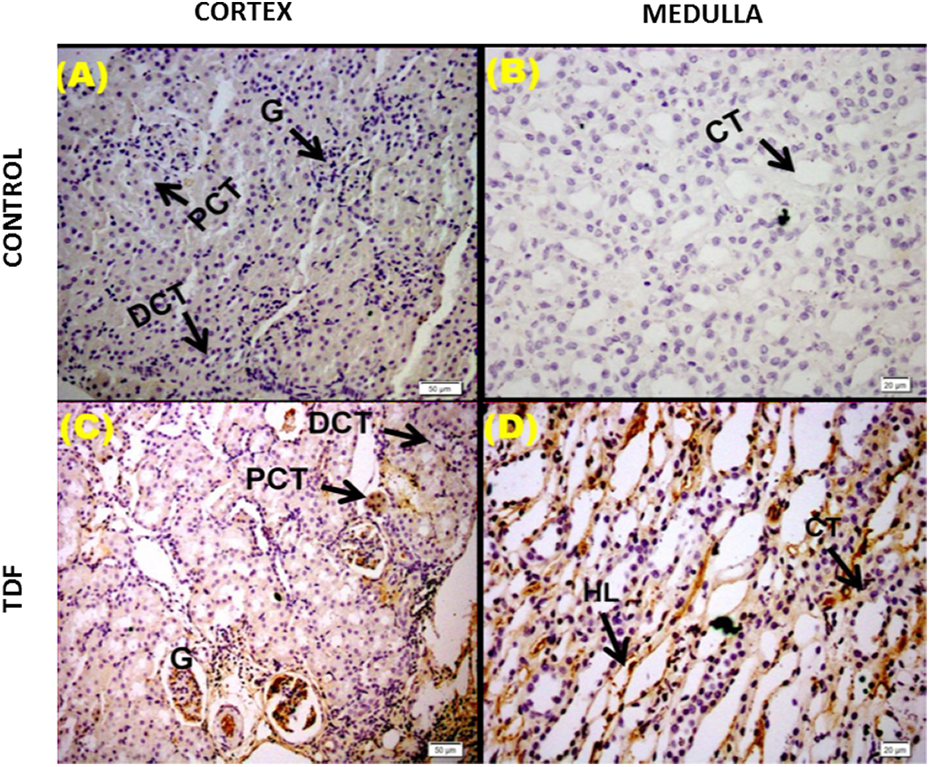
Glomerulus and tubules of the control rat kidneys showed mild staining for PARP. In TDF-treated rat kidney cortex, the glomerulus and convoluted tubules stained intensely for PARP. In the medulla, the collecting tubules and HL also stained intensely for PARP (Figure 7). IHC scores: control cortex and medulla, 1+; TDF cortex and medulla, 3+. Immunofluorescence for PARP-1 expression in the glomeruli and tubules of control rats showed basal nuclear localization. The glomeruli and tubules of TDF-treated rats showed moderate increase in the number of PARP nuclei-positive cells (Figure 8). Western blot analysis of nuclear PARP protein level revealed nearly sevenfold increase in TDF-treated rats as compared to the control (Figure 9).

Representative immunohistomicrographs of PARP expression in the kidneys of control rats and TDF-treated rats (scale bars = 20 μm). (a and b) Uniform mild PARP staining in the cortex and medulla of control rats. (c and d) TDF-treated rats show very intense staining for PARP in all the elements of the cortex as well as medulla. PARP: poly [ADP-ribose] polymerase; TDF: tenofovir disoproxil fumarate; G: glomerulus; HL: loop of Henle; CoT: collecting tubules; PCT: proximal convoluted tubule; DCT: distal convoluted tubule.

Representative PARP immunofluorescence images of cortex of control rats (a) and TDF-treated rats (b). Nuclei were counter stained with DAPI. Blue indicates DAPI-stained nuclei, green indicates FITC. Representative immunofluorescence images of medulla of control rats (c) and TDF-treated rat (d). There was more nuclear localization of PARP in the TDF-treated rat cortex and medulla as compared to control. PARP: poly [ADP-ribose] polymerase; TDF: tenofovir disoproxil fumarate; DAPI: 4′,6′-diamidino-2-phenylindole.

(a) Representative immunoblots of nuclear PARP protein expression in the renal homogenates of control rats and TDF-treated rats (n = 5 in each group), as assessed using a 8-% polyacrylamide gel, loading 100-μg protein per lane. β-actin was used as the loading control. (b) Relative concentration of nuclear PARP in renal homogenates as analysed by densitometric quantification of bands of Western blots in control and TDF-treated rats (n = 5 in each group). Data represent mean ± SD, obtained by image analysis of Western blots with the concentration of the controls set at one. *p < 0.05: compared with corresponding control values. PARP: poly [ADP-ribose] polymerase; TDF: tenofovir disoproxil fumarate.
TDF treatment resulted in massive increase in MPO activity in the kidneys
A ninefold increase in MPO activity, a marker of neutrophil infiltration was observed in the kidneys of TDF-treated rats as compared to the control (Figure 10).
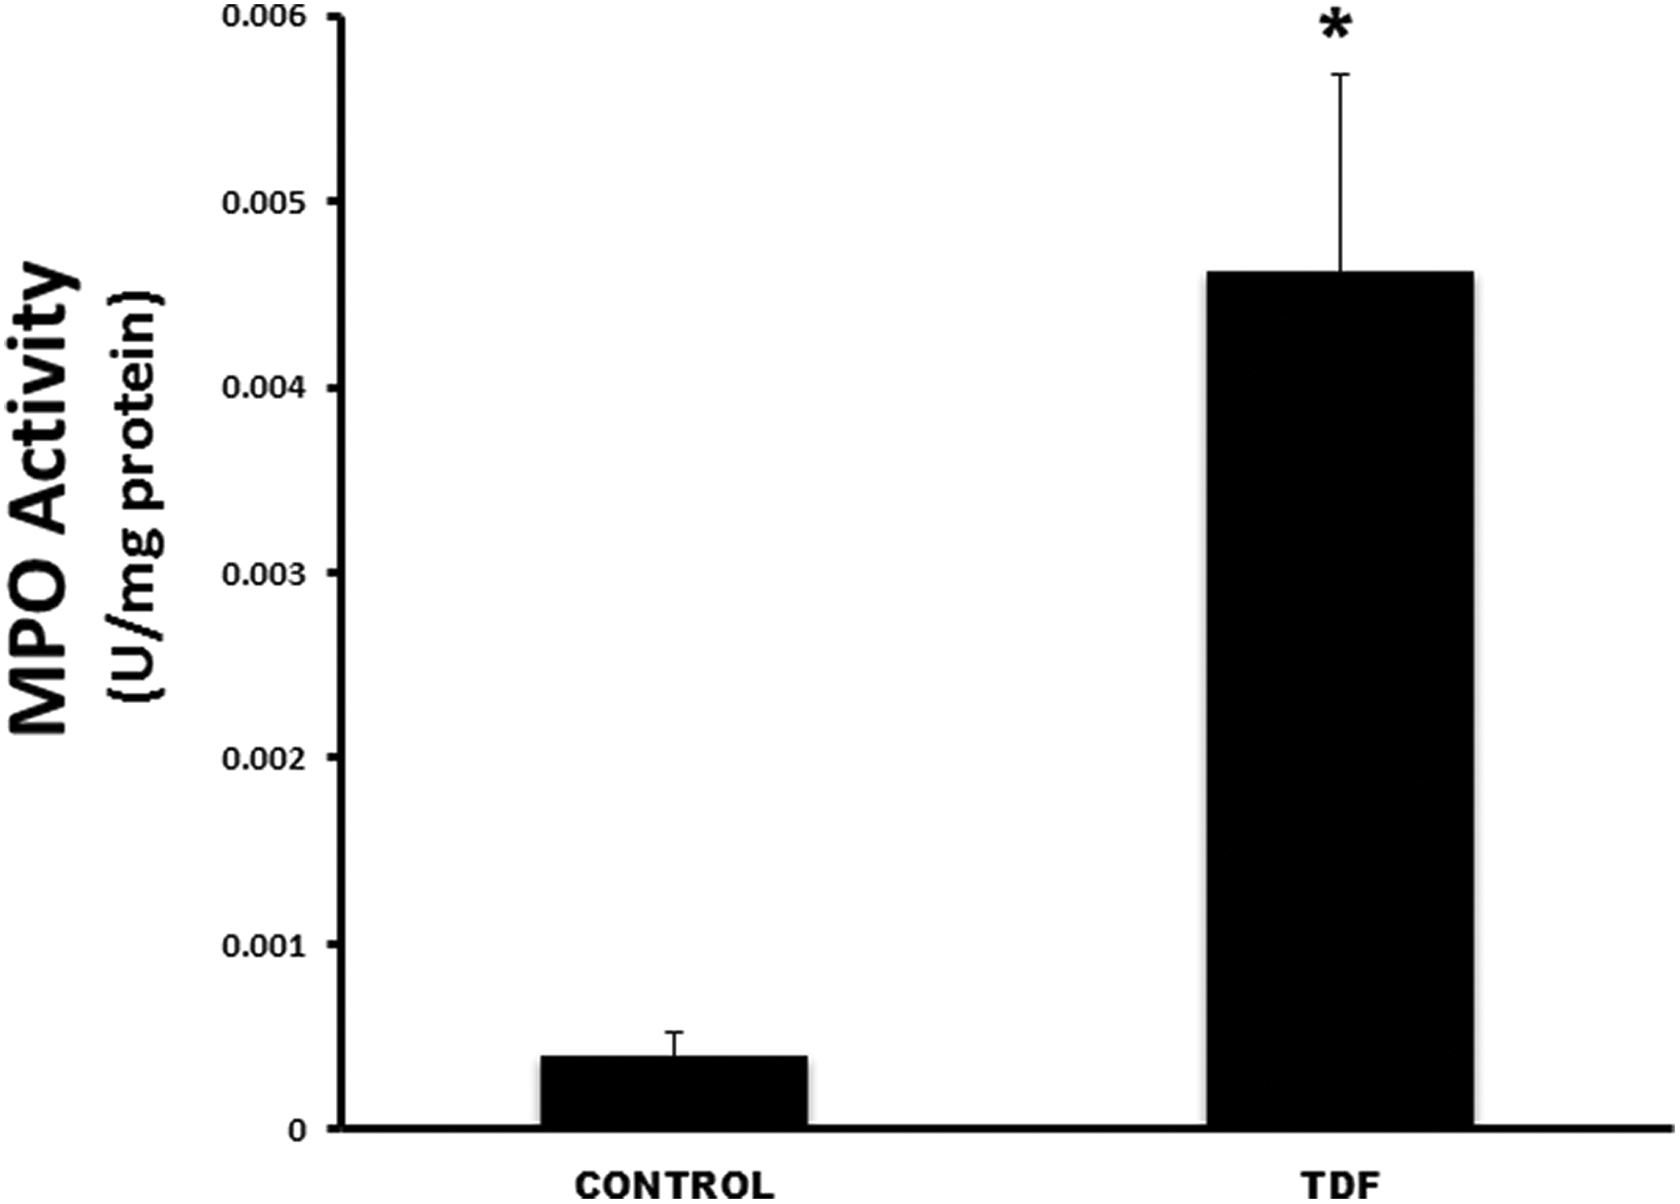
Effect of TDF on MPO activity in the kidneys of control rats and TDF-treated rats. Data represent mean ± SD, n = 6 animals in each group. *p < 0.001: compared with controls. MPO: myeloperoxidase; TDF: tenofovir disoproxil fumarate.
Discussion
TDF is an oral prodrug of tenofovir, a reverse transcriptase inhibitor of HIV-1. It is currently the only NRTI that is approved by the FDA, USA, for the treatment of HIV infection. 1 However, TDF has serious side effects, especially with long-term use. In recent days, renal toxicity is becoming common in HIV patients treated with TDF. Numerous case reports and case series have described severe cases of renal tubular toxicity associated with TDF exposure, and TDF is toxic to the renal proximal tubules. 3 –5 The mechanism of TDF nephrotoxicity is not well studied, although damage to proximal tubular mitochondria is believed to contribute to TDF nephrotoxicity. In our recent studies, we have demonstrated that chronic TDF administration results in ROS and RNS overproduction, depletion of cellular antioxidants and mitochondrial damage in the kidneys. 9 –11 However, the consequences of these events is not known.
ROS and RNS generation are often responsible for the mitochondria-mediated signalling pathway of apoptosis. 13,16 To determine the extent of apoptosis induced by TDF in the rat kidneys, two different techniques were used: (1) kidneys were investigated by TUNEL histology to localize DNA fragmentation after TDF treatment and (2) caspase 3 activity and protein expression were measured in homogenates of kidneys obtained after TDF treatment. Marked increase in TUNEL-positive cell and significant increase in caspase 3 protein and activity was observed in the TDF-treated rat kidneys, suggesting increased apoptosis in the TDF-treated rat kidneys.
We next investigated the role of mitochondrial pathway of apoptosis in TDF-induced renal damage. For this, we analysed the release of cyt c protein from the mitochondria into the cytosol by Western blot. Decreased mitochondrial cyt c protein and increased cytosolic cyt c were observed in the TDF-treated rat kidneys as compared to the control. Studies have shown that release of mitochondrial cyt c into the cytosol alters mitochondrial structure and function that may lead to cell death. 16 The loss of mitochondrial cyt c contributes to the decreased consumption of oxygen rate by cyt c oxidase in the mitochondria. The decline in mitochondria cyt c can result in a global decrease in oxidative phosphorylation capacity as well as substrates require electron flux through cyt c and cytochrome oxidase. It is noteworthy to mention that in our earlier study we observed a significant decrease in cyt c oxidase activity in the kidneys of TDF-treated rats. 11 In the kidneys, TDF induced both cyt c release and increased caspase 3 protein expression and activity, which suggests that mitochondria and caspase-mediated apoptosis pathways play a role in TDF-induced renal toxicity.
Our findings are supported by a recent report by Murphy et al. 30 These authors have investigated the cellular mechanism of TDF cytotoxicity using a human renal proximal tubular epithelial cell line (HK-2).They have demonstrated that incubation of HK-2 cells with different concentrations of TDF resulted in decreased cell viability, increased oxidative stress biomarkers–protein carbonylation and 4-hydroxynonenol, mitochondrial dysfunction and increased expression of cleaved caspases 3 and 9. These authors have suggested that TDF induces apoptosis in HK-2 cells and that mitochondrial dysfunction may be a major contributing factor to loss of cell viability.
It is noteworthy to mention that nephrotoxins such as cisplatin, gentamicin and cadmium that cause proximal tubular damage do so by activating the mitochondrial pathway of apoptosis. 31 –33
It is believed that TDF targets only the tubules. However, in our study, we were able to observe glomerular damage (shrunken glomeruli and glomerular atrophy) in TDF-treated rat kidneys. Our findings are supported by two other studies. Patel et al. have reported that renal biopsy from a HIV patient showed glomerular damage as evidenced by sclerosed glomeruli, mild mesangial proliferation, increased mesangial matrix and thickened capillary loops. 34 Umoh et al. have shown that TDF treatment in rats results in glomerular congestion and glomerular atrophy. 35
Multiple observational cohorts have demonstrated the association of TDF use with a decline in estimated glomerular filtration rate (eGFR) and development of chronic kidney disease (CKD). 36 –39 Scherzer et al. in a large cohort study demonstrated that each year of TDF exposure was associated with a 33% increased risk CKD. 39 The potential of TDF to cause glomerular dysfunction reflected by increased serum creatinine is well described in the literature. 40,41 Declining eGFR (increasing serum creatinine) is reported to occur slowly over time prior to the diagnosis of toxicity and thus may not have been clinically recognized due to the very gradual absolute increase in serum creatinine over years. These findings demonstrate that TDF causes not only tubular dysfunction but also glomerular dysfunction.
Oxidative and nitrative stress and/or peroxynitrite-induced DNA damage is a potent trigger of PARP-1 activation, which in turn is also involved in the activation of various pro-inflammatory transcription factors such as NF-κB and thus in the regulation of consequent inflammatory response (e.g. expression of adhesion molecules, leucocyte infiltration, etc.). 14 Therefore, we next assessed the effect of TDF treatment on PARP activation by IHC, Western blot and immunofluorescence (IF). IF revealed increased nuclear translocalization of PARP in the convoluted tubules and glomeruli of the TDF-treated rat kidneys as compared to control. In addition, there was increased PARP protein expression as revealed by IHC and Western blot. These findings suggest PARP overactivation in the kidneys of rats upon TDF treatment. Oxidative stress leads to necrosis via PARP-1–dependent pathway. PARP-1 is a mediator of regulated necrosis and is activated in response to moderate DNA damage and facilitates repair. Extensive DNA damage, however, leads to overactivation of PARP-1. The excessive activation of PARP-1 causes NAD+ depletion. Subsequent ATP depletion results in irreversible bioenergetic failure and necrosis. Inhibition of PARP-1 activity reduces secretion of pro-inflammatory cytokines as well as neutrophil migration to the inflammatory sites. PARP-1 can be a switch between apoptotic and necrotic cell death and depending on the degree of oxidant-induced DNA injury and various other factors it may promote both of these forms of cell demise. 42 PARP overactivation is implicated in cisplatin and gentamicin-induced renal tubular cell death and renal damage. 43,44
Neutrophils are the first leucocytes to arrive within the injured cell. Neutrophils, recruited into the tissue, can contribute to tissue destruction by the production of reactive oxygen metabolites, granule enzymes (MPO) and cytokines that further amplify the inflammatory response. MPO has the ability to amplify oxidative stress, using hydrogen peroxide to produce ROS with a higher oxidative capacity thus increasing and propagating the damage. MPO plays a fundamental role in oxidant production by neutrophils and has been used as an effective quantitative index of inflammation due to correlation between MPO activities and histological analysis of neutrophil infiltration. 19 In the present study, a massive increase (ninefold) in MPO activity was observed after TDF treatment of rats, indicating neutrophil accumulation. However, light microscopic examination of renal tissues showed only few neutrophils. This discrepancy may be explained based on the fact that light microscopy is not a sensitive technique to detect neutrophils accumulation in the tissues. 45 High-resolution imaging such as quantitative flow cytometry-based and in vivo labelling techniques are required to effectively detect neutrophils. 45
Inflammatory infiltrate is associated with or precedes tubular atrophy. Renal tubular toxic drugs cisplatin and gentamicin have been shown to increase MPO activity in the kidneys of rats. 46,47 Inflammation may further amplify oxidative/nitrative stress, and these interrelated processes eventually culminate in more concerted renal tubular and endothelial cell demise (both apoptotic and necrotic), secondary hypoxia, kidney dysfunction and failure. 48 Thus, persistent tubular injury and neutrophil infiltration induced by TDF may lead to interstitial fibrosis and renal failure.
Currently, we are investigating the protective effect of melatonin in TDF nephrotoxicity. We chose melatonin for our study due to the following reasons. Melatonin is a lipophilic molecule with multiple pleiotropic effects. It can cross cell membranes easily 49 and its cellular protective mechanisms include (i) scavenging of free radicals including hydrogen peroxide, hydroxyl radical, nitric oxide, peroxynitrite anion, hypochlorous acid, superoxide anion and peroxyl radical 50,51 ; (ii) increasing antioxidant enzymes 52,53 ; (iii) improving mitochondrial function 54,55 ; (iv) inhibiting apoptosis 56,57 and (iv) inhibiting MPO activity. 58
The results of the present study show that activation of mitochondrial apoptotic pathway, PARP overactivation and neutrophil infiltration contribute to TDF-induced renal damage in rats.
Footnotes
Authors’ note
Hemalatha Ramamoorthy worked as a senior research fellow on the project [CSIR grant Ref No: 27(0186)/28/ EMR II)].
Declaration of Conflicting Interests
The author(s) declared no potential conflicts of interest with respect to the research, authorship, and/or publication of this article.
Funding
The author(s) disclosed receipt of the following financial support for the research, authorship, and/or publication of this article: The research proposal was funded by Council for Scientific and Industrial Research (CSIR), New Delhi. CSIR grant Ref No: 27(0186)/28/ EMR II).